Abstract
Mineral malnutrition negatively impacts almost 30% of the world population and could result in anemia, blindness, and stunted growth. Seed traits involve nutritional, physical, and physiological characteristics that play a key role in achieving seed quality. Chickpea (Cicer arietinum), the second most important food legume crop worldwide, is characterized by its rich nutrient profile, fiber, and antioxidant content. However, seed quality traits composition and daily nutritional value in chickpea seeds remain largely unknown. The objectives of the current study were to determine the variability in concentrations of macro and micronutrients, oil, protein, their correlations, and daily nutritional values (% DV) in the seeds of 61 chickpea genotypes. The results demonstrate substantial variation among chickpea genotypes in most nutrients, protein, and oil content. Moreover, this study identifies 12 promising chickpea genotypes that indicate large nutrient content and potential usage in chickpea biofortification and breeding programs. Our results further show that consumption of 100 g chickpea seeds could provide 122% DV of manganese (Mn), 77% DV of copper (Cu), 43% DV of magnesium (Mg), 32% DV of phosphorus (P), 27% DV of zinc (Zn), 26% DV of iron (Fe), and 5% DV of calcium (Ca). Overall, these findings improve our understanding of chickpea seed nutrient content as well as global food security by combatting mineral malnutrition.
1. Introduction
After cereals, legumes, such as common beans, chickpeas, soybeans, peas, and lentils, are considered the most valuable food crops for the human diet. Chickpea (Cicer arietinum) most likely originated in Southern Türkiye, Northern Iraq, and Northern Syria, with domestication occurring about 9500 years ago [1]. Afterward, chickpea cultivation spread worldwide as a staple food crop in many diverse soil and climate conditions [1]. Then, chickpea crops were spread by the Romans to the European and African continents. Subsequently, chickpea cultivation was spread to North America, South America, India, Australia, and New Zealand as an important food source for centuries [2]. Chickpea is the second most important food legume globally, with a USD 15 billion economic impact [1]. Of the 18 million metric tons (MT) of global production, India (73%), Australia (6%), and Turkey (5%) are the largest producers [3]. While Mediterranean countries grow Kabuli type chickpeas (large seed size with smooth white seed coat color), India mainly grows Desi type chickpeas (small seed size with darker seed coat color). Moreover, chickpea seeds are known for being an excellent source of protein, micronutrients, carbohydrates, fiber, fat, vitamins, and antioxidants [3]. Due to their rich protein content, chickpeas also play an important role in plant-based diets, including whole-food, vegetarian, and vegan diets [4]. For instance, Sandhu et al. (2023) have reviewed the ways of producing nutrient dense chickpeas and reported the protein content range to be between 18 and 26% [5]. Another study with Ethiopian chickpea genotypes also reported protein content range between 14 and 23% [6]. Serrano et al. (2017) surveyed 79 European chickpea accessions and reported protein concentrations between 15 and 23% [7]. It is further reported that chickpea production could be enhanced by rhizobia inoculation with growth media for sustainable agriculture [8].
Biofortification, a technique to improve seed nutrient content, could be achieved using agronomic, selective breeding, or genetic engineering [9]. The major goal of biofortification efforts is to address micronutrient malnutrition (also known as hidden hunger) of zinc (Zn), iron (Fe), and vitamin A [9]. For example, plant biologists have developed vitamin-A-enriched sweet potatoes, Zn-enriched wheat, Fe-enriched common beans, beta-carotene-enriched rice, and vitamin-E-enriched maize [9]. Moreover, the selective breeding biofortification process could use identification and selection of naturally occurring food crop genotypes with superior levels of macronutrients or micronutrients [10]. As a result, this environmentally friendly and sustainable approach has been successfully shown in a number of food crop species for the selection of high Zn, Fe, and other essential nutrients [11].
Seed ionomics explores the elemental compositions of seeds and plays an important role due to their potential deficiencies, as well as an important role in fortification projects to enhance seed nutrient levels. Previous studies have shown elemental variations in faba bean seeds [12], Arabidopsis seeds [13], millet seeds [14], and soybean seeds [15,16], among others. However, few studies have reported on chickpea seed quality traits in the literature. As an example, Traore et al. (2022) surveyed 282 chickpea lines and showed their elemental concentrations of Fe, Zn, manganese (Mn), copper (Cu), phosphorus (P), and magnesium (Mg) [17].
The rising carbon dioxide (CO2) levels in the atmosphere, currently at the highest levels of the past 1 million years, are expected to impact not only climate stress, but also seed mineral nutrient content [16]. While an insignificant decrease in nutrients is found in legume species (common beans, soybeans, and lentils), a significant decrease is found in the protein and micronutrient content of rice and wheat [18,19]. Moreover, high CO2-induced reductions in nutrient value would also affect global food security, especially when combined with other environmental stress conditions. The United Nations Sustainable Development Goals (SDGs) focus on 17 SDGs for building a sustainable future for people and the planet by the year 2030 [20]. Food crop seeds play a critical role in improving food security, therefore supporting SDG2 (zero hunger), SDG3 (good health and wellbeing), and SDG13 (climate action), as well as biodiversity [20]. As a result, crop seeds not only contribute to SDGs, but also to the promotion of global food security.
One of the key areas in biofortification efforts is the human nutritional value of food crops. The percent daily values (% DV) for each nutrient are based on the recommended daily percentage on a standard adult’s 2000-calorie diet. Moreover, crop seeds could provide a significant % DV for various macronutrient and micronutrient content per serving [12]. For example, a number of crop seeds are recognized for their high % DV content, including sunflower seeds (vitamin E) [21], soybean seeds (Fe and Cu) [17], pea seeds (Cu and Mn) [22], flax seeds (Mg) [14], pumpkin seeds (Zn) [23], and chia seeds (omega-3 fatty acids) [24].
Previous studies on other food crops have reported on the United States Food and Drug Administration (FDA)’s guidance for recommended daily nutritional values in common beans, peas, and chia seeds [13,22,24,25]. There is a continuous need to fill in the research gap regarding the seeds of chickpea genotypes, particularly regarding their quality characteristics. Hence, the specific aims of this study are as follows:
- (1)
- Determine the variability in essential nutrient concentrations within 61 chickpea genotypes;
- (2)
- Analyze the percent daily value (% DV) of nutrients and their interrelationships;
- (3)
- Identify promising superior chickpea genotypes for future food security and chickpea development breeding efforts.
2. Materials and Methods
2.1. Seed Material of Chickpea Genotypes
A collection of 61 diverse chickpea (Cicer arietinum) genotypes was selected and obtained from the U.S. Department of Agriculture (USDA-ARS) National Germplasm Center (Western Regional Pl Station, Pullman, WA, USA) based on their diverse wide range of country origin and broad phenotypic and geographic sources. All genotypes were field grown at Whitlow, Pullman Plant Introduction farm and Central Ferry Farm, Washington, USA. Standard agronomic practices were used, and seeds were treated to protect them as they grew. The Whitlow farm (Pullman, WA, USA; 46°44′ N, 117°7′ W) has soils including Palouse and Palouse-Thatuna silt loam, with an elevation of 790 m, and fields are dryland-managed. The weather was very similar to the 30-year average during the main growing season. The average annual precipitation ranged from approximately 500 mm to 700 mm.
2.2. Multi-Element Seed Analysis Using Inductively Coupled Plasma Spectroscopy
A seed element analysis was conducted using an inductively coupled plasma spectrometer (Thermo-Fisher Scientific Element2 ICP-MS, Thermo Fisher Scientific, Waltham, MA, USA) at the National High Magnetic Field Laboratory (Tallahassee, FL, USA). Seeds were milled to fine powders using a coffee grinder. Briefly, 0.5 g ground seeds were placed in 7 mL PFA-Teflon vials (Savillex Corporation, Eden Prairie, MN, USA). Samples were dissolved in 2 mL ultra-pure HNO3 for 2 d at 75 °C and dried down. Samples were subsequently re-dissolved in 2 mL 2% HNO3 and dried down. Then, samples were re-dissolved in 2 mL 7N HNO3 and placed in an ultrasonic bath for 30 min. Subsequently, sample solutions were transferred to clean and weighed bottles and diluted with quartz-distilled water to a 2% HNO3 solution. The ICP was calibrated with a mixed pure-element standard of known concentrations and 18 MΩ deionized water as blank. Indium (In) was added and used as a drift monitor during the analytical sequence. Samples were analyzed in a sequence that consisted of blank and standard measurements bracketing six sample measurements.
2.3. Protein Analysis and Oil Analysis of Chickpe Seeds
The methodology of the present study was modeled after a similar procedure described in a previous paper [14]. The measurements of seed protein content were performed on single seeds using a single kernel NIR spectrometer (SKNIR-256-1.7 T1, Control Development, South Bend, IN, USA), as described by Hacisalihoglu and Armstrong [10]. The SKNIR spectrometer utilizes a 256-element indium–gallium-arsenide (InGaAs) sensor (Control Development, South Bend, IN, USA), which is interpolated to encompass the spectral range from approximately 900 to 1700 nm at intervals of 1 nm with a spectral integration time of 24 milli seconds. NIR spectra for individual seeds were collected in triplicate and averaged after mean centering, which was then used for model predictions using an existing calibration previously developed by Hacisalihoglu group (currently in press). Individual seed weights were measured with a balance in three replicates.
The methodology of the present study was modeled after a similar procedure described in a previous paper [14]. The oil content of the intact seeds was measured using a Bruker MiniSpec mq20 NMR Analyzer (Bruker Biospin, Billerica, MA, USA), as described previously [14]. The oil content was obtained by placing three seeds into a 20 mm test tube warmed to 40 °C and then by inserting the tube into the NMR instrument using the standard procedures suggested by the manufacturer. The analyzer was calibrated prior to the measurements and was optimized for the range of oil that was to be measured.
2.4. Estimating the Nutrient Values (% DV) of Chickpea Seeds
The nutritional values chickpea seeds were estimated with using a 100 g dry weight serving portion. The U.S. Food and Drug Administration (FDA) daily values based on a 2000-calorie diet for adults were as follows: phosphorus (P, 1250 mg), calcium (Ca, 1300 mg), magnesium (Mg, 420 mg), zinc (Zn, 11 mg), iron (Fe, 18 mg), copper (Cu, 0.9 mg), and manganese (Mn, 2.3 mg) [12]. The recommended percent daily value (DV %) was calculated using the following formula [12]:
2.5. Data Analysis
Standard statistical techniques were used for data analysis. Descriptive statistics were used to calculate the means, standard errors (SE), and ranges. Correlations among nutrient concentrations and data visualizations were performed using multiple software, including Sigma Plot (Version 16, SPSS Inc., Chicago, IL, USA) and Microsoft Excel (Microsoft, Redmond, WA, USA), as described previously [14]. Pearson’s correlation analysis was conducted at significance levels p < 0.05, p < 0.01, and p < 0.001. The differences at p < 0.05, p < 0.01, and p < 0.001 levels are considered significant, very significant, and highly significant, respectively. Mean values are averaged over three reps (oil, protein) and duplicate elemental analysis repeats, respectively. Data are expressed as percentages (oil, protein) or as µg/g in elements. Elemental samples were analyzed in a sequence that consisted of blank and standard measurements bracketing six sample measurements.
3. Results
3.1. Comparison of Variations in Chickpea Multi-Element Contents
The nutrient composition of chickpea genotypes, along with their mean values, ranges, and standard errors, is summarized in Table 1. The 61 chickpea genotypes showed an extensive variation in seed nutrient concentrations. P was the most abundant mineral element (~0.4%) after protein content (19.6%), while Cu was the least abundant (6.9 µg/g). P concentration showed variation with a 2.9-fold range (2573–7313 µg/g). Ca concentration showed variation with a 5.7-fold range (283–1601 µg/g). Mg concentration showed variation with a 2-fold range (1232–2466 µg/g). Zn concentration showed variation with a 3.4-fold range (16.8–56.5 µg/g). Fe concentration showed variation with a 2.6-fold range (29.5–77.1 µg/g). Cu concentration showed variation with a 3.1-fold range (3.64–11.3 µg/g). Mn concentration showed variation with a 3.2-fold range (14.7–47.3 µg/g). Oil concentration showed variation with a 2.1-fold range (12.6–26.5%). Protein concentration showed variation with a 2.1-fold range (12.6–26.5%).

Table 1.
Detailed list and descriptive statistics in seed nutrient concentrations of 61 diverse chickpeas (Cicer arietinum) genotypes.
3.2. Correlations Among Chickpea Seed Nutrients
There was a strong positive relationship between Zn and Cu (r = 0.73, Figure 1a). There was a moderate positive relationship between Mg and Fe (r = 0.68, Figure 1b), P and Zn (r = 0.67, Figure 1c), P and Cu (r = 0.66, Figure 1d), and P and Fe (r = 0.65, Figure 1e). There was a negative relationship between protein and oil content (r = −0.62, Figure 1f).
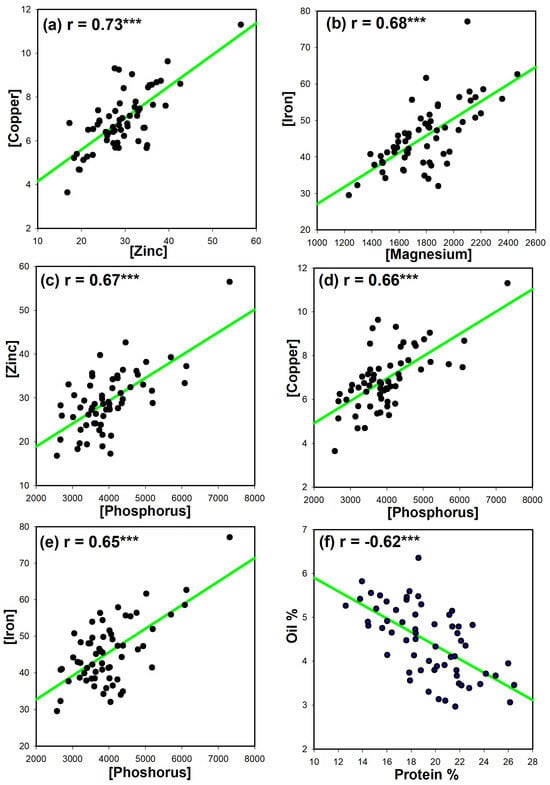
Figure 1.
Correlations between seed nutrient concentrations. (a) Zn and Cu, (b) Mg and Fe, (c) P and Zn, (d) P and Cu, (e) P and Fe, and (f) protein and oil of 61 chickpea genotypes. r, Pearson’s correlation coefficient. P, phosphorus; Ca, calcium; Mg, magnesium; Fe, iron; Cu, copper; Mn, manganese; B, boron. ***, all correlations shown in (a–f) are highly significant at p < 0.0001 level, as determined using Pearson’s correlation.
3.3. Determination of Chickpea Seed Nutritional Value (% DV)
The nutritional percent daily value (% DV) averages for a 100 g serving of chickpeas, compared to a 2000-calorie daily diet recommendation, are summarized in Table 2. Our results show that chickpea seeds are a great source of Mn (122% DV). Moreover, they were rich in Cu (77% DV), Mg (43% DV), P (32% DV), Zn (27% DV), and Fe (25% DV), but low in Ca (5% DV) (Table 2).
Table 2.
Daily nutritional value (% DV) provided by a 100 g serving size of chickpeas.
3.4. Identification of Top Twelve Superior Promising Chickpea Genotypes
Based on the result of our screening of 61 chickpea genotypes, the top 12 promising genotypes were identified with elevated nutritional concentrations as follows: Garnet for the highest P (7313 µg/g), Zn (56.5 µg/g), Fe (77 µg/g), Cu (11.3 µg/g), and Mn (47 µg/g), ICCV7 for the highest Ca (1601 µg/g), I-13 for the highest Mg (2466 µg/g) and B (16.5 µg/g), ICC6267 for the highest protein (26.5%), ICC9491 for the highest oil (6.4%), and ICC6268 for high levels of protein and multi-elements. Furthermore, chickpea genotype ILC1687 showed high concentrations of P and Mg, chickpea genotype Garbanza showed high concentrations of Ca, chickpea genotype Dwelley showed high concentrations of Ca, chickpea genotype ILC3444 showed high concentrations of Zn, Fe, Cu, and Mn, chickpea genotype Flip84-79 showed high concentrations of oil, and chickpea genotype ILC239 showed high concentrations of protein (Table 3).
Table 3.
Top twelve superior genotypes of chickpeas (Cicer arietinum) with the highest or high seed nutrient concentration and their country of origin. P, phosphorus; Ca, calcium; Mg, magnesium; Fe, iron; Cu, copper; Mn, manganese; B, boron.
4. Discussion
Global food security affects 864 million people severely, which causes calorie deficits and malnourishment. Mineral and vitamin deficiencies (also known as “hidden hunger”) affect two billion people and result in anemia, blindness, and poor growth [26]. Therefore, we can ensure future food security and healthy diets with the increased usage of more nutritious food crops and their diversity. Crop seeds are rich sources of macronutrients, micronutrients, carbohydrates, proteins, and fats, and play an important role in human diets and nutrition. Crop species of the Fabaceae family include soybean, common bean, peas, peanuts, chickpeas, lentils, alfalfa, clover, pigeon peas, moth beans, mung beans, cowpeas, lima beans, tepary beans, yearlong beans, runner beans, and faba beans [12].
Chickpea is a worldwide important food legume crop that is commonly featured in Asian, Mediterranean, and African cuisines as well as plant-based diets [1,4,5,8]. The results of the current study indicate that chickpea seeds exhibit considerable variability in terms of essential mineral nutrients, oils, and proteins (Table 1). This finding is consistent and follows a number of recent findings from faba beans, Arabidopsis, flax, and soybeans [7,12,13,14,15,17,24]. Chickpeas have also demonstrated genetic diversity and variation, particularly for seed protein content [5,6,7,8,9,10,11,12].
It is also equally important to identify promising genotypes for further breeding and biofortification efforts. Specifically, 12 unique chickpea genotypes were identified with superior seed nutritional compositions (genotypes Garnet, I-13, ICC6267, ICC9491, ICC6268, ICCV7, ILC1687, Garbanza, Dwelley, ILC3444, Flip84-79, and ILC239). Overall, the most mineral nutrients were observed in chickpea genotype Garnet, while the highest protein % was observed in genotype ICC6267.
4.1. Nutritional Profiling of Chickpeas
A set of previous studies have reported on the nutritional quality of chickpea accessions from around the world [5,6,7,8]. Our findings in the current study show that chickpeas contain an average of 19.6% protein (Table 1), aligning with the protein values reported in Serrano et al. (2017) of 15–23% [7], Tafera et al. (2021) of 14–23% [6], Sandhu et al. (2023) of 18–26% [5], and Zhang et al. (2024) of 17–23% [8]. Moreover, our findings in the current study show that chickpeas contain an average of 29.2 µg/g Zn (Table 1), aligning with the Zn values reported in Tafera et al. (2021) of 13–35 µg/g [6], Sandhu et al. (2023) of 30–430 µg/g [5], and Zhang et al. (2024) of 23–41 µg/g [8]. Furthermore, our findings in the current study show that chickpeas contain an average of 45.5 µg/g Fe (Table 1), aligning with the Fe values reported in Tafera et al. (2021) of 30–100 µg/g [6] and Sandhu et al. (2023) of 60–240 µg/g [5]. It should be noted that slightly higher values documented by Sandhu et al. (2023) may be attributed to genetic diversity among the set of chickpea accessions have been tested [5].
4.2. Percent Daily Values (% DV) Nutrient Contributions of Chickpea Seeds
There have been earlier studies of chickpea nutritional quality reported in the literature [5,6,7,8,17,27]. Moreover, our research characterized a new set of 61 diverse chickpea genotypes for ionomics. Furthermore, our study places particular emphasis on daily percent value contributions (Table 2). On the other hand, our results show that chickpea seeds supply considerable amounts of Mn, Mg, P, Zn, and Fe relative to the percent daily nutritional values recommended. Although a number of chickpea nutritional traits have been studied previously, none of those studies used the chickpea genotypes we reported in the current study. Our research provides new insights into the nutritional composition of these specific genotypes, contributing to an understanding of chickpea diversity. By analyzing these previously unexamined genotypes, we highlight potential differences in macro- and micronutrient content that could be valuable for chickpea breeding programs for their nutritional improvement efforts. This study, therefore, fills a gap in the existing literature and offers a fresh perspective on chickpea ionomics and daily values contributions.
4.3. Correlations Among Nutrients in Chickpea Seeds
An additional interesting finding is that a small set of correlated chickpea seed nutrients was detected, suggesting that their accumulation is related. For example, while a strong positive correlation of Zn and Cu could be used for co-selection in future chickpea breeding and development efforts. Additionally, there was a negative correlation between seed protein and oil content in chickpeas. This finding is consistent with studies on soybean seeds [28].
4.4. Future Research Directions and Possible Applications
The current findings of this research on the nutrient composition of chickpea seeds highlight their potential applications in future chickpea crop improvement, environmental stress resilience, sustainability, and global food security. Additionally, future biofortification programs could leverage chickpea ionome data and the top-performing genotypes to combat micronutrient deficiencies in undernourished populations worldwide. Moreover, chickpea breeding programs could possibly utilize the current results to develop new chickpea varieties or cultivars with higher nutrient, protein, and oil performances for human dietary and nutritional needs.
5. Conclusions
Chickpea is a climate-resilient nutrient-dense food crop that could serve an increasingly important role in providing a nutritious food supply, particularly within plant-based diets. This study evaluates 61 diverse chickpea genotypes by analyzing seed composition using ICP-MS and assessing their daily nutritional values. Our study shows significant variation among chickpea genotypes and provides new insights for further future research and opportunities for simultaneous breeding programs for the co-selection of nutrients such as Zn and Cu. Moreover, the best performance was also observed for manganese. Our results further identify the top twelve chickpea genotypes (genotypes Garnet, I-13, ICC6267, ICC9491, ICC6268, ICCV7, ILC1687, Garbanza, Dwelley, ILC3444, Flip84-79, and ILC239) that show the most promise due to their superior nutritional content. Overall, our study suggests that chickpea seeds have valuable daily nutritional values for several essential nutrients, including proteins. Further future research could focus on the genetic factors that influence the nutritional composition of this important legume crop. It should be noted that seed ionomics studies are not free of limitations. One major challenge is the influence of environmental factors such as climate conditions. Future studies should focus on genetic factors that contribute to ionomic variation using larger-scale studies with larger sample sizes and diverse chickpea accessions for a more comprehensive understanding.
Author Contributions
G.H. and V.S.: conceptualization, methodology, formal analysis, writing—original draft preparation, visualization. G.W. and V.S.: experimental design, methodology, writing—review and editing. All authors have read and agreed to the published version of the manuscript.
Funding
This research received no external funding.
Institutional Review Board Statement
Not applicable.
Informed Consent Statement
Not applicable.
Data Availability Statement
The data that support the findings of this study are available within the paper.
Acknowledgments
We are also grateful to the reviewers for their constructive suggestions. We thank the USDA National Plant Germplasm Center for the seeds (Pullman, WA, USA). We would like to acknowledge P. Armstrong (retired) for help and leadership, K. Fay for excellent technical help. Part of this work was performed at the National High Magnetic Field Laboratory, which is supported by NSF Cooperative Agreement no. DMR-1157490 and DMR-1644779 and the state of Florida. We would like to thank FAMU College of Science & Technology and the Biology Department.
Conflicts of Interest
The authors declare no conflicts of interest.
References
- Singh, K.B. Chickpea (Cicer arietinum). Field Crops Res. 1997, 53, 161–170. [Google Scholar] [CrossRef]
- Redden, R.; Berger, J.D. History and origin of chickpea. In Chickpea Breeding and Management; Yadav, S.S., Redden, R., Chen, W., Sharma, B., Eds.; CABI: Wallingford, UK, 2007; pp. 1–13. [Google Scholar]
- FAOSTAT. FAO Statistical Databases; Food and Agriculture Organization of the United Nations: Rome, Italy, 2023; B2023; Available online: http://www.fao.org/faostat (accessed on 1 December 2024).
- FAO. Pulses. Nutritious Seeds for a Sustainable Future; Food and Agriculture Organization of the United Nations: Rome, Italy, 2016. [Google Scholar]
- Sandhu, J.S.; Tripathi, S.; Chaturvedi, S.K. Chickpea Nutritional Status and Value Chain for Sustainable Development. In Sustainable Food Value Chain Development: Perspectives from Developing and Emerging Economies; Springer: Singapore, 2023; pp. 175–183. [Google Scholar]
- Tefera, M. Study the genetic diversity in protein, zinc and iron in germplasm pools of desi type chickpeas as implicated in quality breeding. J. Equity Sci. Sustain. Dev. 2021, 4, 56–70. [Google Scholar]
- Serrano, C.; Carbas, B.; Castanho, A.; Soares, A.; Vaz Patto, M.C.; Brites, C. Characterization of nutritional quality traits of a chickpea (Cicer arietinum) germplasm collection exploited in chickpea breeding in Europe. Crop Pasture Sci. 2017, 68, 1031–1040. [Google Scholar] [CrossRef]
- Zhang, J.; Wang, J.; Zhu, C.; Singh, R.P.; Chen, W. Chickpea: Its origin, distribution, nutrition, benefits, breeding, and symbiotic relationship with mesorhizobium species. Plants 2024, 13, 429. [Google Scholar] [CrossRef] [PubMed]
- Bouis, H.E.; Hotz, C.; McClafferty, B.; Meenakshi, J.V.; Pfeiffer, W.H. Biofortification: A new tool to reduce micronutrient malnutrition. Food Nutr. Bull. 2011, 32, 31–40. [Google Scholar] [CrossRef]
- Saltzman, A.; Birol, E.; Bouis, H.E.; Boy, E.; De Moura, F.F.; Islam, Y.; Pfeiffer, W.H. Biofortification: Progress toward a more nourishing future. Glob. Food Secur. 2013, 2, 9–17. [Google Scholar] [CrossRef]
- Cakmak, I. Enrichment of cereal grains with zinc: Agronomic or genetic biofortification? Plant Soil 2008, 302, 1–17. [Google Scholar] [CrossRef]
- Nadeem, M.A. Exploring the phenotypic diversity for seed mineral contents in Turkish faba bean germplasm. Int. J. Agric. Wild. Sci. 2021, 7, 540–550. [Google Scholar]
- Campos, A.C.A.; van Dijk, W.F.; Ramakrishna, P.; Giles, T.; Korte, P.; Douglas, A.; Smith, P.; Salt, D.E. 1135 ionomes reveal the global pattern of leaf and seed mineral nutrient and trace element diversity in Arabidopsis thaliana. Plant J. 2021, 106, 536–554. [Google Scholar] [CrossRef]
- Govindaraj, M.; Rai, K.N.; Kanatti, A.; Upadhyaya, H.D.; Shivade, H.; Rao, A.S. Exploring the genetic variability and diversity of pearl millet core collection germplasm for grain nutritional traits improvement. Sci. Rep. 2020, 10, 21177. [Google Scholar] [CrossRef]
- Ziegler, G.; Terauchi, A.; Becker, A.; Armstrong, P.; Hudson, K.; Baxter, I. Ionomic screening of field-grown soybean identifies mutants with altered seed elemental composition. Plant Gen. 2013, 6, 1–9. [Google Scholar] [CrossRef]
- Hacisalihoglu, G.; Settles, A.M. Quantification of Seed Ionome Variation in 90 Diverse Soybean (Glycine max) Lines. J. Plant Nutr. 2017, 40, 2808–2817. [Google Scholar] [CrossRef]
- Traore, F.; El-Baouchi, A.; En-Nahli, Y.; Hejjaoui, K.; Metougui, M.L.; Hamwieh, A.; Sohail, Q.; Istanbuli, T.; Boughribil, S.; Amri, M. Exploring the Genetic Variability and Potential Correlations Between Nutritional Quality and Agro-Physiological Traits in Kabuli Chickpea Germplasm Collection (Cicer arietinum L.). Front. Plant Sci. 2022, 13, 905320. [Google Scholar]
- Ainsworth, E.A.; Long, S.P. What have we learned from 15 years of free-air CO2 enrichment (FACE)? A meta-analytic review of the responses of photosynthesis, canopy properties and plant production to rising CO2. New Phytol. 2005, 165, 351–372. [Google Scholar] [CrossRef]
- Loladze, I. Hidden shift of the ionome of plants exposed to elevated CO2 depletes minerals at the base of human nutrition. eLife 2014, 3, e02245. [Google Scholar] [CrossRef] [PubMed]
- Arora, N.K.; Mishra, I. United Nations Sustainable Development Goals 2030 and environmental sustainability: Race against time. J. Environ. Sustain. 2019, 2, 339–342. [Google Scholar] [CrossRef]
- Aishwarya, S.; Anisha, V. Nutritional composition of sunflower seeds flour and nutritive value of products prepared by incorporating sunflower seeds flour. Int. J. Pharm. Res. Allied Sci. 2014, 3, 45–49. [Google Scholar]
- Hacisalihoglu, G.; Beisel, N.; Settles, A.M. Characterization of pea seed nutritional value within a diverse population of Pisum sativum. PLoS ONE 2021, 16, e0259565. [Google Scholar] [CrossRef]
- Dotto, J.M.; Chacha, J.S. The potential of pumpkin seeds as a functional food ingredient: A review. Sci. Afr. 2020, 10, 1–14. [Google Scholar] [CrossRef]
- Kulczynski, B.; Kobus-Cisowska, J.; Taczanowski, M.; Kmiecik, D.; Gramza-Michałowska, A. The Chemical Composition and Nutritional Value of Chia Seeds-Current State of Knowledge. Nutrients 2019, 11, 1242. [Google Scholar] [CrossRef]
- FDA. Nutrient Content Claims for ‘Good Source’,‘High’,‘More’, and ‘High Potency’, Specific Requirements for Nutrient Content Claims. Food Labeling, Code of Federal Regulations, Title 21, Chapter I, Subchapter B, Part 101, Subpart D, Section 101.54; FDA: Concord, NH, USA, 2023.
- FAO; IFAD; UNICEF; WFP; WHO. The State of Food Security and Nutrition in the World 2023. Urbanization, Agrifood Systems Transformation and Healthy Diets Across the Rural–Urban Continuum; FAO: Rome, Italy, 2023. [Google Scholar] [CrossRef]
- Ibanez, M.V.; Rinch, F.; Amaro, M.; Martinez, B. Intrinsic variability of mineral composition of chickpea (Cicer arietinum L.). Food Chem. 1998, 63, 55–60. [Google Scholar] [CrossRef]
- Panthee, D.R.; Pantalone, V.R.; West, D.R.; Saxton, A.M.; Sams, C.E. Quantitative trait loci for seed protein and oil concentration, and seed size in soybean. Crop Sci. 2005, 45, 2015–2022. [Google Scholar] [CrossRef]
Disclaimer/Publisher’s Note: The statements, opinions and data contained in all publications are solely those of the individual author(s) and contributor(s) and not of MDPI and/or the editor(s). MDPI and/or the editor(s) disclaim responsibility for any injury to people or property resulting from any ideas, methods, instructions or products referred to in the content. |
© 2025 by the authors. Licensee MDPI, Basel, Switzerland. This article is an open access article distributed under the terms and conditions of the Creative Commons Attribution (CC BY) license (https://creativecommons.org/licenses/by/4.0/).