Abstract
COVID-19 is one of the worst pandemics ever; it is spreading rapidly and creating a health crisis around the world. This disease continues to seriously threaten human life and has caused more than 759 million infections and over 6.8 million deaths worldwide. In this work, we propose a discrete mathematical model of COVID-19 to predict the evolution of the dynamics of this pandemic. We calculate the basic reproduction number and the equilibrium points, and then perform the stability analysis theoretically and numerically. Finally, we conclude with local sensitivity analysis.
1. Introduction
In December, 2019, a mysterious pneumonia appeared in the city of Wuhan, China [1]. By 3 January, 2020, 44 cases of this disease had been diagnosed [1]. A month later, it was determined that this was caused by a new coronavirus [2], which was named SARS-CoV-2 and whose disease is known as COVID-19 (coronavirus disease 2019) [3]. In March, 2020, the World Health Organization declared COVID-19 a pandemic due to its spread to most continents [2], creating a global health crisis with over 118 thousand confirmed cases and 4292 deaths worldwide [2]. By the end of the following month, the number of infected people had exceeded 3 million with 217,769 deaths. COVID-19 had affected almost every corner of the world. Many countries announced the closure of places where the virus could spread easily pandemic, such as schools, universities, markets, and places of entertainment. They also went on lockdown and closed their borders to reduce the spread of the virus. However, the number of infected cases continued to increase, and no ways to end the pandemic had been found. Three years later, this pandemic, which initially only raised a few concerns, has killed over 6.8 million people [4] and changed the world forever.
Since the beginning of the pandemic, all sectors have been mobilized in the fight against the highly transmissible SARS-CoV-2, including mathematics, specifically modeling. Many models have been proposed to predict the evolution of the dynamics and behavior of this disease such as those in [2,3,5,6]. These models allow for the estimation of lethality and the basic reproduction number, especially to find ways to minimize the number of infected individuals and deaths and to control scenarios responsible for transmission. In this work, a discrete SEIR model was proposed to predict the dynamics of COVID-19, including asymptomatic infected individuals, those infected with moderate symptoms, and those developing a severe form of the disease, which requires hospitalization. The model calculates the basic reproduction rate, , and the equilibrium points. Stability analysis was performed, followed by a local sensitivity analysis.
2. Materials and Methods
We developed a compartmental model for COVID-19 using a discrete deterministic system based on epidemiological data. The model was used to analyze the disease and predict its evolution. We calculated the basic reproduction number using the next-generation method. The local stability theorem of Lyapunov was used for stability analysis. To perform the local sensitivity analysis, we calculated the sensitivity indexes for .
3. Results and Discussion
3.1. Stability Analysis
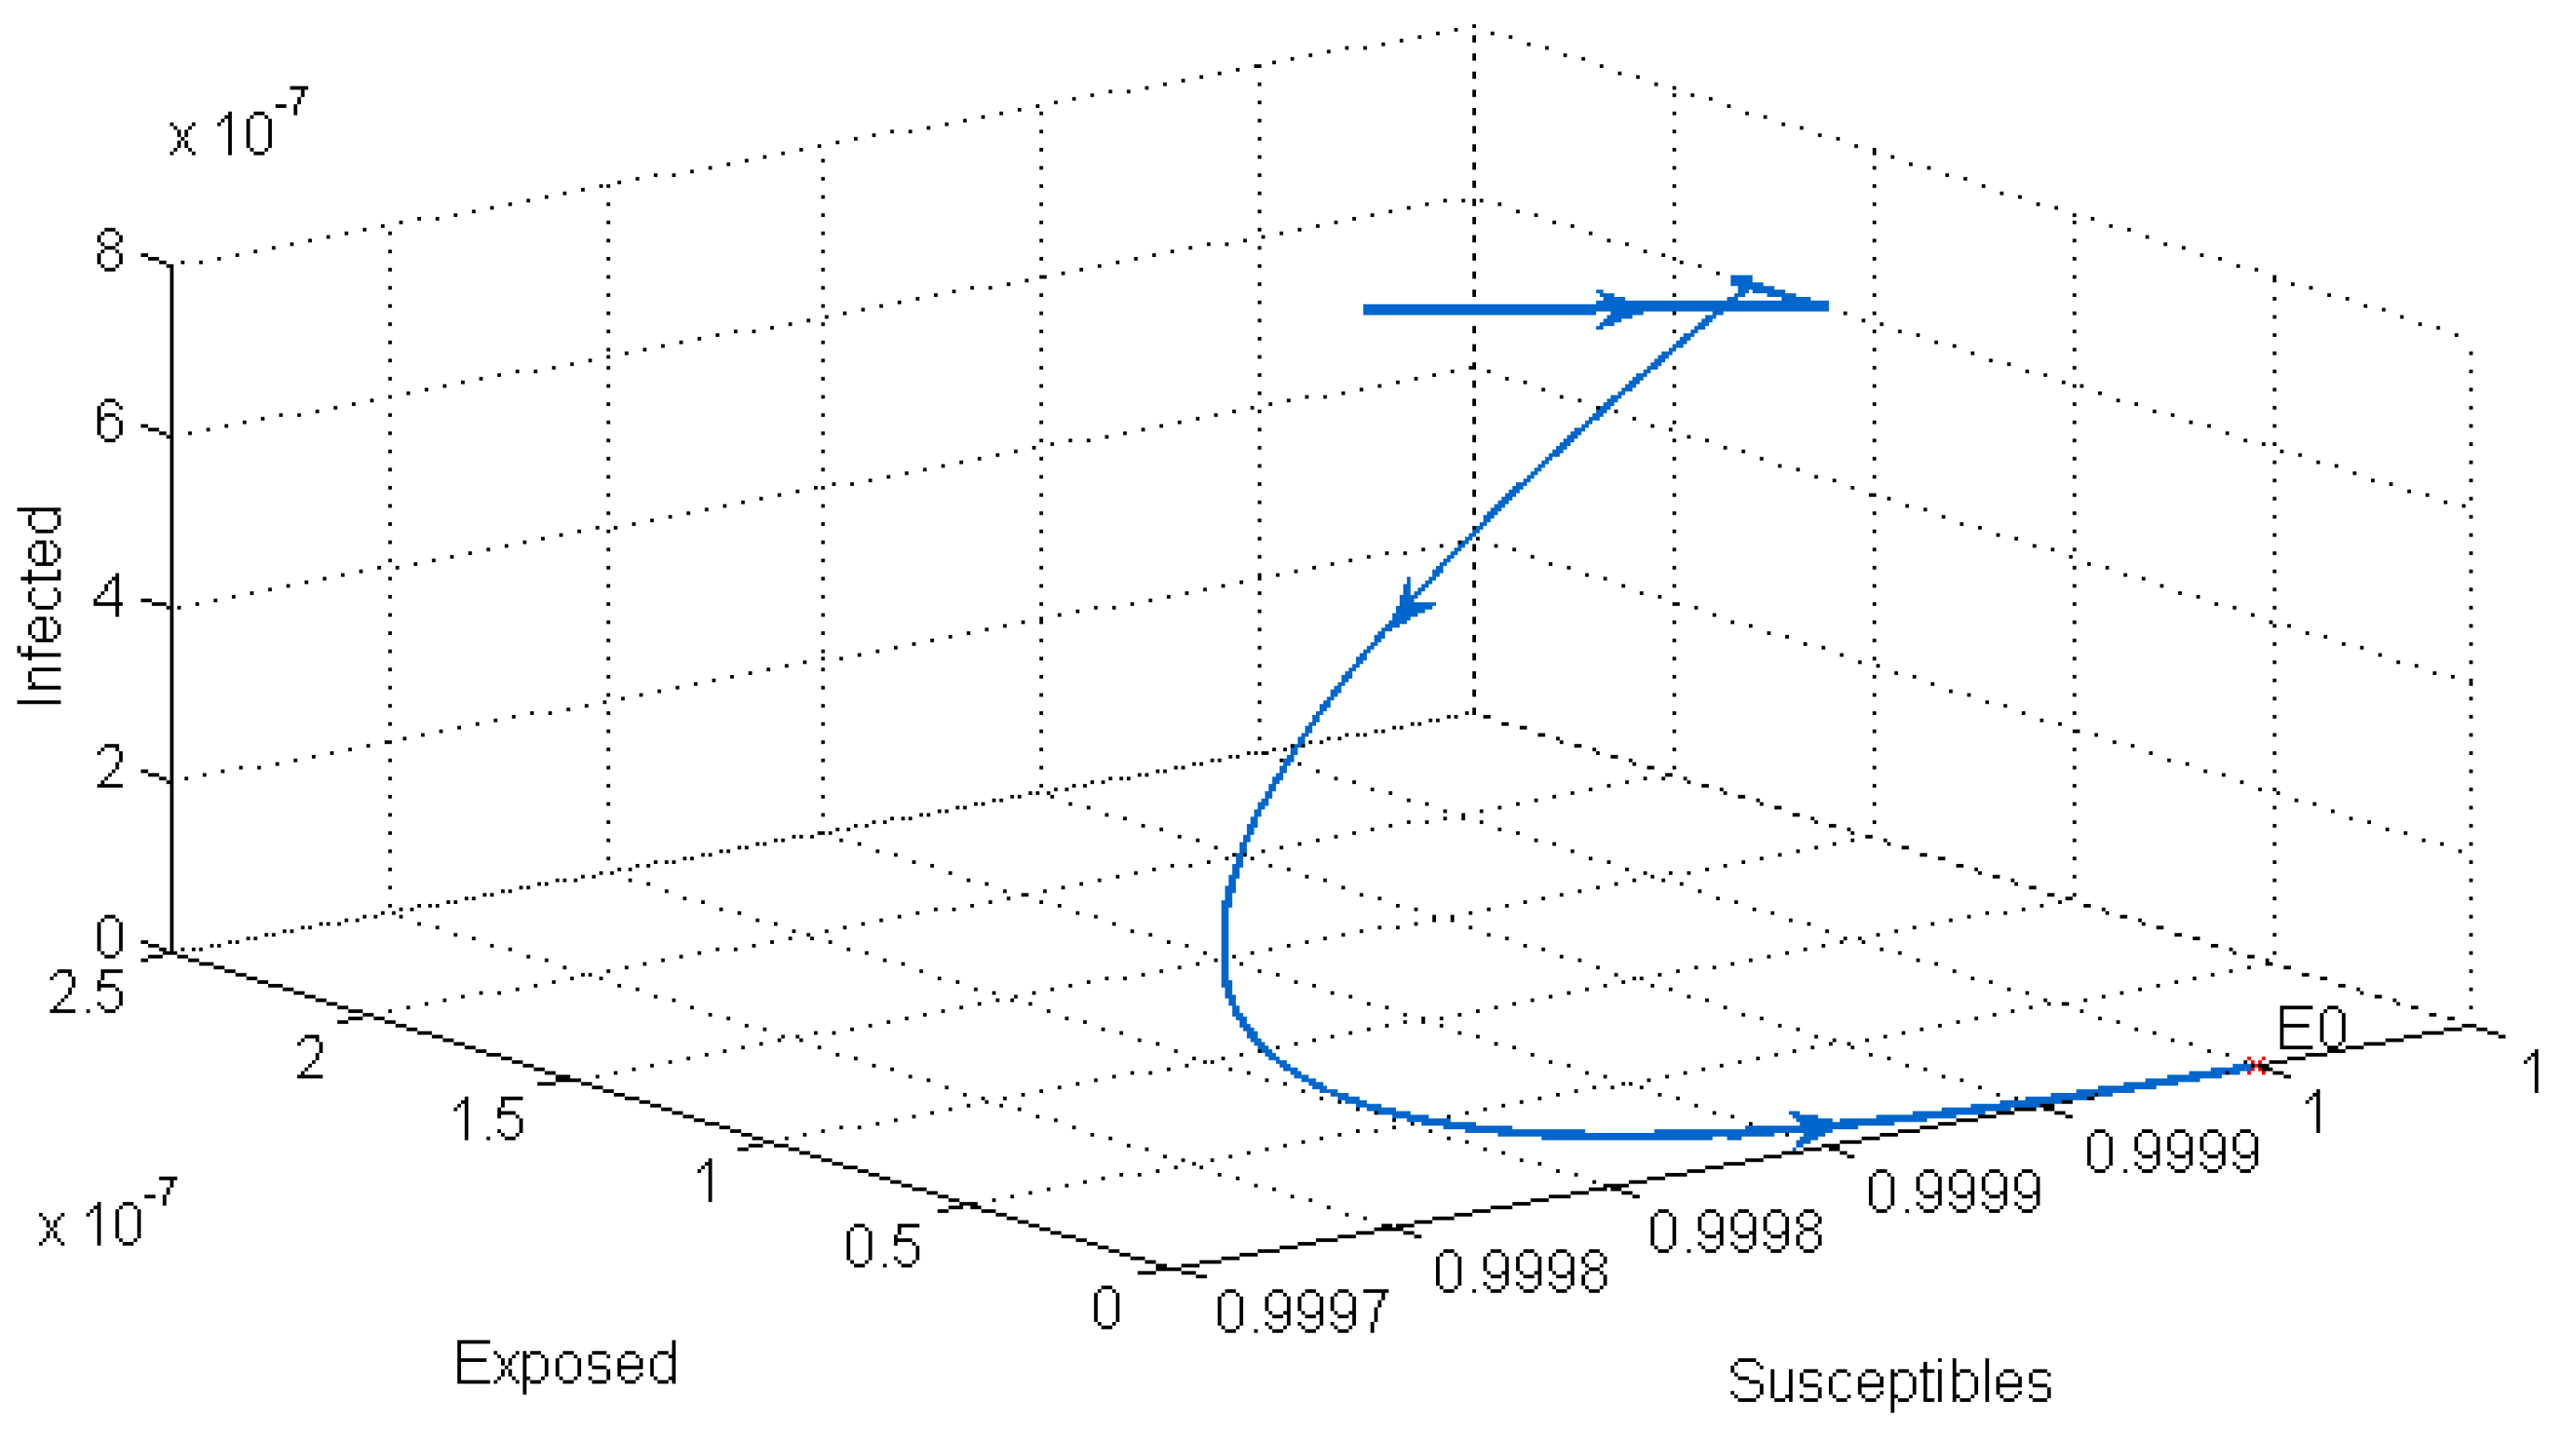
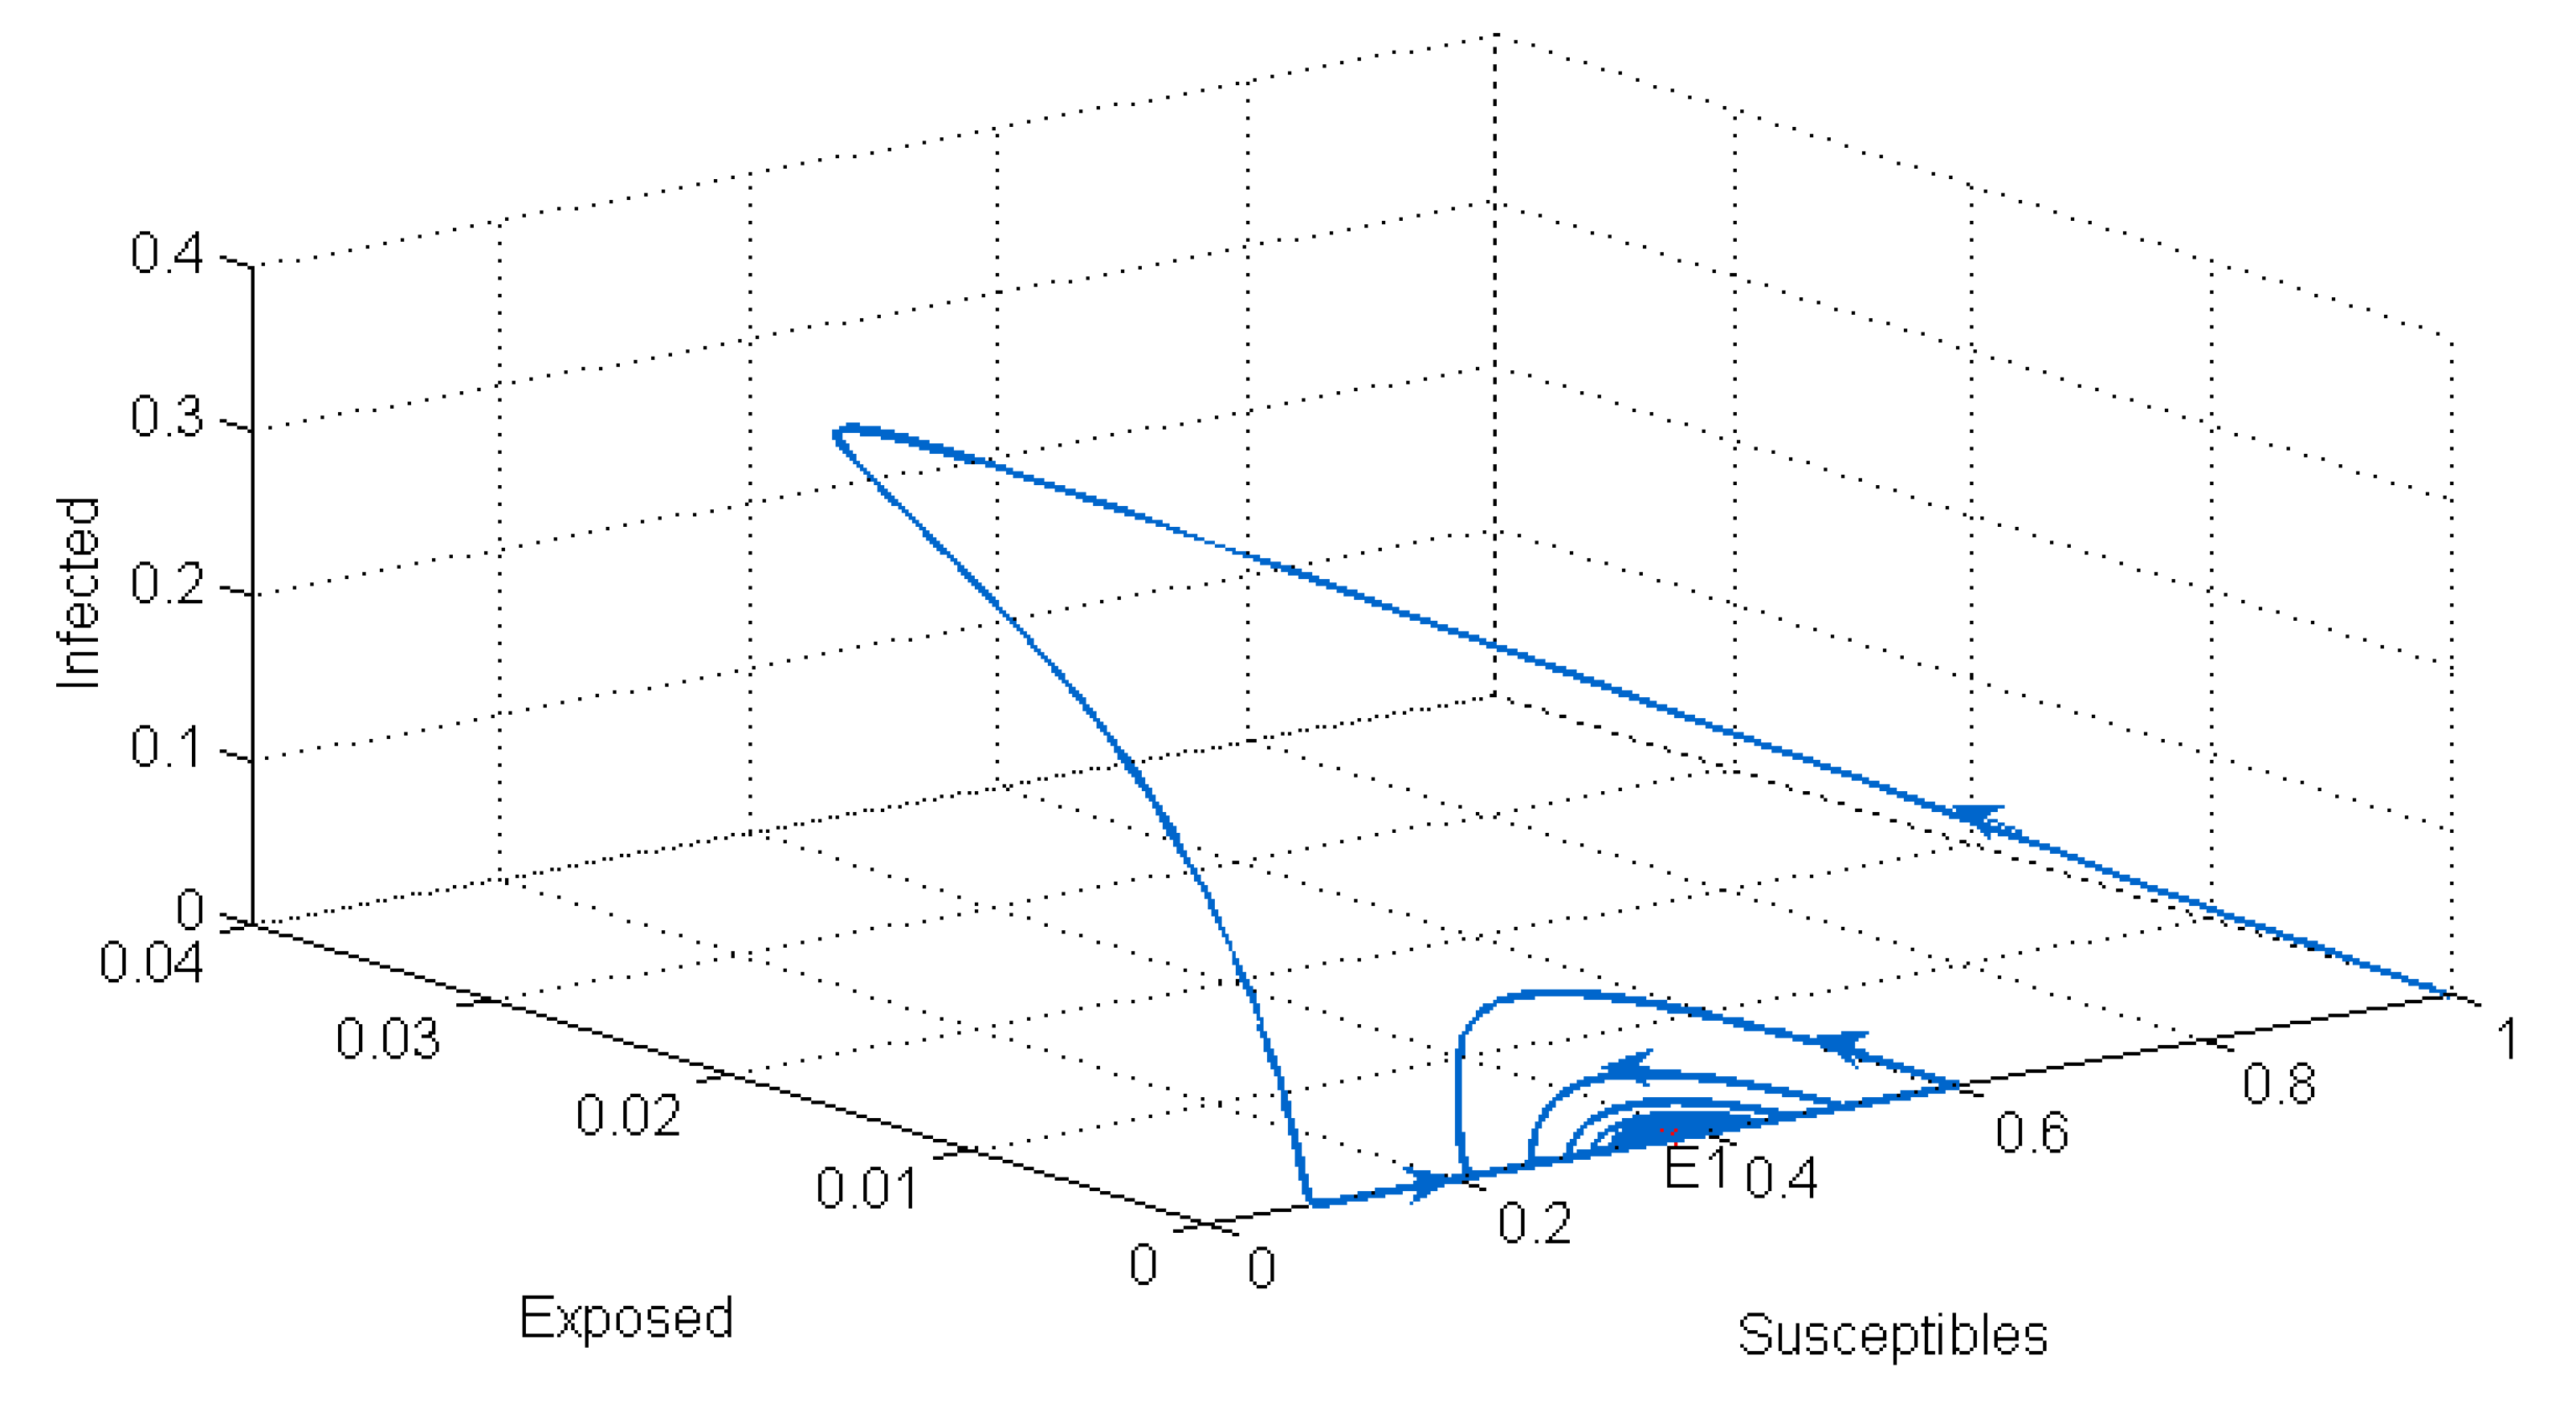
After performing the stability analysis of our system, we found that it has two equilibrium points: the disease-free equilibrium , which is locally asymptotically stable when (see Figure 1), and the endemic equilibrium , which is locally asymptotically stable when (see Figure 2).
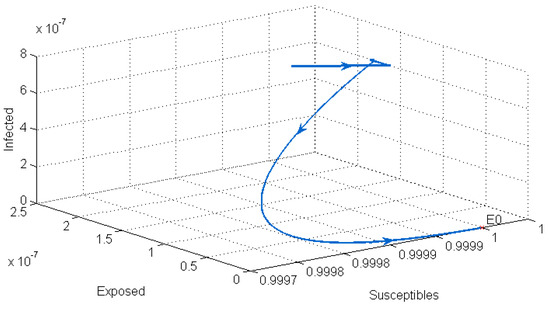
Figure 1.
Stability of the disease-free point .
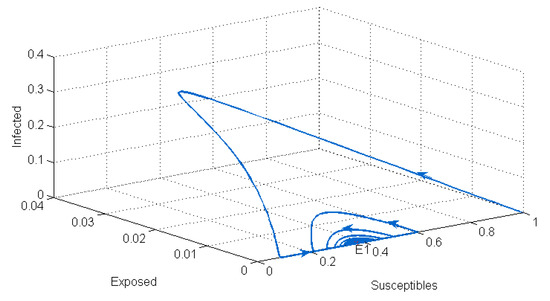
Figure 2.
Stability of the endemic equilibrium point .
3.2. Sensitivity Analysis
We performed a sensitivity analysis by calculating the sensitivity indices of (see Table 1). Our analysis showed that is most sensitive to the transmission rate of COVID-19 and the recovery rate of asymptomatic infected people. An increase in the transmission rate leads to an increase in , while an increase in the recovery rate leads to a decrease in .

Table 1.
Sensitivity indices of .
Author Contributions
Conceptualization, M.E.-B.K. and O.B.; methodology, O.B.; formal analysis, O.B.; investigation, M.E.-B.K.; writing—original draft preparation, M.E.-B.K.; writing—review and editing, O.B.; supervision, O.B. All authors have read and agreed to the published version of the manuscript.
Funding
This research received no external funding.
Institutional Review Board Statement
The study did not require ethical approval.
Informed Consent Statement
Not applicable.
Data Availability Statement
Not applicable.
Conflicts of Interest
The authors declare no conflict of interest.
References
- WHO. Novel Coronavirus (2019-nCoV): Situation Report 1. Available online: https://www.who.int/docs/default-source/coronaviruse/situation-reports/20200121-sitrep-1-2019-ncov.pdf (accessed on 10 March 2023).
- Kouidere, A.; Khajji, B.; El Bhih, A.; Balatif, O.; Rachik, M. A mathematical modeling with optimal control strategy of transmission of COVID-19 pandemic virus. Commun. Math. Biol. Neurosci. 2020, 2020. [Google Scholar] [CrossRef]
- Yang, B.; Yu, Z.; Cai, Y. The impact of vaccination on the spread of COVID-19: Studying by a mathematical model. Phys. A: Stat. Mech. Its Appl. 2022, 590, 126717. [Google Scholar] [CrossRef]
- WHO. Weekly Epidemiological Update on COVID-19—8 March 2023. Available online: https://www.who.int/emergencies/diseases/novel-coronavirus-2019 (accessed on 10 March 2023).
- Ndaïrou, F.; Area, I.; Nieto, J.J.; Torres, D.F. Mathematical modeling of COVID-19 transmission dynamics with a case study of Wuhan. Chaos, Solitons Fractals 2020, 135, 109846. [Google Scholar] [CrossRef] [PubMed]
- Annas, S.; Pratama, M.I.; Rifandi, M.; Sanusi, W.; Side, S. Stability analysis and numerical simulation of SEIR model for pandemic COVID-19 spread in Indonesia. Chaos, Solitons Fractals 2020, 139, 110072. [Google Scholar] [CrossRef] [PubMed]
Disclaimer/Publisher’s Note: The statements, opinions and data contained in all publications are solely those of the individual author(s) and contributor(s) and not of MDPI and/or the editor(s). MDPI and/or the editor(s) disclaim responsibility for any injury to people or property resulting from any ideas, methods, instructions or products referred to in the content. |
© 2023 by the authors. Licensee MDPI, Basel, Switzerland. This article is an open access article distributed under the terms and conditions of the Creative Commons Attribution (CC BY) license (https://creativecommons.org/licenses/by/4.0/).