Abstract
This paper addresses the practical problem of scheduling operating room (OR) elective surgeries to minimize the likelihood of surgical delays caused by the unavailability of capacity for patient recovery in a central post-anesthesia care unit (PACU). We segregate patients according to their patterns of flow through a multi-stage perioperative system and use characteristics of surgery type and surgeon booking times to predict time intervals for patient procedures and subsequent recoveries. Working with a hospital in which 50+ procedures are performed in 15+ ORs most weekdays, we develop a constraint programming (CP) model that takes the hospital’s elective surgery pre-schedule as input and produces a recommended alternate schedule designed to minimize the expected peak number of patients in the PACU over the course of the day. Our model was developed from the hospital’s data and evaluated through its application to daily schedules during a testing period. Schedules generated by our model indicated the potential to reduce the peak PACU load substantially, 20-30% during most days in our study period, or alternatively reduce average patient flow time by up to 15% given the same PACU peak load. We also developed tools for schedule visualization that can be used to aid management both before and after surgery day; plan PACU resources; propose critical schedule changes; identify the timing, location, and root causes of delay; and to discern the differences in surgical specialty case mixes and their potential impacts on the system. This work is especially timely given high surgical wait times in Ontario which even got worse due to the COVID-19 pandemic.
1. Introduction
1.1. Motivation
Demographic changes and political economic conditions have intensified the need and demand for more efficient health care operations, including a call to reduce elective surgery wait-times. For example, Health Quality Ontario, an organization established to advise the province regarding the performance of its $55 billion annual health care expenditures, maintains an up-to-date public Internet dashboard listing of surgical wait-times for six key categories of procedures, not only at the provincial level but also by region and individual hospital [1]. More recently, the province of Ontario has been trying to find ways, including the privatization of healthcare, to reduce high and chronic surgical wait times, which have gotten much worse over the years and the pandemic [2,3]. The situation is similar for the rest of the country, and Canadian federal government and provinces reached a new funding deal to improve healthcare over the next 10 years [4].
Our partner hospital is a 600-bed regional tertiary care hospital that has been exploring opportunities to increase surgical throughput by means of establishing some operating room (OR) schedule blocks as Rapid and Standardized Operating Rooms (called ‘RASTOR rooms”). Their aim is to reduce wait-times in services where they exceed the provincial benchmarks, by more than double in some service categories. While these RASTOR rooms involve more numerous and shorter procedures than other ORs, they operate within the same perioperative system which includes a centralized Post-Anesthesia Care Unit (PACU).
More rapid patient procedures in these RASTOR rooms create an imperative that these ORs can function without obstruction from external processes and conditions, as happens when a patient whose surgery has been completed cannot be moved from the OR due to the PACU being at full capacity. This delays the subsequent patient, causes lost OR time for the surgeon, and is a waste of utilities and staff time to support open ORs, often re-incurring added costs later at higher overtime rates. Meanwhile, some of the PACU bed capacity may be occupied inappropriately, due to a downstream patient destination being unable to receive a patient into the next stage of care [5,6], either a hospital ward or PACU2 (step-down recovery, just prior to discharge from the hospital).
This problem already exists with our partner hospital’s current daily volumes of scheduled patients, and it is likely to worsen if volumes are increased to address the wait-time performance issue. We note that some recent developments in anesthesia practices [7] can eliminate the need for PACU recovery in certain cases. However, general anesthesia remains dominant and leads to similar recovery times for most RASTOR surgeries, notwithstanding that the procedures themselves are being made shorter and more rapid and frequent. One consideration is whether additional PACU physical capacity is required to accommodate greater patient volumes. Our research considers whether case scheduling might be better coordinated across ORs, and perhaps integrated with PACU bed management, to improve patient flow.
We addressed these issues through developing a model to translate daily patient rosters (i.e., existing schedules) into individual OR sequences aimed collectively at minimizing the peak PACU patient load. We run our model iteratively, with each iteration seeking a schedule to meet a progressively lower peak PACU load target, and within that context, to choose a solution that minimizes total patient flow time and thereby the ORs’ makespans. Flow time is defined by [8] as the total time a job (patient) spends in a shop (i.e., preparation, OR, and recovery), using the simplifying, common, and justifiable assumption that all patients arrive at the start of their respective OR block opening times. We used information available on days following surgery to evaluate our model and to visualize events (including delays) across time, location, and status of patients, ORs, and PACU beds. Our methods take the existing ‘pre-schedule’ and respond with the best alternative sequencing of procedures for the ORs. We then extract and transform data collected during schedule execution into a visual flow format, with complimentary metrics, for surgeons and perioperative management to monitor and refine their scheduling and staffing decisions.
To the best of our knowledge, we are the first to address the general problem presented in this paper using constraint programming (CP) with real data and to demonstrate strengths of this form of programming in terms of its intuitiveness and flexibility. In effect, we develop a platform which can be easily implemented to suggest beneficial schedule changes based on a wide range of factors that can be captured and conditions that might be imposed in a complex setting. Notwithstanding such extensions, our analysis shows that a collective and calculated approach to scheduling in multiple ORs can have a significant positive impact, reducing by 20% or more the expected peak patient loads in the PACU. Our research is unique in a variety of ways. It focuses on the PACU as a flow-limiting stage of the OR process using constraint programming to establish surgery sequences across multiple ORs to achieve maximum average utilization and to minimize peak load in the PACU.
1.2. Background Literature
The body of research concerned with operating room scheduling is substantial. Refs. [9,10,11,12] provide extensive literature reviews. During the eight years spanning the final three of these reviews, the number of papers considered expanded from 115 to 170, or roughly one every two months, as a testament both to the heightened importance of these issues to health care managers and to the variety of specific problems and operating contexts involved. Refs. [10,11] share a similar structure which classifies papers according to six dimensions: patient-case characteristics, performance criteria and measurement, decision delineation or planning context, research method or solution technique, handling of uncertainty, and applicability of research. Some other related references to patient scheduling include [13,14,15].
Patient-case characteristics refer to whether the problem considered includes both elective (pre-scheduled) and/or urgent or emergent (unscheduled) surgeries, and whether distinctions are drawn between inpatients and outpatients. Our research focuses on elective surgeries, as do nearly two-thirds of the papers reviewed in [12]. This is warranted by three levels of capacity allocation the hospital has for unscheduled, emergent, and urgent cases with dedicated OR time blocks reserved for priority cases to be inserted into the surgery day (real time allocation). In our partner hospital, one OR is fully dedicated to priority 1 emergencies as they arrive. Finally, a scheduled elective case may be pre-empted, if necessary, to accommodate an emergent case if other options are not available. As for elective cases, our research considers and distinguishes between outpatients and inpatients and also the-same-day admissions that share a common routing inbound and outbound with outpatients and inpatients.
The dominant performance criterium applied in the OR scheduling literature is utilization (especially of ORs, surgeons, and nursing teams), followed by waiting times (of patients, surgeons, or as a measure of system throughput), overtime, and load levelling, e.g., [9,11,15]. However, roughly 40% of papers reviewed in [12] included other and/or multiple criteria, as a reflection of many different perspectives about what outcomes are most/least desirable in a given hospital setting. Our model’s objective function falls in the category of throughput measure, but indirectly also OR utilization, as through minimizing average patient flow time we are also minimizing the sum of individual OR makespans given their specified workloads. Our iterative approach, on the other hand, falls in the category of load levelling, as it explicitly seeks to do that for the PACU.
Decision delineation or planning context incorporates but extends traditional classifications of planning: strategic, e.g., case mix planning [10]; tactical, e.g., block time allocation [5,6]; and operational, e.g., case sequencing [16]. Ref. [10] considers the matter in two dimensions, which represent whether decisions are to be made concerning date, time, room, or capacity allocation and whether the operational unit of concern is individual or a grouping of surgeons, patients, or other units such as the PACU. Refs. [17,18] combine constraint programming and goal programming to assign surgical teams and block times with the goal of maximizing OR utilization while effectively balancing workload. Our research takes an integrated approach in assuming daily surgeon-patient-room assignments as given (by the hospital’s pre-schedule) and seeking the best sequence of these procedures across and within the ORs such that they can be performed unhampered by downstream capacity limitations, in the PACU, and/or wards.
Regarding research methodology and solution techniques, [12] identified thirteen categories dominated by mixed integer linear programming (MILP), heuristic algorithms, simulation, and integer programming (IP). Only four out of 170 papers employ a CP solution technique, as does our research, the oldest of these being from 2010. Of special interest is [19], which provides a comparison of MILP to CP for scheduling problems in operating theatres. Our research exploits certain advantages of CP such as enabling a compact and intuitive model formulation, the ease with which expressing multiple and complex constraints can be added, and computational efficiencies.
Whereas other mathematical programming techniques, such as mixed integer programming (MIP), can lead to exact ‘optimal’ solutions, or improved approximations thereof, we argue that optimality is not the ultimate promise in surgery scheduling, as the process involves many entities (patients, surgeons, support staff, and equipment) with uncertainty at every stage from preparation through procedure and recovery [5]. About two-thirds of papers reviewed in [12] employ deterministic models, while acknowledging uncertainty and generally accommodating it with some manner of time buffering. We take a similar approach, firstly, through using only specified allowable start times, and secondly, through hedging long on procedure and recovery duration estimates. To the extent that procedures are not on the long side of their estimates, cleanup time does not present a problem, and where procedures turn out to be longer than expected, cleanup can be accelerated relatively easily with the help of floating staff in the system.
In classifying reviewed articles according to the ‘applicability of research’, [12] identified a near-equal division of studies that used a theoretical data set versus those based on real data. Our model is parameterized from actual hospital data and is executed with a daily schedule as input using only data available to the scheduler prior to the surgery day. We also measure our model’s performance retrospectively, using actual procedure and recovery durations that become available on the day following surgery, whereupon we compare the day’s actual PACU load to what would have occurred with the actual task durations but following case sequences proposed by our model.
We note that 6 out of 115 articles reviewed in [10] address load levelling of the PACU, but in different planning contexts and settings than those we study, generally using different solution techniques and/or applying theoretical data rather than actual data. The articles that are most proximate to our research include [20,21,22]. The first of these applies theoretical data and a deterministic MIP for a master surgery-scheduling problem that considers the possibility of next-day surgical blocking by the PACU given the current state of occupancy in various units of the hospital. We instead use actual daily case mixes and seek to avoid the blocking of surgeries by the PACU indirectly, without specific knowledge of downstream unit occupancies. Retrospectively, we provide a tool to identify the frequency, timing, and location of these events to help characterize and remediate delays, according to what else had happened in situ or was happening elsewhere in the system to cause the delay. Ref. [21] employs a MIP and two-phase heuristic to determine surgeon-to-OR assignments followed by surgical case sequencing. We study a context where surgeons have pre-assigned OR time blocks and a pre-specified list of patient procedures to perform within those blocks. The work of Ref. [22] is similar to this article in subject matter and setting but uses MIP to level daily PACU loads, placing special emphasis on a machine learning model for more accurate prediction of procedure and recovery durations. We have much less about information available for such accurate predictions and instead emphasize the potential of intuitive and adaptable CP optimization, combined with process visualization, disaggregation, and iterative refinement, in spite of the vast uncertainties in perioperative care.
1.3. Problem Description
Figure 1 provides a global view of the perioperative system through which three basic categories of patients flow: one-day stay (ODS), same-day admission (SDA), and in-patients (IPs). At the highest level, ODS and SDA patients enter the system from outside the hospital through admission and preparation (A), whereas IP patients arrive from a hospital ward (B). As for departures, ODS patients leave through Day Surgery from whence they arrived (C and F), whereas SDA patients are transferred into a hospital ward (E), through which IP patients also return to their ward, although either may be transferred instead to an intensive care unit (ICU) bed.
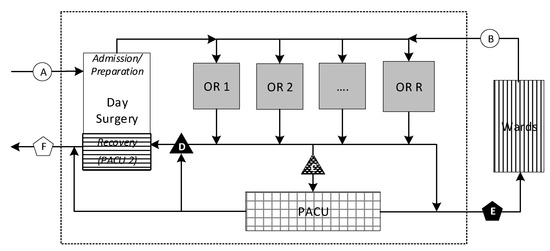
Figure 1.
Perioperative system flow.
At a more detailed level within the perioperative process, ODS patients follow one of three different paths involving recovery in either or both the PACU and Day Surgery, the latter referred to as PACU2 (D) in this context. SDA patients normally recover in the PACU before being transferred to a ward bed when one becomes available. IP patients often recover in the PACU but occasionally bypass it, returning directly to their ward bed. Similarly, some ODS patients may bypass the PACU if they require only minor recovery, which they can undergo in PACU2. Because our model addresses only elective cases, we make a conservative assumption that all surgeries will be followed by a PACU stay, as is most often the case. Some patients may be diverted rarely on a given day, but these cases will serve as a counterbalance to some of the added PACU load from unplanned emergent and urgent cases that arise.
The stage of perioperative flow of greatest concern to management (point ‘C’ in Figure 1) lies on the most common path followed by patients immediately after surgery. If this pathway is blocked, due to a PACU hold, a patient must remain under anesthesiologist surveillance in the OR, preventing room turnover and delaying the start of the next surgery. In these situations, the hospital incurs the opportunity costs of an idle and expensive room and OR team. Additional costs are incurred if overtime is required at the end of the day to make up for the delay or if surgeries have to be postponed. Surgeons lose some of their limited OR block time to perform revenue-generating (and backlog-reducing) activities. The health care system and patients awaiting treatment suffer, as fewer elective surgeries performed in a given day, week, month, and year translate into larger queues and longer wait-times.
Figure 2 shows several examples of patient flow. The characters in the ‘Flow’ and ‘Delay’ columns correspond to critical points in the process as depicted in Figure 1, that is, the path through which each example patient flowed and the location(s) at which they encountered any delays. The patterns within the timelines correspond to the various locations in Figure 1. We are concerned with delays both upstream and downstream from the PACU, as eliminating the latter can effectively eliminate at least some of the former. The downstream delays are represented in solid black, corresponding to the same format as points ‘D’ and ‘E’ in Figure 1, and these are delays in moving patients from the PACU to either PACU2 or to a ward bed. Checkered black intervals represent upstream delays moving patients into the PACU (at point ‘C’ of Figure 1) coming from any one of the ORs. Brief gaps between intervals correspond to the patient transit times and thereby separated time-stamp gaps in the hospital data.
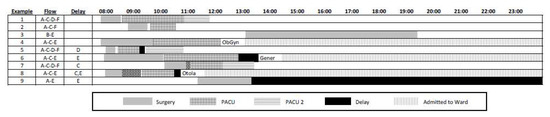
Figure 2.
Patient flow examples.
The hospital typically opens 15–17 ORs on weekdays, with 1–3 operating outside of the core scheduled surgery period of 8:00–18:00. ORs can run overtime, but the management of perioperative care has discretion to cancel a final OR procedure if it is deemed likely to induce substantial overtime. The number of scheduled surgeries per day at our partner hospital typically falls between 50 and 65, with 8 to 12 urgent or emergent (unscheduled) procedures added on most days.
The PACU is rarely empty as it often begins with an overnight patient trauma patient, or perhaps one from the previous day still waiting for a ward bed as in Ex. 9 of Figure 2. PACU occupancy rises quickly in the morning to roughly the number of open ORs as their first procedures are completed. It continues to rise through the mid-afternoon before declining rather slowly at the end of the day. This pattern stems from patient recoveries being on average longer than the associated procedure times or the OR service rate being greater than the PACU service rate; consequently, the PACU cannot release patients as quickly as it receives them, even in the best case without any downstream delays. Finally, as new PACU patient arrivals slow toward the end of the day, patients with long recoveries keep the PACU load from dissipating quickly. Finally, the unavailability of a ward bed or the inability to move a patient back to Day Surgery/PACU 2 will cause PACU occupancies to remain above manageable preferred levels.
2. Model Development
We develop a scheduling model aimed at mitigating the problem of blocking at points ‘C’ and ‘E’ (in Figure 1) in this complex and multidimensional system. Blocking at point ‘D’ can be addressed with simpler heuristics, as presented in the Section 3.4 of the paper. We begin through stating several assumptions, conventions, and simplifications that we use to provide for a tractable, generalized model that can be refined to accommodate a variety of additional constraints, as required.
2.1. Assumptions
First, we assume that procedure and recovery durations can be predicted with reasonable accuracy and are available well enough in advance to inform the scheduling of procedure sequences and start times. We note that [22] provide a compelling case for machine learning techniques to improve such time estimates; however, to take advantage of these methods, information systems and internal communication require more details about patients and procedures than are currently available at the hospital. As one example, we found that ASA scores (a measure of patient physical condition established by the American Society of Anesthesiologists (ASA)) could substantially improve recovery time estimates, but these are only determined just prior to surgery by the attending anesthetist and so are not useful in OR scheduling.
Second, we disregard unscheduled (trauma/priority) cases as they are difficult to anticipate and not known at the time of scheduling. We assume that managing scheduled cases to minimize likelihood of PACU blockages will better accommodate unscheduled cases as they arise. We also assume that all patients will recover in the PACU, despite this not being required in roughly 10% of cases, and thus serving to counterbalance the effect of not including unscheduled cases in our PACU load estimates.
Third, we assume that surgeons, OR teams, and patients are indifferent toward case sequence and timing, so long as the procedure will be done in the designated OR during the block surgery time allocated to the surgeon. However, we note that our model can be adapted to address specific needs or preferences regarding case sequencing if necessary.
Fourth, our objective is minimizing the total completion time (flow time) of all surgeries scheduled for the day. This is an appropriate collective goal, although it may not be individually the most preferred objective for every OR and surgeon involved.
Finally, we follow the convention that the hospital wishes to maintain scheduled start times only at :00 and :30 of the hour, and that OR cleanup (not including closure and setup) can generally be accomplished in 20 min or less.
2.2. Hospital Data
We obtained data regarding more than 27,000 surgical procedures performed at the hospital from 1 April 2017 to 31 March 2018 and developed two regression models for predicting procedure and recovery durations based on information available at time of schedule release (normally 2:00 p.m. on the afternoon of the day preceding surgery). We reserved four weeks of this data for testing our models and to provide a proof of concept. We later used the model repetitively over three weeks of surgical activity from 25 March to 12 April 2019 to pilot its use with actual daily schedules.
2.3. Procedure and Recovery Durations
We developed linear regression models to predict procedure and recovery times. In both regression models (Figure 3), the independent variables included initial OR time as booked by the surgeon (30 min increments), patient age, and surgical discipline (binary indicator variables). After some surgical discipline, binary variables were removed from the recovery model due to a lack of statistical significance. The model for procedure durations has an R-squared of 0.83 whereas the model for recovery durations is much less explanatory with an R-squared of 0.19. These two models provide a reasonable starting point for anticipating arrivals of patients into the PACU based on their procedure start times and to predict their length of stay in the PACU. We note that the standard error of both predictions is in the realm of 40 min, reflecting the substantial variability among cases, but this is a similar magnitude of error as reported elsewhere in the literature ([23,24]).
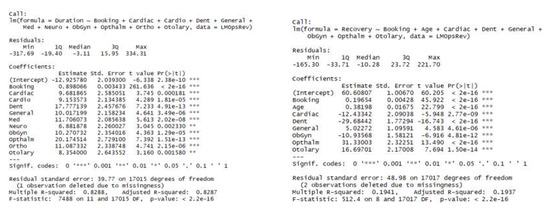
Figure 3.
Linear regression models for procedure and recovery durations.
Except for emergent cases, surgical ORs cycle through four states while they are open: setup, surgery, closure, and cleanup, where a patient’s stay in the OR coincides with all phases but the cleanup. Although we had access to hospital data that would allow us to distinguish between setup, surgery, and closure times, we treated them together as one procedure time estimate, both in formulating and applying the linear models and to predict procedure times. One exception is that if a PACU delay was indicated at the end of the procedure, we excluded closure time from the procedure duration and used it instead as a measure of PACU delay, even though some of this time would have in fact been required to close the procedure. Where no such delays occurred, as happened in the majority of ORs on most days, the sum of procedures times divided by total OR open time provides a direct measure of OR utilization.
2.4. Constraint Programming (CP) Model
We developed a CP model as detailed below using IBM’s ILOG CPLEX 12.9 CP Optimizer. Variable inputs to the model include a set of planned procedures for a given day with initial start times and booking durations as requested by the surgeon, along with procedure and recovery durations estimated using the linear models above. In addition to this procedure information, the model takes as input a set of OR block times which specify the surgical discipline to which the OR is allocated, and the opening and closing times within which the set of procedures must be scheduled.
2.4.1. Preliminaries
Model definitions are presented under the following groupings, after which we provide a model formulation and a discussion:
- Tuple Sets (Patients Rooms );
- Deducible Parameters and Relationships (Occupancy Durations , Assignment Matrix );
- Decision Variables;
- Interval (Occupancies , Patient PACU Occupancies , OR Occupied Times );
- Sequence (OR Loads , Patient Paths );
- Interval Parameters (OR Open Windows , Surgical Day Time );
- Setting Specific Parameters (Allowable OR Start Times , OR Cleaning Times );
- Intermediate Functions and Expressions (Patient PACU Pulse , Patient Flow Time );
- Objective Function.
Tuple sets provide for the simple extraction of model input data from the hospital’s pre-schedule. These data are processed into deducible parameters related to patient assignments to and durations in specific ORs and, subsequently, in the PACU (if required.) The ultimate decision variables fully specify a solution that is a feasible set of occupancy intervals (start-to-end times) of all patients in their respective ORs as well as in the PACU, as required. However, the time locations of these occupancy intervals are partially a function of complementary decisions regarding occupancy interval sequences. These interval sequences are determined for both sets of procedures within each room and each patient’s flow through the two-stage system. Additional parameters help to constrain the problem according to local practices, and additional functions translate any solution candidate set of interval decisions into metrics against which the objective is measured and optimized.
2.4.2. Some Properties
The interval decision variables and interval parameters defined below each possess the following properties:
- .start
- an integer value lying with a specified range ‘.in ..’ (see below)
- .end
- an integer value lying in the same specified range ‘.in ..’:
- .size
- an integer value representing the difference
- .optional
- a Boolean value (default: False) if interval not required in a solution
- .in ..
- a specified range constraining the above.
2.4.3. Tuple Sets
- a set of discrete ORs (operating rooms)
- the union of the set with the (a special room):
- For each we introduce a tuple of input data with the following
- .id
- key field
- .room
- OR # or
- .service
- name of the surgical group (e.g., Ortho)
- .open
- (.start) of first prescheduled surgical procedure
- .close
- (.start + .booking) of last prescheduled surgical procedure
- a set of patients on each of whom a surgical procedure is to be performed
- For each we introduce a tuple of inputs with the following properties:
- .patient
- key field
- .service
- name of surgical group performing the service
- .room
- OR # or ;
- .start
- prescheduled start time (e.g., 480 min = 08:00);
- .booking
- a pre-scheduled booking window (e.g., 30, 60, 120 min);
- .procTime
- the expected duration of the procedure;
- .recTime
- the expected duration of the patient’s recovery;
- .patient
- a real number lying in .
2.4.4. Deducible Parameters
- an integer representing the time a patient is expected to spend in room
- a matrix of dimensions with binary values:
2.4.5. Decision Variables
Intervals:
- an interval decision variable such that
- note:
- an interval decision variable representing the time a patient will occupy a bed in
- an interval decision variable representing the time during which room is expected to be open, beginning at and ending with the latest in that room
- an interval decision variable represent a patient’s total length of stay
Sequences
- a sequence decision variable on every ,
- such that and
- a sequence decision variable on ,
- such that and
We refer to as the load on room , and as the path of patient .
2.4.6. Interval Parameters
- an interval parameter representing the range
2.4.7. Setting-Specific Parameters
- a fixed range from 480..1440 (08:00 a.m.–24:00 p.m.)
- a step function which restricts possible start times of procedures
- a minimum allowable clean-up time gap between procedures
- sets of specifying minimum time between procedures in
- a maximum allowable number of patients in the PACU at any time.
2.4.8. Intermediate Functions and Expressions
- , the sum of patients in the PACU at points-in-time
- for all over minutes of the day.
- flow time for each patient, from the opening of
- for all their OR until the expected completion of their surgery completion, given the procedure start time in a proposed schedule solution.
- the earliest procedure start time in a room
- the latest procedure end time in a room.
2.4.9. Objective Function
- , the sum of patient flow times
Alternatively,
- the sum of patient flow times weighted by their respective precedence scores.
2.5. Formulation
s.t.
for all
for all , for all
In comparison with the two-part mixed integer program of [22] that has a similar objective of minimizing the squared PACU load, the advantage of more compact and intuitive CP formulations is clear, subject to some explanations for those unfamiliar with the special types of CP constraints used above. Note that the first five constraints apply to all patients, whereas the next three apply to all rooms excluding the PACU.
- (1)
- is the objective function minimizing total flow time.
- (2)
- specifies that decision intervals , which represent each patient’s total length of stay from the start of procedure to the end of recovery, must span their two occupancies in the OR and PACU.
- (3)
- specifies that the last (2nd) occupancy a patient’s path must be in the PACU, numerically the member of .
- (4)
- specifies no overlap between a patient’s occupancies in the OR and PACU.
- (5)
- complements both Equations (2) and (4) specifying further that the size of should exactly match the sum of the patient’s occupancies. A solution must have no delay between them.
- (6)
- specifies that the decision interval for each patient begins with PACU occupancy.
- (7)
- specifies that intervals in sequences cannot overlap and furthermore must be separated by at least a minimum clean time (for two patients with occupancies in a sequence .
- (8)
- specifies that room cannot start before the room’s block time opening .
- (9)
- specifies the latest any procedure can be expected to end is 20:00 p.m. (minute 1200).
- (10)
- requires that patient procedure scheduled starts are only at allowable times in .
- (11)
- specifies a peak number of patients in the PACU at any time cannot exceed an integer amount . This is initially set to a high number to ensure that it will not be binding and thus to discover the unbounded peak PACU expected from a solution with the best objective function value. is lowered incrementally through successive iterations of the model until its lowest possible value (with a feasible schedule solution) is achieved. We explain this more next.
2.6. Iterative Solution Approach
We use our model iteratively to generate a recommended schedule. Our iterative method works as follows.
- Solve the problem with an overly generous PACU capacity limit and the objective of minimizing total patient flow time, which also translates into minimizing total OR makespans.
- Determine the resulting expected peak PACU patient load, . Call this amount , being the threshold below which capacity has a negative effect, i.e., a restriction on flow time optimization. Set before proceeding to the next step.
- Invoke a PACU capacity constraint one less than the peak determined in the previous step; that is, set and re-solve for the objective of minimizing total patient flow time, subject to: .
- If a feasible solution is not found in the most recent step (3), accept the feasible solution found in the second-most recent step as the recommended schedule and stop. (In effect, after making one too many progressively constrained solve attempts, return to the last successful one.)
- Otherwise, a feasible solution was found in step 3, so repeat steps 3 and 4 until reaching a stop.
2.7. Discussion of Model Features
One of the features of our model is the creation of a binary matrix representing whether a patient requires service in each of the rooms . For each patient row of the matrix, there will be two columns with entry 1, one for a specific OR and the other for their PACU stay. This allows us to define the set of occupancy intervals for all patient and room combinations, while setting the irrelevant ones as optional and of zero duration .
Another is a set of intervals that serve as parameters for the block time windows that, despite being called a room in our model, may be one of multiple blocks within a single OR during a surgery day, each with its own time window .
We also introduce three active and interrelated interval decision variables for each patient. One represents specifically their stay in PACU, . Two other intervals represent the patient’s expected occupancies in two rooms, one of them being the same PACU stay and therefore exactly overlapping . Through defining two equivalent, parallel, and concurrent intervals, we can constrain them independently and/or in combination. For example, a patient’s path includes two intervals beginning with their surgical procedure in an OR, which must be followed immediately by their recovery in the PACU. The procedure alone is part of an operating room’s sequence, whose intervals cannot overlap, whereas the recovery alone is part of the PACU load, whose intervals are allowed overlap, as there are often numerous patients in the PACU concurrently.
The hospital schedules surgeries beginning at 08:00 a.m. (minute 480 of the day) on every weekday except Wednesday, on which they begin at 09:00 a.m. The latest scheduled OR booking ends at 20:00 p.m. (minute 1200 of the day), although 18:00 p.m. is when most ORs are expected to close each day. Any schedule solution must have interval decision variables that lie within the specified OR time windows . The upper bound of , midnight (minute 1440), is given to accommodate lengthy expected recoveries, especially if arriving toward the end of the OR day (maximum 1200.) The extra length of allows for extended PACU occupancies but has no impact on the model’s objective of minimizing the average OR makespan.
The decision expressions represent flow time for each patient. That is the length of time from the opening of the OR in which their surgery is performed until the expected completion of their surgery, assuming specified start time for their procedure in a solution. We note that it is a simple change in the CP model to calculate patient flow time using the expected completion of their recovery. However, our choice has an important and more direct effect on the objective function. The primary effect is to produce a schedule following a shortest processing time (SPT) heuristic [7], all else being equal; that is, OR sequences are initially scheduled in order of ascending duration within each room. However, as we incrementally constrain the peak PACU load, some value in the objective function is foregone, to allow for the shift of long surgery intervals forward and short surgeries backward within the room sequences, in order to eliminate PACU peaks.
Practically speaking, we are not concerned whether patients finish sooner or later on average in the day, as we understand that to them the day itself is/has been their only serious concern (with exceptions discussed below.) A more important effect of the objective function is to minimize the total flow time of patients as it is important to them as well as the hospital how many procedures can be performed in a given time, or conversely, in how little time a number of procedures can be performed, to reduce the incidence of overtime and perhaps create opportunities for additional surgeries.
To accommodate a requirement that procedures be scheduled to start only at specific times, as is currently standard practice at the hospital, we created the step function . We first chose a start frequency of 30 min (which could be changed as desired) and a range of start time epochs from 0 to 23 (such that 30 times 23 + 1 = 12 h from the start of the day.) We then generated an ordered set of tuples forming the basis of a step function which alternates from 0 (off) to 100 percent or 1 (on) every 30 min throughout the day. These tuples can be interpreted as 0 before 08:00 a.m., then 1 until 08:01 a.m., then 0 until 8:30 a.m., and so on. Constraint (9) prevents any OR occupancy from beginning whenever the step function has a value of 0, therefore allowing it to begin only at one time (minute) every 30 min.
To account for minimum changeover times between procedures in each OR, that is, to allow for cleaning, we first generated a set of triplets composed of two patient identifiers: effectively, the procedures ending and beginning in the OR changeover, followed by a constant minimum OR clean-up time . We chose this value despite the expected clean-up time requirement being between 10 and 20 min. We rationalize this in combination with the step functions that allow scheduled starts only at 30 min intervals. If one assumes a random uniform distribution of procedure end times over the minutes of any hour, imposing a minimum five-minute gap will result in a schedule gap of anywhere between 5 and 34 min before any subsequent scheduled start (at :00 or :30). Our assumption is that surplus and deficit cleanup times will offset each other in many cases or, in the worst case, cause only minor delays with no greater impact than already anticipated, stochastically, due to surgeries whose durations turn out to be unpredictably short or long. However, we recognize in the latter case that short scheduled clean-up times could compound problems from surgery time overruns.
We noted previously an alternate form for the objective function . This followed an initial review of our model with hospital perioperative management; they requested that some additional factors be incorporated in the model. The first related to the problem of ward beds often becoming available only late in the day, such that it is preferable for SDA patient procedures to be scheduled later, especially for services whose wards are most notorious in this regard. Secondly, since there are often delays in the preparation of very early ODS and SDA patients, as when they arrive late in the morning, preference should be given for inpatient surgeries to be scheduled in the early part of the day as they can be prepared quite early, being already in the hospital. The management team also suggested that younger patients should have surgical priority early in the day for two reasons. The first is that young pediatric patients are less tolerant of long flow times from arrival to completion, and the second is that recovery times tend to vary in proportion with age, so that younger PACU patients first means quicker bed turnover in the earlier part of the day for the PACU, which is helpful for mitigating patient load surges during the later peak hours.
Based on these inputs, we added the final property (.precedence) to the patient tuple described above, and we developed a simple method for translating patient factors into a single ordinal variable, regardless of whether these factors themselves may be binary, categorical, interval, or ratio in nature. For type of flow (ODS, SDA, IP), we begin through assigning the values (0, −1, 1), respectively, because we would like to advance IP procedures to earlier in the day and defer SDA procedures later. However, for patient age, we count infants as 1 and patients 100 or older as -1; then, for any patient, we use (1 − age/50) as a score in the range between (−1, 1). Referring to the resulting flow and age scores as and , we determine an aggregate precedence score using the expression , which then varies between [−2, 2], although it could easily be normalized and/or weighted differently for each underlying factor.
We note that a time interval for physical movements from the ORs to the PACU was not included in our model, as these are generally accomplished within a couple of minutes at the hospital, thanks to the physical design of the perioperative suite.
3. Results
3.1. Timeline Comparision
Figure 4 depicts the results of the iterative-CP-model-optimized solution in terms of expected patient loads in the PACU. It shows the average PACU patient loads by minute of the day across all sample days, expected if following the day’s pre-schedule versus expected if following the CP-optimized schedules on each day.
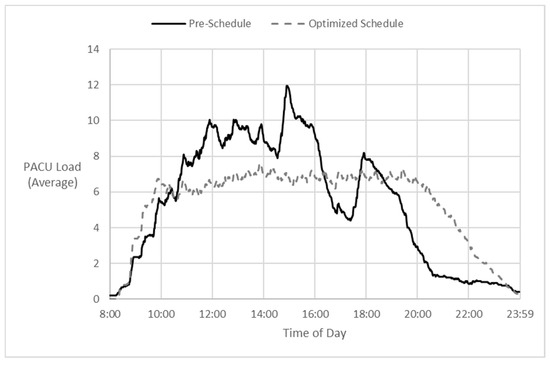
Figure 4.
Pre-schedule vs. model—forecast averages: patient load by time of day.
We modeled the expected peak PACU patient load given the established schedule for each day, using our estimated procedure and recovery durations, and assuming on-time starts. A surprising result was that in one-third of the days analyzed, the expected PACU peak from the ‘Pre-schedule’ was higher than what was expected from our unconstrained ‘CP optimized’ schedule. On only 40% of the days did the minimized patient flow time of the unconstrained CP-optimized schedule impose an increase in the expected peak PACU load beyond what it was already with the pre-schedule. Yet in those cases, the CP model could reduce expected patient flow time by an average of 15%. Overall, our model achieved an average 11% reduction in patient flow time at PACU load peaks that were equal to or less than those expected by following the pre-schedule, similar to the particular case depicted on the right side of Figure 5.
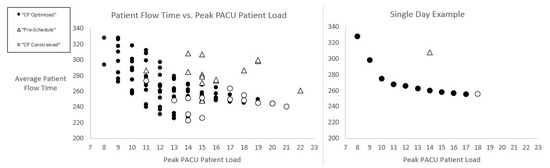
Figure 5.
Efficient frontier: average patient flow time vs. peak PACU patient load.
Figure 5 displays two scatterplots of average patient flow times versus peak PACU patient loads as predicted by our model. We show averages rather than the total flow time objective to normalize days with different numbers of patients. A comparison is made between pre-schedules as established by hospital surgeons and CP-optimized schedules as proposed by our model. On the right side of Figure 5 is an example of a single day for which the lowest average patient flow time of 260 min is expected from the unconstrained, ‘CP Optimized’ schedule (versus 310 min with the ‘Pre-Schedule’.) However, that schedule is expected to result in a peak PACU load of 18 patients at some point in the day. In contrast, the pre-schedule is expected to result in an average patient flow time nearly 20% higher (worse), but with a lesser (better) peak load of 14 patients in the PACU. Solid circles in Figure 5 represent a series of intermediate schedule solutions that constitute the frontier of lowest possible patient flow times and PACU peak loads. We obtained these through successively lowering in the constraint (10), as described in the Section 2 above.
We see in Figure 5 that a load equal to the pre-schedule expectation (14 in this example) is achieved with little increase in the average patient flow time (only 10 min higher than for the unconstrained optimized solution.) Furthermore, a one-third reduction in peak PACU patient load is apparently achievable with a resulting average patient flow time that is equal to that expected with the pre-schedule. A much greater (~45%) reduction in PACU peak load appears to be achievable with only a modest increase in patient flow time. The left side of Figure 5 shows a similar trend over our sample of testing days.
We conducted an ex post analysis using actual procedure and recovery durations in both the pre- and CP-optimized schedules. Figure 6 below shows two paired charts of PACU loads for a typical surgery day. The left side refers to the pre-schedule, and the right side refers to the CP-optimized schedule. On both charts, a solid line depicts the expected count of PACU patients as predicted by our model. The dashed line on the left depicts actual events (considering only scheduled patients) in the PACU that day. The dashed line on the right is slightly different, as we can only simulate what would have happened if the CP-optimized schedule had been adopted—using actual durations for both procedure and recovery, but with different timing.
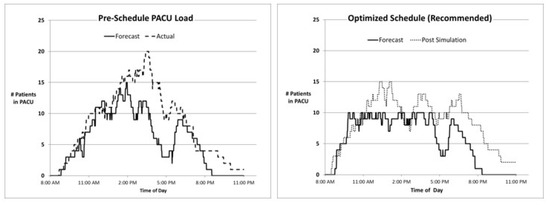
Figure 6.
Efficient frontier: average patient flow time vs. peak PACU patient load.
3.2. Flow and Occupancy Visualization Model
Unique durations were previously observable in the patient flow timelines of Figure 2. However, the nine discrete examples of flow delay shown in that figure represent fewer than half of the possible permutations when also considering actual versus scheduled procedure start times. (These features are included in the visualization model provided to the hospital, but not in Figure 2 or Figure 7, due to the complexity of depicting these additional elements in gray-scale.) As one example, we found several instances of OR delays in moving patients into the PACU that were arguably a result of the procedure starting earlier than scheduled, since these delays would not have occurred and would not have been recorded had the surgery started at the scheduled (later) time. We mention the latter point to emphasize that the assignment of responsibility for delays is not always straightforward, and that best outcomes are achieved when parties commit to the specific timing of their activities [25].
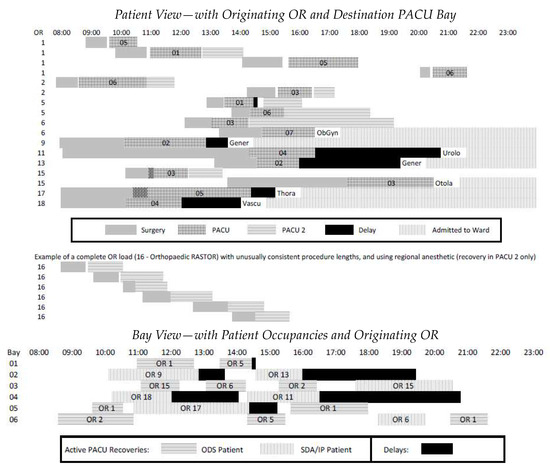
Figure 7.
Patient flow visualization: patient-OR view and PACU-bay view.
The aim of the patient flow visualization is to provide a systematic view of the process in spite of the uniqueness of a great many cases across many ORs. Effective management requires a clear understanding of both ‘the forest and the trees’, and appropriate aggregated levels between these extremes. The top of Figure 7 shows timelines for 16 patients passing through the first six PACU bays, shown at the bottom. They represent roughly a quarter of scheduled procedures on a sample day. Through cross-referencing the two views, it is straightforward to trace delays in the PACU to a patient’s destination ward (or PACU2) and to match OR delays with concurrent activity in the PACU.
The final six cases shown in the top of Figure 7 are examples of ODS patients who did not pass through the PACU, but rather had only minor recovery in PACU2. It happened on this sample day that OR 16′s caseload was a series of similar orthopedic procedures (a RASTOR room as described earlier), all performed under a regional anesthetic rather than a general one and therefore not requiring PACU recovery but PACU2 only. This example reinforces the value of characterizing ORs by their case loads to understand the impact of these loads on the PACU, i.e., the central stage of the system.
Whereas some OR blocks contain homogenous, predictable procedure lengths and flow patterns, others involve procedures that vary greatly in duration and patient type. These provide more opportunities to affect a different PACU load via re-sequencing cases, whether using something like our CP optimization model or heuristics such as the longest or shortest durations ‘first’ and/or SDA patients and oldest ones ‘last’. The incremental PACU impacts may vary markedly depending on the portion of patients receiving a regional versus general anesthetic (although, when both are practical, the choice is subject to patient agreement, and that is not always predictable.)
3.3. Other PACU Considerations
Although some perioperative units have explored the practice of pre-assigning PACU bays [26] prior to patient arrivals, this was not under consideration by the hospital at the time of our study. Management felt strongly that bay assignments were best allocated dynamically based on actual arrivals, especially considering the unpredictability of either arrival times or recovery lengths. Moreover, certain rules applicable to PACU nursing operations would need to be incorporated in any assignment algorithm. PACU bays were opened in pairs, with a single nurse assigned to both bays, for example, 07 and 08. A nurse should not receive two new patients within a span of 30 min. Also, a nurse should not have two SDA or IP patients at once, although one of either in addition to an ODS patient was acceptable (given that the latter were typically less complicated patients). Some pairs of PACU bays were reserved for pediatric patients, with very young patients requiring a fully dedicated nurse, sometimes with an additional nurse’s assistance.
Nevertheless, the PACU ‘Bay View’ of the patient flow visualization reveals important facts about the efficiency with which bays are utilized. For example, in the bottom of Figure 7, the last patient assigned to PACU bay 05 and the last two patients in bay 06 could have all been accommodated in bay 01, thereby allowing the third pair of bays (05 and 06) to be closed seven hours earlier through keeping the first pair of bays (01 and 02) open only two hours later. The four instances of extended wait for ward beds in PACU bays 02 and 04 should also warrant investigation, as the early vascular surgery SDA patient in OR 18 might better have been scheduled later in the day.
3.4. Discussion
The perioperative process includes a high degree of uncertainty and substantial inherent variety; consequently, there is no magic solution to ensure the smoothest and most efficient patient flow, particularly through the centralized PACU stage. However, despite the uncertainties, we believe much of the case variety that directly impacts timing and flow can be captured in modeling and optimization techniques that are reasonably accessible to practitioners and use operational data that is already being used in heuristic scheduling approaches.
Our choice of patient flow time as the performance metric (objective) for our CP optimization model may be challenged on the notion that patients who are waiting months for surgery might not care about how long a procedure takes on the day of surgery. However, this is a commonly applied metric in static scheduling problems when it is assumed, as in our case, that all jobs arrive simultaneously at the beginning of the scheduling period. Furthermore, through choosing the minimization of the total patient flow time as the objective, we are at the same time maximizing global OR utilization, i.e., through completing the given set of procedures within the least overall OR time.
Whether individual surgeons who control their own OR schedules can be convinced of the benefits of a more collective scheduling approach remains to be seen. Autonomy is a difficult thing to forego without a clear understanding of, and or certainty about, the personal impact of allowing someone else to decide the order in which patients should be treated. Surgeons have individual preferences, such as whether two similar procedures should be sequenced contiguously or not, and whether longer procedures are better performed earlier or later in the day. As a modeling platform, CP lends itself to the addition of constraints incrementally and with relative ease, as these specific surgeon needs arise.
The models we developed enable, within roughly one hour, the translation of schedules (in PDF, portable document format) into data input files for the CP model, the running of the model, and the output of a proposed alternate CP-optimized schedule for review, including, for each procedure, the direction and length of time of any proposed change in scheduled start time. In some cases, only a handful of changes in a few ORs are enough to reduce a projected peak in the PACU load by one or two patients. It was left to the perioperative management team to negotiate sequence changes with surgeons where they found them most compelling. A dominant factor in these decisions was whether a sequence change supported the precedence of patient types (young people will be treated earlier, and IP patients precede SDA patients) without blocking upstream patients from entering the PACU. It is for this reason that we provided the option of incorporating a precedence weighting factor to individual patient flow times in the alternate objective function, which we note can be easily tuned according to the relative importance of age versus flow, and other factors can also be added. The aim was to find a balance between the CP model recommendations based mainly on procedure times with qualitative factors of importance in patient sequencing.
The rapid translation of a pre-schedule to a CP-optimized schedule enabled management to spot improvement opportunities more quickly (moreover, to justify them as having been proposed objectively), as opposed to managers having to scan lists of five dozen procedures to identify these opportunities. Similarly, on the day following surgery, as actual time-stamp data became available for extraction, summary reports including patient flow visualizations like Figure 7 were constructed. These reports facilitated the timely and efficient reflection on the events of the previous day and allowed managers to identify and communicate where and when problems occurred, decisions that turned out to be positively or negatively impactful, and to assess the accuracy with which estimates had been made. The patient flow visualizations provided to the hospital include identifiers within the timelines that depict the model’s predictions of procedure times and durations (and where absent, indicating unscheduled cases whose impact could be assessed.) In many cases, the time predictions proved to be reasonably accurate, even when shifted in time due to other events. A rationale was sought in cases where time predictions proved to be inaccurate, including questions regarding how the predictive models could be improved. We note that aside from the CP model, which was developed in and for use with IBM ILOG CP Optimizer, other model components were developed in Excel VBA (Visual Basic for Applications), which was readily available to hospital management and staff and thereby facilitated implementation.
3.5. Opportunities for Further Research
We are not aware of any previous attempts to model the problem of assigning PACU bays while respecting constraints such as one nurse per two PACU bays, described in the previous section. We believe that these factors could be incorporated in an extended CP model, although doing so would amplify complexity without necessarily bolstering confidence in the accuracy of recovery time predictions. If such a model were to be dynamic and applicable in or near ‘real-time’ using updated data to plan PACU bay assignments forward in the day (subject to change), that could certainly enable higher occupation and patient flow, and thus the possibility of running multiple RASTOR rooms on some days, and thereby address the surgery backlog and wait-time problems in the system.
One of the challenges in developing solutions to perioperative patient flow problems is they are often setting-specific. Our partner hospital chooses to schedule procedure start times at :00 and :30, whereas another one can work in five-minute intervals. The hospital handles a lot of orthopedic, obstetric-gynecological, general, and pediatric procedures, whereas its other location handles a higher portion of neurology and cardiology patients. The compatibility of such different surgery block cases warrants exploration, including an assessment of the value of simple heuristics to the benefit of the system as a whole.
In this regard, our CP model can enable the simple translation of any hospital’s OR daily block schedule into a time-series prediction of PACU load across the day (a) as a basis for more sophisticated analysis of the PACU stage itself or (b) supporting any multi-OR scheduling study via assessing its downstream effect on the PACU.
Further research should aim to quantify the impacts of uncertain procedure durations and stochastic disruptions [27] in determining an optimal plan. Various CP solvers can be compared for performance, and decomposition methods [28,29] can be developed and compared. Open-source CP options should be investigated to lower financial barriers for hospitals seeking to implement and tune these scheduling technologies.
4. Conclusions
In this paper, we have extended the view of the perioperative process to distinguish between patients according to a variety of paths they follow, as in-patients, one-day surgeries, and same-day admissions. We have also introduced a constraint program to develop coordinated OR schedules aimed at minimizing peak patient loads in the PACU, to better ensure that OR delays will not be incurred due to the PACU reaching full capacity and being unable to accept new patients from the ORs.
The model required a mechanism to predict procedure and recovery times, and these are open to further refinement through improved data collection and methods such as machine learning. We have developed and described a model for patient flow visualization which can help perioperative care managers and surgeons to quickly locate problems in the time and stage of the process, to better understand the interactive effects of schedule sequence decisions, to propose additional practical factors that can be incorporated in the optimization model, and to provide a simple and common foundation for the ongoing review and refinement of OR scheduling practices.
Our model has contributed to organizational learning and improved communication and cooperation among the many parties involved in scheduling the ORs at the hospital. In a letter supporting our research, the management team wrote: “The Ivey research team has provided us important insight to the possibilities and significant potential benefits of adopting a more methodical and coordinated approach to daily OR scheduling. We look forward to the next phase of development in what we believe can be a valuable and implementable tool in streamlining the costs and timeliness of surgical operations, not only within ‘our hospital’ but throughout the health care system, if successful. In the meantime, we strongly support not only the research team’s continued work on our behalf, but also the sharing of their methods and conclusions (ongoing as they are) with members of operational research community focused on similar health care challenges.”
Author Contributions
Conceptualization, J.S.F.L. and M.A.B.; methodology, J.S.F.L., M.A.B. and P.C.B.; software, J.S.F.L.; validation, J.S.F.L. and M.A.B.; formal analysis, J.S.F.L., M.A.B. and P.C.B.; data curation, J.S.F.L.; writing—original draft preparation, J.S.F.L.; writing—review and editing, J.S.F.L., M.A.B. and P.C.B.; visualization, J.S.F.L.; supervision, M.A.B. and P.C.B.; project administration, M.A.B. and P.C.B. All authors have read and agreed to the published version of the manuscript.
Funding
This research received no external funding.
Institutional Review Board Statement
Ethical review and approval were not required for this study due to the absence of any medical or individually identifiable data of any kind in the study.
Informed Consent Statement
Not applicable.
Data Availability Statement
Upon request, data de-identified to a level suitable for public release may be provided after approval from the hospital.
Acknowledgments
The authors would like to thank the hospital for the support and collaboration in this research project.
Conflicts of Interest
The authors declare no conflict of interest.
References
- Ontario, H.Q. System Performance—Wait Times for Surgeries and Procedures; Health Quality Ontario: Toronto, ON, Canada, 2019.
- Available online: https://toronto.ctvnews.ca/ontario-releases-3-step-plan-to-invest-in-private-care-to-reduce-surgical-backlog-1.6232067 (accessed on 10 April 2023).
- Available online: https://globalnews.ca/news/9329715/ontario-long-waiters-pandemic-surgery/ (accessed on 10 April 2023).
- Duong, D. Provinces accept federal health funding deal. CMAJ 2023, 195, E344–E345. [Google Scholar] [CrossRef]
- Naderi, B.; Roshanaei, V.; Begen, M.A.; Aleman, D.M.; Urbach, D.R. Increased surgical capacity without additional resources: Generalized operating room planning and scheduling. Prod. Oper. Manag. 2021, 30, 2608–2635. [Google Scholar] [CrossRef]
- Santibáñez, P.; Begen, M.; Atkins, D. Surgical block scheduling in a system of hospitals: An application to resource and wait list management in a British Columbia health authority. Health Care Manag. Sci. 2007, 10, 269–282. [Google Scholar] [CrossRef] [PubMed]
- Nilsson, U.; Jaensson, M.; Dahlberg, K.; Hugelius, K. Postoperative Recovery After General and Regional Anesthesia in Patients Undergoing Day Surgery: A Mixed Methods Study. J. PeriAnesthesia Nurs. 2019, 34, 517–528. [Google Scholar] [CrossRef] [PubMed]
- Conway, R.W.; Maxwell, W.L.; Miller, L.W. Theory of Scheduling; Addison-Wesley Pub. Co.: Boston, MA, USA, 1967. [Google Scholar]
- Blake, J.T.; Carter, M.W. Surgical process scheduling: A structured review. J. Soc. Health Syst. 1997, 5, 17–30. [Google Scholar] [PubMed]
- Cardoen, B.; Demeulemeester, E.; Beliën, J. Operating room planning and scheduling: A literature review. Eur. J. Oper. Res. 2010, 201, 921–932. [Google Scholar] [CrossRef]
- Guerriero, F.; Guido, R. Operational research in the management of the operating theatre: A survey. Health Care Manag. Sci. 2011, 14, 89–114. [Google Scholar] [CrossRef]
- Gür, Ş.; Eren, T. Application of Operational Research Techniques in Operating Room Scheduling Problems: Literature Overview. J. Healthc. Eng. 2018, 5341394. [Google Scholar] [CrossRef]
- Sauré, A.; Begen, M.A.; Patrick, J. Dynamic multi-priority, multi-class patient scheduling with stochastic service times. Eur. J. Oper. Res. 2020, 280, 254–265. [Google Scholar] [CrossRef]
- Sang, P.; Begen, M.A.; Cao, J. Appointment scheduling with a quantile objective. Comput. Oper. Res. 2021, 132, 105295. [Google Scholar] [CrossRef]
- Batun, S.; Begen, M.A. Optimization in healthcare delivery modeling: Methods and applications. In Handbook of Healthcare Operations Management: Methods and Applications; Springer: New York, NY, USA, 2013; pp. 75–119. [Google Scholar]
- Begen, M.A.; Queyranne, M. Appointment scheduling with discrete random durations. Math. Oper. Res. 2011, 36, 240–257. [Google Scholar] [CrossRef]
- Gür, Ş.; Pinarbaşi, M.; Alakaş, H.M.; Eren, T. Operating room scheduling with surgical team: A new approach with constraint programming and goal programming. Cent. Eur. J. Oper. Res. 2022, 1–25. [Google Scholar] [CrossRef]
- Gür, Ş.; Eren, T.; Alakaş, H.M. Surgical operation scheduling with goal programming and constraint programming: A case study. Mathematics 2019, 7, 251. [Google Scholar] [CrossRef]
- Wang, T.; Meskens, N.; Duvivier, D. Scheduling operating theatres: Mixed integer programming vs. constraint programming. Eur. J. Oper. Res. 2015, 247, 401–413. [Google Scholar] [CrossRef]
- Abedini, A.; Li, W.; Ye, H. An Optimization Model for Operating Room Scheduling to Reduce Blocking Across the Perioperative Process. Procedia Manuf. 2017, 10, 60–70. [Google Scholar] [CrossRef]
- Bam, M.; Denton, B.T.; Van Oyen, M.P.; Cowen, M.E. Surgery scheduling with recovery resources. IISE Trans. 2017, 49, 942–955. [Google Scholar] [CrossRef]
- Fairley, M.; Scheinker, D.; Brandeau, M.L. Improving the efficiency of the operating room environment with an optimization and machine learning model. Health Care Manag. Sci. 2018, 22, 756–767. [Google Scholar] [CrossRef]
- Larsson, A. The accuracy of surgery time estimations. Prod. Plan. Control 2013, 24, 891–902. [Google Scholar] [CrossRef]
- Wright, I.H.; Kooperberg, C.; Bonar, B.A.; Bashein, G. Statistical modeling to predict elective surgery time. Comparison with a computer scheduling system and surgeon-provided estimates. Anesthesiology 1996, 85, 1235–1245. [Google Scholar] [CrossRef]
- Millstein, M.A.; Martinich, J.S. Takt Time Grouping: Implementing kanban-flow manufacturing in an unbalanced, high variation cycle-time process with moving constraints. Int. J. Prod. Res. 2014, 52, 6863–6877. [Google Scholar] [CrossRef]
- Dexter, F. Bed Management Displays to Optimize Patient Flow From the OR to the PACU. J. PeriAnesthesia Nurs. 2007, 22, 218–219. [Google Scholar] [CrossRef] [PubMed]
- Zacharias, C.; Liu, N.; Begen, M.A. Dynamic interday and intraday scheduling. Oper. Res. 2022. [Google Scholar] [CrossRef]
- Caglar Gencosman, B.; Begen, M.A.; Ozmutlu, H.C.; Ozturk Yilmaz, I. Scheduling methods for efficient stamping operations at an automotive company. Prod. Oper. Manag. 2016, 25, 1902–1918. [Google Scholar] [CrossRef]
- Caglar Gencosman, B.; Begen, M.A. Exact optimization and decomposition approaches for shelf space allocation. Eur. J. Oper. Res. 2022, 299, 432–447. [Google Scholar] [CrossRef]


Disclaimer/Publisher’s Note: The statements, opinions and data contained in all publications are solely those of the individual author(s) and contributor(s) and not of MDPI and/or the editor(s). MDPI and/or the editor(s) disclaim responsibility for any injury to people or property resulting from any ideas, methods, instructions or products referred to in the content. |
© 2023 by the authors. Licensee MDPI, Basel, Switzerland. This article is an open access article distributed under the terms and conditions of the Creative Commons Attribution (CC BY) license (https://creativecommons.org/licenses/by/4.0/).