Abstract
The limited availability of wind profile measurements has long hindered advancements in atmospheric modeling and our understanding of climate systems. The European Space Agency’s (ESA) “Aeolus” mission encountered this challenge with the groundbreaking introduction of space-based Doppler wind lidar technology, capable of providing Near-Real-Time wind profile data. The regional COSMO NWP model was utilized to demonstrate the potential of “Aeolus” in improving NWP model capabilities. The research focuses on analyzing the precipitation of the severe Hephaestion storm, which struck Greece in early January 2020, by comparing the performance of the NWP model with and without the assimilation of “Aeolus” data.
1. Introduction
The “Aeolus” mission (hereafter referred to as Aeolus), developed by the European Space Agency (ESA), was a groundbreaking Earth Explorer satellite. Launched into space on 22 August 2018 and retired on 30 April 2023, it was designed to improve global weather forecasting by delivering the first-ever direct wind profile measurements from space using a spaceborne ultraviolet Doppler lidar system [1]. By integrating the data provided from the Aeolus satellite, the European Centre for Medium-Range Weather Forecasts (ECMWF) played a significant role in the Aeolus project, particularly in terms of data assimilation and towards the improvement of operational forecasting [2,3]. A consequent effort is made in this work through the implementation of the latest version of COSMO.v6 numerical weather (NWP) prediction model [4,5] over the Hephaestion storm that was developed over 5–6 January 2020, causing significant disruptions over Greece. The Hephaestion storm was a severe weather event for Greece in early January 2020, characterized by an intense low-pressure system that brought heavy rain and strong winds to the region. The event underscored the importance of accurate forecasting in anticipating the impacts of such systems on local weather and infrastructure. The general synoptic features around the peak of the storm and the accumulated precipitation are presented, comparing two model runs in hindcast mode forced by 6 h ECMWF analysis with and without Aeolus assimilated data, denoted as hls0 and hlpv, respectively. A comparison with observations is given with respect to the accumulated precipitation recorded by the available Greek synoptic meteorological stations. This study aims to assess the added value of assimilating Aeolus wind observations in the short-term forecasting of a high-impact weather event using a regional NWP model. Specifically, we investigate the influence of Aeolus data on precipitation forecasts during the Hephaestion storm over Greece by comparing model simulations with and without Aeolus wind assimilation, using the COSMO.v6 NWP model.
2. Data and Methodology
2.1. On the Aeolus Mission and Data
The present work is based on the data provided by the Aeolus satellite, launched on 22 August 2018, and lasted approximately three years as part of the ESA Earth Observation program. Aeolus was the first mission of its kind, with the objective to fill the gap of atmospheric wind measurements, especially in the middle and lower layers of the troposphere [6]. The satellite was equipped with the Atmospheric Laser Doppler Instrument (ALADIN), a powerful Light Detection and Ranging (LIDAR) transmitter designed to provide detailed wind profile measurements from the surface up to the lower stratosphere (~30 km). As the mission’s primary instrument, ALADIN operated in the ultraviolet spectrum, probing the atmosphere by emitting laser pulses at 354.8 nm and 50.5 Hz [7]. It captured the backscattered light resulting from Rayleigh scattering by air molecules and Mie scattering from aerosol particles and cloud droplets. The Rayleigh channel, using a Double Fabry–Pérot spectrometer, analyzed the molecular backscatter, while the Mie channel, with a Fizeau spectrometer, focused on particulate backscatter. Both channels measured the Doppler shifts caused by atmospheric motion to determine wind speeds. ALADIN processed signals in 24 adjustable vertical bins, increasing in size with altitude, allowing customized wind profiles across different atmospheric regimes. The primary objective was to improve the performance of the NWP models by assimilating these valuable data, reducing uncertainties caused by the lack of observations, especially in remote regions. These areas are often linked to severe weather events like cyclones and storms, making accurate forecasting crucial. The evaluations of ALADIN’s design, functionality, and achievements, along with its laser transmitter–receiver optics, have been addressed in the above studies as well as references therein, in detail.
2.2. The Hephaestion Storm and COSMO Model Set Up
The storm that affected Greece from 5 to 7 January 2020, known as Hephaestion or Ifaistionas, was characterized by an intense low-pressure system that brought heavy precipitation and strong winds to southeastern Europe, moving eastward towards Greece. Surface analyses indicated a marked pressure gradient, contributing to strong winds, especially along coastal areas. Upper-level charts showed a pronounced trough at 500 hPa, with associated cold air advection at 850 hPa, enhancing convective activity and precipitation over the affected regions. A highlight of this synoptic situation is presented in the upper panel of Figure 1 on 6 January 2020 at 00 UTC, initialized from the hls0 analysis of ECMWF, around the peak of the storm conditions over Greece. In the lower panel of this figure, the corresponding temperature and wind speed differences between hls0 and hlpv are also given, along with the isolines of geopotential height at 500 and 850 hPa and mean sea level pressure. Although the isolines between hls0 (black) and hlpv (green) are very close, making visual distinction difficult, the color-shaded temperature and wind fields showed clear differences for the corresponding model runs. The study used the latest version of the COSMO.v6 NWP model to explore the differences between hls0 and hlpv analysis over the wider Mediterranean region, as shown in Figure 2a. Although it has been gradually replaced by the ICON model since 2022, COSMO remains a high-standard tool after 25 years of development, particularly recognized for its advanced physical parameterizations and model sensitivity. The model was run at high spatial resolution (~3.5 km) with 60 vertical levels, using ECMWF hls0 and hlpv analysis data, available in six-hour intervals for a 48 h period starting at 00 UTC on 5 January 2020, when Hephaestion storm was most active over Greece.
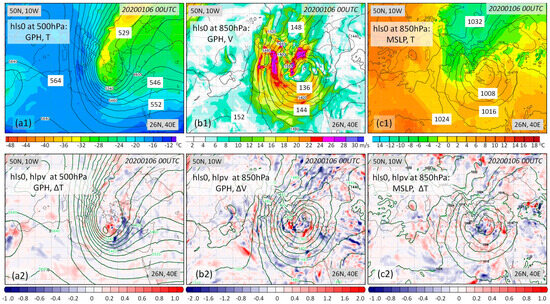
Figure 1.
Upper panel: (a1) 500 hPa geopotential height contours at 3 dam intervals and temperature in °C; (b1) 850 hPa geopotential height contours at 2 dam intervals and wind in m/s; (c1) MSLP contours at 4 hPa intervals and 850 temperature in °C; these graphs refer to runs with Aeolus data (hls0) assimilated data. Lower panel: (a2) 500 hPa geopotential height contours at 3 dam intervals and temperature differences in °C; (b2) 850 hPa geopotential height contours at 2 dam intervals and wind differences in m/s; (c2) MSLP contours at 4 hPa intervals and 850 temperature differences in °C; the black and green contours refer to runs assimilated with and without Aeolus data assimilation, hls0 and hlpv, respectively, with the differences referring to hls0−hlpv. All the graphs refer to 00+ 24 h forecast time of the model runs, corresponding to 6 January 2020: 00 UTC.
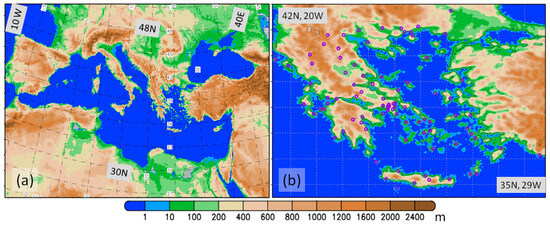
Figure 2.
(a) Integration domain of COSMO model; (b) Positions of the Greek meteorological stations.
3. Results and Discussion
In analogy to Figure 1, the COSMO model was realized in two runs forced by ECMWF analysis with (hls0) and without (hlpv) Aeolus data assimilation. In the upper panel graphs of Figure 3, the accumulated precipitation is presented for the three critical 12 h intervals of the 48 h hls0 run, over which the storm mostly affected Greece. These intervals are 6–18 h, 18–30 h and 30–42 h, which show the progression of extreme precipitation moving from northwestern to southeastern parts of the country.
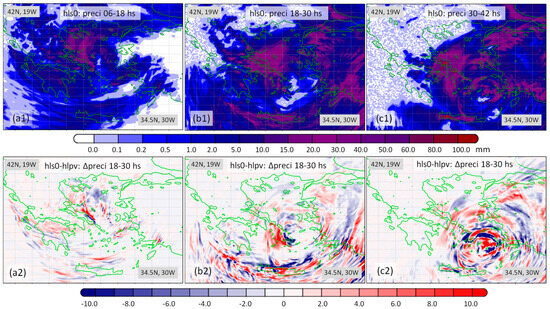
Figure 3.
The upper row graphs refer to the 12 h accumulated precipitation in mm, from the (a1) 6th to the 18th hour of the model run; (b1) 18th to the 30th hour of the model run; (c1) 30th to the 42nd hour of the model run. The graphs refer to runs assimilated with Aeolus data (hls0). The lower row graphs (a2–c2) refer to the corresponding differences (Δpreci) between the runs assimilated with and without Aeolus data (hls0−hlpv), respectively.
These time intervals refer to the measured accumulated precipitation of the available Greek synoptic meteorological stations. Their geographical locations are shown in the area of interest (Figure 2b). The corresponding differences in accumulated precipitation between hls0 and hlpv runs are quite noticeable on the scale of 10 mm and are illustrated in the lower panel graphs of Figure 3. These differences justified an overall comparison with the available synoptic observations for the period between the 6th and the 42nd hour of the model run.
This analysis was carried out in analogy to our previous work on Medicane IANOS [8], by comparing the Equivalent Threat Scores (ETSs) for precipitation thresholds of 0.1, 1.0, 5.0, 10.0, and 20.0 mm between the hls0 and hlpv simulations (see Figure 4). For all thresholds, the run with the assimilated Aeolus data (hls0) preponderated. Thus, the assimilation of Aeolus wind observations into the NWP model might significantly enhance the model’s capability to accurately simulate the spatial and temporal distribution of precipitation. The resulting improvements in forecast skill contribute to increased reliability in predicting high-impact weather events. This advancement is particularly significant for the early detection and continuous monitoring of severe phenomena such as storm Hephaestion, thereby strengthening the potential for risk management and emergency response planning.
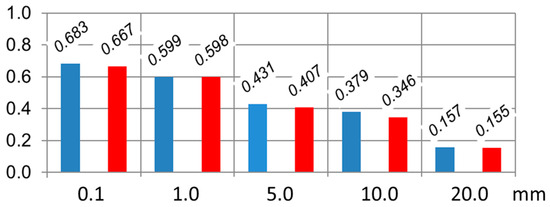
Figure 4.
The equitable threat scores of the 36 h accumulated precipitation (6 to 42 h) of the model runs with (hls0—blue columns) and without (hlpv—red columns) assimilated Aeolus data.
Author Contributions
Conceptualization, E.A. and I.M.; methodology, E.A., I.M., I.P. and P.N.; validation, E.A.; formal analysis, E.A. and I.P.; investigation, E.A.; resources, E.A. and I.P.; data curation, E.A.; writing—original draft preparation, E.A. and I.M.; writing—review and editing, E.A., I.M., I.P. and P.N. All authors have read and agreed to the published version of the manuscript.
Funding
This research received no external funding.
Institutional Review Board Statement
Not applicable.
Informed Consent Statement
Not applicable.
Data Availability Statement
No new data were created.
Acknowledgments
We would like to express our deep appreciation to the European Organisation for the Exploitation of Meteorological Satellites (EUMETSAT), the European Space Agency (ESA), and the European Centre for Medium-Range Weather Forecasts (ECMWF) for providing invaluable data that has been used in our simulation, and HNMS for providing the computational resources to the ECMWF supercomputing system.
Conflicts of Interest
The authors declare no conflicts of interest.
References
- Stoffelen, A.; Marseille, G.J.; Bouttier, F.; Vasiljevic, D.; de Haan, S.; Cardinali, C. ADM-Aeolus Doppler wind lidar observing system simulation experiment. Q. J. R. Meteorol. Soc. 2006, 132, 1927–1947. [Google Scholar] [CrossRef]
- Rennie, M.P.; Isaksen, L.; Weiler, F.; de Kloe, J.; Kanitz, T.; Reitebuch, O. The impact of Aeolus wind retrievals on ECMWF global weather forecasts. Q. J. R. Meteorol. Soc. 2021, 147, 3555–3586. [Google Scholar] [CrossRef]
- Rennie, M.P.; Isaksen, L. The NWP Impact of Aelus Level-2B Winds at ECMWF. Technical Memo 864. 2020. Available online: https://www.ecmwf.int/sites/default/files/elibrary/2020/19538-nwp-impact-aeolus-level-2b-winds-ecmwf.pdf (accessed on 18 June 2025).
- Steppeler, J.; Doms, G.; Schaettler, U.; Bitzer, H.W.; Gassmann, A.; Damrath, U.; Gregoric, G. Meso-gamma scale forecasts using the nonhydrostatic model LM. Meteorol. Atmos. Phys. 2003, 82, 75–96. [Google Scholar] [CrossRef]
- Available online: http://www.cosmo-model.org/content/model/cosmo/coreDocumentation/default.htm (accessed on 18 June 2025).
- Lux, O.; Wernham, D.; Bravetti, P.; McGoldrick, P.; Lecrenier, O.; Riede, W.; D’Ottavi, A.; De Sanctis, V.; Schillinger, M.; Lochard, J.; et al. High-power and frequency-stable ultraviolet laser performance in space for the wind lidar on Aeolus. Opt. Lett. 2020, 45, 1443–1446. [Google Scholar] [CrossRef] [PubMed]
- Lux, O.; Lemmerz, C.; Weiler, F.; Kanitz, T.; Wernham, D.; Rodrigues, G.; Hyslop, A.; Lecrenier, O.; McGoldrick, P.; Fabre, F.; et al. ALADIN laser frequency stability and its impact on the Aeolus wind error. Atmos. Meas. Tech. 2021, 14, 6305–6333. [Google Scholar] [CrossRef]
- Avgoustoglou, E.; Matsangouras, I.; Pytharoulis, I.; Nastos, P. Aeolus Data Validation for an Extreme Precipitation Event in Greece with the COSMO NWP Model. Water 2023, 15, 3820. [Google Scholar] [CrossRef]


Disclaimer/Publisher’s Note: The statements, opinions and data contained in all publications are solely those of the individual author(s) and contributor(s) and not of MDPI and/or the editor(s). MDPI and/or the editor(s) disclaim responsibility for any injury to people or property resulting from any ideas, methods, instructions or products referred to in the content. |
© 2025 by the authors. Licensee MDPI, Basel, Switzerland. This article is an open access article distributed under the terms and conditions of the Creative Commons Attribution (CC BY) license (https://creativecommons.org/licenses/by/4.0/).