Article

Fault Characterization of a Proton Exchange Membrane Fuel Cell Stack

Department of Energy Technology, Aalborg University, 9220 Aalborg Øst, Denmark
*
Author to whom correspondence should be addressed.
Energies 2019, 12(1), 152; https://doi.org/10.3390/en12010152
Submission received: 12 December 2018 / Revised: 27 December 2018 / Accepted: 31 December 2018 / Published: 2 January 2019
(This article belongs to the Special Issue Fuel Cell Systems Design and Control)

Abstract

:
In this paper, the main faults in a commercial proton exchange membrane fuel cell (PEMFC) stack for micro-combined heat and power ( μ -CHP) application are investigated, with the scope of experimentally identifying fault indicators for diagnosis purposes. The tested faults were reactant starvation (both fuel and oxidant), flooding, drying, CO poisoning, and H2S poisoning. Galvanostatic electrochemical impedance spectroscopy (EIS) measurements were recorded between 2 kHz and 0.1 Hz on a commercial stack of 46 cells of a 100- cm 2 active area each. The results, obtained through distribution of relaxation time (DRT) analysis of the EIS data, show that characteristic peaks of the DRT and their changes with the different fault intensity levels can be used to extract the features of the tested faults. It was shown that flooding and drying present features on the opposite ends of the frequency spectrum due the effect of drying on the membrane conductivity and the blocking effect of flooding that constricts the reactants’ flow. Moreover, it was seen that while the effect of CO poisoning is limited to high frequency processes, above 100 Hz, the effects of H2S extend to below 10 Hz. Finally, the performance degradation due to all the tested faults, including H2S poisoning, is recoverable to a great extent, implying that condition correction after fault detection can contribute to prolonged lifetime of the fuel cell.

1. Introduction

Proton exchange membrane (PEM) fuel cells have been extensively characterized under various operating conditions in the literature [1,2,3]. Despite the improvements made in understanding their behavior, fuel cells are yet to meet the durability and reliability requirements to replace traditional technologies, both for automotive and stationary applications. The cost of fuel cell systems is also still high, for-example the cost of an automotive fuel cell system at 500,000 systems per year was 53 $/ kW e in 2016 compared to the ultimate United States Department of Energy (DOE) system cost target of 30 $/ kW e [4].
Therefore, to reduce maintenance cost and improve reliability and durability, it is crucial that sudden system failures due to prolonged operation under faulty conditions are avoided. This can be achieved through prognostics that include health-monitoring, online diagnostics, and remaining useful lifetime prediction [5,6,7]. A robust diagnostics system starts with thorough characterization and identification of fault features and, with proper integration with the system control, can alleviate the faults before system failure happens.
Since the fuel cell stack used in this work is designed for μ -CHP application, only faulty operating conditions relevant for stationary applications are considered. These include reactants’ starvation (fuel and oxidant), water management issues (flooding and drying), and reformate impurities (CO and H2S) in the fuel. Reactant starvation, caused by external factors, such as reformer or compressor malfunction or internal factors such as poor water management and channel blocking, can cause irreversible damages to the fuel cell, if not identified and corrected in time. It is also reported that fuel starvation could occur at the fuel cell outlet due to hydrogen crossover caused by start/stop cycling [8]. Reactant starvation can lead to cell reversal, where the cell voltage becomes negative, and it consumes energy instead of supplying it, thereby corroding the carbon-based parts of the affected cell and the surrounding cells [1,9]. Therefore, monitoring reactants’ starvation closely and detecting the phenomenon early can help prevent irreversible damage from happening.
In Nafion®-based fuel cells, where liquid water is the main proton conduction medium, hydration level is a crucial parameter for an efficient operation. On the one hand, drying can decrease the proton conductivity of the membrane, cause mechanical stresses that can induce membrane cracking, and can also enhance the chemical degradation, which can quickly result in delamination and pinhole formation in the case of severe drying [10]. On the other hand, flooding can block the flow channels and the pores in the gas diffusion layer, thereby increasing the mass transport resistance [11,12,13,14].
Electrochemical impedance spectroscopy (EIS) has been used to study the effects of drying and flooding of PEM fuel cells [15,16,17]. Mérida et al. [15] found that the dehydration effects are seen in the high frequency end of the spectra (0.5–100 kHz), while flooding is observed at the low frequency end (0.5–100 Hz). Other techniques for the diagnosis of drying and flooding include current interrupt and the equivalent circuit model [18] and using the current ripple introduced by switch mode converters to identify the FC impedance in the high frequency region to obtain ohmic resistance of the fuel cell, which is a good indicator of the water content of the membrane [19].
Finally, impurities in the reactants can cause severe performance degradation in PEM fuel cells, especially when the hydrogen is derived from the reforming of hydrogen-rich compounds, such as hydrocarbons and alcohols. Even though there are clean ways of producing hydrogen, such as water electrolysis from renewable electricity, currently, the main source of hydrogen is steam reforming of hydrocarbons, especially natural gas. More specifically, up to date, hydrogen is produced from 48% from natural gas, 30% from heavy oils and naphtha, and 18% from coal [20]. The hydrogen produced from these sources contains small amount of CO, and traces of H2S could be present in natural gas reformate, which are both known to attach preferentially to the Pt electrocatalyst of PEM fuel cells and take up useful reaction sites [21,22,23,24]. CO poisoning is highly recoverable through air-bleed or neat hydrogen operation and can be alleviated by increasing temperature and relative humidity [25]. H2S, however, is reported to cause irreversible loss of catalytic activity towards the hydrogen oxidation reaction (HOR), with some reporting partial recovery through air-bleed, neat hydrogen, and electrochemical oxidation through voltage cycling [26,27,28].
In this work, the main PEM fuel cell faults were characterized with the scope of identifying characteristic signatures that can be used for diagnostic purposes. This paper, after describing the experimental setup and the fault characterization test procedures, presents the distribution of relaxation times (DRT) analysis of the EIS data for the tested faults. EIS was chosen because other than being the most common diagnostic tool for PEM fuel cells, it has the advantage in that the sinusoidal perturbation signals used to excite the fuel cell stack are generally small, and therefore, parametric changes and degradation can be identified without the influence of the measurement technique on the acquired data. This is an important trait for a diagnostic tool for on-board applications, proving the potential for EIS to be implemented on commercial systems [29].

2. Methodology

The framework of the current work in relation to the overall development process of diagnosis tools for PEM fuel cells is shown in Figure 1. Generally, the process is an iteration among the different steps, where the defined faults are tested experimentally for feature extraction, and the data are then used to develop fault detection and isolation (FDI) algorithms that are implemented on board systems for diagnosis. The experimental setup used in this work, along with the test procedures and the data analysis techniques are described in this section.
In this work, fault is any non-ideal operating condition whose prolonged state in a fuel cell stack is a potential cause of failure. Therefore, it should be noted that it is not the failures that have been induced, but simply the operating conditions were moved away from the nominal conditions. This way, the extracted features of the faults can be used in an algorithm to detect the faults before system failure.

2.1. Experimental

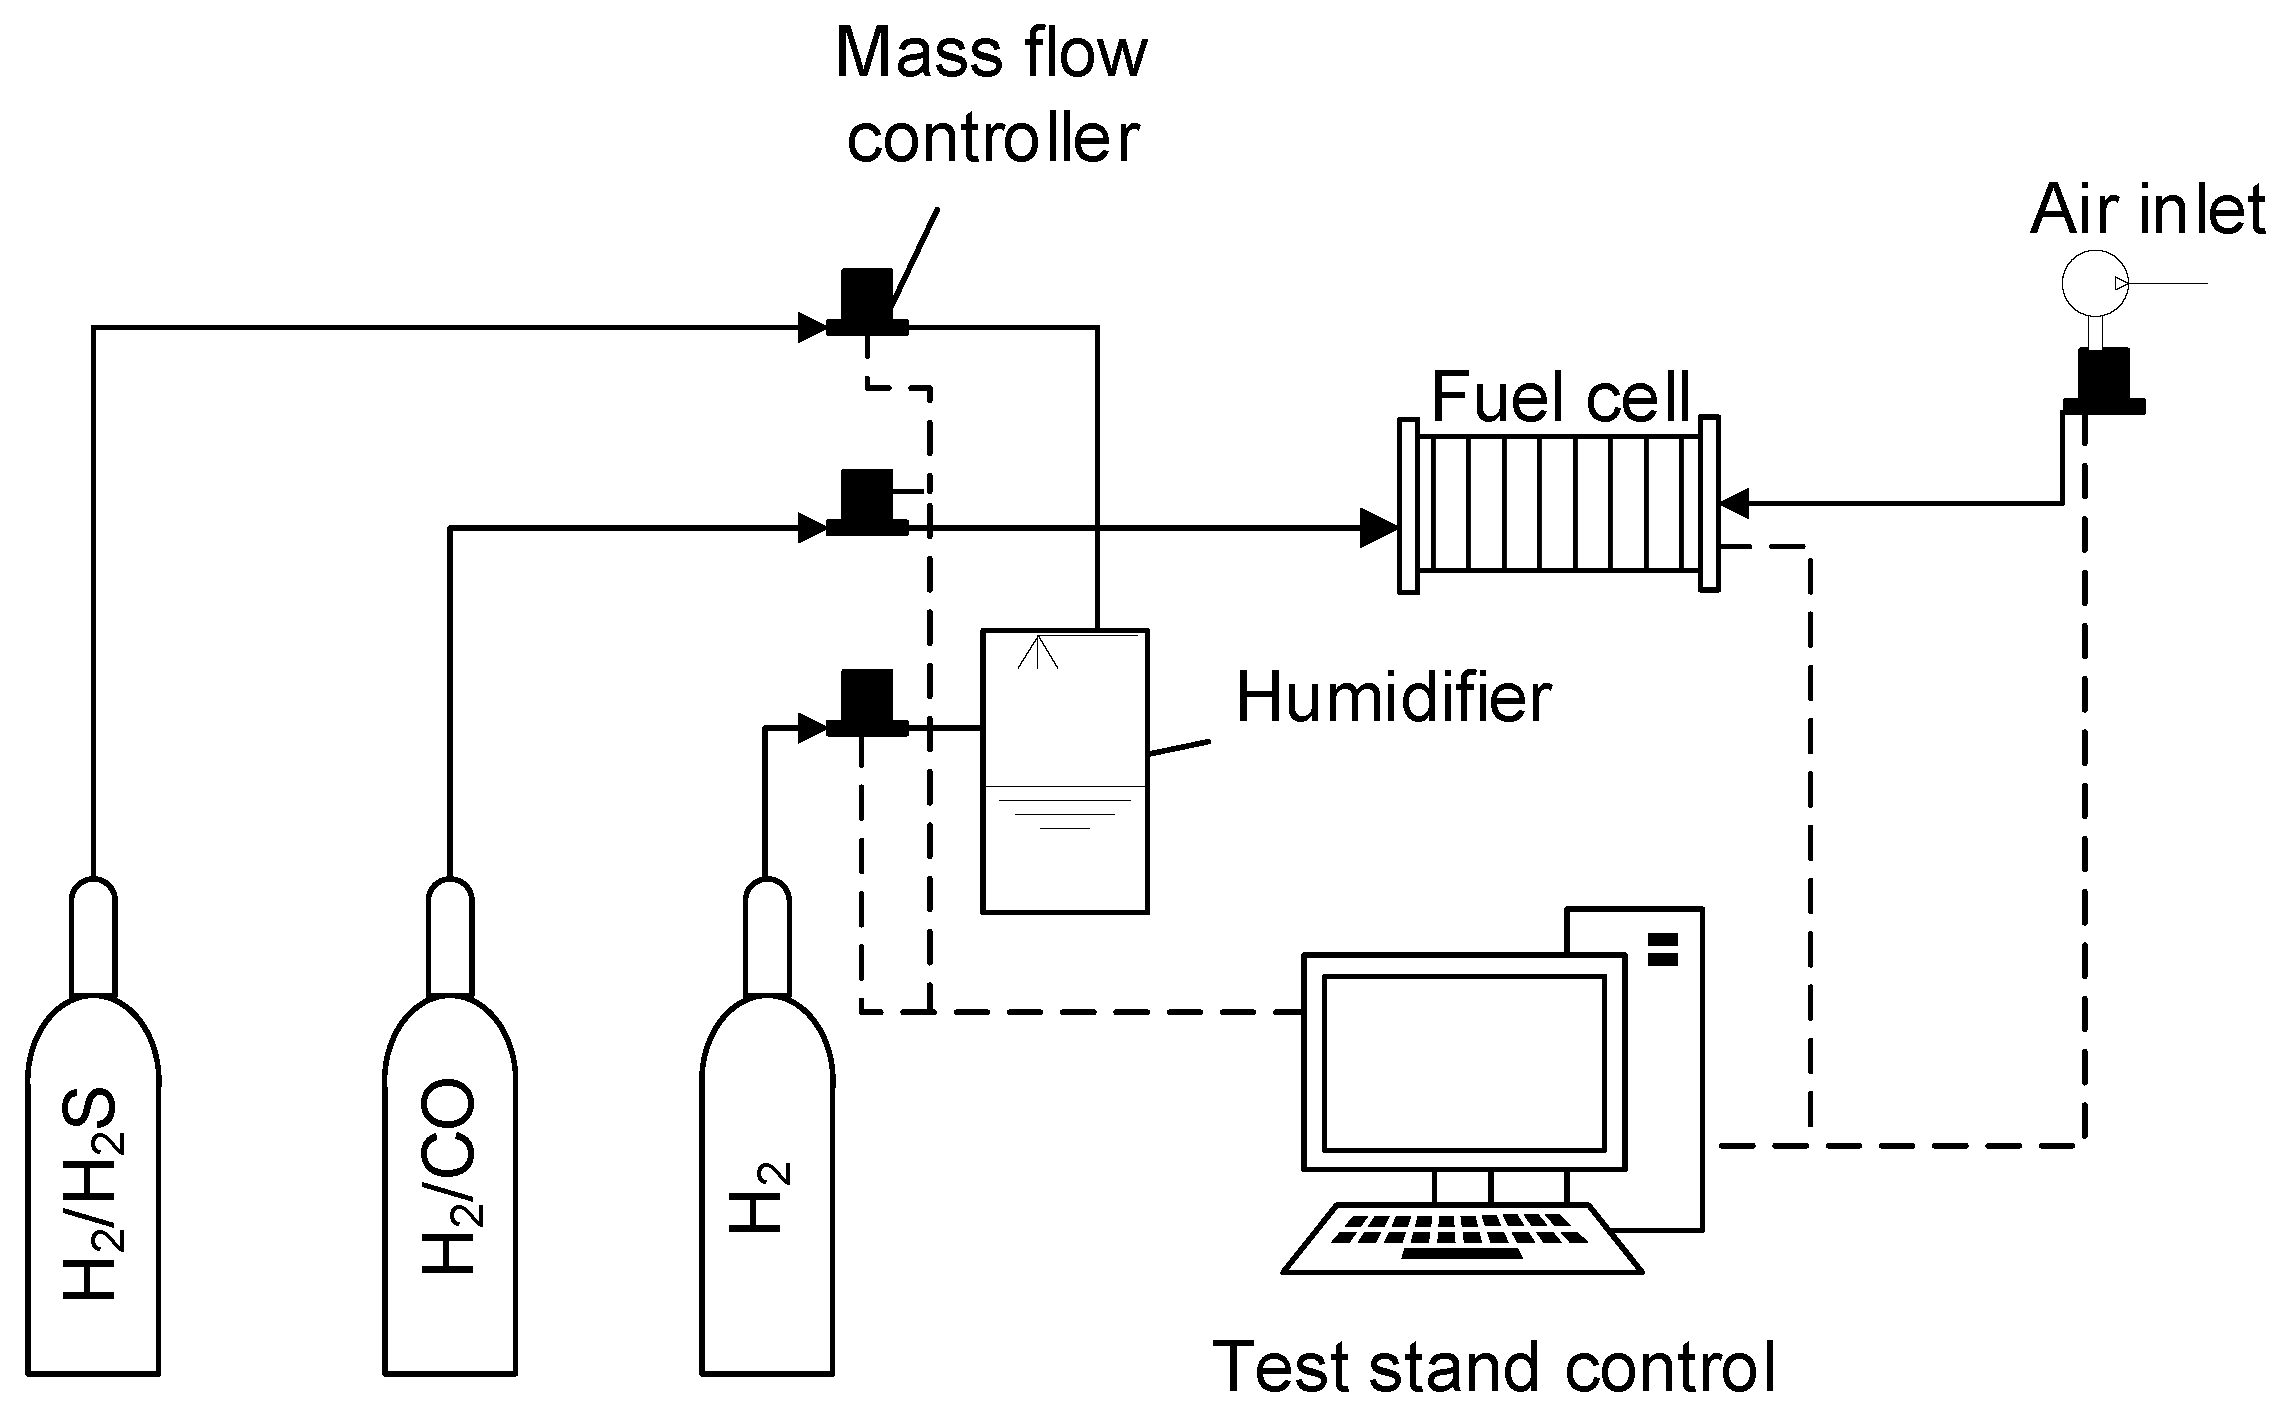
The tests were performed on a Greenlight Innovation test stand. A commercial water-cooled PEM fuel cell stack for μ -CHP application with 46 cells of a 100-cm 2 active area was used. A schematic of the test setup is shown in Figure 2. Galvanostatic EIS sweeps in the frequency range of 2 kHz and 0.1 Hz were recorded using an in-house-built frequency analyzer, at an AC amplitude of 1.5 A. To minimize measurement errors, two impedance spectra were recorded at each operating condition.

2.2. Test Procedures

Every fault test was preceded by a one-hour preconditioning step at nominal condition (60 C , 40 A, hydrogen stoichiometric ratio, λ H 2 = 1.3 , air stoichiometric ratio, λ a i r = 2 , and 100% relative humidity (RH) on both anode and cathode inlets). Then, polarization curves and EIS measurements were recorded before every fault test to monitor the performance of the fuel cell stack at the beginning of test (BOT). Test procedures prepared by the European project, StackTest [30], were used for polarization curves, where current was descended from the maximum to minimum value and then ascended back to the maximum value. Finally, the average of the descending and ascending polarization curves was used as the steady state polarization curve.
The fault levels were varied from the lowest to the highest intensity level, according to recommendations from the above-mentioned European test procedures and the literature [30,31]. The test matrix with the different intensity levels for the selected faults is given in Table 1.
The faults that were expected to have the least detrimental effects on the fuel cell stack performance and whose effects were highly recoverable were performed before the ones with a lower degree of degradation recovery. During the tests, only the parameter related to the tested fault was allowed to change, while all other parameters were kept at nominal condition. At the end of each fault test, an end of test (EOT) EIS was recorded at nominal operating conditions, and polarization curves were then recorded after one hour of the reconditioning step at nominal conditions.
Since the effects of H2S are suspected to be exacerbate significantly with time if not interrupted immediately, to test for the accumulation effects of H2S poisoning, a second fuel cell stack of identical characteristics was tested at 6 ppm, 8 ppm, and 10 ppm of H2S concentrations. In this case, 6 EIS spectra per set point were recorded, with a reconditioning step using air-bleed after the third EIS spectrum to check for performance recovery.

2.3. Data Analysis

Equivalent circuit model (ECM) fitting is commonly used to interpret impedance data, where circuit elements are used to attribute the different polarization contributions to the fuel cell processes. However, the fact that the ECM should be defined beforehand without the knowledge of the number, size, and time constants of the contributing processes is limiting for fault identification and isolation techniques, as processes with close time constants may overlap [32,33]. Therefore, in this work, DRT, which does not presume the number of time constants a priori, was adopted for the analysis of the impedance spectra. It is a method based on the fact that impedance spectra can be represented by an infinite number of infinitesimal differential R‖C-elements in series, and therefore, the electrochemical processes represented by the impedance data can be resolved on the basis of their time constants and presented as a distribution of these time constants [34]. Each impedance spectrum was deconvoluted by DRT using a freely available MATLAB application (DRTtools), where Equation (1) was discretized into a limited amount of time constants according to Equation (2) [32,35,36,37]:
Z ( ω ) = R 0 + R p o l 0 g ( τ ) 1 + j ω τ d τ
Z ( ω ) = R 0 + R p o l k = 1 N g k 1 + j ω τ k
where R 0 represents the ohmic resistance, R p o l represents the polarization resistances of the fuel cell, τ = RC is the time constant of the single R∥C-elements and g ( τ ) 1 + j ω τ d τ represents the fraction of the overall polarization with relaxation times between τ and τ + d τ . Since g k represents the relative share of each τ k on the overall polarization resistance, for ease of comparison to the impedance information in the Nyquist plots, g k was scaled as follows [36]:
h k = R p o l · g k
In this work, a regularization parameter, a parameter used to stabilize the solution numerically, of 10 5 was chosen based on recommendations from the literature [32,36]. Heinzmann et al. [32] used a regularization number of 10 3 as a compromise between selectivity, low residuals, and oscillation avoidance. However, in the current work, since the focus is more on the separation of features rather than the physical interpretation of processes, a smaller regularization number that separates out more peaks was used.

3. Results

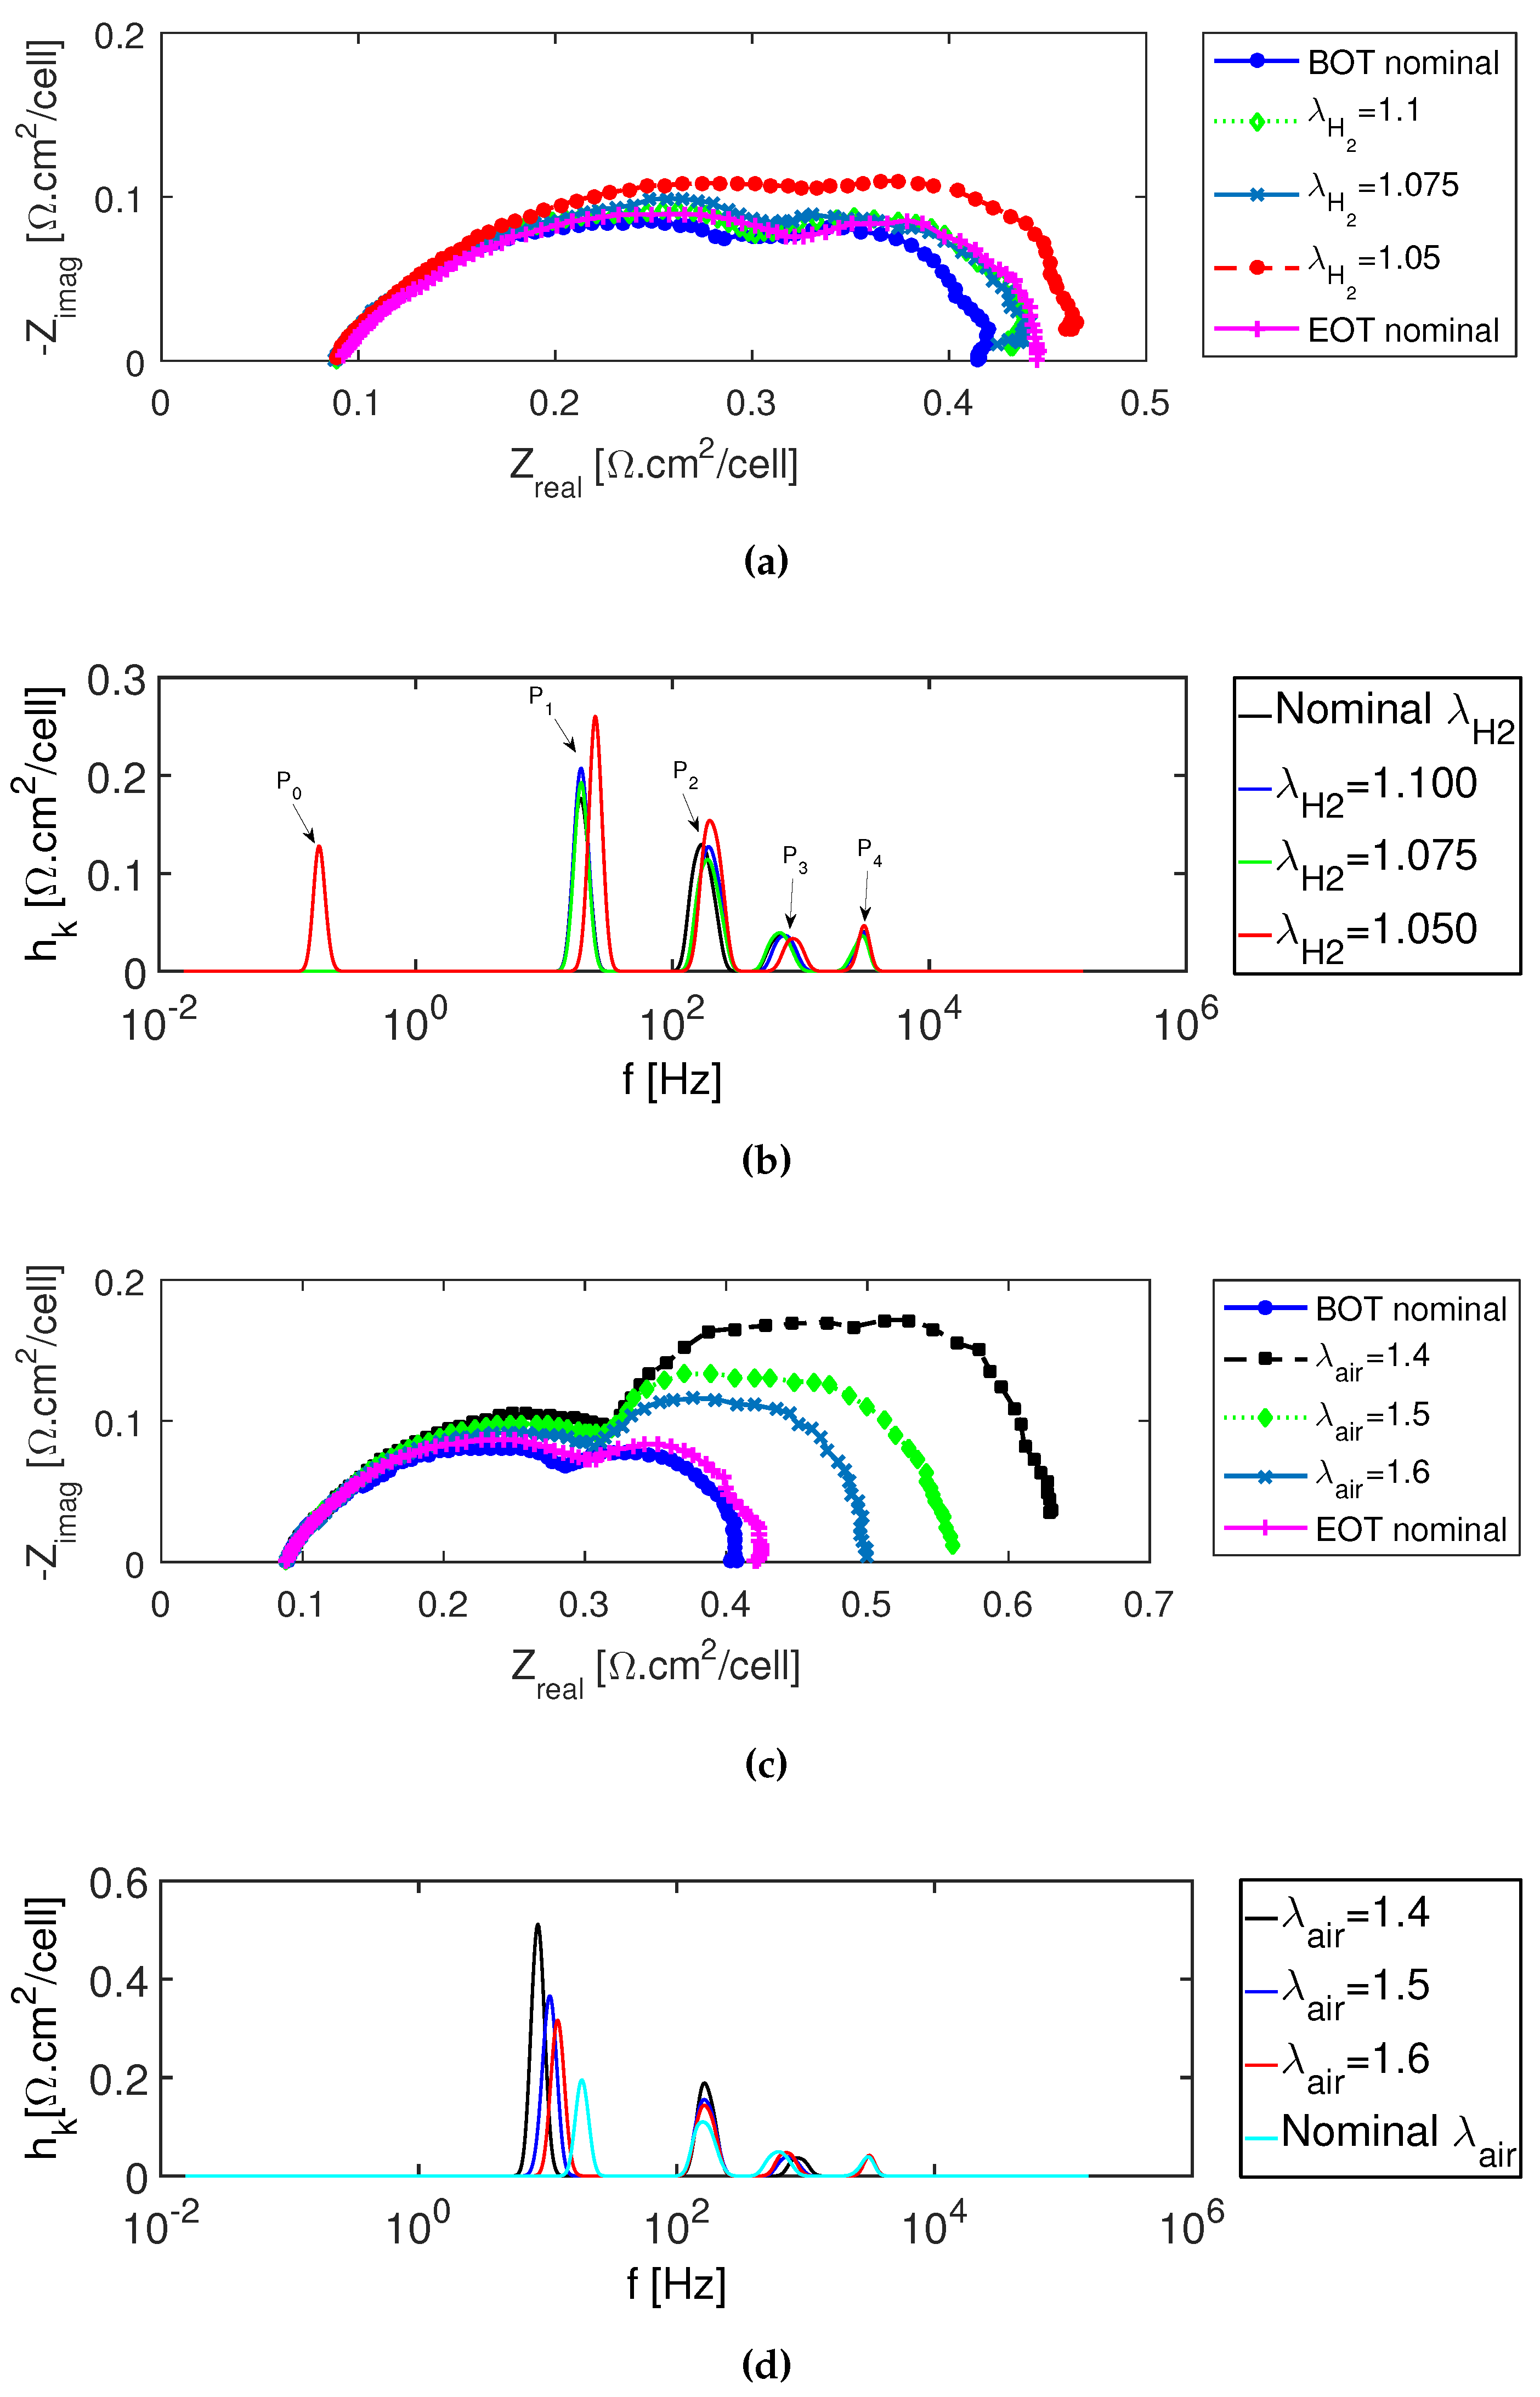
The peaks of DRT analysis are indicative of the different processes that occur in the fuel cell, and therefore, their size, the characteristic frequencies at which they occur, and their response to changes in operating conditions are considered as features and discussed below for all the tests. There were at least four DRT peaks for each impedance spectrum, with the exception of anode starvation and H2S poisoning at higher fault intensity levels, which showed an extra peak in the low frequency region. The DRT peaks are denoted as P 0 to P 4 from low frequency to high frequency, as shown in Figure 3.

3.1. Reactants’ Starvation

Figure 3 shows the impedance spectra and the corresponding DRT analysis of the PEM fuel cell stack under different reactant stoichiometric ratios. It can be seen that the changes of the impedance spectra due to decreasing reactants’ stoichiometric ratios become more pronounced at lower frequencies, both for hydrogen and air. Therefore, the main fault features of a PEM fuel cell under lower reactant stoichiometric ratios are to be researched in the low frequency region, as these result in reduced mass transport of reactants to the reaction sites [38].
Moreover, an extra peak at the frequency of around 0.1 Hz, denoted by P 0 , was seen at an anode stoichiometric ratio of 1.05. A significant increase in the spectrum size was also seen in the low frequency region in the Nyquist plot in Figure 3a at λ H 2 = 1.05. However, it is also worth mentioning that P 1 and P 2 also increased with decreasing anode stoichiometric ratio, which may imply that the mass transport effects may propagate to higher frequencies than 0.1 Hz and that a reduced anode stoichiometric ratio may have an effect on the oxygen reduction reaction (ORR) [32,36]. Therefore, increasing peaks between 10 and 200 Hz may be symptoms of a reduced anode stoichiometric ratio, which develops into anode starvation with a further decrease in stoichiometric ratio, signaled by a further increase of the peaks and an extra peak at around 0.1 Hz.
The impedance spectra showed an even clearer increasing trend with decreasing cathode stoichiometric ratios, especially in the low frequency range (Figure 3c). The changes in the second arcs of the impedance spectra are more pronounced for cathode starvation compared to anode starvation tests, something that is also seen in [39]. However, the changes in fault intensity levels for anode and cathode stoichiometric ratios were not the same, and therefore, direct comparison is not possible. Similarly to anode starvation, the significant increase in P 1 and slight increase in P 2 in the corresponding DRT peaks can also be seen. Since the decrease in cathode stoichiometric ratio can cause mass transport issues in addition to ORR [36], the change in the impedance spectra and corresponding DRT peaks can be expected to be similar to those under anode starvation conditions. Heinzmann et al. [32] found that the effects of oxygen diffusion are seen at lower frequencies than those of hydrogen diffusion. This is confirmed in this work by the leftward shift along the frequency axis of the DRT peaks for air starvation compared to the hydrogen starvation in Figure 3. The absence of the extra peak at low frequency, (P 0 ), in the case of the air starvation test could be due to the fact that severe starvation as for the lowest hydrogen stoichiometric ratio ( λ H 2 = 1.05) was not reached for the air counterpart ( λ a i r = 1.4).

3.2. Water Management Issues

The flooding conditions were simulated by increasing the relative humidity of both H2 and air to 100% and above simultaneously. Figure 4a shows the impedance spectra of the PEM fuel cell stack under different flooding levels starting from below nominal hydration levels. The main change is seen in the low frequency range. This is in agreement with the work of Mérida et al. [15]. It is suspected that when relative humidity exceeds 100%, water can block the micro pores in the catalyst layers and the gas diffusion layers, thereby causing the mass transport issue [11].
The corresponding DRT peaks in Figure 4b show a small increase in the low frequency peaks (P 1 ), while other peaks remain unchanged. This indicates that the increase in low frequency peak (P 1 ) could be used as a feature for flooding fault detection. Mammar and Chaker [40] found that when flooding starts, as liquid water begins to accumulate in the channels and constrict the gas flow, it is the diffusion-related equivalent circuit parameters of resistance and time constant that increase. Similarly to the current work, they also observed no changes in the high frequency region, since in both nominal and flooding conditions, the membrane is fully humidified, and hence, the membrane conductivity and hydrogen oxidation reaction (HOR) are not affected.
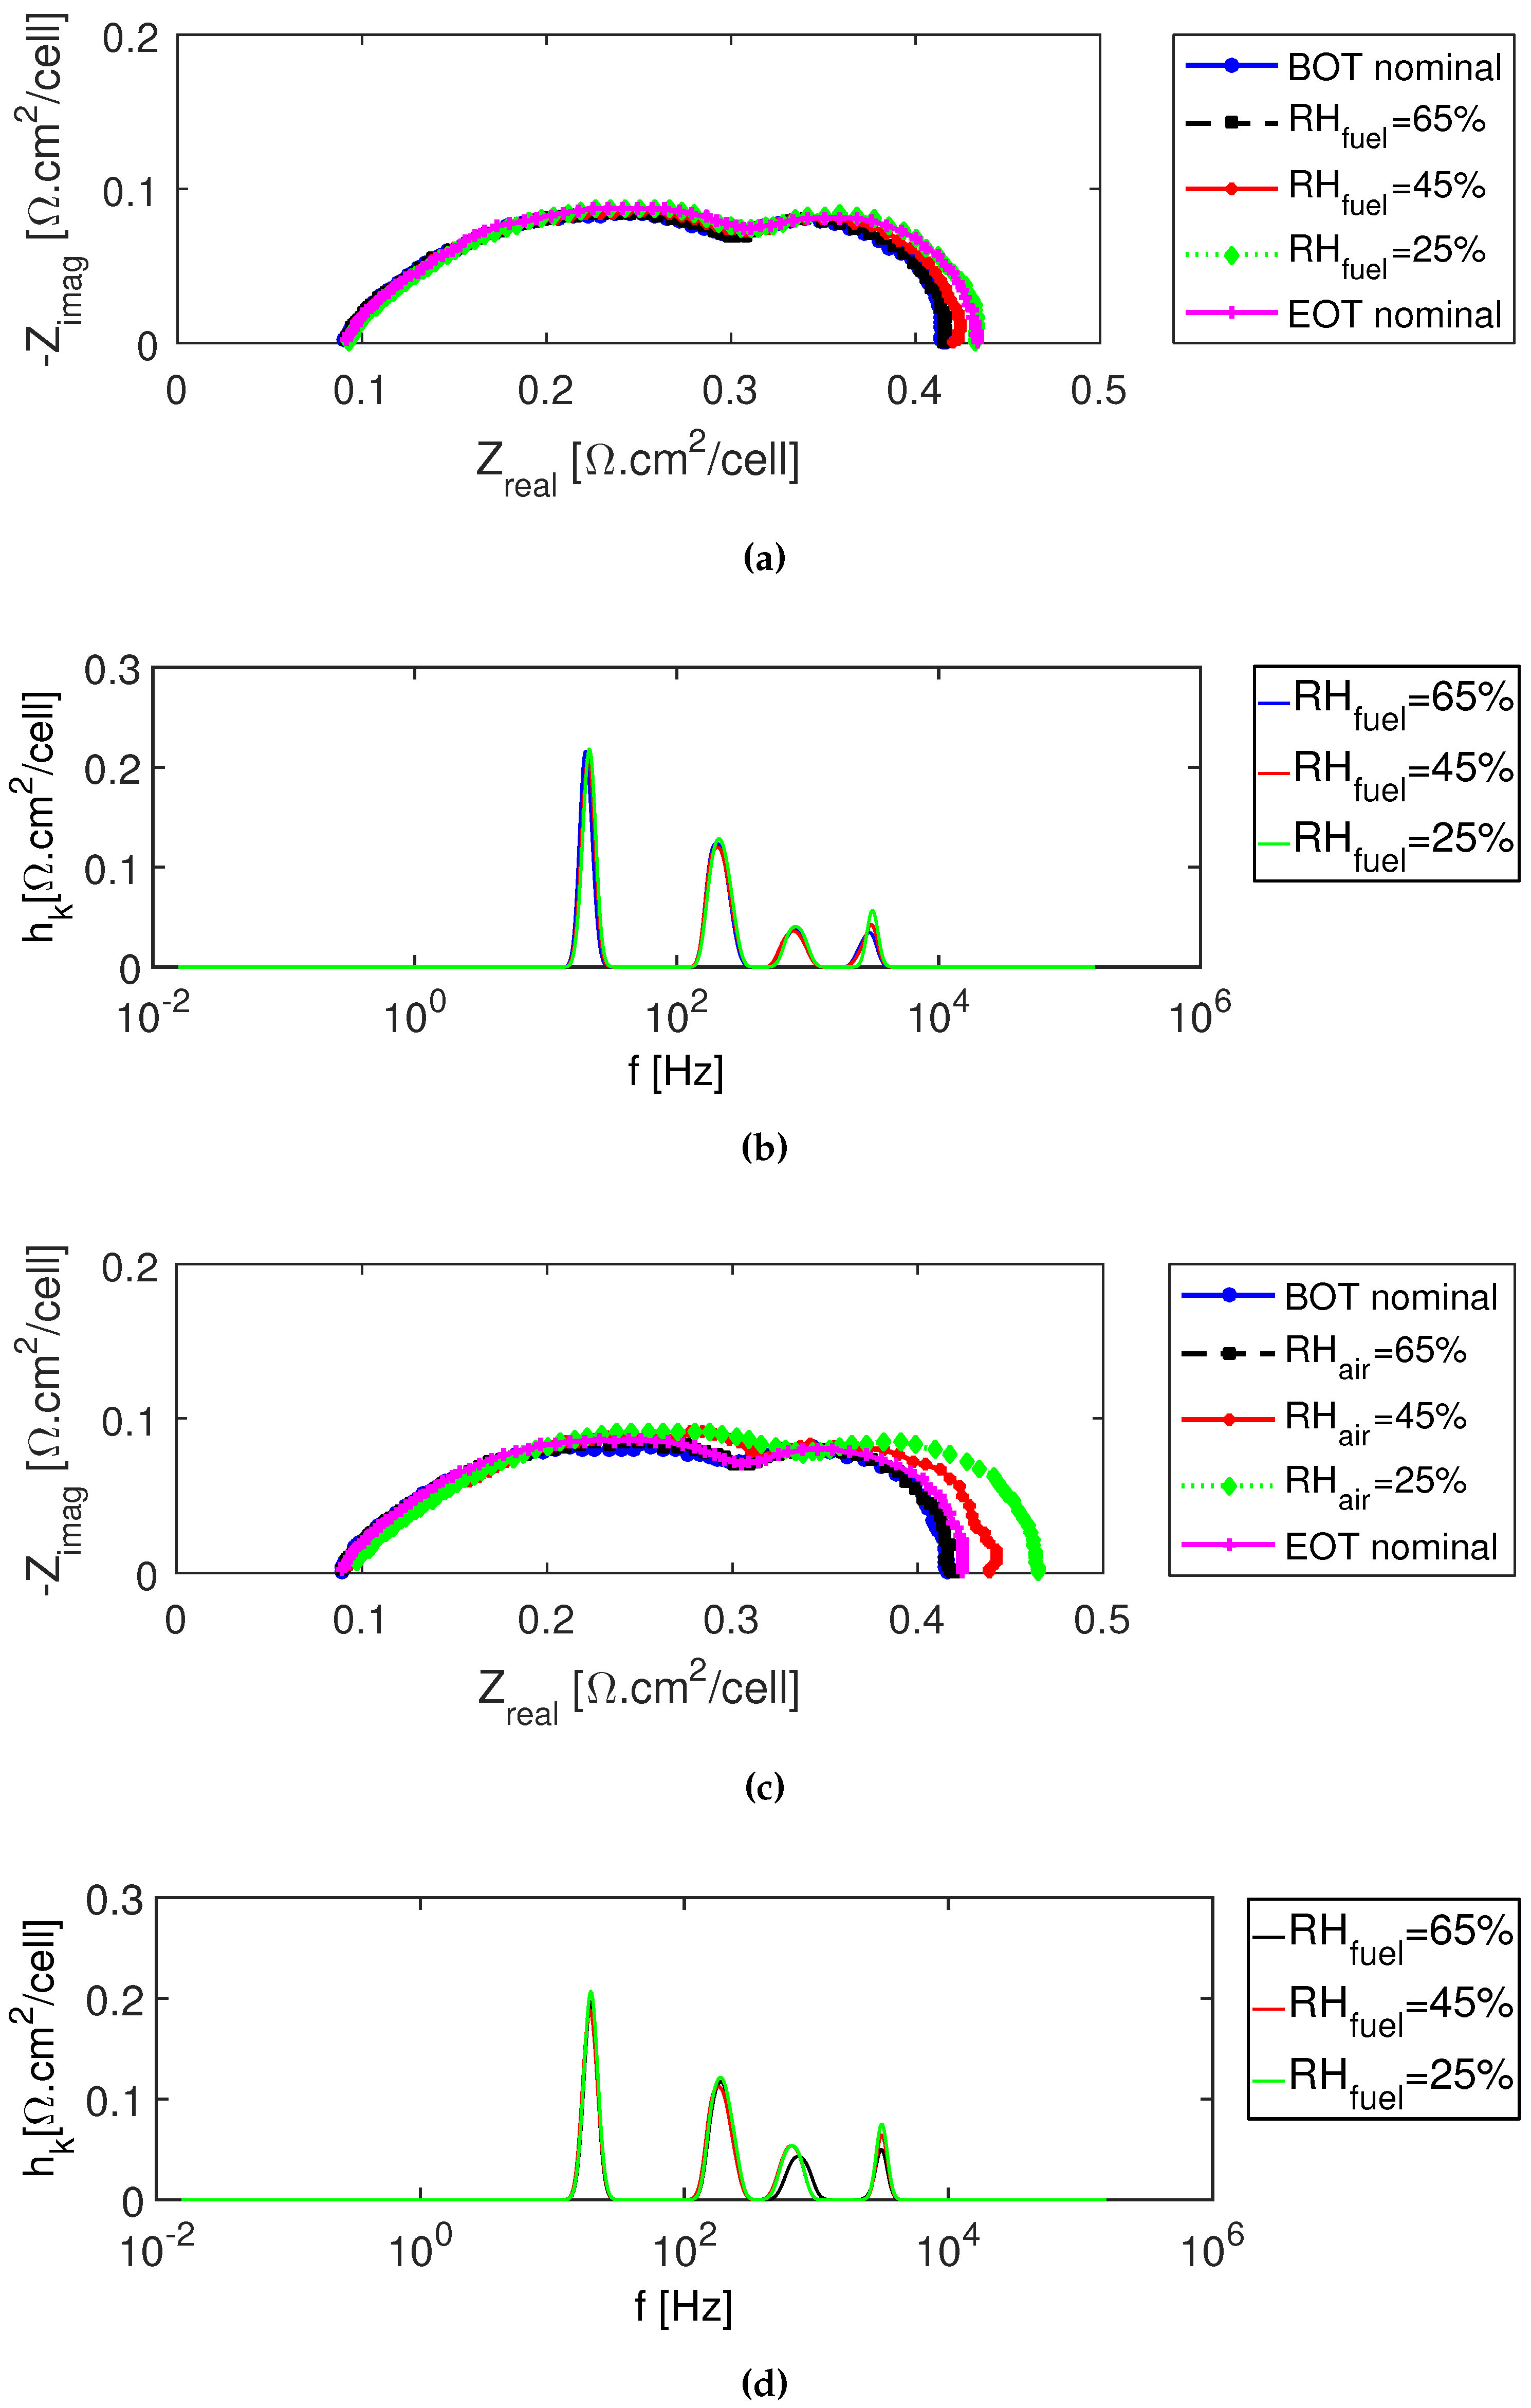
For drying on the other hand, even though not much can be said from the Nyquist plots for anode drying in Figure 5a, the DRT peaks in Figure 5b show an increase in the high frequency region, P 4 , especially at a low RH of 25%. In the literature, the high frequency peaks are associated with anode processes, such as the charge transfer kinetics of the HOR or proton conduction-related processes [32,33,35,36]. However, it is difficult to distinguish between these processes and attribute the peaks to ohmic resistances or anode charge transfer kinetics resistance, as they both take place in the same frequency range. Nonetheless, the proton conductivity of a Nafion® membrane is tightly related to the membrane hydration level, and therefore, an increase in ohmic resistance can be expected under drying conditions.
When RH sensitivity for lower hydration is tested on the cathode side, similar changes as on the anode side can be observed in the impedance spectra and the corresponding DRT peaks; Figure 5c,d. The ionic transport-dominated high frequency peaks increase slightly as the cathode relative humidity decreases from 65–25%. The main changes occur for P 4 for all levels and P 3 for the lowest hydration levels, where they increase with decreasing relative humidity. Mérida et al. [15] also saw the main changes due to drying above 0.5 kHz. The similar behavior of the DRT peaks of anode and cathode drying conditions reveals that it is difficult to distinguish whether the drying occurs on the anode or the cathode side. However, the fact that the changes are mainly manifested on the high frequency peaks unlike in the previous faults makes the overall phenomenon of drying easier to distinguish from starvation and flooding using the DRT peaks as features.
The low frequency peaks, P 1 , P 2 , on the other hand, showed only minor changes (Figure 5d). At first glance, this seems counter intuitive, since there is a visible change in the low frequency loops of the Nyquist plot in Figure 5c. However, a closer look reveals that the low frequency loops, instead of increasing in size, as in the case of the cathode starvation spectra in Figure 3c, only change in position while remaining similar in size. This may indicate that the changes in the low frequency loops are not due mass transport issues, but due to high and intermediate frequency phenomena, such as proton conductivity and charge transfer kinetics. It could be that a combination of a rightward shift of the EIS spectra due to the increase in ohmic resistance and the increase in the size of the first loop due to charge transfer losses pushes the second loop to the right.

3.3. Poisoning Agents in the Fuel Stream

Figure 6 shows the impedance spectra and the corresponding DRT analysis of the PEM fuel cell stack operated with CO containing H2, as well as pure H2 at the beginning of test for reference. Even though the effects are minimal until a CO concentration of 8 ppm in the anode feed, the increase in the intermediate frequency peaks (P 2 and P 3 ) and high frequency peak (P 4 ) at higher CO concentrations in Figure 6b is noticeable. CO in the anode catalyst layer can bond with the platinum molecules stronger than hydrogen [21]. Therefore, it can cover part of the platinum catalyst surface and hinder the HOR, which could be the reason for the increase in P 4 . Fasmin and Ramanathan [41] found a similar effect in their impedance simulation of CO poisoning, where CO exposure leads to an increase in the anodic charge transfer resistance with increasing CO concentration. They also observed an extra loop in the Nyquist plot at low frequency at a CO concentration of 10 ppm, which is similar to the trend seen in this work (Figure 6a) for CO concentration of 12 ppm. However, this is not reflected in the DRT peak of the lowest frequency, which show a slight decrease with increasing CO concentrations, limiting the features of CO poisoning to above 100 Hz.
The Nyquist plots and DRT analysis with H2S concentrations ranging from 4 ppm–12 ppm are shown in Figure 7. The increase in the size of the impedance spectrum caused by H2S poisoning is bigger than that caused by CO poisoning, confirming that H2S is a more severe contaminant than CO to Pt-based catalyst. This is to be expected, since sulfur compounds are known to have a more severe effect on Pt-based fuel cells. In fact, the ISO specification for hydrogen purity for fuel cells specifies a much lower 0.004 μ mol · mol 1 for sulfur than the 0.2 μ mol · mol 1 for CO [42].
As in the case of CO poisoning, an increase in the intermediate frequency peaks (P 2 and P 3 ) and in the high frequency peak (P 4 ) can be observed under H2S poisoning conditions. The poisoning mechanism mainly lies in the strong adsorption of H2S on the Pt surface that diminishes accessibility to H2 [26]:
H 2 S - P t P t - S + H 2
P t - H + H 2 S P t - S + 3 2 H 2
Therefore, an increase in the intermediate and high frequency peaks, P 2 , P 3 , and P 4 , which are associated with the reaction kinetics, can be expected. Moreover, a significant increase can be observed in the low frequency peak (P 1 ). Additionally, similarly to anode starvation, an extra low frequency peak, P 0 , appears, which may indicate the severity of H2S poisoning. However, the extra peak (P 0 ) is at a much higher frequency of around 10 Hz compared to the 0.1 Hz of anode starvation, implying that it may have originated due to enhanced charge transfer losses of HOR, rather than mass transport issues.
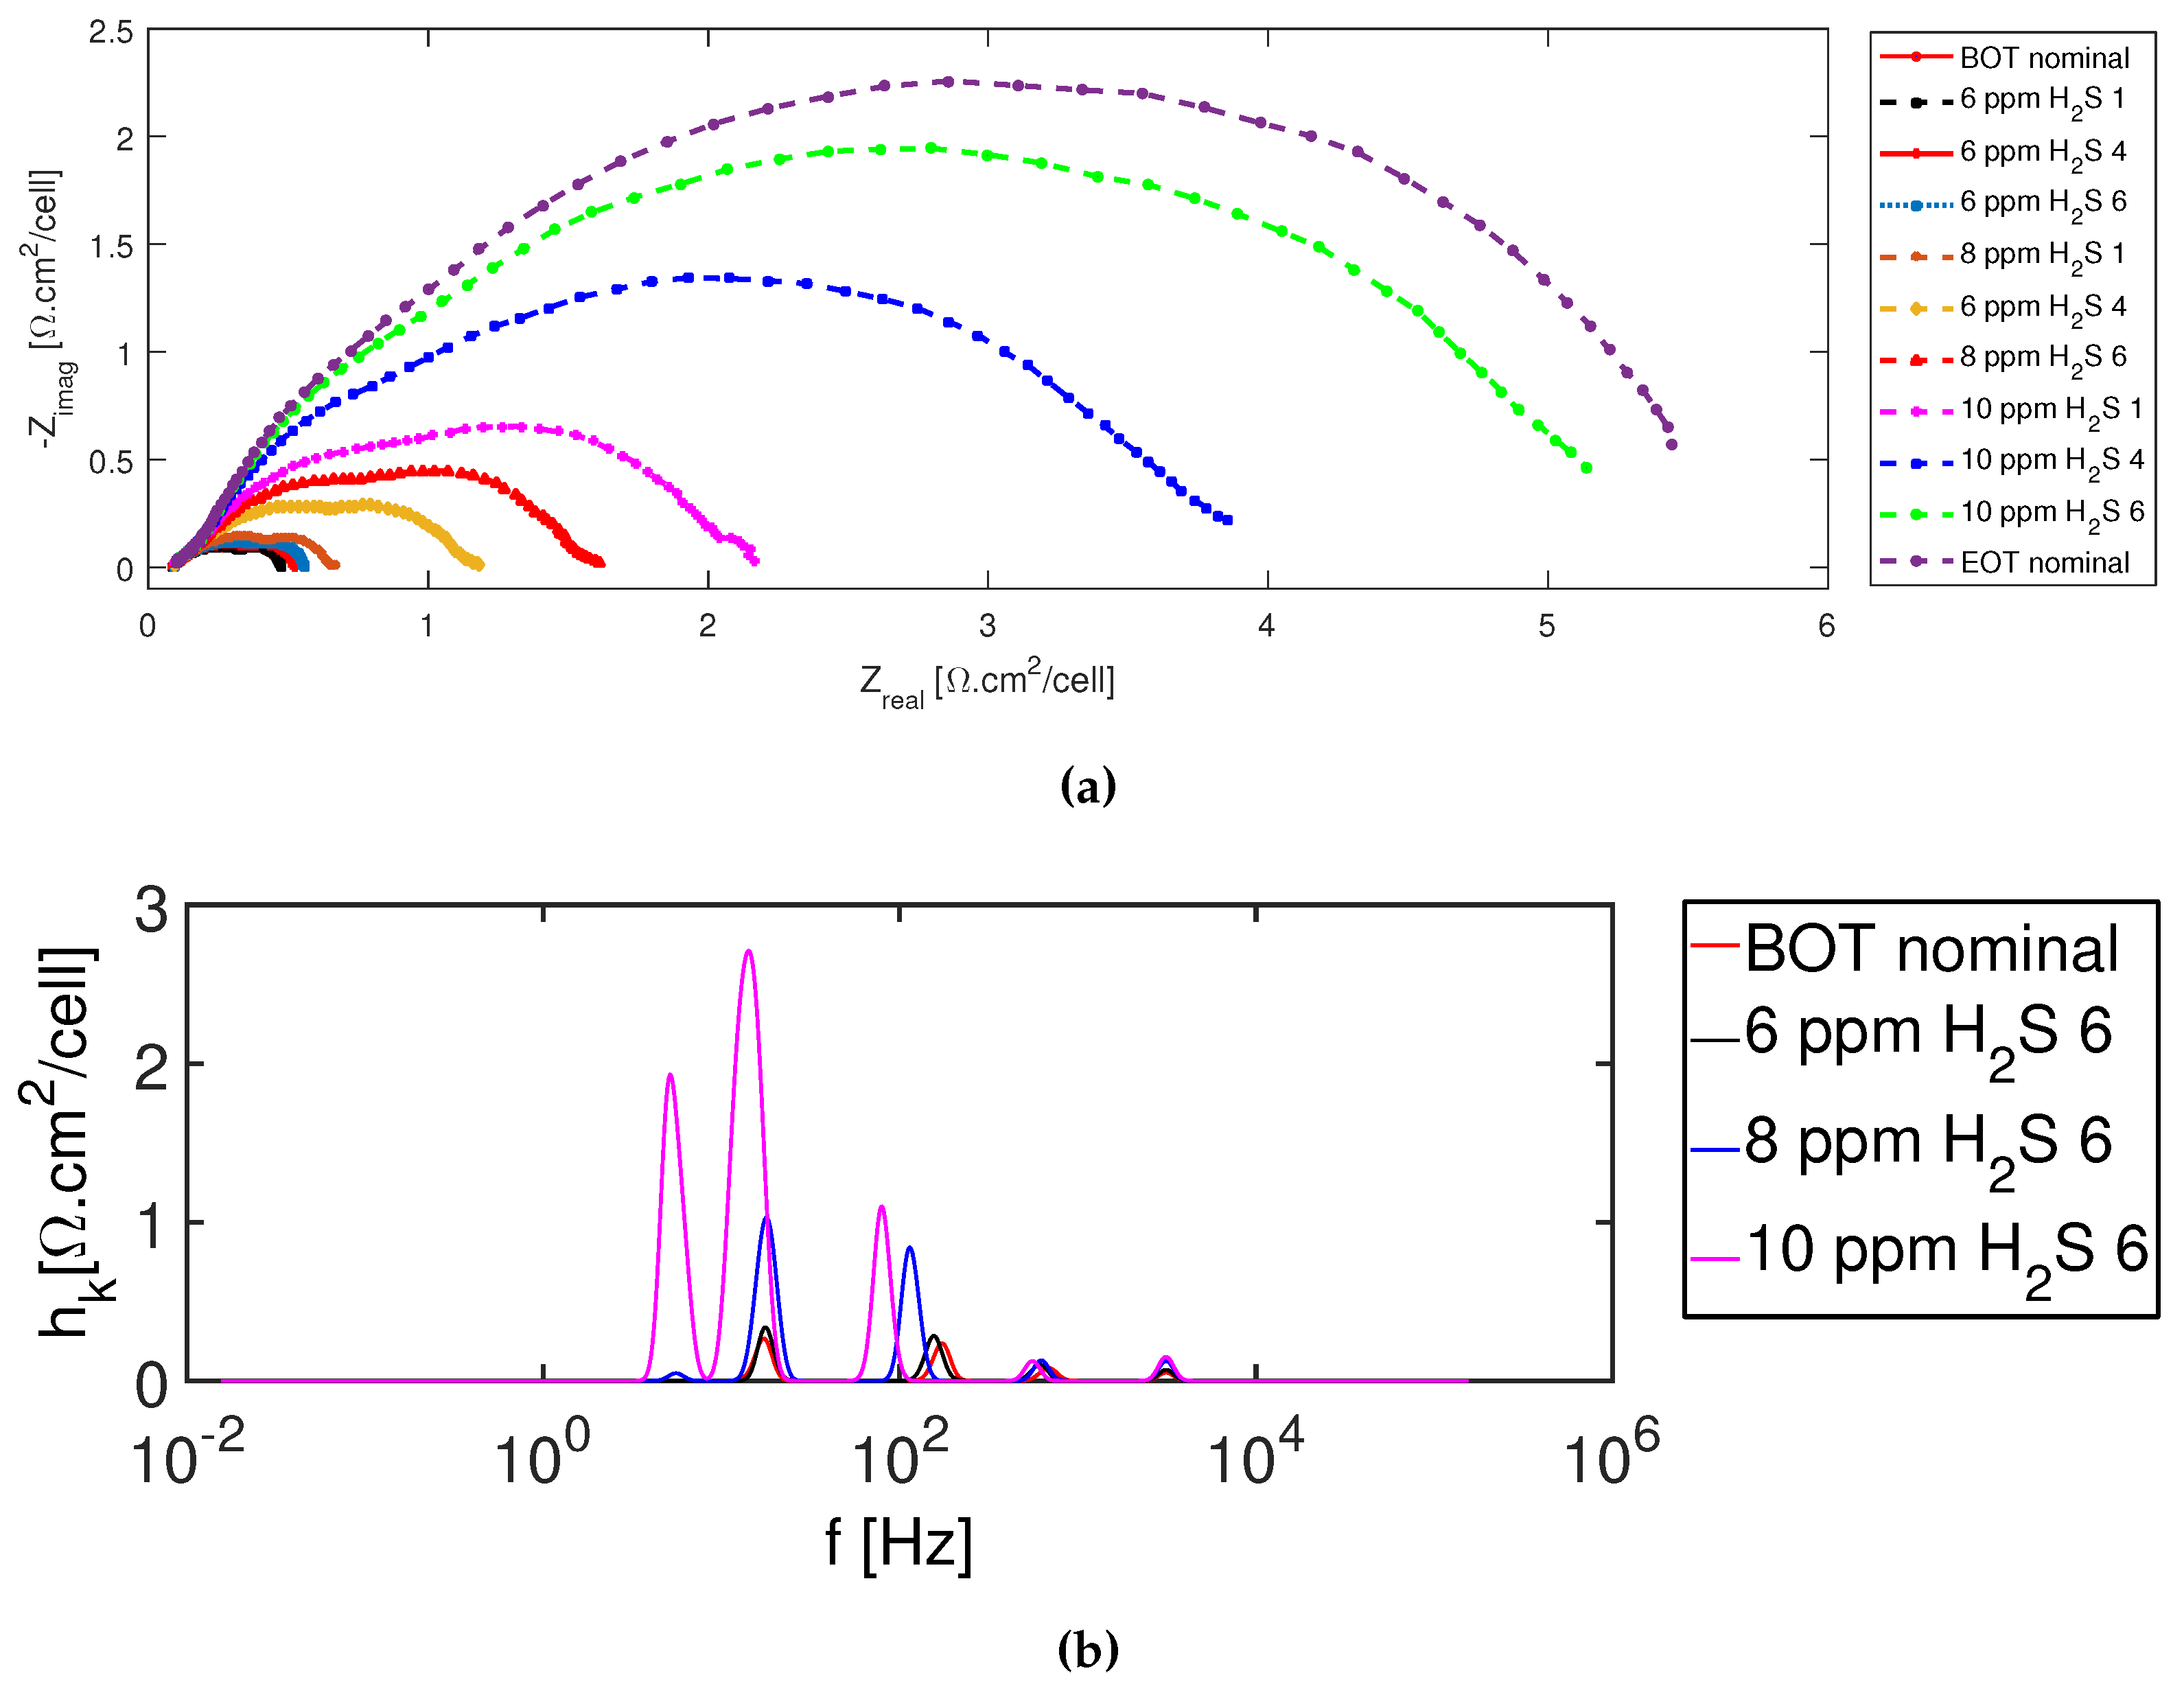
The intensity levels in the second stack in Figure 8a were changed to 6, 8, and 10 ppm, to avoid possible failure due to the accumulation of the 12-ppm H2S concentration and to check for the sensitivity of closer H2S concentration values. When comparing the Nyquist plots for the two stacks (Figure 7a and Figure 8a), it can be seen that though the levels of H2S were lower for the second stack, the impedance spectra increased in size much more significantly, showing that the accumulation of H2S had severe detrimental effects compared to short-term high concentration of H2S. This is also shown in Figure 8, where the same concentrations of H2S poisoning exhibit a successive increase in spectra size according to the order in which they were recorded.
The DRT analysis for H2S showed reproducibility in the number of peaks and trends in the second fuel cell stack in Figure 8b, despite an order of magnitude higher resistance values due to the accumulation effect. It can be noticed that the high frequency peaks (P 3 and P 4 ) change less and do not contribute significantly to the increased losses due to accumulation. All other peaks increase with increasing H2S concentrations. Therefore, when comparing CO and H2S poisoning, the features of the former are found only above 100 Hz, while the latter has features throughout the spectrum above 10 Hz, with most significant changes happening between 10 and 100 Hz.

3.4. Post-Fault Stack Performance Assessment

The performances at the beginning of life and after the end of each fault test for the first fuel stack are shown in Figure 9. It can be seen that the performances were similar for all tests except at the end of sulfur poisoning tests. The fuel cell stack initially degraded due to starvation and water management tests, which were carried out in the same test campaign. However, the performances were fully recovered after the CO poisoning tests, which took place after a prolonged rest of the fuel cell stack due to modifications to the test setup to accommodate the poisoning tests. It can also be seen from the impedance spectra of the nominal conditions before and after the fault tests, given in the previous paragraphs, that correction is possible by operation on neat hydrogen for all faults except H2S. Hence, the DRT peaks of the nominal conditions can be used as the features for the recovery to initial performance.
The H2S tests, which were performed right after the fuel cell reconditioning that followed the CO tests, caused significant performance degradation, as can be seen in Figure 9. Then, after six months of rest, the performance was recovered to the levels before the CO tests.
Mohtadi et al. [26] showed partial recovery through 24 h of neat H2 operation after 3.8 h of exposure to 50 ppm H2S at 70 C . They attributed the recovery to the reaction of hydrogen with the sulfur that is adsorbed on the Pt surface to produce H2S according to the reverse of the mechanisms given in Reactions (4) and (5), which is then flushed out by the flow of neat H2. In the current work, the exposure to H2S was between 4 and 12 ppm, but for a longer period of around 24 h. The reconditioning steps in between the different poisoning levels with air-bleed did not result in recovery, as can be seen from the significant degradation in Figure 9. However, there is close to full recovery after a six-month restart of the stack, as can be seen both in the Nyquist plot in Figure 7a and the polarization curves in Figure 9.
However, it is worth mentioning that Sethuraman and Weidner [28] reported that post-recovery polarization curves do not indicate performance drops proportional to the irreversible deactivation of Pt sites towards HOR due to H2S poisoning. Hence, they concluded on the cumulative and irreversible nature of H2S poisoning and that electrochemically active area and the nature of sites should be compared to study the effects, rather than comparing polarization curves. Nonetheless, other techniques than simple prolonged resting and neat hydrogen operation should be studied for quicker H2S removal and performance recovery. Cyclic voltammetry (CV) measurements and other cycling procedures have been reported to be more effective than neat H2 [26,28].

4. Discussion

DRT is not a physiochemical model, which means its individual resistance and time constants cannot be unequivocally assigned to the different physiochemical processes in the fuel cell [33]. Nonetheless, there have been attempts to assign the DRT peaks to the different fuel cell losses and are summarized in Table 2 along with the observations of this paper. The current work is aimed at identifying fault features rather than acquiring fundamental understanding of the physiochemical processes in the fuel cell; thus, the simple associations that can be made between operating conditions and changes in DRT peaks can give valuable information for diagnosis and fault-dependent control strategies.
There is a general consensus that the low frequency region is mass transport dominated, and charge transfer losses are seen in the intermediate-high frequency region, while ionic transport dominates the high frequency region. It is also clear that the losses do not happen at a specific time constant, but rather over a broader range of frequencies, and therefore, there was an overlap of different processes throughout the frequency spectrum. However, from a feature identification point of view, the magnitude of the losses and their characteristic frequencies as given by DRT peaks could be combined and compared in order to rule out some and favor others for successful detection. An analysis of the DRT peaks and their features is given below.

Feature Analysis

Since multiple parameters cause similar changes of the DRT peaks, the features should be compared with each other or should be complemented by system monitoring. For instance, in the case of decreasing λ H 2 , the shift to the right of the peaks and their decrease at around 500 Hz could be used as additional information to rule out drying and poisoning. Moreover, the appearance of a fifth peak (P 0 ) at around 0.1 Hz could indicate the transition from mass transport issues to starvation. However, the fifth peak at low frequency is also available in the case of H2S poisoning. Therefore, the two faults should be distinguished using other features, which in this case are the overall more pronounced peaks for H2S poisoning compared to anode starvation. Moreover, the extra peak (P 0 ) appears at a much lower frequency for anode starvation, making its association with the mass transfer issue more plausible.
Table 3 summarizes the features extracted from the DRT peaks of the different fault tests. The magnitude and the direction of the changes in the DRT peaks can be used as features that can be implemented in an algorithm to determine the nature of the faults. Faults such as starvation and poisoning are easier to notice both on the Nyquist plot and DRT peaks. Moreover, there is clear difference in the magnitude of the changes even between anode starvation and cathode starvation, with cathode starvation showing more marked changes. This can be used to distinguish between the two faults in cases where P 0 is not available for anode starvation. Similarly, CO and H2S can be distinguished by the higher magnitude of changes and the presence of P 0 between 1 Hz and 10 Hz for H2S, as well as the fact that CO affects only the higher frequency peaks, above 100 Hz.
Flooding and drying are the faults with the least detectability in these tests. However, if complemented with other monitoring techniques, DRT can be used to distinguish between the two as they affect the opposite ends of the spectra, as can be seen in Table 3, which is also confirmed in [15].

5. Conclusions

The most common faults of a PEM fuel cell stack were mapped using impedance spectroscopy. A liquid-cooled commercial fuel cell stack of 46 cells with a 100-cm 2 active area for μ -CHP application was used for the investigations. Impedance data were analyzed using DRT for the identification of the features of the different faults. It was found that anode starvation and H2S poisoning have a characteristic low frequency DRT peak that is not found in the other faults. These low frequency features of the two faults can be distinguished by the generally higher magnitude of H2S poisoning peaks and the fact that they occur at higher frequencies compared to anode starvation.
Moreover, it was seen that flooding and drying affect the opposite ends of the frequency spectrum in the DRT analysis, where flooding causes mass transport effects by blocking the pores in the gas diffusion layer and drying affects the membrane conductivity. CO affects the higher frequency end of the spectrum, while H2S has a more pronounced effect throughout the frequency spectrum.
It can be said that there still remain doubts as to what precise physical phenomena cause the effects of the faults at the different frequency regions of the impedance spectra, as they are contributed to by a combination of processes. However, with proper mapping of all faults, the physical phenomena of the effect become of secondary importance as a condition-based intervention can be carried out irrespective of the degradation processes by correcting for the fault that matches the identified features.

Author Contributions

Conceptualization, S.S.A. and S.K.K.; data curation, S.S.A. and F.Z.; formal analysis, S.S.A. and F.Z.; funding acquisition, S.K.K.; investigation, S.S.A., F.Z., S.L.S., and S.T.; methodology, S.S.A.; project administration, S.S.A. and S.K.K.; resources, S.K.K.; software, S.L.S. and C.J.; supervision, S.S.A. and S.K.K.; validation, S.S.A., F.Z., and S.T.; visualization, S.S.A. and F.Z.; writing, original draft, S.S.A.; writing, review and editing, F.Z., S.L.S., and S.T.

Funding

The research leading to these results has received funding from the European Union’s Horizon 2020 Programme (H2020-JTI-FCH-2014-1) for the Fuel Cells and Hydrogen Joint Undertaking (FCH-JU), under Grant Agreement Number 671486 –Research and Innovation Project: HEALTH-CODE (Real operation pem fuel cells HEALTH-state monitoring and diagnosis based on dc-dc Converter embeddeD Eis). Website: http://pemfc.health-code.eu/.

Conflicts of Interest

The authors declare no conflict of interest.

Abbreviations

The following abbreviations are used in this manuscript:
BOTBeginning of test
CVCyclic voltammetry
DRTDistribution of relaxation time
ECMEquivalent circuit model
EISElectrochemical impedance spectroscopy
EOTEnd of test
FDIFault detection and isolation
HORHydrogen oxidation reaction
ORROxygen reduction reaction
PEMProton exchange membrane
RHRelative humidity
SOFCSolid oxide fuel cell
λ a i r Air stoichiometric ratio
λ H 2 Hydrogen stoichiometric ratio
μ -CHPMicro combined heat and power

References

  1. Borup, R.; Meyers, J.; Pivovar, B.; Kim, Y.S.; Mukundan, R.; Garland, N.; Myers, D.; Wilson, M.; Garzon, F.; Wood, D.; et al. Scientific aspects of polymer electrolyte fuel cell durability and degradation. Chem. Rev. 2007, 107, 3904–3951. [Google Scholar] [CrossRef] [PubMed]
  2. Schmittinger, W.; Vahidi, A. A review of the main parameters influencing long-term performance and durability of PEM fuel cells. J. Power Sources 2008, 180, 1–14. [Google Scholar] [CrossRef]
  3. Zhang, S.; Yuan, X.; Wang, H.; Merida, W.; Zhu, H.; Shen, J.; Wu, S.; Zhang, J. A review of accelerated stress tests of MEA durability in PEM fuel cells. Int. J. Hydrogen Energy 2009, 34, 388–404. [Google Scholar] [CrossRef]
  4. James, B.D.; Huya-Kouadio, J.M.; Houchins, C.; Desantis, D.A. Mass Production Cost Estimation of Direct H2 PEM Fuel Cell Systems for Transportation Applications: 2016 Update; Technical Report; Strategic Analysis Inc.: Arlington, VA, USA, 2016. [Google Scholar]
  5. Sutharssan, T.; Montalvao, D.; Chen, Y.K.; Wang, W.C.; Pisac, C.; Elemara, H. A review on prognostics and health monitoring of proton exchange membrane fuel cell. Renew. Sustain. Energy Rev. 2017, 75, 440–450. [Google Scholar] [CrossRef] [Green Version]
  6. Jouin, M.; Gouriveau, R.; Hissel, D.; Péra, M.C.; Zerhouni, N. Prognostics and Health Management of PEMFC—State of the art and remaining challenges. Int. J. Hydrogen Energy 2013, 38, 15307–15317. [Google Scholar] [CrossRef]
  7. Polverino, P.; Pianese, C. Model-based prognostic algorithm for online RUL estimation of PEMFCs. In Proceedings of the 2016 3rd Conference on Control and Fault-Tolerant Systems (SysTol), Barcelona, Spain, 7–9 September 2016; pp. 599–604. [Google Scholar] [CrossRef]
  8. Miller, M.; Bazylak, A. A review of polymer electrolyte membrane fuel cell stack testing. J. Power Sources 2011, 196, 601–613. [Google Scholar] [CrossRef]
  9. Qin, C.; Wang, J.; Yang, D.; Li, B.; Zhang, C. Proton Exchange Membrane Fuel Cell Reversal: A Review. Catalysts 2016, 6, 197. [Google Scholar] [CrossRef]
  10. Pei, P.; Chen, H. Main factors affecting the lifetime of Proton Exchange Membrane fuel cells in vehicle applications: A review. Appl. Energy 2014, 125, 60–75. [Google Scholar] [CrossRef]
  11. Le Canut, J.M.; Abouatallah, R.M.; Harrington, D.A. Detection of Membrane Drying, Fuel Cell Flooding, and Anode Catalyst Poisoning on PEMFC Stacks by Electrochemical Impedance Spectroscopy. J. Electrochem. Soc. 2006, 153, A857. [Google Scholar] [CrossRef]
  12. Ji, M.; Wei, Z. A Review of Water Management in Polymer Electrolyte Membrane Fuel Cells. Energies 2009, 2, 1057–1106. [Google Scholar] [CrossRef] [Green Version]
  13. Choudhury, A.B.; Escobedo, G.; Curtin, D.E.; Banerjee, S. PEM Hydrogen Fuel Cell Durability: A Perspective Review and Recent Advances Membrane Fuel Cell Components. Transw. Res. Netw. 2015, 661, 1–25. [Google Scholar]
  14. Liso, V.; Simon Araya, S.; Olesen, A.C.; Nielsen, M.P.; Kær, S.K. Modeling and experimental validation of water mass balance in a PEM fuel cell stack. Int. J. Hydrogen Energy 2016, 41, 3079–3092. [Google Scholar] [CrossRef]
  15. Mérida, W.; Harrington, D.; Le Canut, J.; McLean, G. Characterisation of proton exchange membrane fuel cell (PEMFC) failures via electrochemical impedance spectroscopy. J. Power Sources 2006, 161, 264–274. [Google Scholar] [CrossRef]
  16. Wasterlain, S.; Candusso, D.; Harel, F.; Francois, X.; Hissel, D. Diagnosis of a fuel cell stack using electrochemical impedance spectroscopy and Bayesian Networks. In Proceedings of the 2010 IEEE Vehicle Power and Propulsion Conference, Lille, France, 1–3 September 2010; pp. 1–6. [Google Scholar] [CrossRef]
  17. Debenjak, A.; Gašperin, M.; Pregelj, B.; Atanasijević-Kunc, M.; Petrovčič, J.; Jovan, V. Detection of flooding and drying inside a PEM fuel cell stack. Strojniski Vestnik/J. Mech. Eng. 2013, 59, 56–64. [Google Scholar] [CrossRef]
  18. Rubio, M.; Urquia, A.; Dormido, S. Diagnosis of PEM fuel cells through current interruption. J. Power Sources 2007, 171, 670–677. [Google Scholar] [CrossRef]
  19. Dotelli, G.; Ferrero, R.; Stampino, P.G.; Latorrata, S.; Toscani, S. Diagnosis of PEM Fuel Cell Drying and Flooding Based on Power Converter Ripple. IEEE Trans. Instrum. Meas. 2014, 63, 2341–2348. [Google Scholar] [CrossRef] [Green Version]
  20. Nikolaidis, P.; Poullikkas, A. A comparative overview of hydrogen production processes. Renew. Sustain. Energy Rev. 2017, 67, 597–611. [Google Scholar] [CrossRef]
  21. Zhang, S.; Yuan, X.Z.; Hin, J.N.C.; Wang, H.; Friedrich, K.A.; Schulze, M. A review of platinum-based catalyst layer degradation in proton exchange membrane fuel cells. J. Power Sources 2009, 194, 588–600. [Google Scholar] [CrossRef]
  22. Yan, W.M.; Chu, H.S.; Lu, M.X.; Weng, F.B.; Jung, G.B.; Lee, C.Y. Degradation of proton exchange membrane fuel cells due to CO and CO2 poisoning. J. Power Sources 2009, 188, 141–147. [Google Scholar] [CrossRef]
  23. Garsany, Y.; Gould, B.D.; Baturina, O.A.; Swider-Lyons, K.E. Comparison of the Sulfur Poisoning of PBI and Nafion PEMFC Cathodes. Electrochem. Solid-State Lett. 2009, 12, B138. [Google Scholar] [CrossRef]
  24. Klages, M.; Tjønnås, J.; Zenith, F.; Halvorsen, I.J.; Scholta, J. Dual control of low concentration CO poisoning by anode air bleeding of low temperature polymer electrolyte membrane fuel cells. J. Power Sources 2016, 336, 212–223. [Google Scholar] [CrossRef]
  25. Jiang, R.; Russell Kunz, H.; Fenton, J.M. Influence of temperature and relative humidity on performance and CO tolerance of PEM fuel cells with Nafion®–Teflon®–Zr(HPO4)2 higher temperature composite membranes. Electrochim. Acta 2006, 51, 5596–5605. [Google Scholar] [CrossRef]
  26. Mohtadi, R.; Lee, W.k.; Cowan, S.; Van Zee, J.W.; Murthy, M. Effects of Hydrogen Sulfide on the Performance of a PEMFC. Electrochem. Solid-State Lett. 2003, 6, A272. [Google Scholar] [CrossRef] [Green Version]
  27. Shi, W.; Yi, B.; Hou, M.; Jing, F.; Ming, P. Hydrogen sulfide poisoning and recovery of PEMFC Pt-anodes. J. Power Sources 2007, 165, 814–818. [Google Scholar] [CrossRef]
  28. Sethuraman, V.A.; Weidner, J.W. Analysis of sulfur poisoning on a PEM fuel cell electrode. Electrochim. Acta 2010, 55, 5683–5694. [Google Scholar] [CrossRef] [Green Version]
  29. Petrone, G.; Zamboni, W.; Spagnuolo, G. EIS Method for the On-Board Evaluation of the Fuel Cell Impedance. In Proceedings of the 2018 IEEE 4th International Forum on Research and Technology for Society and Industry (RTSI), Palermo, Italy, 10–13 September 2018; pp. 1–6. [Google Scholar]
  30. StackTest. Available online: http://stacktest.zsw-bw.de/media-centre/test-modules.html (accessed on 28 December 2018).
  31. Mitzel, J.; Gülzow, E.; Kabza, A.; Hunger, J.; Araya, S.S.; Piela, P.; Alecha, I.; Tsotridis, G. Identification of critical parameters for PEMFC stack performance characterization and control strategies for reliable and comparable stack benchmarking. Int. J. Hydrogen Energy 2016, 41, 21415–21426. [Google Scholar] [CrossRef]
  32. Heinzmann, M.; Weber, A.; Ivers-Tiffée, E. Advanced impedance study of polymer electrolyte membrane single cells by means of distribution of relaxation times. J. Power Sources 2018, 402, 24–33. [Google Scholar] [CrossRef]
  33. Ivers-tiffée, E.; Weber, A. Evaluation of electrochemical impedance spectra by the distribution of relaxation times. J. Ceram. Soc. Jpn. 2017, 125, 193–201. [Google Scholar] [CrossRef] [Green Version]
  34. Schenk, A.; Grimmer, C.; Perchthaler, M.; Weinberger, S.; Pichler, B.; Heinzl, C.; Scheu, C.; Mautner, F.A.; Bitschnau, B.; Hacker, V. Platinum-cobalt catalysts for the oxygen reduction reaction in high temperature proton exchange membrane fuel cells—Long term behavior under ex-situ and in-situ conditions. J. Power Sources 2014, 266, 313–322. [Google Scholar] [CrossRef]
  35. Schindler, S.; Weiss, A.; Galbiati, S.; Mack, F.; Danzer, M.A.; Zeis, R. Identification of Polarization Losses in High-Temperature PEM Fuel Cells by Distribution of Relaxation Times Analysis. ECS Trans. 2016, 75, 45–53. [Google Scholar] [CrossRef]
  36. Weiß, A.; Schindler, S.; Galbiati, S.; Danzer, M.A.; Zeis, R. Distribution of Relaxation Times Analysis of High-Temperature PEM Fuel Cell Impedance Spectra. Electrochim. Acta 2017, 230, 391–398. [Google Scholar] [CrossRef]
  37. Wan, T.H.; Saccoccio, M.; Chen, C.; Ciucci, F. Influence of the Discretization Methods on the Distribution of Relaxation Times Deconvolution: Implementing Radial Basis Functions with DRTtools. Electrochim. Acta 2015, 184, 483–499. [Google Scholar] [CrossRef]
  38. Zhang, J. PEM Fuel Cell Electrocatalysts and Catalyst Layers: Fundamentals and Applications; Springer: London, UK, 2008; pp. 1–1137. [Google Scholar]
  39. Rezaei Niya, S.M.; Phillips, R.K.; Hoorfar, M. Study of anode and cathode starvation effects on the impedance characteristics of proton exchange membrane fuel cells. J. Electroanal. Chem. 2016, 775, 273–279. [Google Scholar] [CrossRef]
  40. Mammar, K.; Chaker, A. Flooding and drying diagnosis of proton exchange membrane fuel cells using electrochemical impedance spectroscopy analysis. J. Electr. Eng. 2013, 13, 147–154. [Google Scholar]
  41. Fasmin, F.; Ramanathan, S. Effect of CO Poisoning of PEM Fuel Cell Anode on Impedance Spectra-Simulations. ECS Trans. 2015, 66, 1–14. [Google Scholar] [CrossRef]
  42. Murugan, A.; Brown, A.S. Review of purity analysis methods for performing quality assurance of fuel cell hydrogen. Int. J. Hydrogen Energy 2015, 40, 4219–4233. [Google Scholar] [CrossRef]
Figure 1. The domain of the current work on the diagnostic tool development process.
Energies 12 00152 g001
Figure 2. A schematic of the setup used in these experiments.
Energies 12 00152 g002
Figure 3. Starvation tests at 40 A: (a) anode starvation EIS spectra; (b) anode starvation DRT analysis; (c) cathode starvation EIS spectra. (d) cathode starvation DRT analysis.
Energies 12 00152 g003
Figure 4. Flooding tests on both the anode and cathode simultaneously at 40 A: (a) EIS spectra; (b) DRT analysis.
Energies 12 00152 g004
Figure 5. Drying at 40 A: (a) anode drying EIS spectra; (b) anode drying DRT analysis; (c) cathode drying EIS spectra; (d) cathode drying DRT analysis.
Energies 12 00152 g005
Figure 6. CO poisoning at 40 A: (a) EIS spectra; (b) DRT analysis.
Energies 12 00152 g006
Figure 7. Sulfur poisoning at 40 A: (a) impedance spectra; (b) DRT analysis.
Energies 12 00152 g007
Figure 8. Sulfur poisoning at 40 A (second fuel cell stack): (a) impedance spectra; (b) DRT analysis. The numbers on the right-hand side of H2S in the legend indicate the run numbers for the set point, and the last spectrum of each set point (Spectrum 6) was selected for the DRT analysis.
Energies 12 00152 g008
Figure 9. Polarization curves at the beginning of tests, after the end of each fault test, and a final H2S recovery test after six months of rest.
Energies 12 00152 g009
Table 1. Test matrix with the fault intensity levels for the selected parameters. All tests were done at 40 A, and for flooding tests, the dew temperature of gases was set to 53 C , while the temperatures of the stack (T s t a c k ) and the inlet gases were varied simultaneously on the anode and cathode side.
Fault LevelStarvationFloodingDryingCO (ppm)H2S (ppm)
λ H 2 λ air T stack ( C ) → RH fuel (%)RH air (%)RH fuel (%)RH air (%)
11.11.655 → 9191656544
21.0751.553 → 100100454588
31.051.451 → >100>10025251212
4 49 → > > 100 > > 100
Table 2. Association of DRT peaks with fuel cell losses in the current work and in the literature.
Fuel Cell TypeFrequency of the PeaksAssociated LossesReference
LT-PEMFC<200 HzMass transport (starvation, flooding),Current work
ORR, HOR (H2S)
100–2000 HzProton conduction (drying),
HOR (CO and H2S)
LT-PEMFC<2 HzOxygen gas diffusion[32]
2–15 HzORR, hydrogen gas diffusion
100–1000 HzHOR
500 Hz–30 kHzProton transport in catalyst layer
HT-PEMFC1 HzMass transport[35,36]
10–50 HzORR[36]
>100 HzHOR, proton conduction[35,36]
SOFC10 HzGas diffusion in anode substrate[33]
10–100 HzORR
>10 kHzHOR, ionic transport,
gas diffusion in anode functional layer
Table 3. Peak changes for the different operating conditions. The peaks are counted from P 0 at the lowest frequency to P 4 at the highest frequency. ∘ indicates the presence of a peak without data for its changes; n/a indicates the absence of a peak; - indicates no changes; and the arrows indicate the direction of changes compared to less faulty conditions.
Peak No.StarvationFloodingDryingCOH2S
AnodeCathodeAnodeCathode
P 0 n/an/an/an/an/a
P 1 ---
P 2 ---
P 3 -
P 4 ----