Article

Use of Neural Networks to Identify Safety Prevention Priorities in Agro-Manufacturing Operations within Commercial Grain Elevators

by
Fatemeh Davoudi Kakhki
1,*,
Steven A. Freeman
2 and
Gretchen A. Mosher
2
1
Department of Technology, San Jose State University, San Jose, CA 95192, USA
2
Department of Agricultural and Biosystems Engineering, Iowa State University, Ames, IA 50011, USA
*
Author to whom correspondence should be addressed.
Appl. Sci. 2019, 9(21), 4690; https://doi.org/10.3390/app9214690
Submission received: 6 October 2019 / Revised: 23 October 2019 / Accepted: 31 October 2019 / Published: 4 November 2019
(This article belongs to the Section Computing and Artificial Intelligence)

Abstract

:
The grain handling industry plays a significant role in U.S. agriculture by storing, distributing, and processing a variety of agricultural commodities. Commercial grain elevators are hazardous agro-manufacturing work environments where workers are prone to severe injuries, due to the nature of the activities and workplace. Safety incidents in agro-manufacturing operations generally arise from a combination of factors, rather than a single cause, therefore, research on occupational incidents must look deeper into identifying the underlying causes, through the application of advanced analyses methods. In occupational safety, it is possible to estimate and predict probability of safety risks through developing artificial neural network predictive models. Due to the significance of safety risk assessment in the design and prioritization of effective prevention measures, this study aimed at classifying and predicting causes of occupational incidents in grain elevator agro-manufacturing operations in the Midwest region of the United States. Workers’ compensation claims data, from 2008 to 2016, were utilized for training multilayer perceptron (MLP) and radial basis function (RBF) neural networks. Both MLP and RBF models could predict the probability of safety risks with a high overall accuracy of 60%, 61%. Based on values of AUC (area under the curve) from the ROC (receiving operating charts), both models predicted the probability of individual safety risks with a high accuracy rate of between 71.5% and 99.2%. In addition, sensitivity analysis showed that nature of injury is the most significant determinant of safety risks probability, along with type of injury. The novelty of this study is the use of the artificial neural network methodology to analyze multi-level causes of occupational incidents as the sources of safety risks in bulk storage facilities. The results confirm that artificial neural networks are useful in safety risk estimation, and identifying the incidents’ risk factors. The implementation of safety measures in grain elevators can help in preventing occupational injuries, saving lives, and reducing the occurrence and severity of such incidents in industrial work environments.

1. Introduction

Despite extensive and ongoing efforts to reduce occupational incidents, the World Health Organization (WHO) has introduced occupational injuries as a public heath epidemic [1]. Occupational injuries are one the most significant health threats in largescale workplaces [1], and are associated with suffering and loss at individual, community, societal and organizational levels [2]. At the organization level, occupational accidents have a significant negative influence on the financial performance of a company [3]. Workplace incidents have direct costs, paid as medical and indemnity expenses to the injured. In addition, indirect costs of occupational incidents include equipment damage and repair, incident investigation time, training new personnel for the replacement of injured ones, an increase in insurance premiums in the year following the incidents, a slowdown of production schedules, damage to companies’ reputation, and lowering workers’ motivation to return to work [4]. These observations point to the growing importance of workplace health and safety intervention efforts [5].
Identifying the patterns of incident occurrence in different types of workplace incidents provides a broader perspective on preventative strategies than might be gained from studying a single type of workplace [6]. Workplace incidents are the result of various causes [7]. Thus, it is necessary to learn from past incidents to plan measures that reduce the likelihood of future incidents [8]. Using injury data, occupational incident analysis focuses on identifying the prevalent causes of incidents to design proper prevention measures [9].
Conducting in-depth research on identifying risk factors and causes of occupational incidents in various industries will ultimately help to reduce the rate of incidents and injuries [10] through establishing effective injury prevention programs [11]. Agricultural-related industries are high-hazard workplaces, where workers are exposed to serious safety risks and the cost of occupational incidents is enormous [12]. The grain handling industry has a significant role in U.S. agriculture by storing, distributing, and processing a variety of agricultural commodities [13]. The expansion of grain storage capacity in recent years has led to a higher number of occupational incidents in grain handling industrial operations [14]. The frequency and costs of occupational incidents in grain elevators are higher than in other agribusinesses [11,15,16,17]. Few studies have addressed safety issues in the grain handling industry. Mosher, Keren, Freeman, and Hurburgh [18] evaluated the role of human factors in the management of occupational safety in commercial grain handling facilities. Geng and Jepsen [11] conducted a survey on grain handling operations to evaluate how safety and health information was incorporated at the grain handling and storage facilities in Ohio, US. Ramaswamy and Mosher [14] used chi-square contingency tables to characterize the injury costs in commercial grain elevators, and showed that employee age and tenure, cause of injury, and body part injured have a significant influence on the cost of occupational incidents in such an industry. Davoudi Kakhki, Freeman, and Mosher [19] utilized various machine learning methods in estimating the severity of injuries in agribusiness industries, based on information from workers’ compensation data. However, there is no recent comprehensive study focused on identifying the causes of occupational incidents in agribusiness operations and within grain elevators, using advanced data mining methods.
Workers’ compensation data are a rich source of injury data, which includes detailed incident information about the demographics of the injured workers, as well as type of injury, nature of injury, main causes of injury, and injured body parts. In this study, a data set with over 5000 workers’ compensation claims, reported between 2008 and 2016, was used. The details of the data are explained in Section 3.1. Using information from workers’ compensation claims, the primary interest of this study is to identify which incident factors are important in influencing the probability of a specific safety risk occurrence. Furthermore, this study aims to apply, validate and assess the performance of multilayer perceptron (MLP) and radial basis function (RBF) neural networks in accurately classifying and predicting the main sources of safety risks (causes) of occupational incidents in commercial grain elevators in the Midwest of the United States.
This study contributes to the current literature on the analysis of non-farm, agricultural-related occupational injuries, by investigating the effect of workers’ age, experience, occupation, and the type and nature of injury for classification purposes, in the cause prediction of such incidents. In addition, interpreting the results from the ANN model could provide useful insights about the contributing factors of potential future occupational incidents. Such insights aid safety practitioners and planners, who aim to revise safety measures and reduce occupational incident rates in non-farm, agricultural-related industries.
The rest of the paper is organized as follows: Section 2 presents a review of the literature on the ANN methods and their applications in occupational safety analytics; Section 3 explains the data and modeling procedures; Section 4 presents, evaluates, and discusses the analysis findings, and applications; in Section 5, discussions of conclusions, the limitations of the research and future studies complete this paper.

2. Literature Review

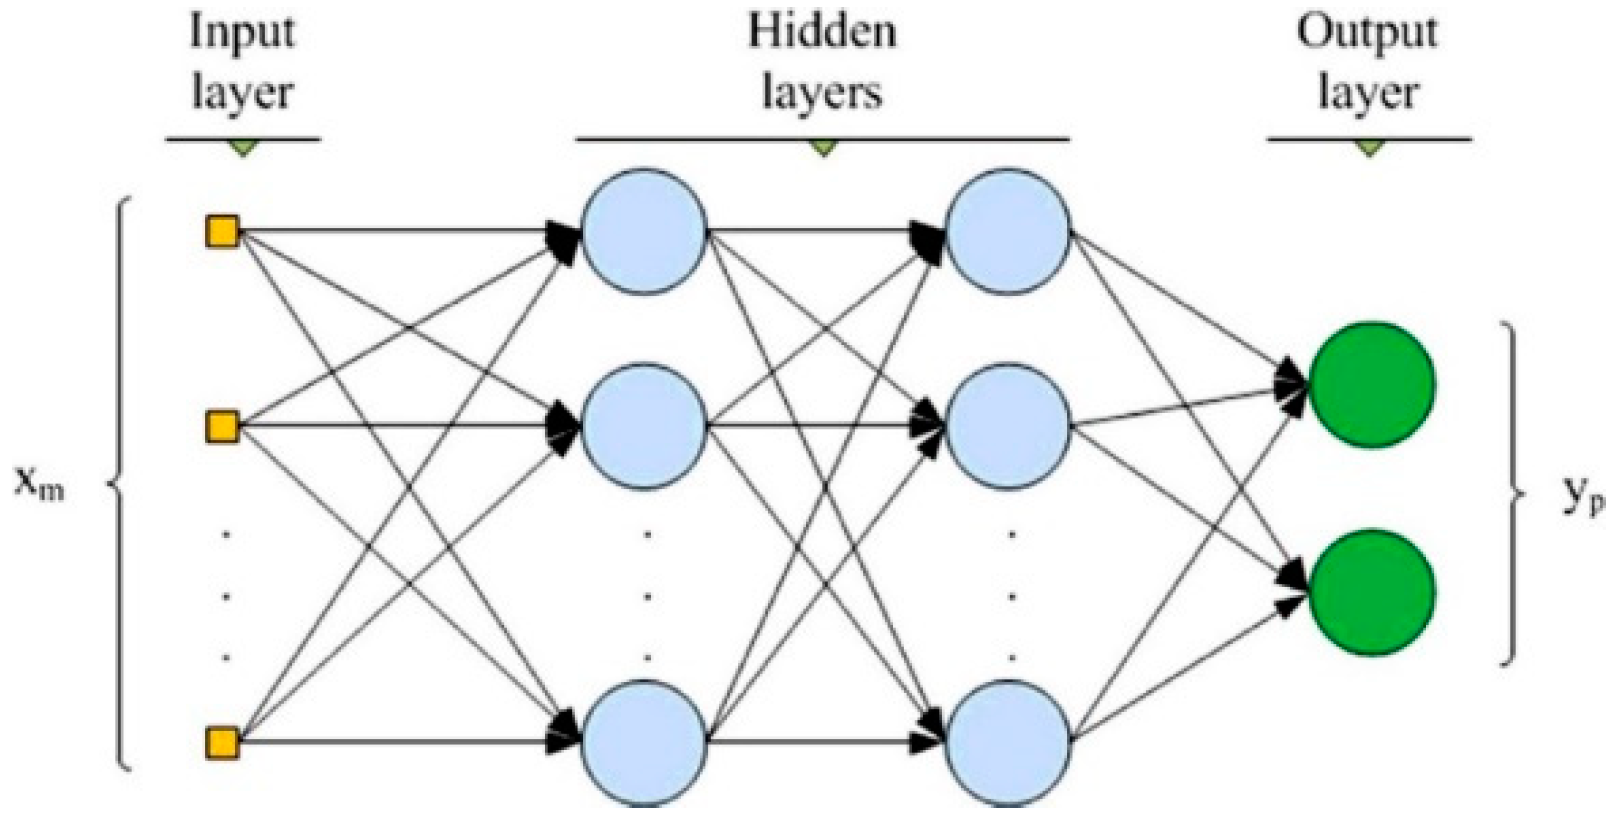
2.1. Artificial Neural Networks

Artificial Neural networks (ANNs) are well suited for classification and prediction [20]. ANNs enable problem-solving by changing the structure of interconnected components [21]. The reason for the popularity of ANNs is that is they are non-parametric statistical models, which do not need any assumptions between input and output variables [22], and that they have the ability to learn from experience and enhance their functions to improve classification and prediction accuracy [23]. Nonlinear modeling machine learning (such as ANNs) is used to extract information from noisy data, and can avoid over-fitting, making it generally more robust [24,25]. The ANNs are composed of nodes connected by directed links, and each link has a numeric weight [26]. Preparation of the ANNs includes data cleaning and processing, and choosing the number of hidden layers, number of nodes, type of activation function and learning algorithm rate. In this research, two types of ANNs are applied: multilayer perceptron (MLP) and radial basis function (RBF) neural networks. Both MLP and RBF are used in predictive modeling as ‘supervised’ methods, in the sense that the model-predicted results can be compared against the known values of the target variable [27].
The first algorithm is the MLP neural networks as in Figure 1, which consist of three kinds of layers: Atablien input layers, a hidden layer(s), and an output layer. MLP can have one or many hidden layers, and the number of hidden layers can be determined by trial and error, or intelligently. There are some neurons in each layer. Artificial neurons, as processing units, constitute ANNs, which are parallel distributed systems. The amount of input and output data determines the number of neurons in the input and output layers. The input layer contains the predictors. The hidden layer contains unobservable nodes, or units. The value of each hidden unit is some function of the predictors; the exact form of the function depends [28], in part, upon the network type and in part upon user-controllable specifications. The output layer contains the responses. Each output unit is some function of the hidden units. The second type are RBF neural networks as in Figure 2, with the same three layers, which have the ability to generalize the results with high tolerance of input noise [23]. In other words, the RBF network consists of a layer of units, performing linear or non-linear functions of the attributes, followed by a layer of weighted connections to nodes, whose outputs have the same form as the target vectors. As seen from Figure 2, RFB networks have only three layers, which makes them superior to the MLP for easy design [29]. More details about the structure and specifications of MLP and RBF can be found in [27,28,29,30,31,32,33].

2.2. Artificial Neural Networks in Occupational Safety

Predictive modeling is the use of data to forecast future events by capturing relationships between explanatory variables and predicted variables from past events, and applying them to predict future outcomes [34]. Artificial neural networks (ANNs) are among the most popular predictive methods in analyzing occupational incidents [1,35,36] predicting causes and severity of injuries [37,38], and determining the underlying factors that influence workplace incidents [39,40,41].
Training ANNs is a practical method for assessing the severity of occupational incidents, based on a combination of incident risk factors [39]. Many studies have used ANN modeling in industrial settings to analyze occupational incidents and injuries. The work of Asensio-Cuesta et al. [42] and Zurada et al. [43] analyzed the effect of specific industrial lifting jobs, and workplace design on lower back pain. The work of Darvishi et al. [44] estimated the probability of lower back pain from occupational incidents in industrial units with a prediction accuracy rate of 92% in train and test data, based on sixteen risk factors of lower back pain in such injuries. The work of Aliabadi et al. [45] predicted the hearing loss threshold in high-noise industrial workplaces in a steel factory, and analyzed the effects of occupational exposure risk factors on determining the hearing loss threshold. The work of Shankar Beriha et al. [46] identified the deficiencies in safety health practices in Indian industries and analyzed the influence of workplace hazards on injury level and material damage. Other studies used ANNs to analyze and classify the risk of injury from machine and drilling [47], and the slip–trip incident risk in construction-related occupations [48].

3. Materials and Methods

The data for this study were taken from a leading insurance company, specializing in agricultural commodities in the United States. The data show that a loss of over $78 million U.S. dollars was incurred in occupational incidents costs, that occurred in grain elevators and cooperatives over eight years, from 2008 to 2016. The incurred amount was paid in both closed claims and open claims, which are a continued cost for the parties involved. In more than 5500 incidents, 92% are closed claims, and 8% of claims are open. However, an almost equal proportion of the total amount incurred is paid on open claims (50.23%) and closed claims (49.77%). In this study, all claims (both open and closed) were analyzed. SPSS IBM 26 and JMP Pro statistical software (JMP®, Version 13.2, SAS Institute Inc., Cary, NC, USA, 1989–2007) were used to build MLP and RBF ANN predictive models. The models were used to forecast the probability of the main causes of incidents, based on available workers’ compensation information.

3.1. Variable Importance

The predictors in this study are type of injury, nature of injury, Class Description, Age, Experience, and Gender. The type of injury refers to the main outcome of the incident, and has three main classifications: medical injuries, permanent partial disability, and temporary total or temporary partial disability, forming of 75.28%, 15.64%, and 9.07% of the total claims, respectively. The nature of injury shows the specification of an injury, such as fracture, laceration, concussion, or burn. The variable Class Description refers to the main classification of the operations/occupations a worker was involved in when the injury happened. The detailed frequencies of the nature of both injury and class description are illustrated in Figure 3 and Figure 4.
In order to determine the statistical significance of the predictors in relation to the output variable, a chi-square test was used. The chi-square statistical test determines the dependency of two categorical variables. The results from the chi-square test, represented in Table 1, show that all the input variables, except gender, were statistically significant, and contributed to the prediction of the output variable (injury cause group). The target variable was the cause group of the occupational injury, with six categories: strain or injury by (33%); fall, slip, or trip injury (31%); struck or injured by (15%); cut, puncture, scrap (12%); heat or cold exposures (5%), and caught in, under, or between (4%). ANNs were applied on the information from the workers’ compensation, as input variables that included worker demographics (occupation class, age, and years on the job), and injury nature and type, to classify and predict the main causes of occupational incidents in grain elevators.

3.2. Architecture of ANNs

Data for this analysis were divided into train (70%) and test (30%) sets. The decision regarding the usefulness of a predictive model was made against the test set. The reason for dividing data into train and test sets was to decrease the bias in the results [49]. Table 2 shows the specifications of both MLP and RBF neural networks.

3.3. Model Assessment Criteria

This section explains the measures of fit to evaluate the performance of ANNs. These criteria are applied in the model assessment for classification problems with binary or multi-level categorical output variables. The overall accuracy rate is a measure of how successful the model is in correctly grouping the predicted categorical response as the actual one; it is presented as the numerical difference of 1 and the misclassification rate. The misclassification rate is the rate at which the categorical response group with the highest fitted probability is not the actual group. The confusion rate is a measure that shows the percentage of correct classification of a categorical response, and is expressed in the form of a contingency table, where the diagonal values show the correct classification frequency of a multi-level categorical response. Area under the curve (AUC) is an indicator of the predictive model goodness of fit, and is gained from the receiving operating chart (ROC). Past research has proven that the ROC curve is a standard and useful tool to determine the quality of deterministic and probabilistic models [50]. The ROC curve provides a comprehensive and visually attractive way to summarize the accuracy of predictions [51]. It is widely applicable, regardless of the source of predictions. In the ROC curve, on the X axis, the “sensitivity” of the model is plotted, against “100-specificity” on the Y axis [52]. The area under the ROC curve (AUC) shows the ability of a model to predict the correct occurrence or non-occurrence of landslide events. As the AUC values increase, the predictive capability of the model is better. According to Yesilnacar and Topal [53], the quantitative–qualitative relation between the AUC and prediction accuracy can be classified as follows: 0.5–0.6 (poor), 0.6–0.7 (average), 0.7–0.8 (good), 0.8–0.9 (very good), and 0.9–1(excellent).

4. Results

This section discusses the results from the ANNs models and assesses their performance and application in identifying safety prevention priorities in agro-manufacturing operations. The performance of the ANNs models on train and test data sets is discussed. The quantitative measures of model performance are gained from the confusion matrices, which include the frequency of each incident cause group in actual and predicted classes. The AUC values are gained from the ROC charts. A discussion of the information gained from the ANNs, regarding the factors influential in predicting injury causes via sensitivity analysis, completes this section.

4.1. Model Performance

Table 3 depicts the results for the classification and prediction performance for both MLP and RBF models. The overall model accuracy rates in all data sets was over 60%. Deciding on the test dataset for model performance, the ANNs model was able to accurately classify and predict the causes of incidents (no matter what group) in 64% of cases. Table 4 and Table 5 show the MLP and RBF models performance in the prediction and classification of individual safety risk sources (cause group). From the MLP model performance on the test sets, the incident cause groups with the highest prediction accuracy were cut, puncture, scrape (86.1%), strain or injury by (84.4%), and heat or cold exposure (75.7%). The MLP ANNs predicted that cut, puncture, scrape would have the highest chance of being the main cause of incident occurrence in grain elevator occupational injuries, followed by strain, and heat or cold exposure.
The other cause groups had a relatively lower prediction and classification rate. Incident cause group of fall, slip, or trip injury had a 50.4% classification accuracy rate. This means that future incidents in grain elevator operations were expected to happen due to falls, slips, or trips with a probability of almost 0.51. Struck or injured by, and caught in, under, or between injury groups had the lowest accuracy rate: 28.9%, and 5.0% respectively. As suggested by the literature, in general, binary categorical outputs are expected to have a higher prediction accuracy (random performance: 50%), compared to three-level categorical outputs (random performance: 33.3%) [54]. As categories increased, the expected accuracy per class dropped [55]. This explains the lower classification accuracy in specific cause groups (caught in, under, or between; struck or injured by).
The results from the RBF model agrees with the MLP outcomes, with a bit less accuracy per predicted class.

4.2. ROC and AUC Results

According to Bradley [49], the AUC is one of the most accurate model assessment criteria in classification problems, that indicates how well separated classes are based on the modeling algorithm. At a cut point of 0.5 in the ROCs, a value of 1 indicates a perfect fit and a value near 0.5 indicates that the model cannot discriminate among groups. Looking at the AUC values for the test data set from Table 6, all incident cause groups have high AUC values (AUC: 71.5% to 99.2%). Based on the AUC results, both MLP and RBF models were successful in accurately and effectively separating the incident causes based on the input information. The results from the RIC charts and AUC values are shown in Figure 5 and Figure 6.

4.3. Sensitivity Analysis

To extract detailed information about the relationship between the input variables and outcomes, sensitivity analysis is used as a valuable way to evaluate such relationship [19,56]. In other words, sensitivity analysis investigates the relative contribution of the uncertainty (variability) of the input variables on the uncertainty (variability) in the output levels [57]. As a feature extraction method in ANN models [58], sensitivity analysis computes the importance of each predictor (independent variable) in determining the probability of an output in the neural network [27]. The results of the sensitivity analysis in the study are depicted in Table 7.

4.4. Model Intepretation and Application in Safety

Based on the analysis in this study, both MLP and RBF NN models show high performance in classifying and predicting multi-categorical incident causes in workers’ compensation claim data in occupational injuries from within commercial grain elevators. The results show that applying ANNs could be a straightforward approach for probabilistic prediction of the main causes of incidents based on prior injuries data (type and nature), as well as on the workers’ age, experience, and occupation.
The results from the analysis emphasize the role of the nature of injury in such predictions and classifications, and are in agreement with the previous literature on the significance of the nature of injury in determining the severity of occupational injuries [15,16,59,60,61,62,63,64]. In general, injuries are divided into three main groups in workers’ compensation claims: occupational disease, multiple injuries, and specific injuries. However, each category has many details, from amputation and laceration, to contusion, fracture, hearing impairment, and vision loss. For example, regardless of occupation or injury type, the cause of carpal tunnel syndrome in all occupational injuries was most likely strain (0.75–0.79 probability). The main cause of incidents of inflammation was predicted to be struck or injured by, with little variation in the prediction probability based on occupation class (0.35–0.46 probability). Dislocation injuries have a probability of between 0.60 to 0.79 to occur due to the fall, slip, or trip cause group.
The results also indicate the significant effect of the workers’ occupation in predicting the potential causes of the incidents, which agrees with previous studies on the significance of work-related activities in determining the probability of specific safety risks and incident severity in agro-industry workers [65,66,67].
Although the experience and age of the worker are not the most significant contributors to the probability of a specific safety risk from the RBF model, they both show a high impact on the sensitivity analysis of the MLP model. This also agrees with the previous literature about the importance of workers’ age and their years on the job in the occurrence of a specific incident [68,69,70].
The main application of this model could be to provide a probabilistic table of various scenarios, for which the main cause of incident can be estimated [39]. A variety of levels for each predictor of the multi-categorical cause group output variable were fed into the ANNs model, and the probability of each cause group incidence was calculated and compared. The cause group with the highest probability was then classified as the main future cause of injury. For example, a puncture medical injury in a younger worker, with less experience, was mostly estimated to occur for a fall, slip, or trip, while the same puncture in an older worker, with more years on the job, was estimated to be caused by being struck, and has a permanent partial disability outcome. Table 8 shows various scenarios and their predicted cause group, based on the ANNs model results for a worker occupied in grain elevator operations with a permanent partial disability injury.
Further application of ANNs involved estimating the most probable, and predicting the most dominant causes of, incidents, based on occupation. Strain or injury by was predicted as the main cause of injury in grain elevator operations, farm machinery operations, grain milling, and auto service/ repair occupation classes, which is the same as in the original data. Hay grain or feed dealers have the same actual and predicted main cause group, of fall, strip, or trip. For chauffeurs, helpers and gas and oil dealers, the actual cause group is fall, strip, or trip injury, while the most likely predicted cause is strain or injury by. Considering these results, the most dominant cause groups for all occupations in commercial grain elevators are either strain or injury by, or fall, slip, and trip injury. Safety practitioners can prioritize preventing those incidents that are caused by these two groups, and invest in doing so, with the purpose of efficiently decreasing the frequency of incidents.
Considering the monetary expenses of occupational incidents, the loss was huge. These data show that, on average, $16,200 was incurred on medical costs and $8400 on indemnity costs for a worker injured due to fall, slip, or trip injuries. The average medical and indemnity expenses for an injury caused by strain were $7800 and $5400, respectively. The highest mean medical and indemnity costs belong to the caught in, under, or between cause group ($19,000 and $9500), followed by the heat or cold exposure cause group ($16,500 and $5000). Struck, or injured by, and cut, puncture, scarp cause groups had the lowest medical ($5600 and $2300), and indemnity costs ($2700 and $620).

5. Conclusions

Many studies have applied artificial neural networks in occupational injury analysis with a binary classification of injury severity outcomes. Yet, very few have addressed a multi-categorical injury outcome problem, specifically in non-farm agricultural-related occupational incidents. The novelty of this study was in analyzing the multi-level causes of occupational incidents as the source of safety risks in bulk storage facilities in the Midwest of the United States. This study incorporated 5400 injury narratives, to investigate the influential predictors of causes of occupational incidents in agribusiness operations within commercial grain elevators. The results indicated that the nature of the injury has the highest contribution to the variation of the safety risks, along with the type of injury, either medical or a disability.
Considering model performance metrics, artificial neural networks have proved useful in accurately classifying various sources of safety risks and estimating the most likely causes of similar future incidents. The high predictive accuracy of artificial neural networks models (60% to 61% overall accuracy, and 71.5% to 99.2% accuracy per safety risk group) in the study justified the use of a machine learning complex model over traditional parametric statistical models. The main application of this study on safety was that it gives practitioners and managers the ability to prioritize safety interventions, providing the opportunity to remove the sources of hazards that have the highest chance of future occurrence. By identifying the link between incident cause and history of prior injuries, and using the workers’ demographics, the proposed artificial neural networks model structure can assist safety practitioners in planning relevant strategies to reduce or eliminate safety risks in grain elevators. The results of this study highlight the application of advanced machine learning methods in studying occupational incidents. The application of these methods, in addition to the opinion of safety experts and safety regulations, enhances safety management in high-hazard workplaces.
Considering the architecture of artificial neural networks models, future research should focus on augmenting the predictive accuracy rate for multi-categorical classification problems. When addressing scenarios with more than two classes of target variable, deep learning is the preferred solution in pattern recognition. However, the construction of a deep learning model was not applied in this study, due to the data limitation. Deep learning models have the problem of overfitting data when applied to small samples. Since workers’ compensation information is recorded by a human, another limitation of the study is the loss of some data, due to entry errors. Regarding the overall approach, similar techniques could be taken to apply artificial neural networks for cause identification in other industrial settings where the information about prior incidents and workers’ demographics is available. A direction for future research is to apply the methodology of this research in other industries to validate the methods and results. This study provides proper analytical techniques for safety practitioners who continue to research the application of complex data mining methods to efficiently and meaningfully analyze occupational incidents in various industries and businesses.

Author Contributions

Conceptualization, F.D.K., S.A.F. and G.A.M.; Formal analysis, F.D.K.; Methodology, F.D.K.; Resources, S.A.F. and G.A.M.; Writing—original draft, F.D.K.; Writing—review and editing, S.A.F. and G.A.M.

Funding

This research received no external funding.

Conflicts of Interest

The authors declare no conflict of interest.

References

  1. Mohammadfam, I.; Soltanzadeh, A.; Moghimbeigi, A.; Alizadeh Savareh, B. Use of Artificial Neural Networks (ANNs) for the Analysis and Modeling of Factors That Affect Occupational Injuries in Large Construction Industries. Electron. Physician 2015, 7, 1515. [Google Scholar] [CrossRef] [PubMed]
  2. Mekkodathil, A.; El-Menyar, A.; Al-Thani, H. Occupational Injuries in Workers from Different Ethnicities. Int. J. Crit. Illn. Inj. Sci. 2016, 6, 25. [Google Scholar] [CrossRef] [PubMed]
  3. Argilés-Bosch, J.M.; Martí, J.; Monllau, T.; Garcia-Blandón, J.; Urgell, T. Empirical Analysis of the Incidence of Accidents in the Workplace on Firms’ Financial Performance. Saf. Sci. 2014, 7, 123–132. [Google Scholar] [CrossRef]
  4. Gavious, A.; Mizrahi, S.; Shani, Y.; Minchuk, Y. The Costs of Industrial Accidents for the Organization: Developing Methods and Tools for Evaluation and Cost-Benefit Analysis of Investment in Safety. J. Loss Prev. Process Ind. 2009, 22, 434–438. [Google Scholar] [CrossRef]
  5. Altunkaynak, B. A Statistical Study of Occupational Accidents in the Manufacturing Industry in Turkey. Int. J. Ind. Ergon. 2018, 66, 101–109. [Google Scholar] [CrossRef]
  6. Amiri, M.; Ardeshir, A.; Fazel Zarandi, M.H.; Soltanaghaei, E. Pattern Extraction for High-Risk Accidents in the Construction Industry: A Data-Mining Approach. Int. J. Inj. Control Saf. Promot. 2016, 23, 264–276. [Google Scholar] [CrossRef]
  7. Hoła, A.; Sawicki, M.; Szóstak, M. Methodology of Classifying the Causes of Occupational Accidents Involving Construction Scaffolding Using Pareto-Lorenz Analysis. Appl. Sci. 2018, 8, 48. [Google Scholar] [CrossRef]
  8. Field, W.E.; Heber, D.J.; Riedel, S.M.; Wettschurack, S.W.; Roberts, M.J.; Grafft, L.M.J. Worker Hazards Associated with the Use of Grain Vacuum Systems. J. Agric. Saf. Health 2014, 20, 147–163. [Google Scholar] [CrossRef]
  9. Jacinto, C.; Canoa, M.; Guedes Soares, C. Workplace and Organisational Factors in Accident Analysis within the Food Industry. Saf. Sci. 2009, 47, 626–635. [Google Scholar] [CrossRef]
  10. Shafique, M.; Rafiq, M. An Overview of Construction Occupational Accidents in Hong Kong: A Recent Trend and Future Perspectives. Appl. Sci. 2019, 9, 2069. [Google Scholar] [CrossRef]
  11. Geng, Y.; Dee Jepsen, S. Current Grain Storage and Safety Practices of Ohio Cash Grain Operators. J. Agric. Saf. Health 2018, 24, 127–139. [Google Scholar] [CrossRef] [PubMed]
  12. Douphrate, D.I.; Rosecrance, J.C.; Wahl, G. Workers’ Compensation Experience of Colorado Agriculture Workers, 2000–2004. Am. J. Ind. Med. 2006, 49, 900–910. [Google Scholar] [CrossRef] [PubMed]
  13. Williams, G.D.; Rosentrater, K.A. Design Considerations for the Construction and Operation of Flour Milling Facilities. Part I: Planning, Structural, and Life Safety Considerations. In 2007 ASABE Annual International Meeting, Technical Papers; American Society of Agricultural and Biological Engineers: St. Joseph, MI, USA, 2007. [Google Scholar]
  14. Ramaswamy, S.K.; Mosher, G.A. Using Workers’ Compensation Claims Data to Characterize Occupational Injuries in the Commercial Grain Elevator Industry. J. Agric. Saf. Health 2017, 23, 203–217. [Google Scholar] [CrossRef] [PubMed]
  15. Davoudi Kakhki, F.; Freeman, S.A.; Mosher, G.A. Use of Logistic Regression to Identify Factors Influencing the Post-Incident State of Occupational Injuries in Agribusiness Operations. Appl. Sci. 2019, 9, 3449. [Google Scholar] [CrossRef]
  16. Davoudi Kakhki, F.; Freeman, S.; Mosher, G. Segmentation of Severe Occupational Incidents in Agribusiness Industries Using Latent Class Clustering. Appl. Sci. 2019, 9, 3641. [Google Scholar] [CrossRef]
  17. Davoudi Kakhki, F.; Freeman, S.; Mosher, G. Analyzing Large Workers’ Compensation Claims Using Generalized Linear Models and Monte Carlo Simulation. Safety 2018, 4, 57. [Google Scholar] [CrossRef]
  18. Mosher, G.A.; Keren, N.; Freeman, S.A.; Hurburgh, C.R. Development of a Safety Decision-Making Scenario to Measure Worker Safety in Agriculture. J. Agric. Saf. Health 2014, 20, 91–107. [Google Scholar] [CrossRef]
  19. Davoudi Kakhki, F.; Freeman, S.A.; Mosher, G.A. Evaluating Machine Learning Performance in Predicting Injury Severity in Agribusiness Industries. Saf. Sci. 2019, 117, 257–262. [Google Scholar] [CrossRef]
  20. Yao, J.T. Sensitivity Analysis for Data Mining. In Proceedings of the Annual Conference of the North American Fuzzy Information Processing Society—NAFIPS, Chicago, IL, USA, 24–26 July 2003. [Google Scholar] [CrossRef]
  21. Buscema, P.M.; Massini, G.; Breda, M.; Lodwick, W.A.; Newman, F.; Asadi-Zeydabadi, M. Artificial Neural Networks. In Studies in Systems, Decision and Control; PHI Learning Pvt. Ltd.: New Delhi, India, 2018. [Google Scholar] [CrossRef]
  22. Ahmadi, M.A.; Ebadi, M.; Hosseini, S.M. Prediction Breakthrough Time of Water Coning in the Fractured Reservoirs by Implementing Low Parameter Support Vector Machine Approach. Fuel 2014, 117, 579–589. [Google Scholar] [CrossRef]
  23. Santos, R.B.; Rupp, M.; Bonzi, S.J.; Fileti, A.M.F. Comparison between Multilayer Feedforward Neural Networks and a Radial Basis Function Network to Detect and Locate Leaks in Pipelines Transporting Gas. Chem. Eng. Trans. 2013, 32, e1380. [Google Scholar] [CrossRef]
  24. Dong, Y.; Hu, Z.; Uchimura, K.; Murayama, N. Driver Inattention Monitoring System for Intelligent Vehicles: A Review. IEEE Trans. Intell. Transp. Syst. 2011, 12, 596–614. [Google Scholar] [CrossRef]
  25. Jacobé de Naurois, C.; Bourdin, C.; Stratulat, A.; Diaz, E.; Vercher, J.L. Detection and Prediction of Driver Drowsiness Using Artificial Neural Network Models. Accid. Anal. Prev. 2019, 126, 96–104. [Google Scholar] [CrossRef] [PubMed]
  26. Patel, D.A.; Jha, K.N. Neural Network Model for the Prediction of Safe Work Behavior in Construction Projects. J. Constr. Eng. Manag. 2014, 114, 04014006. [Google Scholar] [CrossRef]
  27. IBM SPSS Neural Networks—Smit Consult. Available online: https://www.smitconsult.nl/en/products/ibm-spss-statistics/info/ibm-spss-neural-networks/ (accessed on 25 September 2019).
  28. Tatar, A.; Naseri, S.; Bahadori, M.; Hezave, A.Z.; Kashiwao, T.; Bahadori, A.; Darvish, H. Prediction of Carbon Dioxide Solubility in Ionic Liquids Using MLP and Radial Basis Function (RBF) Neural Networks. J. Taiwan Inst. Chem. Eng. 2016, 60, 151–164. [Google Scholar] [CrossRef]
  29. Tatar, A.; Shokrollahi, A.; Mesbah, M.; Rashid, S.; Arabloo, M.; Bahadori, A. Implementing Radial Basis Function Networks for Modeling CO2-Reservoir Oil Minimum Miscibility Pressure. J. Nat. Gas Sci. Eng. 2013, 15, 82–92. [Google Scholar] [CrossRef]
  30. Geronimo, T.M.; Cruz, C.E.; de Souza Campos, F.; Aguiar, P.R.; Bianchi, E.C. MLP and ANFIS Applied to the Prediction of Hole Diameters in the Drilling Process. Artificial Neural Networks—Architectures and Applications. 2013. Available online: https://www.intechopen.com/books/artificial-neural-networks-architectures-and-applications/mlp-and-anfis-applied-to-the-prediction-of-hole-diameters-in-the-drilling-process (accessed on 4 November 2019). [CrossRef] [Green Version]
  31. Du, K.L.; Swamy, M.N.S. Neural Networks in a Softcomputing Framework; Springer: Berlin/Heidelberg, Germany, 2006. [Google Scholar] [CrossRef]
  32. Abdelwahab, H.T.; Abdel-Aty, M.A. Artificial Neural Networks and Logit Models for Traffic Safety Analysis of Toll Plazas. Transp. Res. Rec. 2002, 1784, 115–125. [Google Scholar] [CrossRef]
  33. Roh, S.B.; Oh, S.K.; Pedrycz, W.; Seo, K.; Fu, Z. Design Methodology for Radial Basis Function Neural Networks Classifier Based on Locally Linear Reconstruction and Conditional Fuzzy C-Means Clustering. Int. J. Approx. Reason. 2019, 116, 228–243. [Google Scholar] [CrossRef]
  34. Jed Frees, E.W.; Derrig, R.A.; Meyers, G. Predictive Modeling in Actuarial Science. In Predictive Modeling Applications in Actuarial Science: Volume I: Predictive Modeling Techniques; Cambridge University Press: Cambridge, UK, 2014. [Google Scholar] [CrossRef]
  35. Parsaie, A.; Haghiabi, A.H.; Saneie, M.; Torabi, H. Applications of Soft Computing Techniques for Prediction of Energy Dissipation on Stepped Spillways. Neural Comput. Appl. 2018, 29, 1393–1409. [Google Scholar] [CrossRef]
  36. Ian, H.; Frank, E. Data Mining: Practical Machine Learning Tools and Techniques; Morgan Kaufmann: Burlington, MA, USA, 2011; ISBN 9780120884070. [Google Scholar]
  37. Mannering, F. Temporal Instability and the Analysis of Highway Accident Data. Anal. Methods Accid. Res. 2018, 17, 1–13. [Google Scholar] [CrossRef]
  38. Durán-Rosal, A.M.; Fernández, J.C.; Casanova-Mateo, C.; Sanz-Justo, J.; Salcedo-Sanz, S.; Hervás-Martínez, C. Efficient Fog Prediction with Multi-Objective Evolutionary Neural Networks. Appl. Soft Comput. J. 2018, 70, 347–358. [Google Scholar] [CrossRef]
  39. Carrillo-Castrillo, J.A.; Guadix Martín, J.; Grosso de la Vega, R.; Onieva, L. Neural Network Application for Risk Factors Estimation in Manufacturing Accidents; Springer: Cham, Switzerland, 2014. [Google Scholar] [CrossRef]
  40. Moghaddam, F.R.; Afandizadeh, S.; Ziyadi, M. Prediction of Accident Severity Using Artificial Neural Networks. Int. J. Civ. Eng. 2011, 9, 41. [Google Scholar]
  41. Delen, D.; Sharda, R.; Bessonov, M. Identifying Significant Predictors of Injury Severity in Traffic Accidents Using a Series of Artificial Neural Networks. Accid. Anal. Prev. 2006, 38, 434–444. [Google Scholar] [CrossRef] [PubMed]
  42. Asensio-Cuesta, S.; Diego-Mas, J.A.; Alcaide-Marzal, J. Applying Generalised Feedforward Neural Networks to Classifying Industrial Jobs in Terms of Risk of Low Back Disorders. Int. J. Ind. Ergon. 2010, 40, 629–635. [Google Scholar] [CrossRef]
  43. Zurada, J.; Karwowski, W.; Marras, W.S. A Neural Network-Based System for Classification of Industrial Jobs with Respect to Risk of Low Back Disorders Due to Workplace Design. Appl. Ergon. 1997, 28, 49–58. [Google Scholar] [CrossRef]
  44. Darvishi, E.; Khotanlou, H.; Khoubi, J.; Giahi, O.; Mahdavi, N. Prediction Effects of Personal, Psychosocial, and Occupational Risk Factors on Low Back Pain Severity Using Artificial Neural Networks Approach in Industrial Workers. J. Manip. Physiol. Ther. 2017, 40, 486–493. [Google Scholar] [CrossRef] [PubMed]
  45. Aliabadi, M.; Farhadian, M.; Darvishi, E. Prediction of Hearing Loss among the Noise-Exposed Workers in a Steel Factory Using Artificial Intelligence Approach. Int. Arch. Occup. Environ. Health 2015, 88, 779–787. [Google Scholar] [CrossRef]
  46. Shankar Beriha, G.; Patnaik, B.; Shankar Mahapatra, S. Assessment of Occupational Health Practices in Indian Industries: A Neural Network Approach. J. Model. Manag. 2012, 7, 180–200. [Google Scholar] [CrossRef]
  47. Liu, T.I.; Kumagai, A.; Lee, C. Enhancement of Drilling Safety and Quality Using Online Sensors and Artificial Neural Networks. Int. J. Occup. Saf. Ergon. 2003, 9, 37–56. [Google Scholar] [CrossRef]
  48. Lim, T.-K.; Park, S.-M.; Lee, H.-C.; Lee, D.-E. Artificial Neural Network—Based Slip-Trip Classifier Using Smart Sensor for Construction Workplace. J. Constr. Eng. Manag. 2015, 142, 04015065. [Google Scholar] [CrossRef]
  49. Bradley, A.P. The Use of the Area under the ROC Curve in the Evaluation of Machine Learning Algorithms. Pattern Recognit. 1997, 40, 1145–1159. [Google Scholar] [CrossRef]
  50. Swets, J.A. Measuring the Accuracy of Diagnostic Systems. Science 1988, 240, 1285–1295. [Google Scholar] [CrossRef] [PubMed]
  51. Tien Bui, D.; Pham, B.T.; Nguyen, Q.P.; Hoang, N.D. Spatial Prediction of Rainfall-Induced Shallow Landslides Using Hybrid Integration Approach of Least-Squares Support Vector Machines and Differential Evolution Optimization: A Case Study in Central Vietnam. Int. J. Digit. Earth 2016, 9, 1077–1097. [Google Scholar] [CrossRef]
  52. Tsangaratos, P.; Ilia, I. Landslide Susceptibility Mapping Using a Modified Decision Tree Classifier in the Xanthi Perfection, Greece. Landslides 2016, 13, 305–320. [Google Scholar] [CrossRef]
  53. Yesilnacar, E.; Topal, T. Landslide Susceptibility Mapping: A Comparison of Logistic Regression and Neural Networks Methods in a Medium Scale Study, Hendek Region (Turkey). Eng. Geol. 2005, 75, 251–266. [Google Scholar] [CrossRef]
  54. Choi, J.Y.; Yoo, T.K.; Seo, J.G.; Kwak, J.; Um, T.T.; Rim, T.H. Multi-Categorical Deep Learning Neural Network to Classify Retinal Images: A Pilot Study Employing Small Database. PLoS ONE 2017, 12, e0187336. [Google Scholar] [CrossRef]
  55. Deng, J.; Berg, A.C.; Li, K.; Fei-Fei, L. What Does Classifying More than 10,000 Image Categories Tell Us? In European Conference on Computer Vision; Lecture Notes in Computer Science (Including Subseries Lecture Notes in Artificial Intelligence and Lecture Notes in Bioinformatics); Springer: Berlin/Heidelberg, Germany, 2010. [Google Scholar] [CrossRef]
  56. Li, Z.; Liu, P.; Wang, W.; Xu, C. Using Support Vector Machine Models for Crash Injury Severity Analysis. Accid. Anal. Prev. 2012, 45, 478–486. [Google Scholar] [CrossRef]
  57. Pianosi, F.; Wagener, T. A Simple and Efficient Method for Global Sensitivity Analysis Based Oncumulative Distribution Functions. Environ. Model. Softw. 2015, 67, 1–11. [Google Scholar] [CrossRef]
  58. Harrington, P.D.B.; Wan, C. Sensitivity Analysis Applied to Artificial Neural Networks: What Has My Neural Network Actually Learned? Anal. Chem. 2002, 70, 2983–2990. [Google Scholar]
  59. Booth-Kewley, S.; Schmied, E.A.; Highfill-McRoy, R.M.; Sander, T.C.; Blivin, S.J.; Garland, C.F. A Prospective Study of Factors Affecting Recovery from Musculoskeletal Injuries. J. Occup. Rehabil. 2014, 24, 287–296. [Google Scholar] [CrossRef]
  60. Kumar, R.; Kumar, S. Musculoskeletal Risk Factors in Cleaning Occupation-A Literature Review. Int. J. Ind. Ergon. 2008, 38, 158–170. [Google Scholar] [CrossRef]
  61. Arocena, P.; Núñez, I.; Villanueva, M. The Impact of Prevention Measures and Organisational Factors on Occupational Injuries. Saf. Sci. 2008, 49, 1369–1384. [Google Scholar] [CrossRef]
  62. Mohammadfam, I.; Soltanzadeh, A.; Moghimbeigi, A.; Akbarzadeh, M. Factors Affecting Occupational Accidents in the Construction Industry (2009–2013). J. Occup. Health Epidemiol. 2014, 3, 88–95. [Google Scholar] [CrossRef]
  63. Bernacki, E.J. Factors Influencing the Costs of Workers’ Compensation. Clin. Occup. Environ. Med. 2004, 4, 249–257. [Google Scholar] [CrossRef] [PubMed]
  64. Moradhaseli, S.; Farhadian, H.; Abbasi, E.; Ghofranipour, F. Factors Affecting the Incidence of Occupational Accidents among Farmers. Health Educ. Health Promot. 2017, 5, 39–56. [Google Scholar]
  65. Chercos, D.H.; Berhanu, D. Work Related Injury among Saudi Star Agro Industry Workers in Gambella Region, Ethiopia; a Cross-Sectional Study. J. Occup. Med. Toxicol. 2017, 12, 7. [Google Scholar] [CrossRef] [PubMed]
  66. Molineri, A.; Signorini, M.L.; Tarabla, H.D. Risk Factors for Work-Related Injury among Farm Workers: A 1-Year Study. Rural Remote Health 2015, 15, 1–8. [Google Scholar]
  67. Jadhav, R.; Achutan, C.; Haynatzki, G.; Rajaram, S.; Rautiainen, R. Injury Risk Factors to Farm and Ranch Operators in the Central United States. Am. J. Ind. Med. 2017, 60, 889–899. [Google Scholar] [CrossRef]
  68. Swaen, G.M.H.; Van Amelsvoort, L.G.P.M.; Bültmann, U.; Kant, I.J. Fatigue as a Risk Factor for Being Injured in an Occupational Accident: Results from the Maastricht Cohort Study. Occup. Environ. Med. 2003, 60, 88–92. [Google Scholar] [CrossRef]
  69. Ramaswamy, S.K.; Mosher, G.A. Using Workers’ Compensation Claims Data to Characterize Occupational Injuries in the Biofuels Industry. Saf. Sci. 2018, 103, 352–360. [Google Scholar] [CrossRef]
  70. Mehrdad, R.; Seifmanesh, S.; Chavoshi, F.; Aminian, O.; Izadi, N. Epidemiology of Occupational Accidents in Iran Based on Social Security Organization Database. Iran. Red Crescent Med. J. 2014, 16, e10359. [Google Scholar] [CrossRef] [Green Version]
Figure 1. Schematics of multilayer perceptron neural networks [30].
Applsci 09 04690 g001
Figure 2. Schematic of radial basis function neural networks [31].
Applsci 09 04690 g002
Figure 3. Frequency of occupation class codes in grain elevators.
Applsci 09 04690 g003
Figure 4. Frequency of injury nature in grain elevators.
Applsci 09 04690 g004
Figure 5. Receiving operating charts (ROC) for MLP Model (Test Data).
Applsci 09 04690 g005
Figure 6. ROC for RBF Model (Test Data).
Applsci 09 04690 g006
Table 1. Variable importance using chi-square test.
Independent VariableChi-Square (χ2)p-Value
Type of injury316.077<0.0001 *
Nature of injury7544.33<0.0001 *
Class Description145.63<0.0001 *
Age253.07<0.0001 *
Experience60.78<0.0001 *
Gender7.970.1578
* p-value < α = 0.05 statistically significant variable.
Table 2. MLP vs RBF Network Structure.
LayerStructure CriteriaMLPRBF
Input LayerFactorsInjury NatureInjury Nature
Class DescriptionClass Description
Injury TypeInjury Type
ExperienceExperience
AgeAge
Number of Units46884679
Hidden Layer(s)Number of Hidden Layers21
Number of Units in Hidden Layer 1210 *
Activation FunctionHyperbolic tangentSoftmax
Output LayerDependent VariablesCause GroupCause Group
Number of Units66
Activation FunctionSoftmaxIdentity
Error FunctionCross-entropySum of Squares
* The “best” number of hidden units is the one that yields the smallest error in the testing data.
Table 3. Predictive ANNs model confusion rate and area under curve (AUC) per cause group.
Data SetCriteriaMLPRBF
TrainSum of Squares ErrorN/A1161.041
Cross Entropy Error3867.614N/A
Percent Incorrect Predictions35.2%39.4%
Overall Accuracy64.8%60.6%
TestSum of Squares ErrorN/A236.173
Cross Entropy Error819.830N/A
Percent Incorrect Predictions38.6%40.5%
Overall Accuracy61.4%59.5%
Table 4. Performance of MLP NN Model for Train and Test Data Sets Per Injury Cause Group.
Classification
SampleObservedPredicted
Caught In, Under, or BetweenCut, Puncture, ScrapeFall, Slip, or Trip InjuryHeat or Cold ExposuresStrain or Injury byStruck or Injured byPercent Correct
TrainCaught In, Under, or Between44669212532.2%
Cut, Puncture, Scrape047324112490.4%
Fall, Slip, or Trip Injury17074624869753.2%
Heat or Cold Exposures011217731883.9%
Strain or Injury by0215931331988.5%
Struck or Injured by013528235615524.6%
Overall Percent0.1%16.3%29.0%4.2%42.4%8.0%64.8%
TestCaught In, Under, or Between251801145.0%
Cut, Puncture, Scrape093601886.1%
Fall, Slip, or Trip Injury0121431983050.4%
Heat or Cold Exposures014281375.7%
Strain or Injury by00382233384.4%
Struck or Injured by029520103728.9%
Overall Percent0.2%16.0%29.9%3.6%39.4%10.9%61.4%
Table 5. Performance of RB NN Model for Train and Test Data Sets.
Classification
SampleObservedPredicted
Caught In, Under, or BetweenCut, Puncture, ScrapeFall, Slip, or Trip InjuryHeat or Cold ExposuresStrain or Injury byStruck or Injured byPercent Correct
TrainCaught In, Under, or Between0301260890.0%
Cut, Puncture, Scrape043810400480.2%
Fall, Slip, or Trip Injury07580404476657.8%
Heat or Cold Exposures00441670079.1%
Strain or Injury by0126601213381.8%
Struck or Injured by093435036619.8%
Overall Percent0.0%14.4%40.2%3.8%38.5%3.2%60.6%
TestCaught In, Under, or Between012400120.0%
Cut, Puncture, Scrape0851900081.7%
Fall, Slip, or Trip Injury071670801362.5%
Heat or Cold Exposures0010300075.0%
Strain or Injury by01450234083.6%
Struck or Injured by029880964.5%
Overall Percent0.0%15.3%42.0%3.4%36.9%2.4%59.5%
Table 6. Comparison of Area under the Curve for MLP and RBF Models.
ANN ModelCause GroupAUC
MLPCaught In, Under, or Between0.822
Cut, Puncture, Scrape0.961
Fall, Slip, or Trip Injury0.757
Heat or Cold Exposures0.992
Strain or Injury by0.900
Struck or Injured by0.825
RBCaught In, Under, or Between0.739
Cut, Puncture, Scrape0.952
Fall, Slip, or Trip Injury0.715
Heat or Cold Exposures0.987
Strain or Injury by0.887
Struck or Injured by0.792
Table 7. Sensitivity Analysis of Independent variables importance.
VariableRFBMLP
ImportanceNormalized ImportanceImportanceNormalized Importance
Injury Nature0.699100.0%0.464100.0%
Class Description0.08011.4%0.12627.1%
Injury Type0.20429.2%0.06313.5%
Experience0.0121.7%0.17036.7%
Age0.0050.8%0.17838.3%
Table 8. Predicted cause group in grain elevator operations via probabilities from MLP model.
NatureAgeExperienceStrain or Injury byFall, Slip, or Trip InjuryStruck or Injured byCut, Puncture, ScrapCut, Puncture, ScrapCaught in, Under, or BetweenFinal Predicted Cause Group
amputation436.50.000.000.200.460.160.18cut, puncture, scrap
hernia436.50.880.120.000.000.000.00strain or injury by
crushing436.50.000.010.430.020.000.53caught in, under, or between
puncture53160.000.140.430.310.000.11struck or injured by
hearing loss53160.000.000.010.010.980.00heat or cold exposures
fracture5390.030.780.150.000.000.03fall, slip, or trip injury

