Gene Expression Pattern in Olive Tree Organs (Olea europaea L.)

 ,
,  , , and
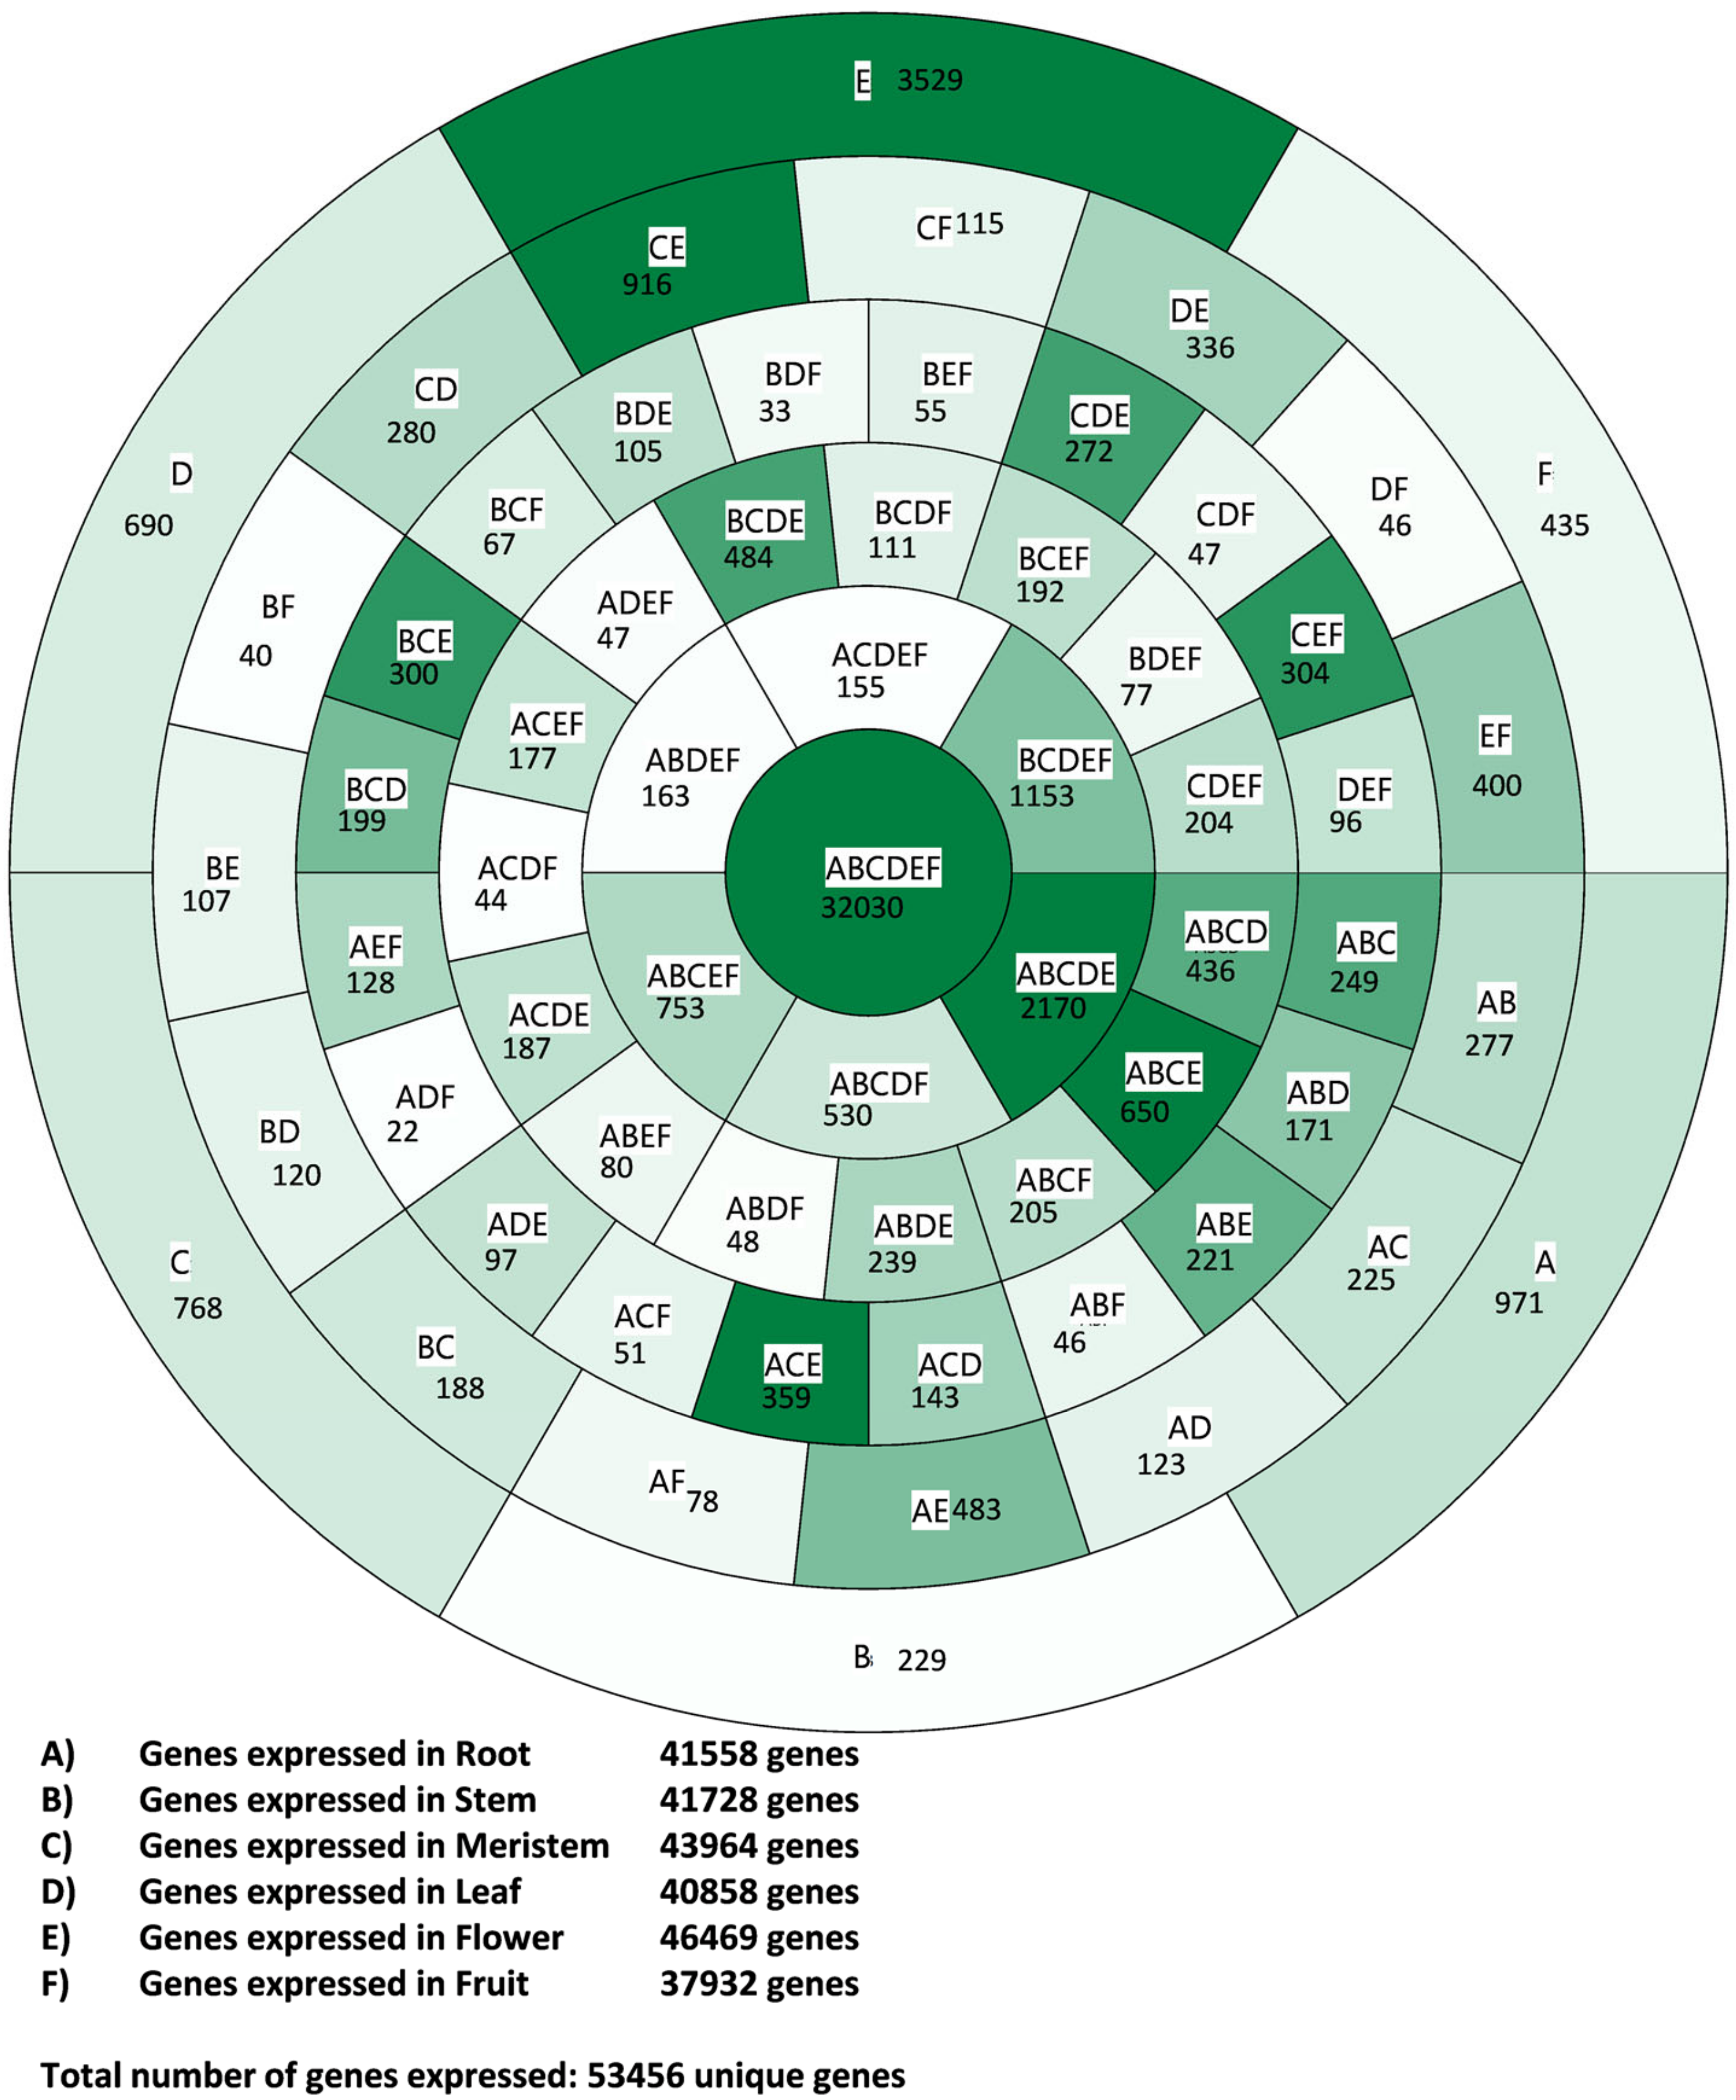
Abstract
:1. Introduction
2. Materials and Methods
2.1. Plant Material, RNA Sample Preparation, and Next-Generation Sequencing
2.2. Data Preprocessing
2.3. Expression Analysis
2.4. Gene Ontology (GO) Analysis
2.5. Availability of Data
3. Results and Discussion
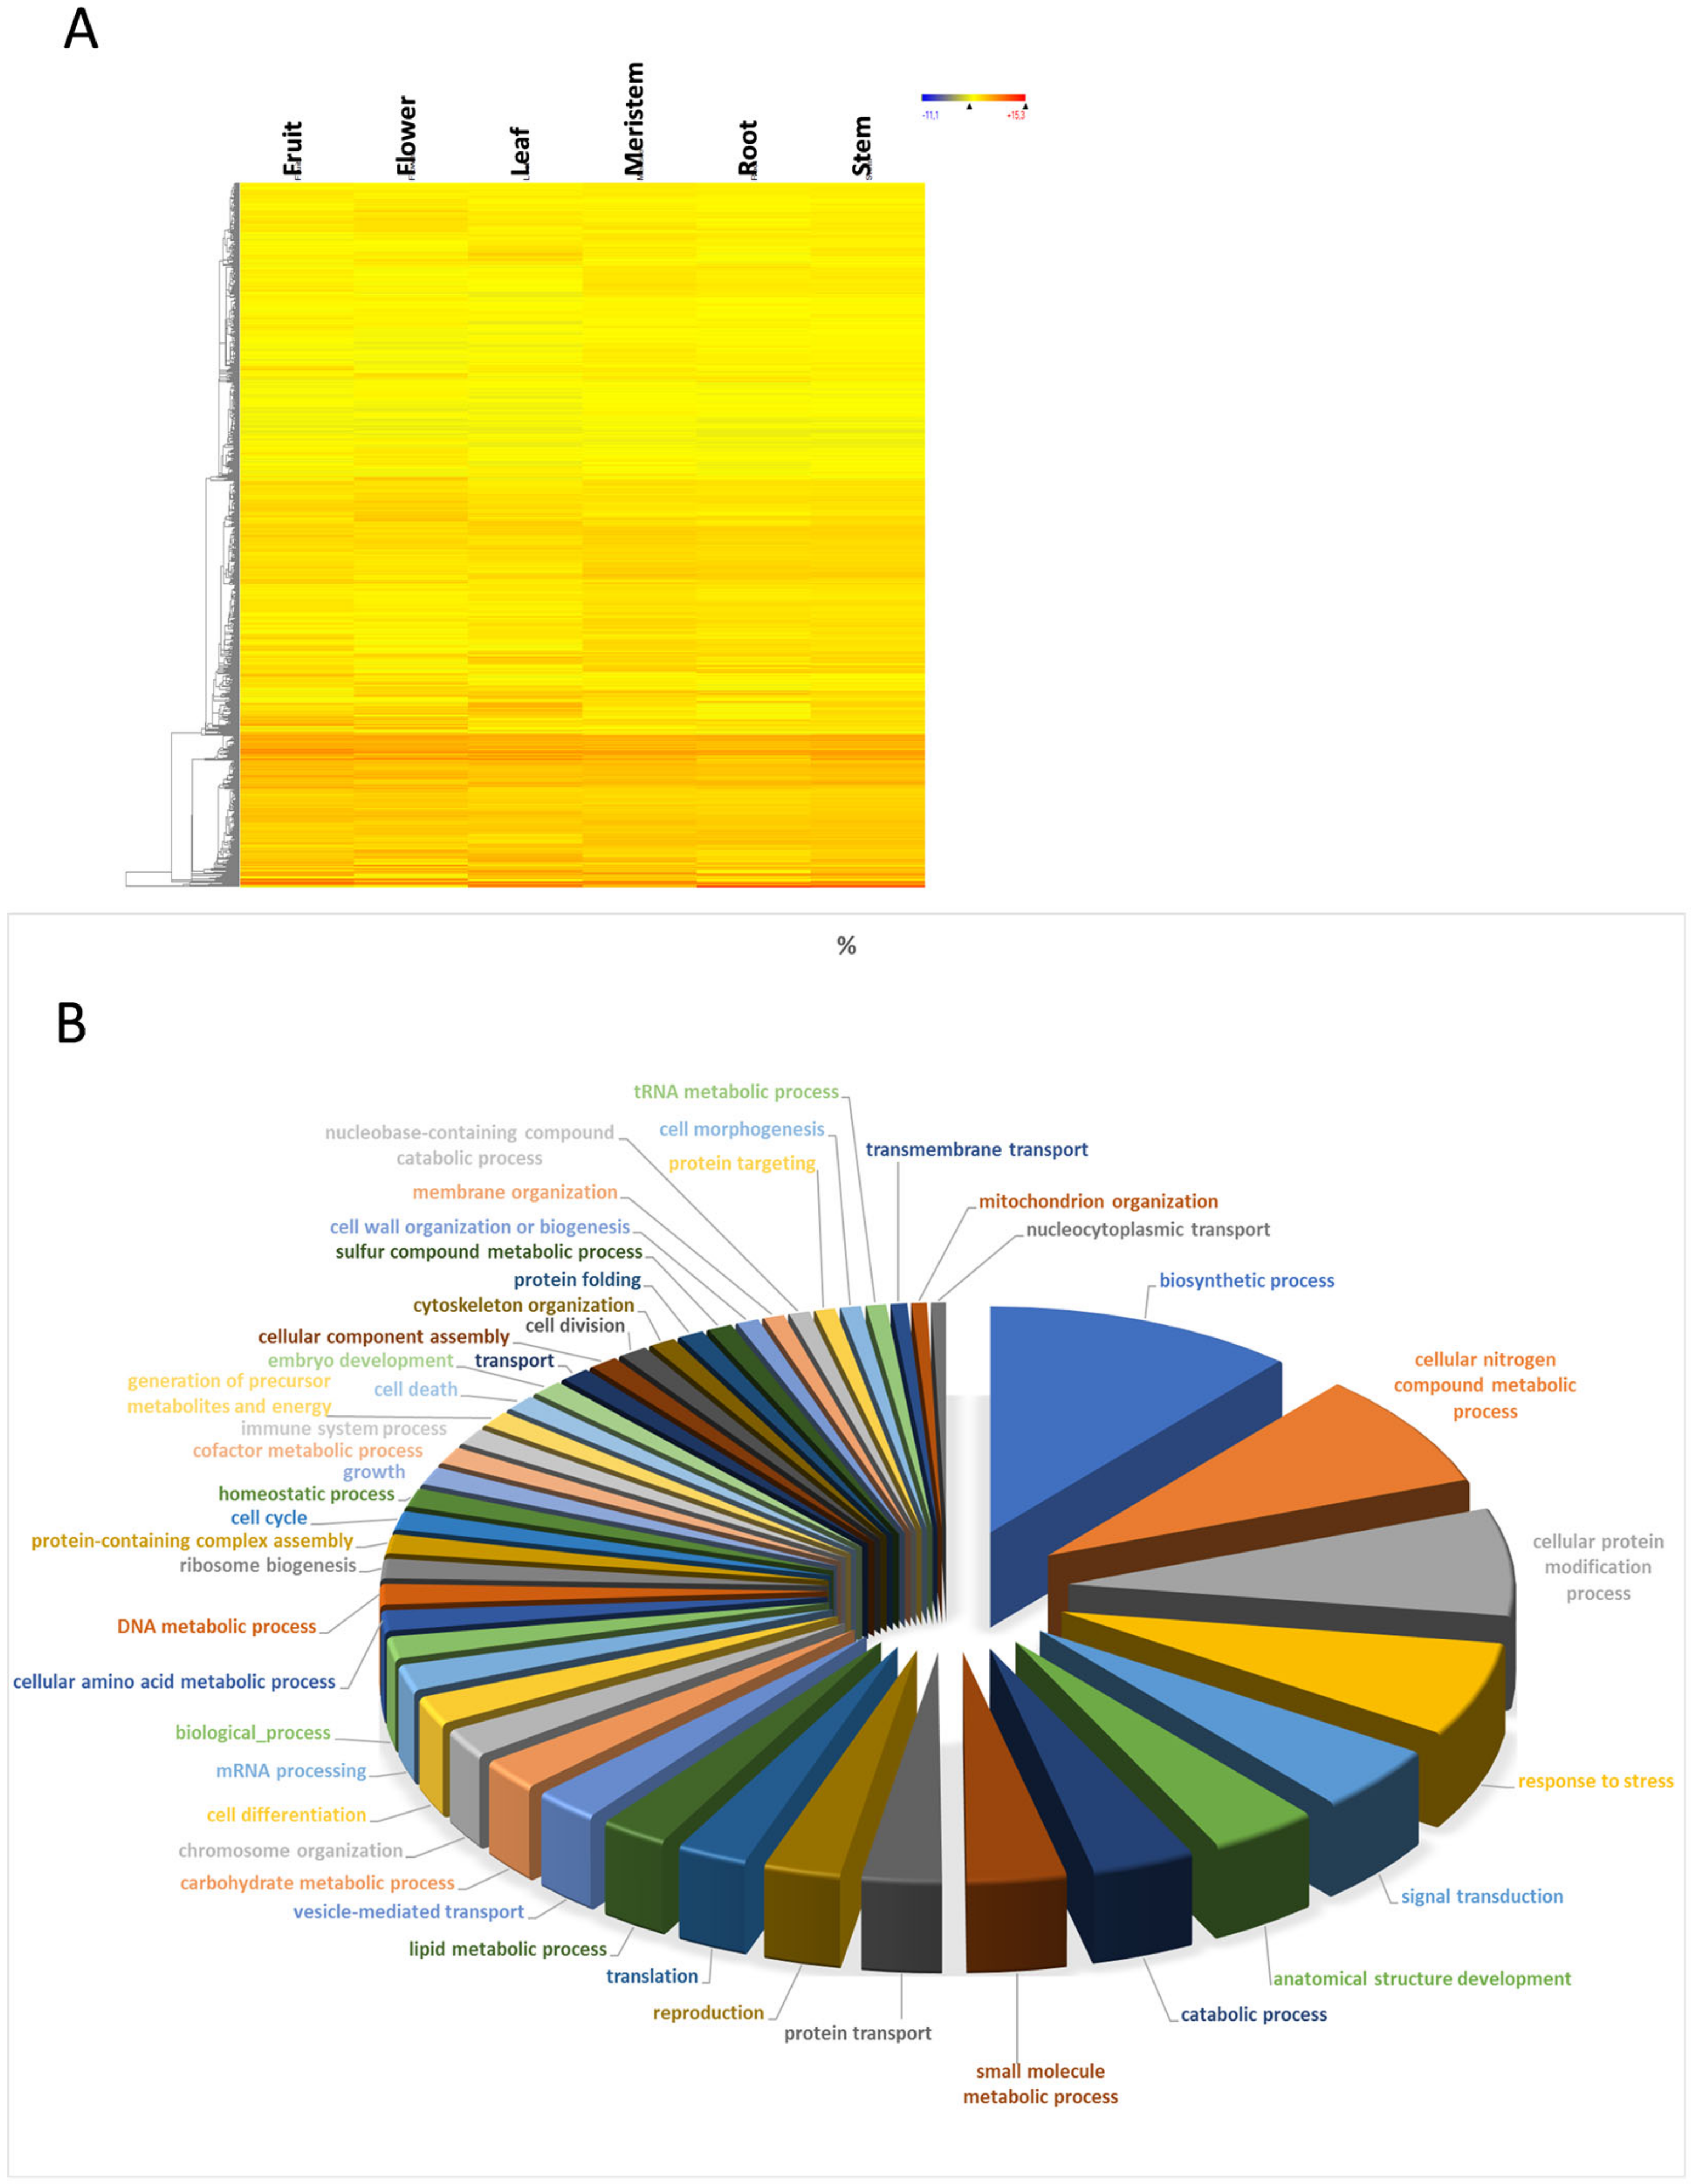
3.1. Transcriptome Profile Overview
3.2. Housekeeping Genes
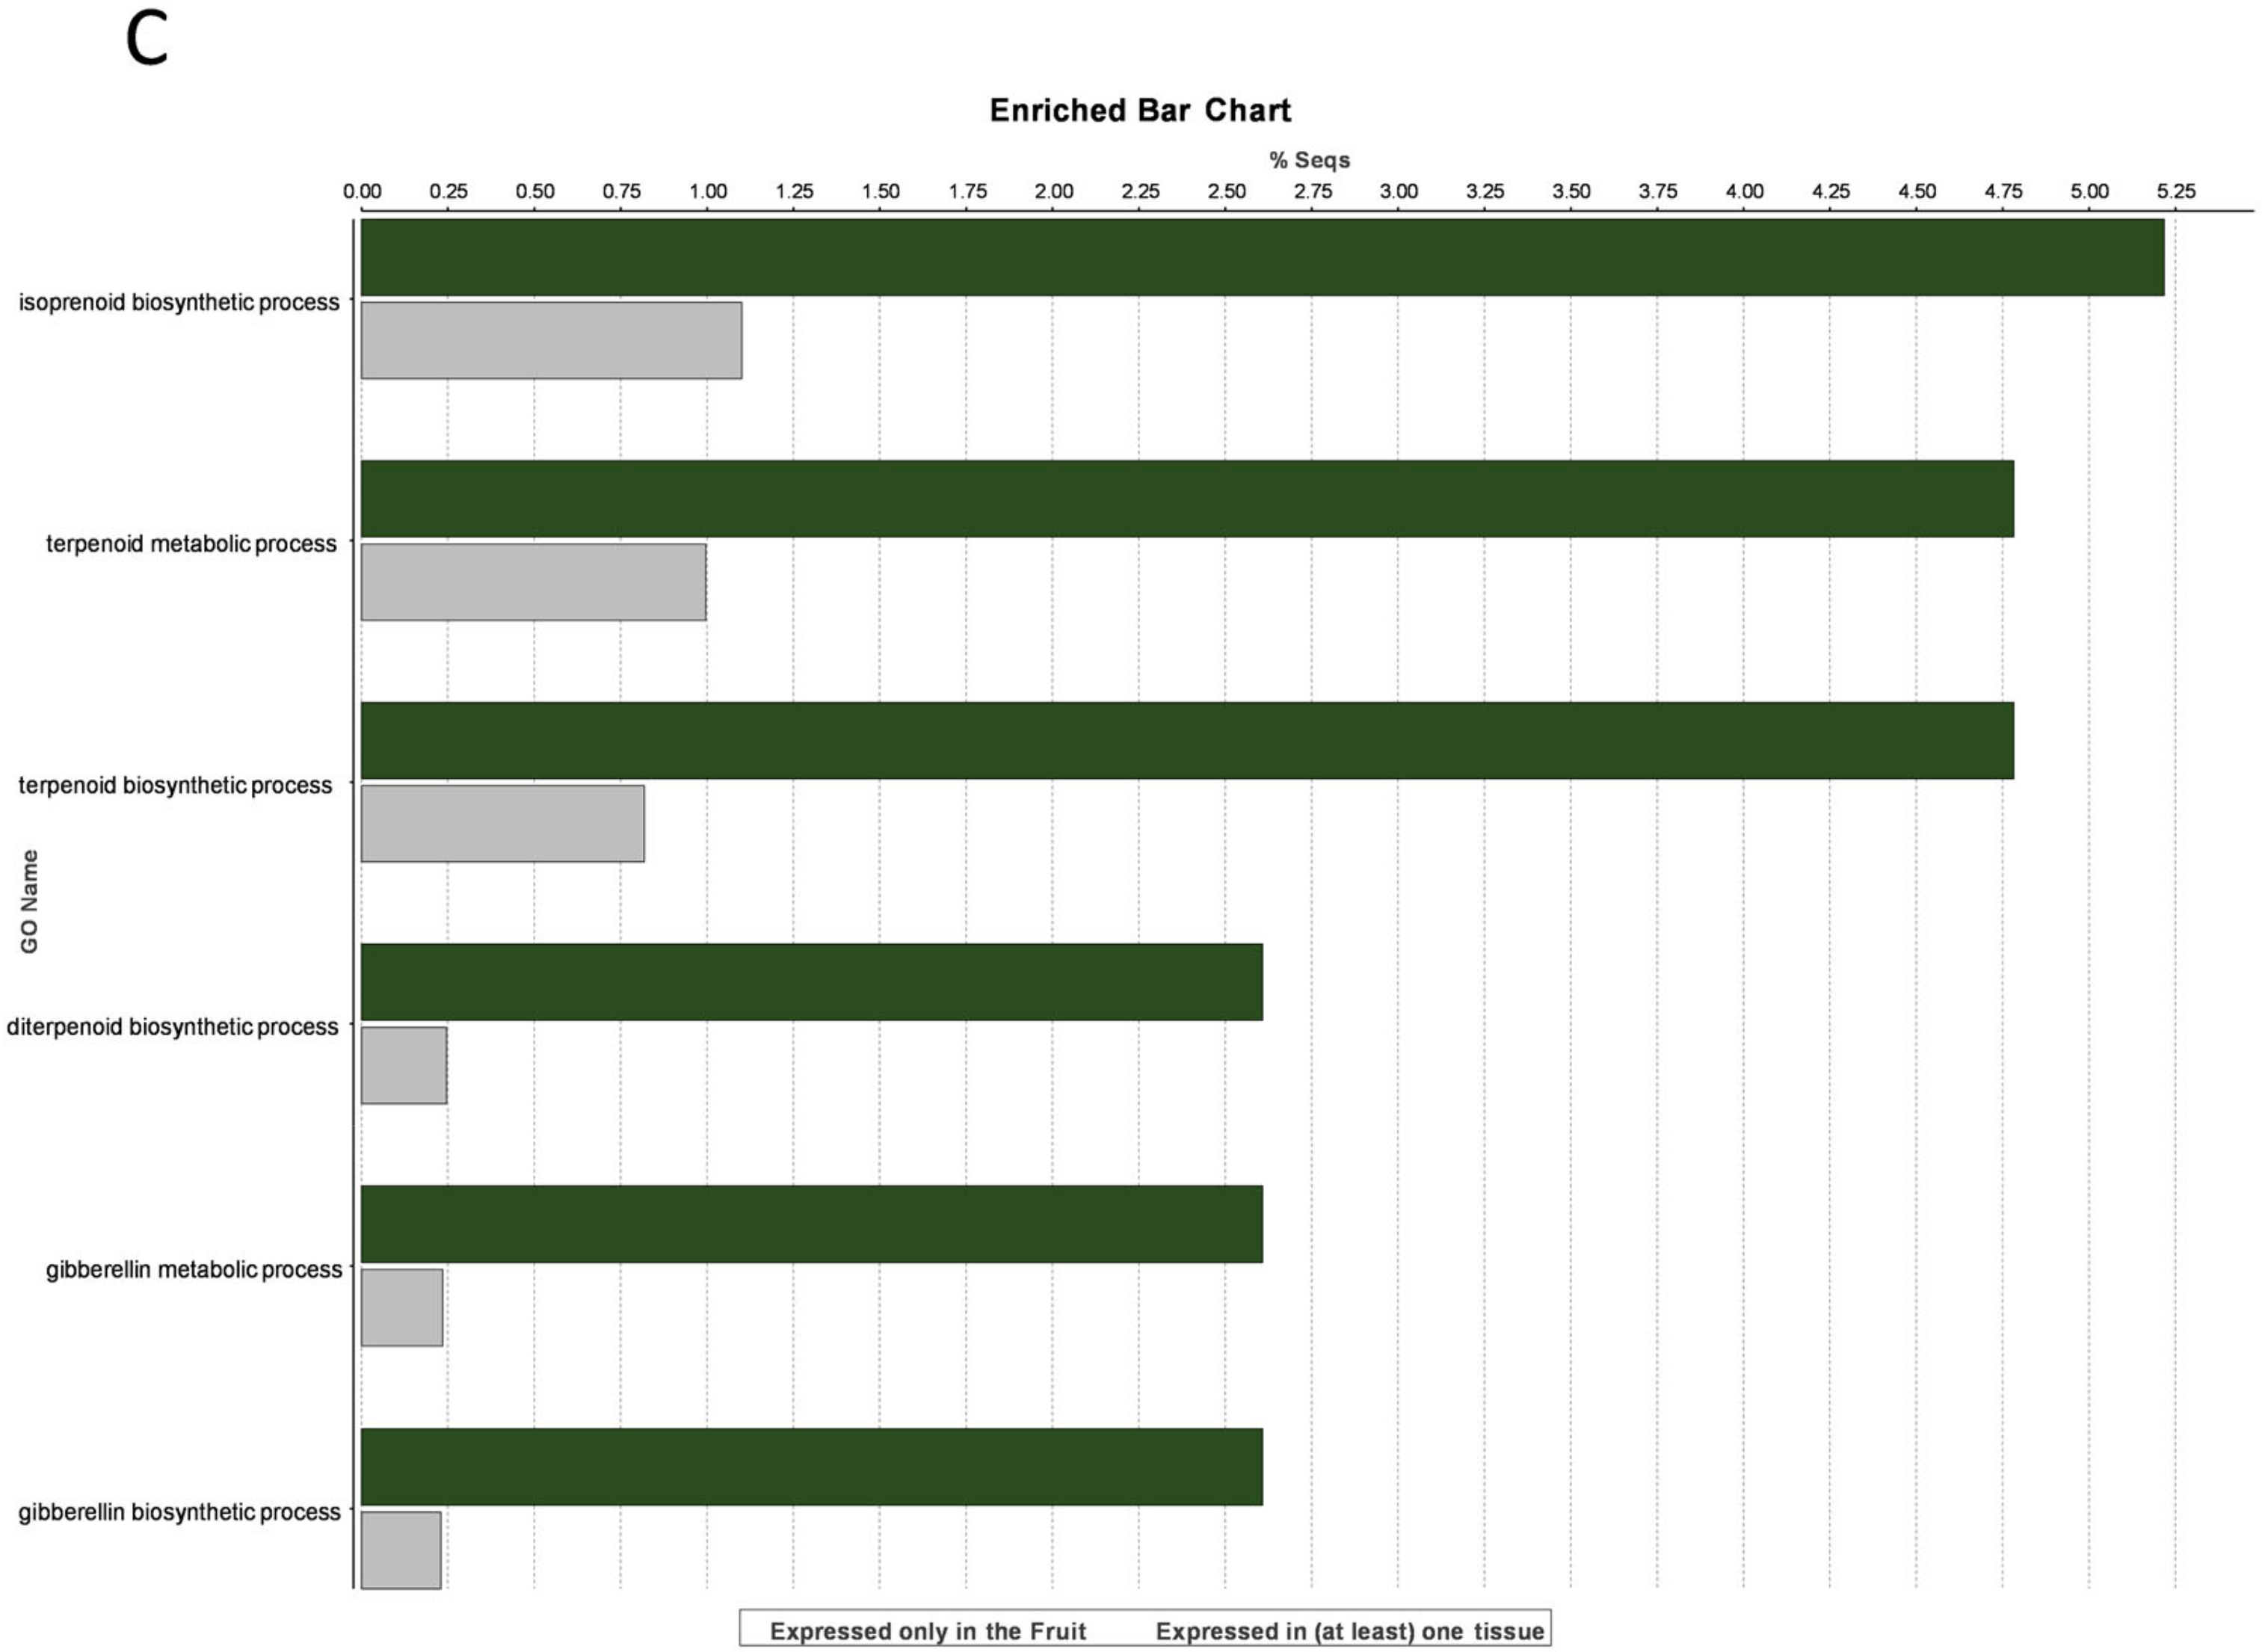
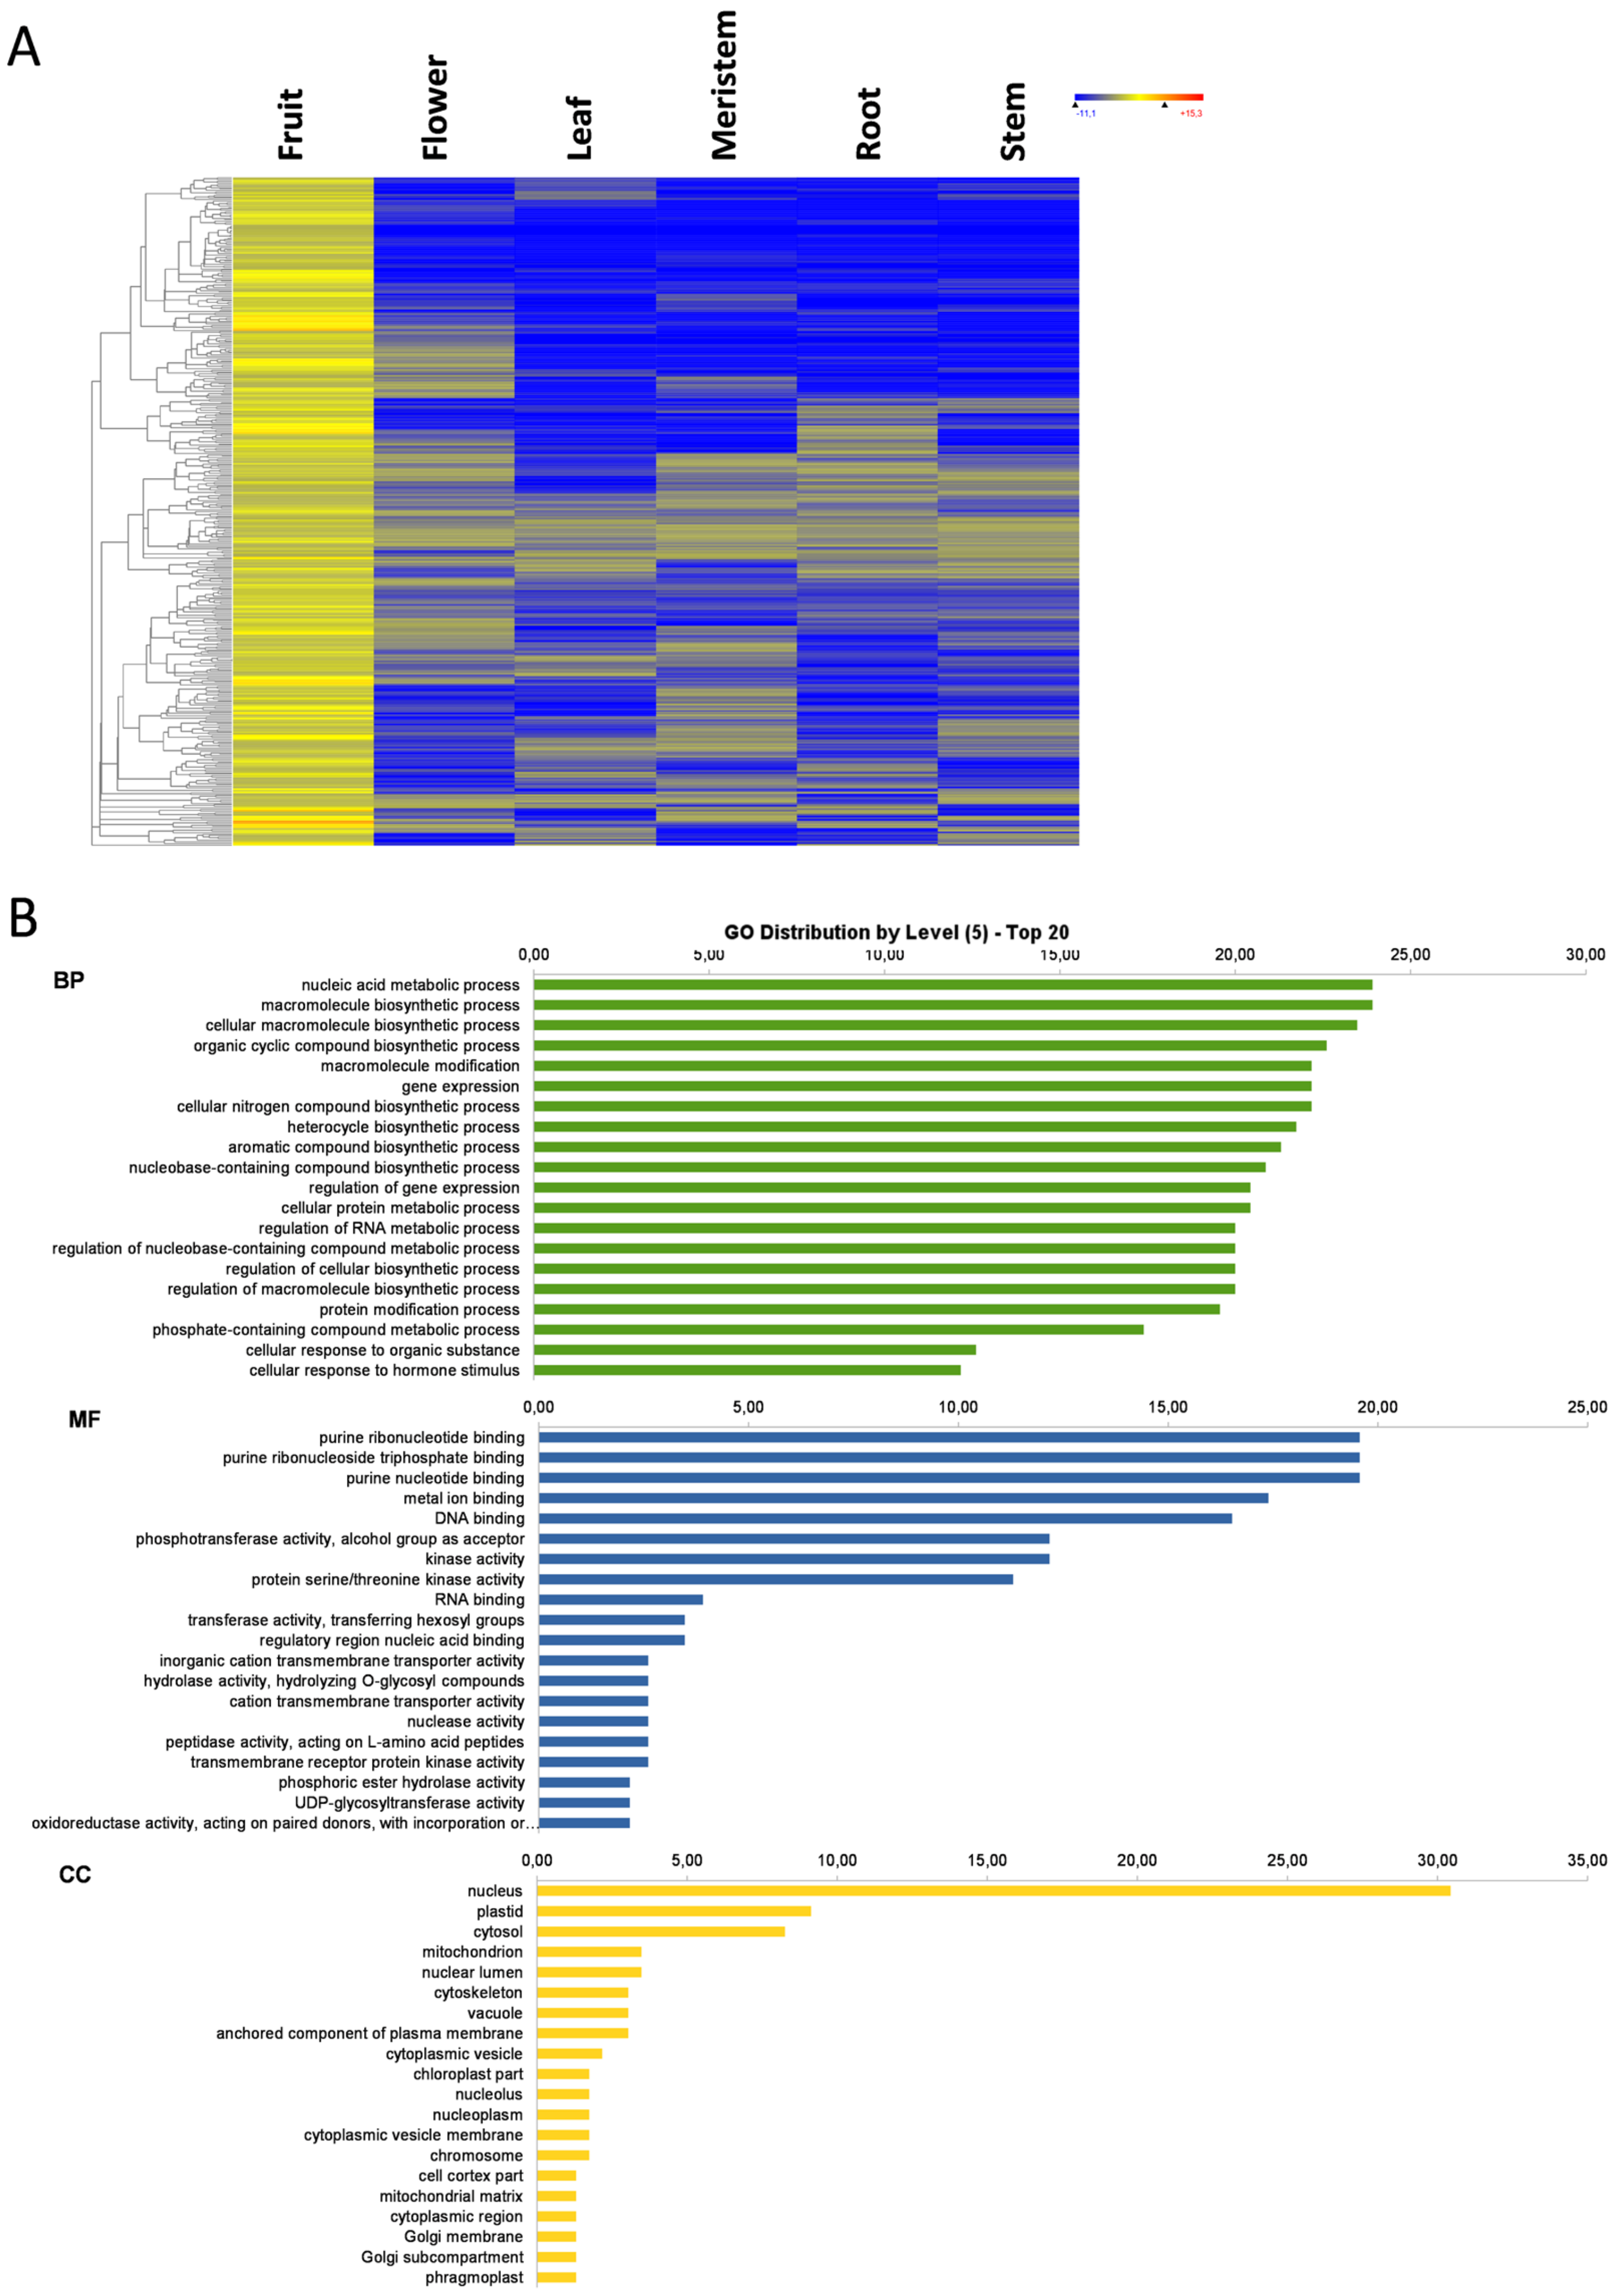
3.3. Fruit-Specific Genes
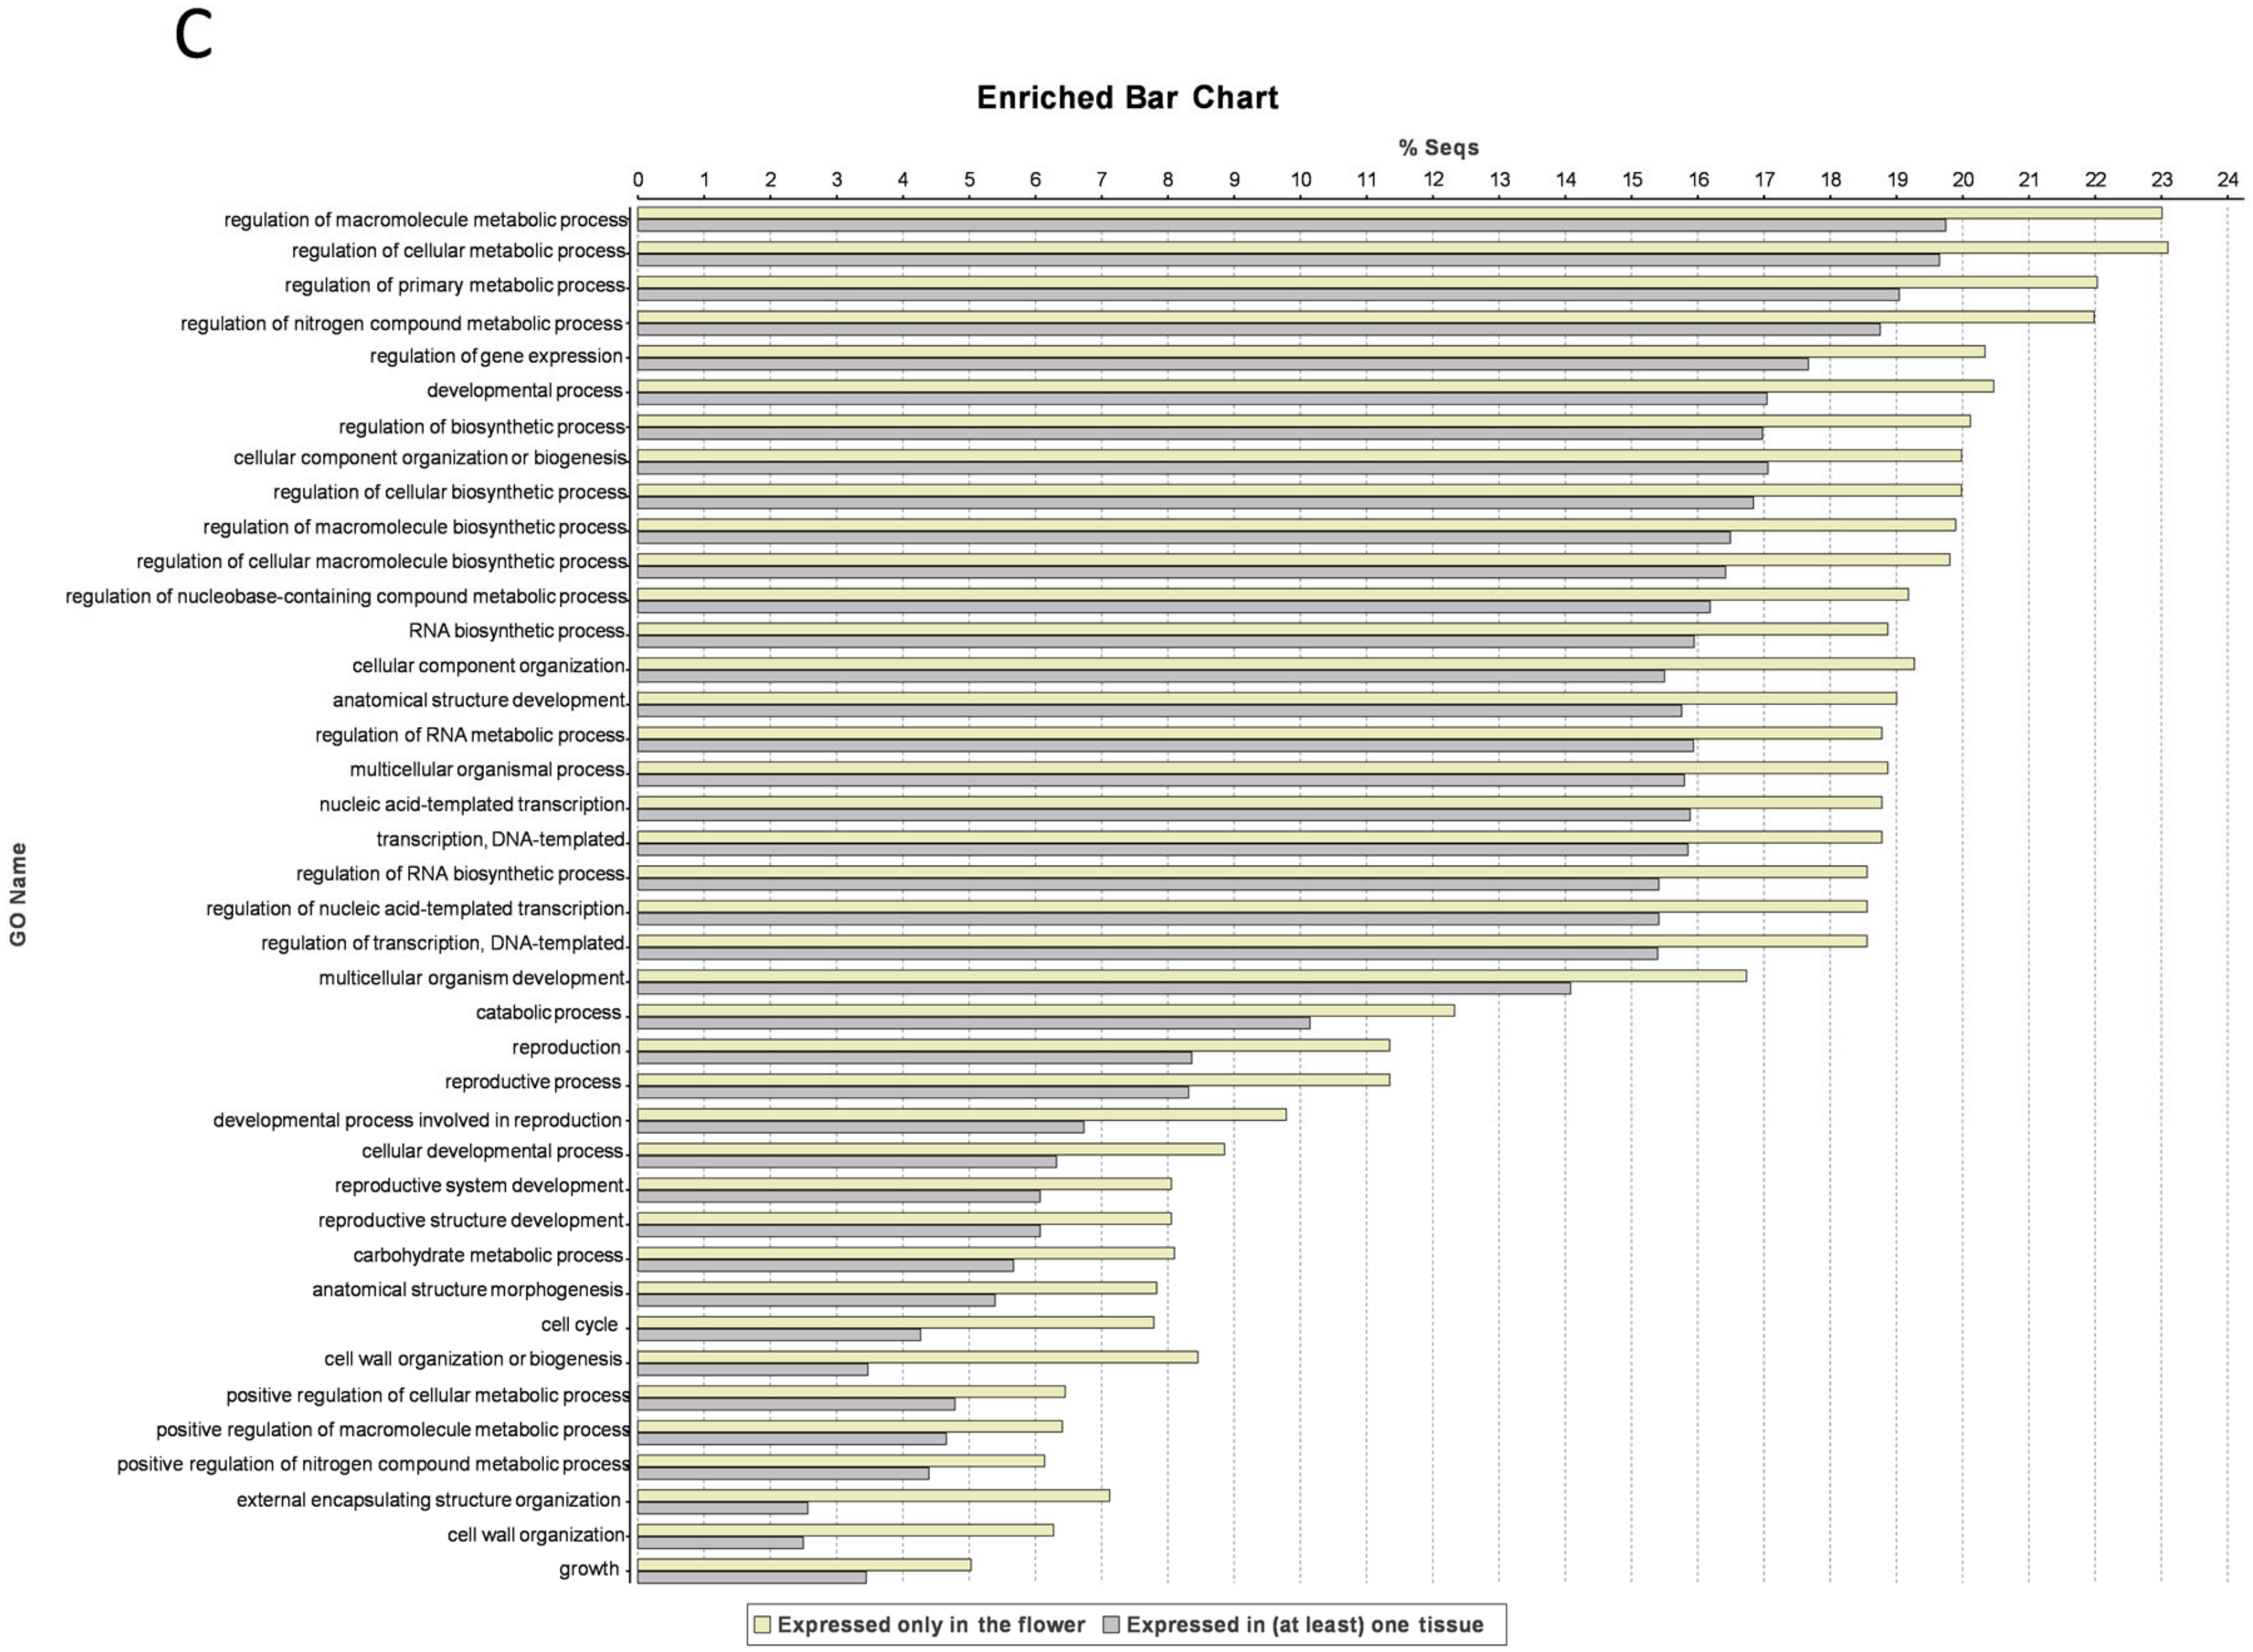
3.4. Flower-Specific Genes
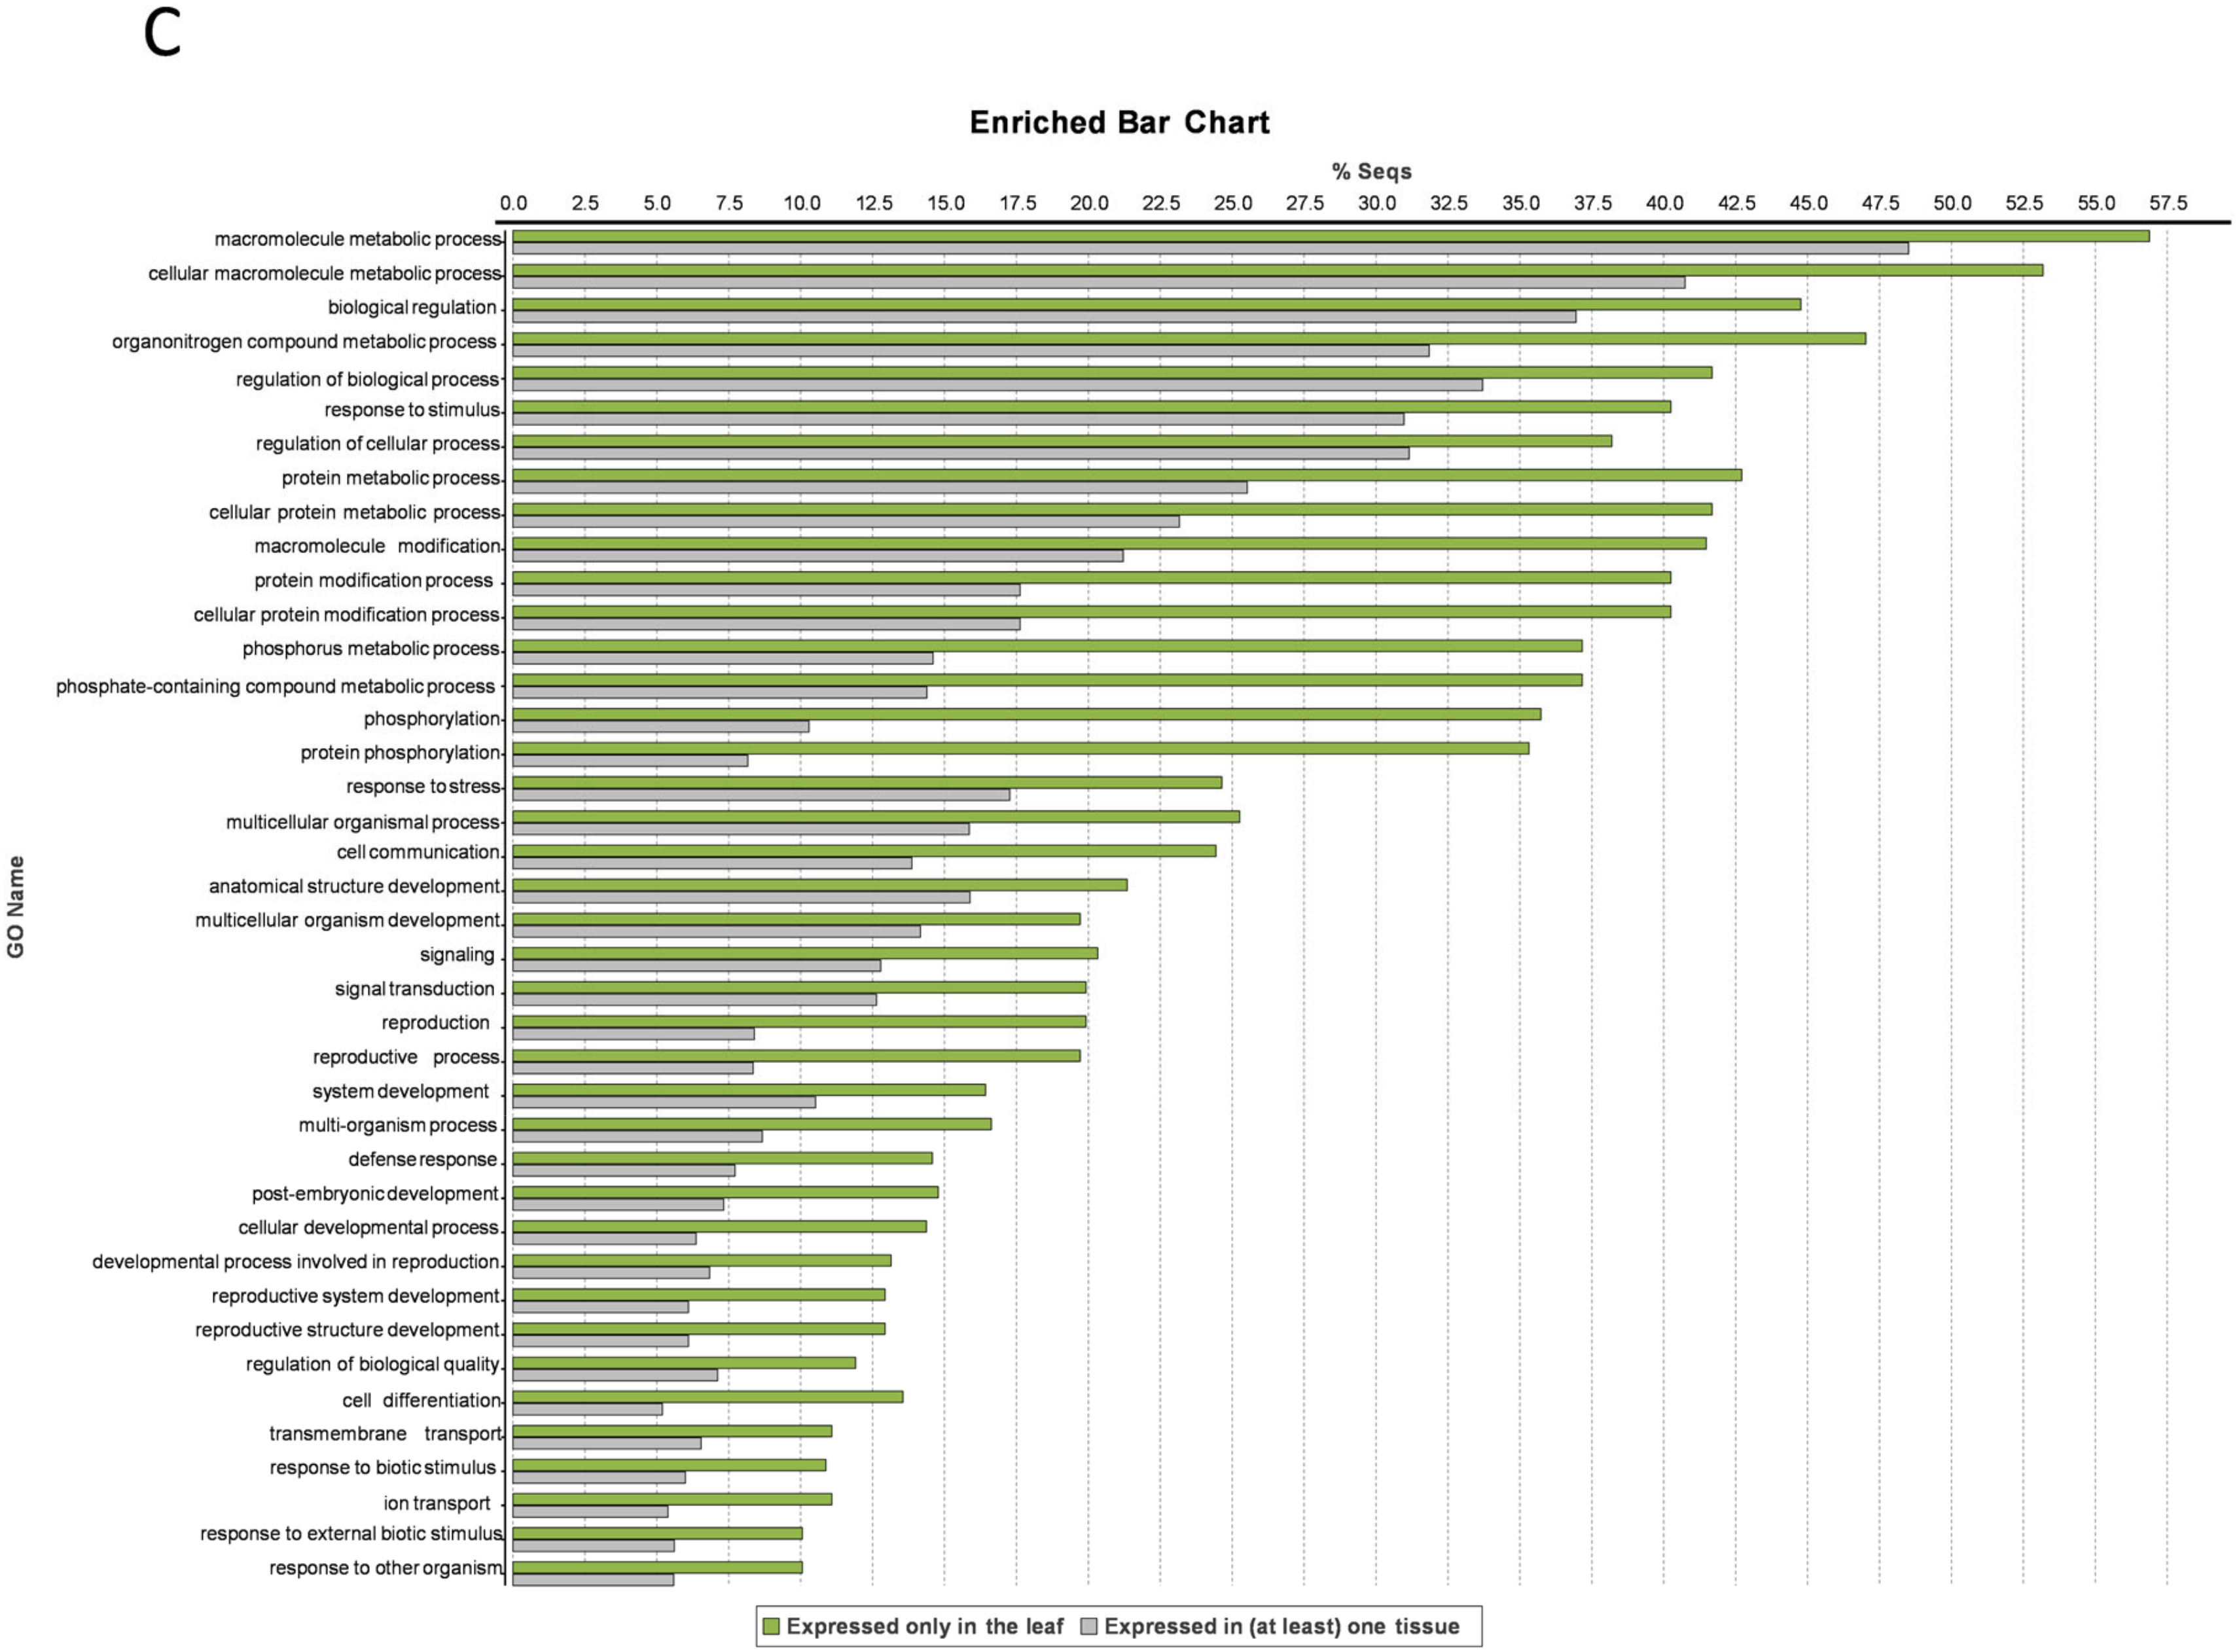
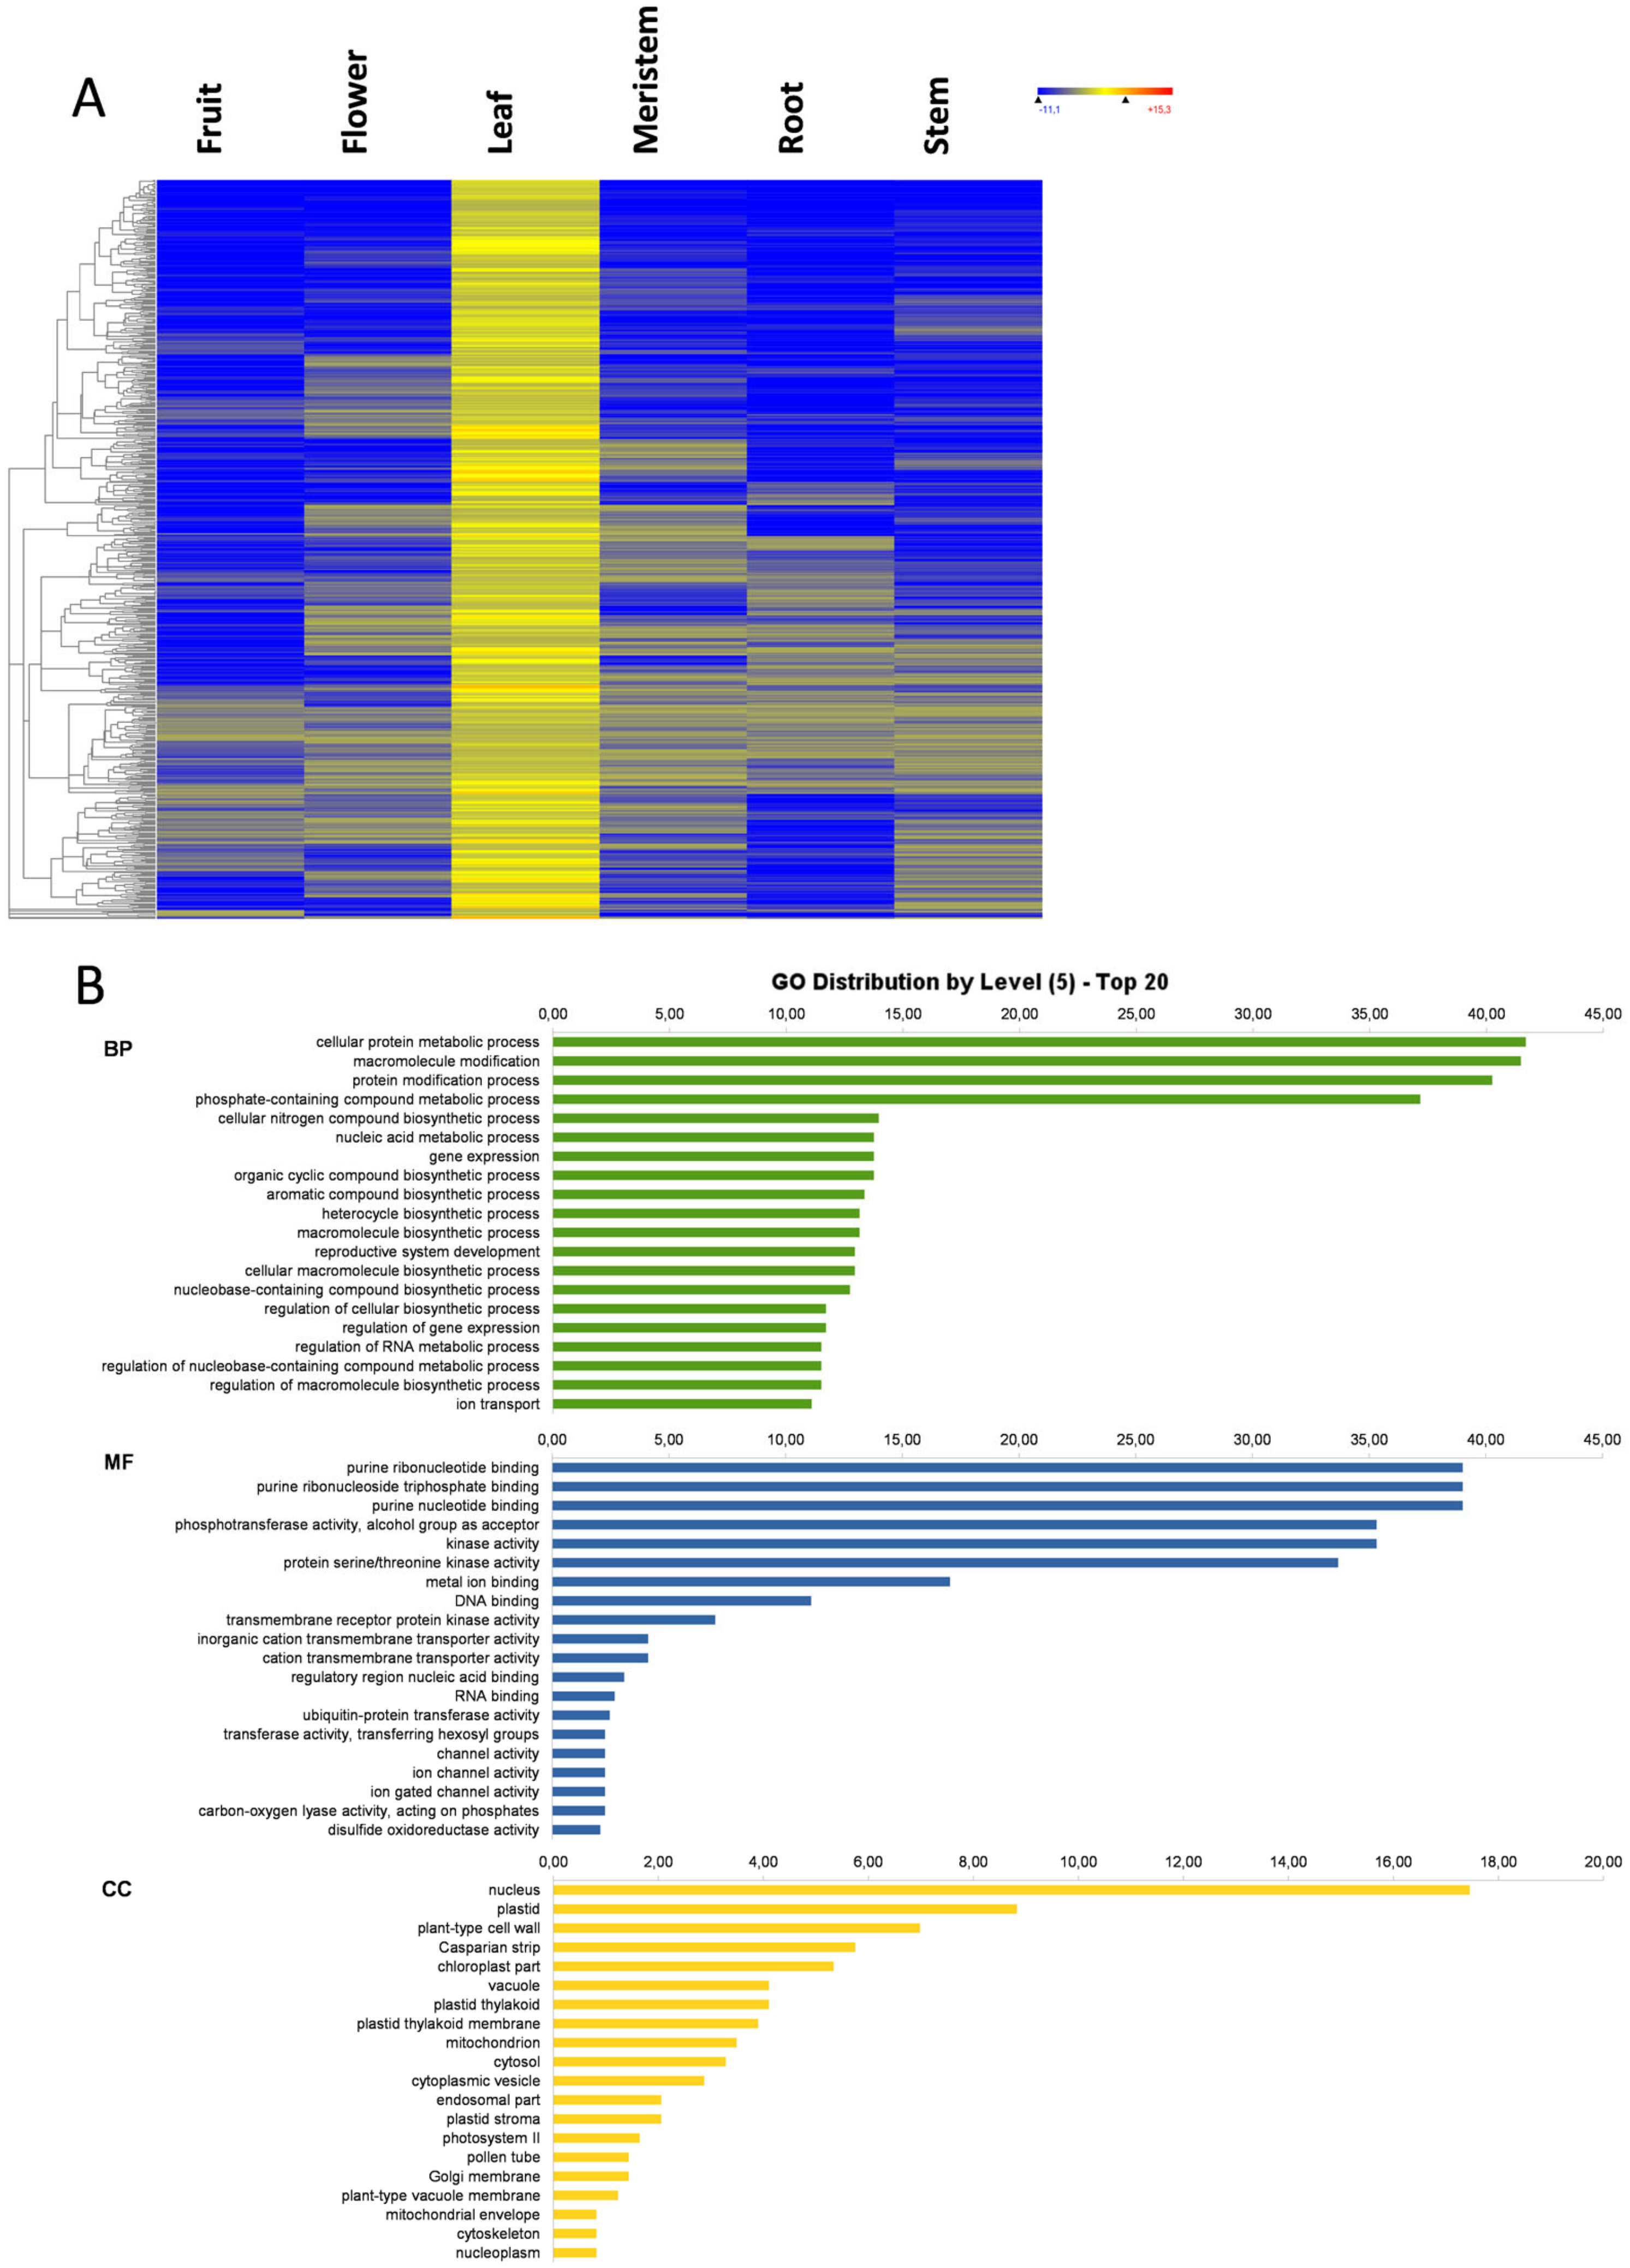
3.5. Leaf-Specific Genes
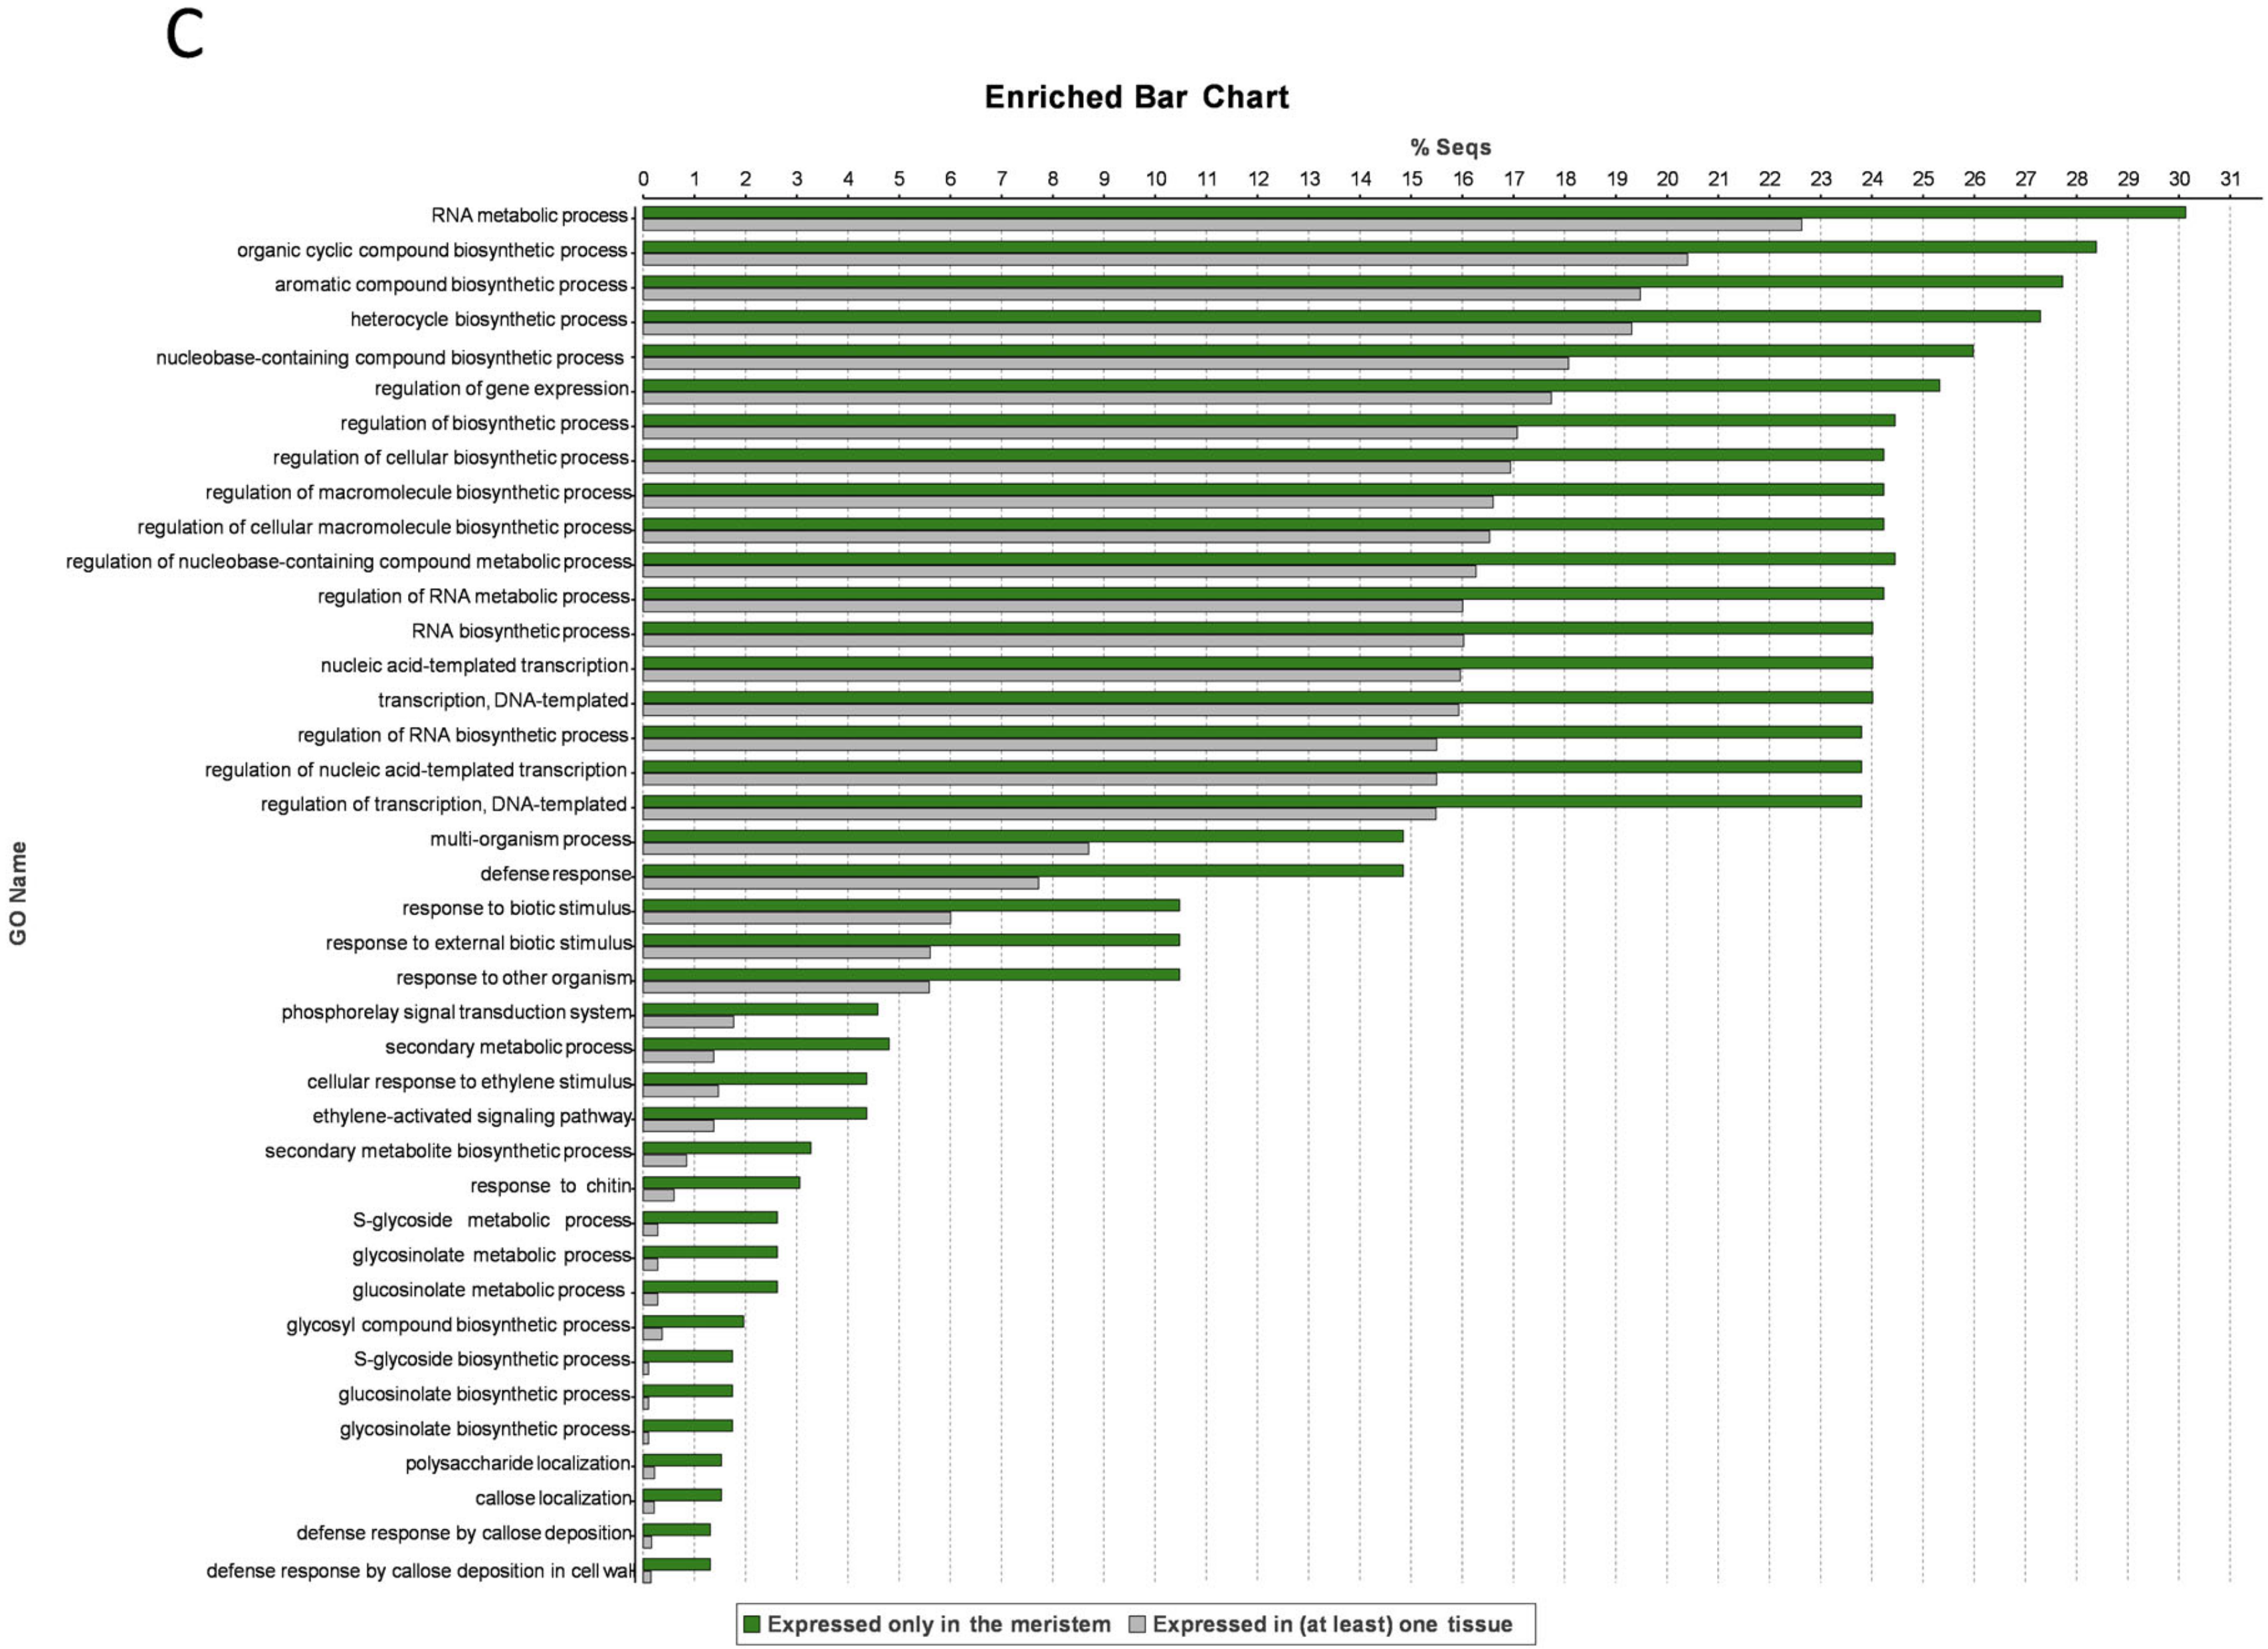
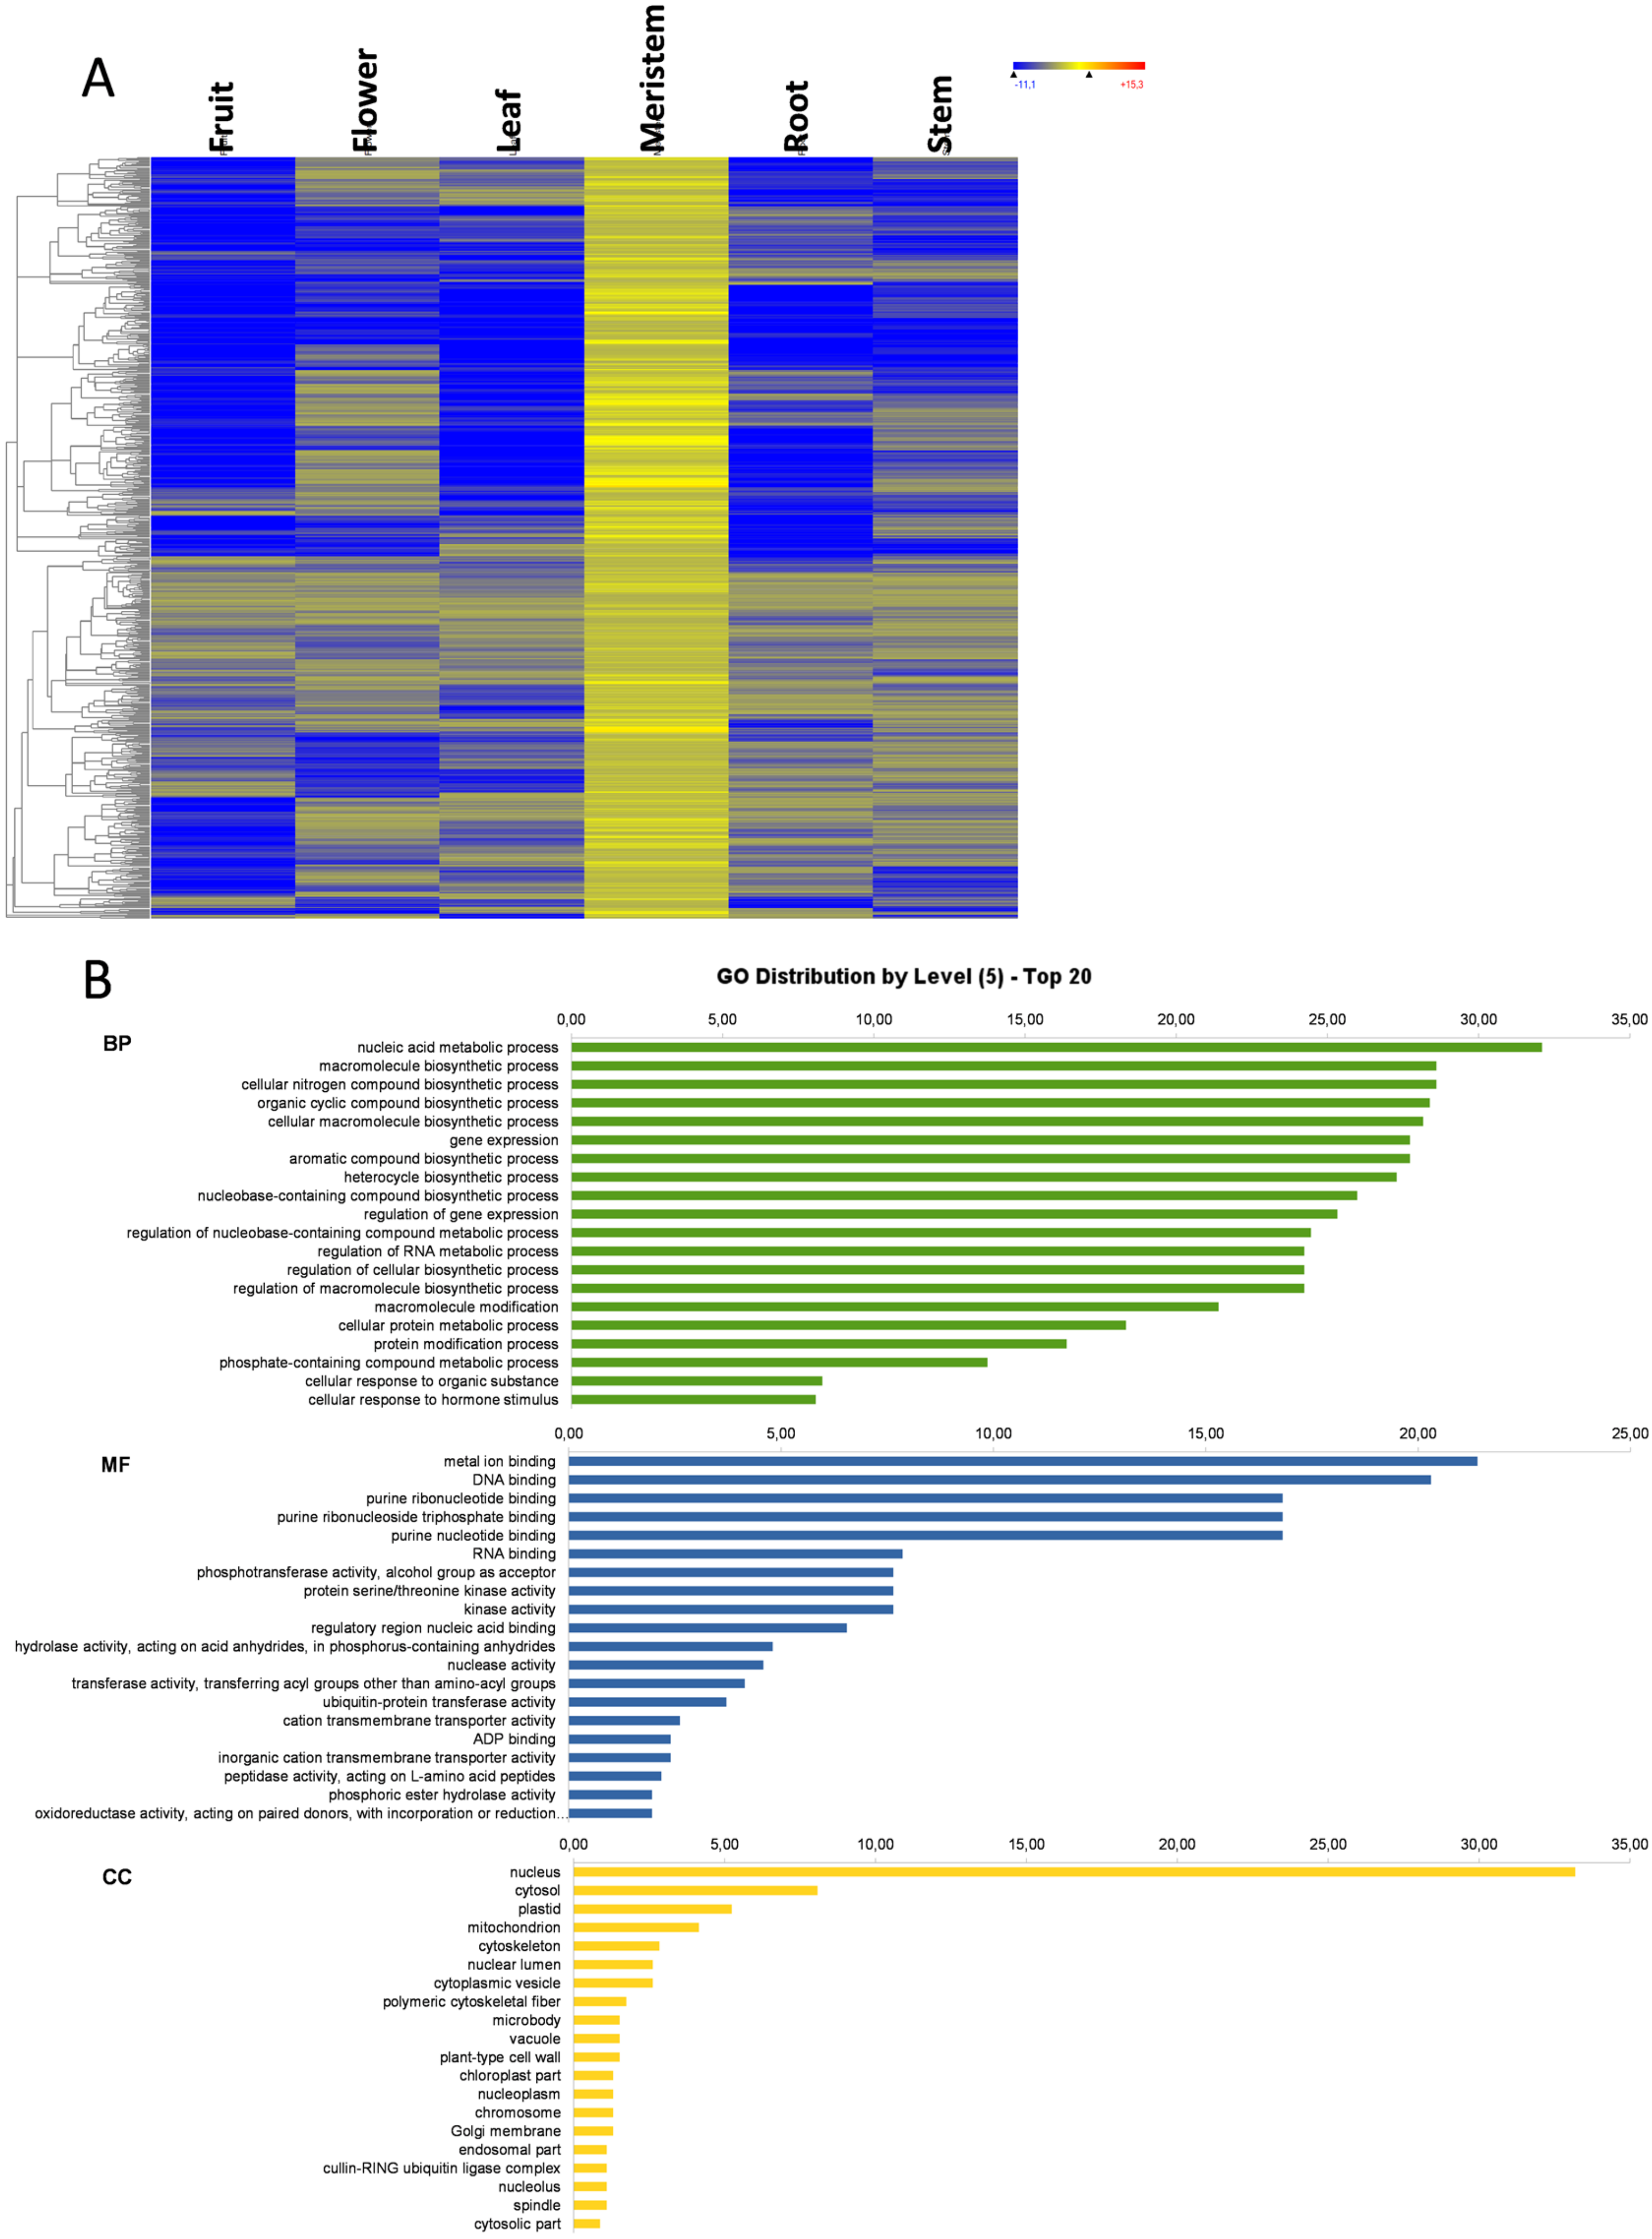
3.6. Meristem-Specific Genes
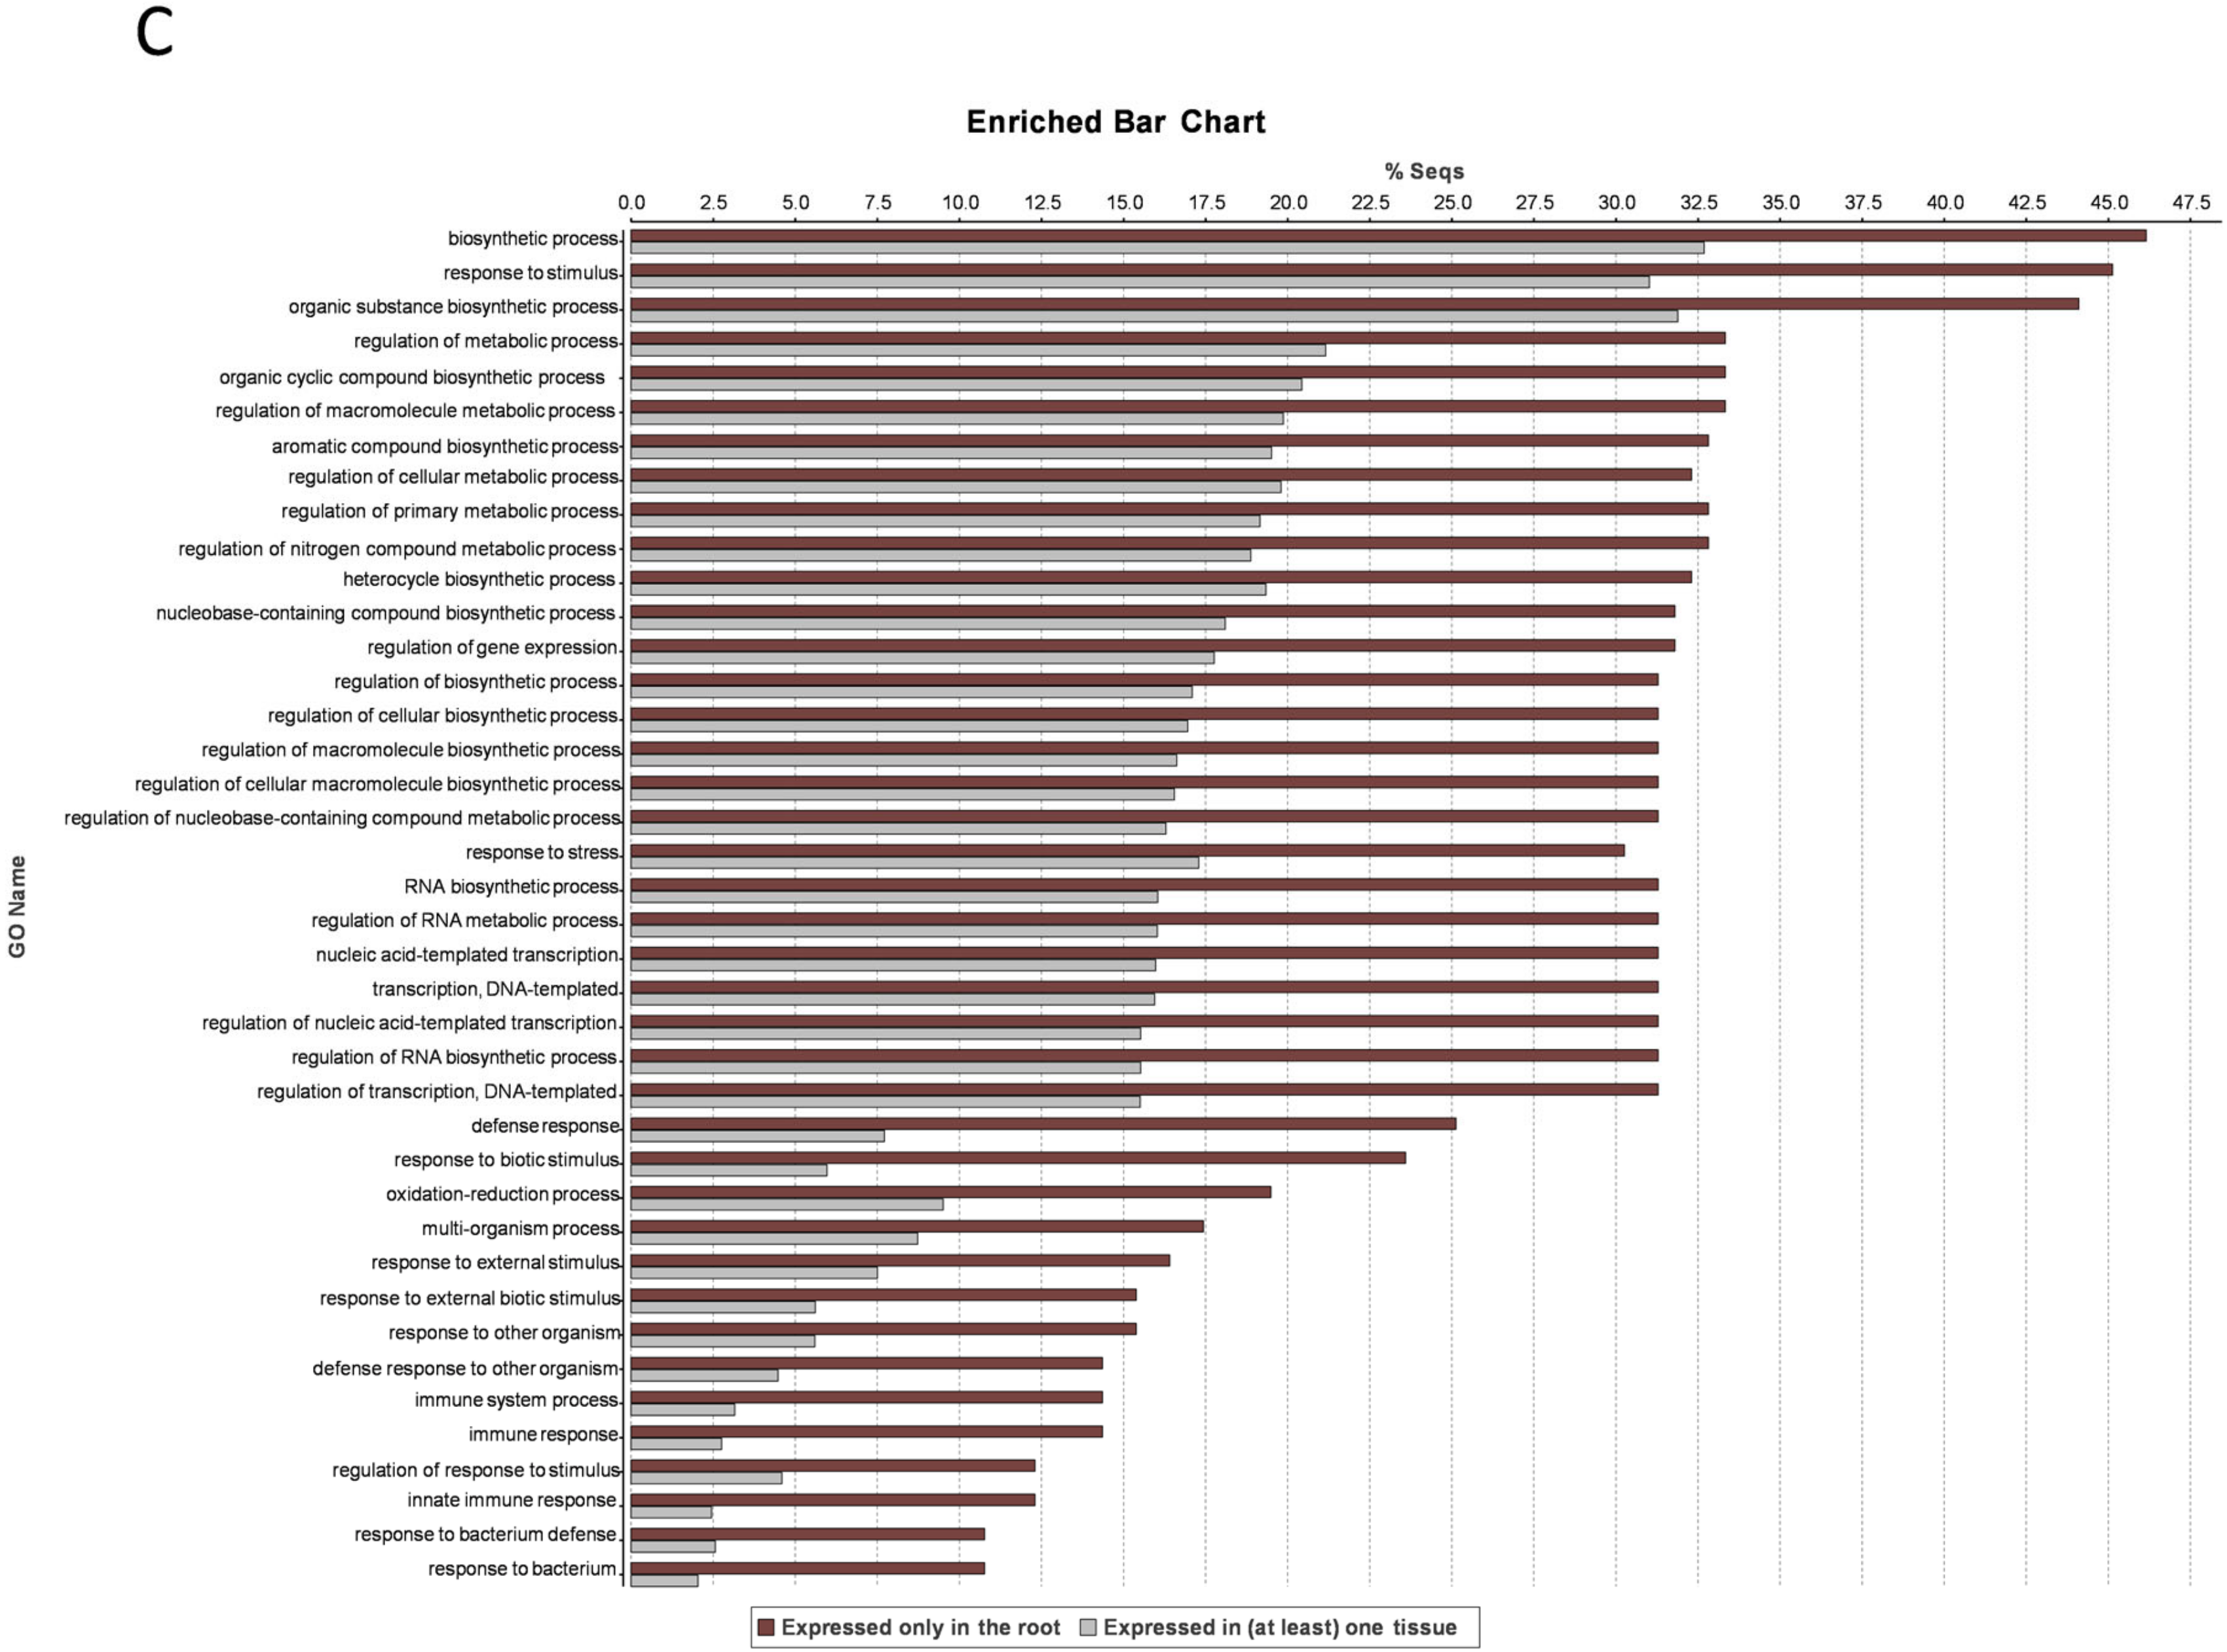
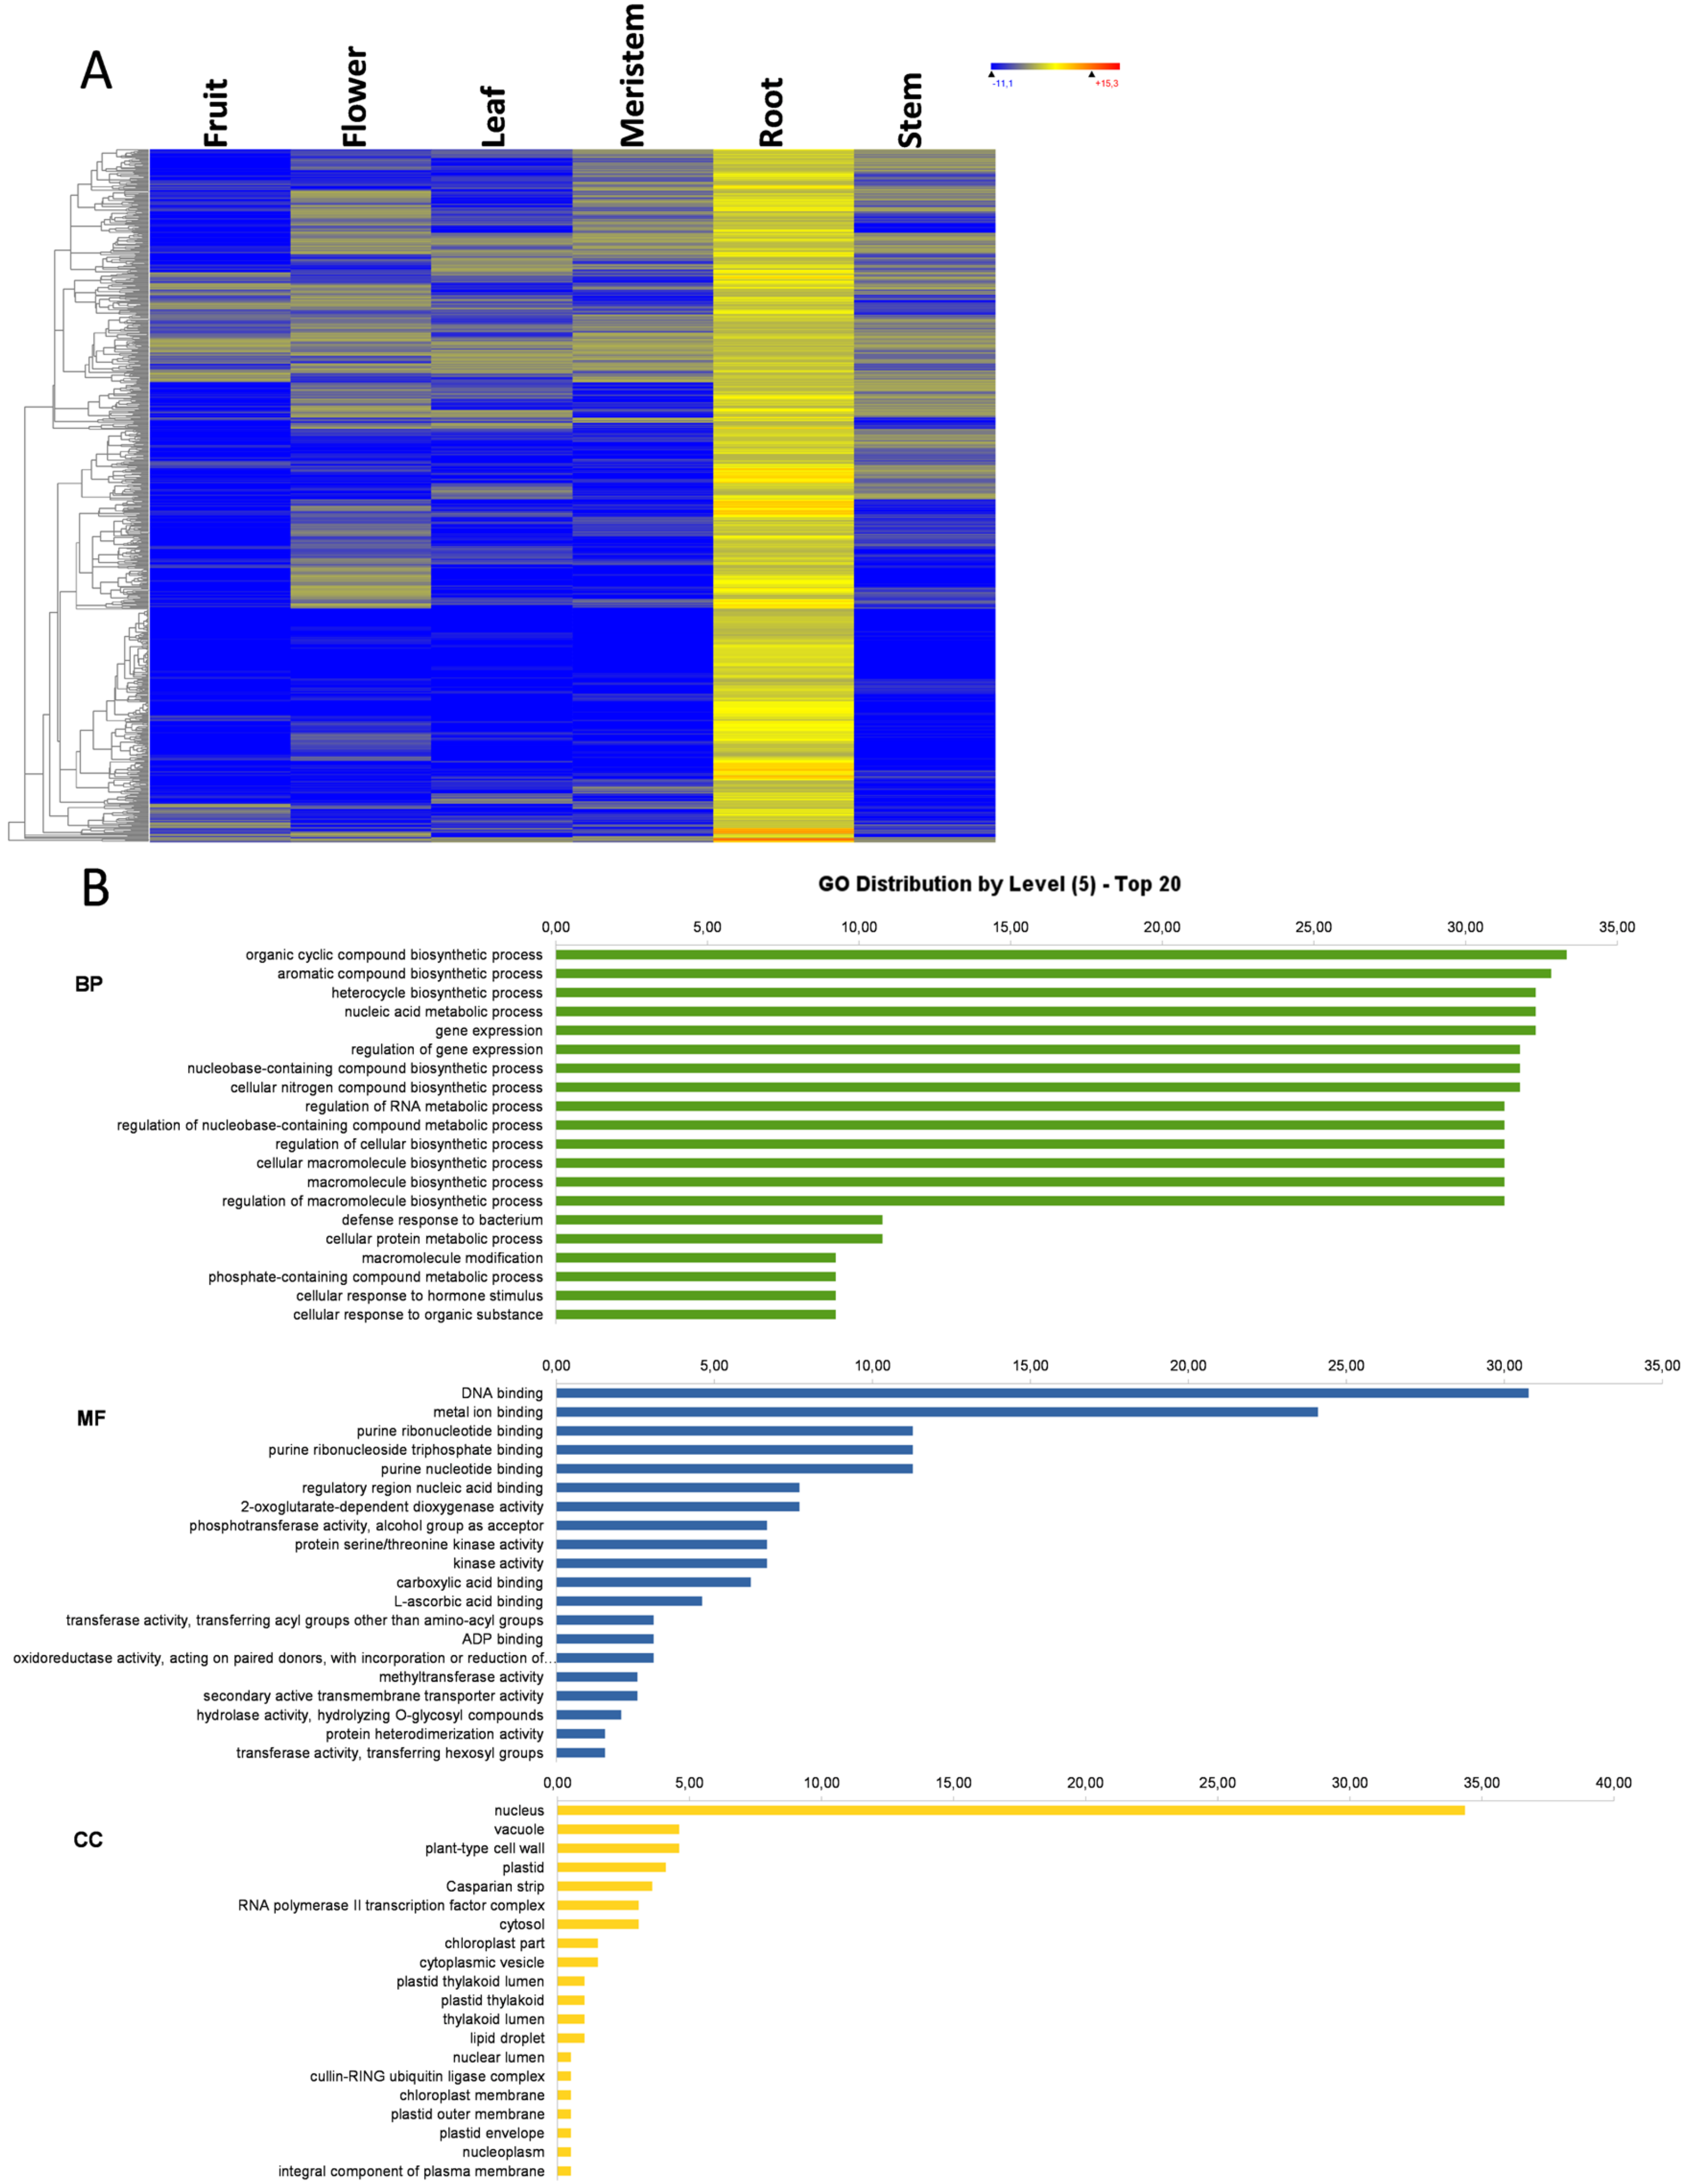
3.7. Root-Specific Genes
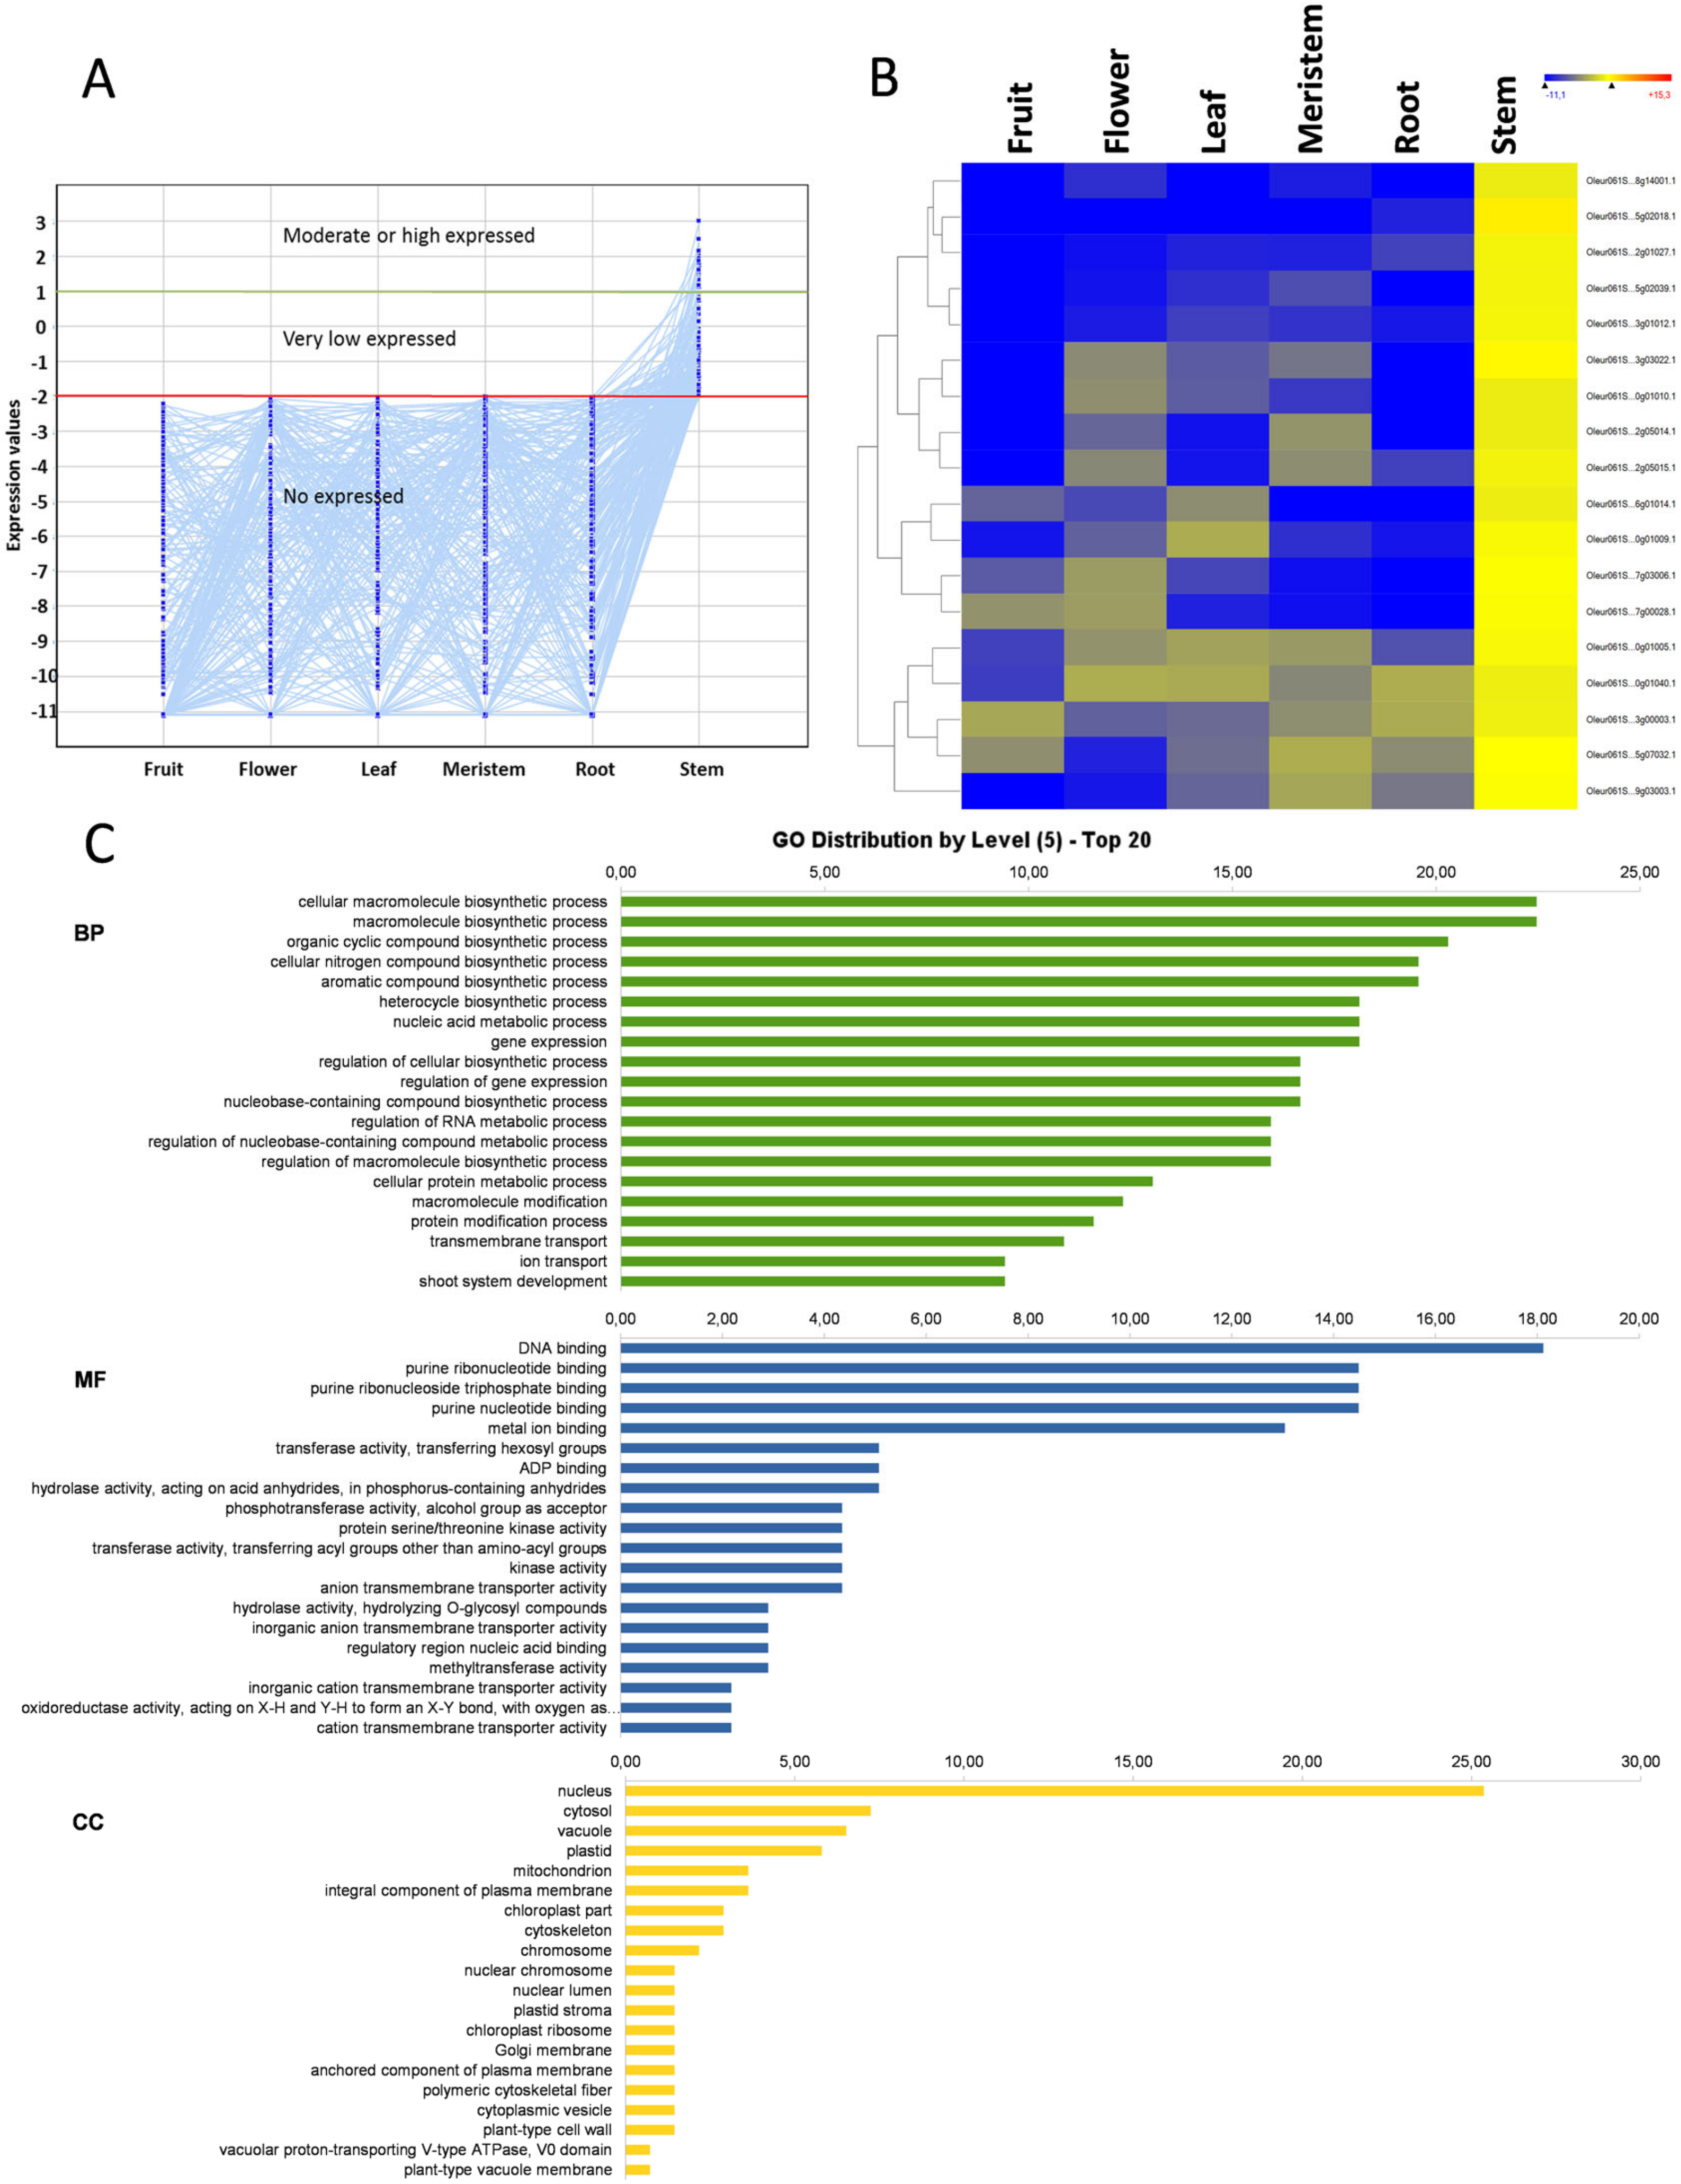
3.8. Stem-Specific Genes
4. Conclusions
Supplementary Materials
Author Contributions
Funding
Acknowledgments
Conflicts of Interest
References
- Gutiérrez, F.; Arnaud, T.; Garrido, A. Contribution of polyphenols to the oxidative stability of virgin olive oil. J. Sci. Food Agric. 2001, 81, 1463–1470. [Google Scholar] [CrossRef]
- Talhaoui, N.; Maqueda, M.; León, L.; De La Rosa, R.; Gutierrez, A.F.; Segura-Carretero, A. From Olive Fruits to Olive Oil: Phenolic Compound Transfer in Six Different Olive Cultivars Grown under the Same Agronomical Conditions. Int. J. Mol. Sci. 2016, 17, 337. [Google Scholar] [CrossRef] [Green Version]
- García, A.; Brenes, M.; Romero, C.; García, P.; Garrido, A. Study of phenolic compounds in virgin olive oils of the Picual variety. Eur. Food Res. Technol. 2002, 215, 407–412. [Google Scholar] [CrossRef]
- Cruz, F.; Julca, I.; Gómez-Garrido, J.; Loska, D.; Marcet-Houben, M.; Cano, E.; Galán, B.; Frias, L.; Ribeca, P.; Derdak, S.; et al. Genome sequence of the olive tree, Olea europaea. GigaScience 2016, 5, 12–29. [Google Scholar] [CrossRef] [PubMed]
- Unver, T.; Wu, Z.; Sterck, L.; Turktas, M.; Lohaus, R.; Li, Z.; Yang, M.; He, L.; Deng, T.; Escalante, F.J.; et al. Genome of wild olive and the evolution of oil biosynthesis. Proc. Natl. Acad. Sci. USA 2017, 114, E9413–E9422. [Google Scholar] [CrossRef] [PubMed] [Green Version]
- Jiménez-Ruiz, J.; Ramírez-Tejero, J.A.; Fernández-Pozo, N.; De La O Leyva-Pérez, M.; Yan, H.; De La Rosa, R.; Belaj, A.; Montes, E.; Rodríguez-Ariza, M.O.; Navarro, F.; et al. Transposon activation is a major driver in the genome evolution of cultivated olive trees (Olea europaea L.). Plant Genome 2020, e20010. [Google Scholar] [CrossRef] [Green Version]
- Liu, X.; Zhang, J.; Luo, Y.; Rao, G. Metabolome and transcriptome analyses reveal tissue-specific variations in gene expression and metabolites of olive. J. Plant Biol. 2020, 63, 73–82. [Google Scholar]
- Gros-Balthazard, M.; Besnard, G.; Sarah, G.; Holtz, Y.; Leclercq, J.; Santoni, S.; Wegmann, D.; Glémin, S.; Khadari, B. Evolutionary transcriptomics reveals the origins of olives and the genomic changes associated with their domestication. Plant J. 2019, 100, 143–157. [Google Scholar] [CrossRef]
- Perez, M.D.L.O.L.; Valverde-Corredor, A.; Valderrama, R.; Ruiz, J.J.; Merida, A.M.; Trelles, O.; Barroso, J.B.; Mercado-Blanco, J.; Luque, F. Early and delayed long-term transcriptional changes and short-term transient responses during cold acclimation in olive leaves. Curr. Neuropharmacol. 2014, 22, 1–11. [Google Scholar] [CrossRef] [Green Version]
- Jiménez-Ruiz, J.; Perez, M.D.L.O.L.; Schilirò, E.; Barroso, J.B.; Bombarely, A.; Mueller, L.; Mercado-Blanco, J.; Luque, F. Transcriptomic Analysis of Olea europaea L. Roots during the Verticillium dahliae Early Infection Process. Plant Genome 2017, 10. [Google Scholar] [CrossRef] [Green Version]
- Perez, M.D.L.O.L.; Ruiz, J.J.; Cabanás, C.G.-L.; Valverde-Corredor, A.; Barroso, J.B.; Luque, F.; Mercado-Blanco, J. Tolerance of olive (Olea europaea) cv Frantoio to Verticillium dahliaere lies on both basal and pathogen-induced differential transcriptomic responses. New Phytol. 2017, 217, 671–686. [Google Scholar] [CrossRef] [PubMed] [Green Version]
- Ruiz, J.J.; Perez, M.D.L.O.L.; Cabanás, C.G.-L.; Barroso, J.B.; Luque, F.; Mercado-Blanco, J. The Transcriptome of Verticillium dahliae Responds Differentially Depending on the Disease Susceptibility Level of the Olive (Olea europaea L.) Cultivar. Genes 2019, 10, 251. [Google Scholar] [CrossRef] [PubMed] [Green Version]
- López, C.D.R.B.; Vidoy, I.; Ruiz, J.J.; Merida, A.M.; Ocaña, A.M.F.; De La Rosa, R.; Barroso, J.B.; Navarro, F.; Trelles, O.; Beuzón, C.R.; et al. Genetic changes involved in the juvenile-to-adult transition in the shoot apex of Olea europaea L. occur years before the first flowering. Tree Genet. Genomes 2014, 10, 585. [Google Scholar] [CrossRef]
- Ruiz, J.J.; López, C.D.R.B.; Vidoy, I.; Perez, M.D.L.O.L.; Ocaña, A.M.F.; Barroso, J.B.; Barceló, A.; Beuzón, C.R.; De La Rosa, R.; Luque, F. Transcriptional analysis of adult cutting and juvenile seedling olive roots. Tree Genet. Genomes 2015, 11, 77. [Google Scholar] [CrossRef]
- Plaza, J.J.G.; Ortiz-Martín, I.; Merida, A.M.; López, C.D.R.B.; Sevilla, J.F.S.; Luque, F.; Trelles, O.; Bejarano, E.R.; De La Rosa, R.; Valpuesta, V.; et al. Transcriptomic Analysis Using Olive Varieties and Breeding Progenies Identifies Candidate Genes Involved in Plant Architecture. Front. Plant Sci. 2016, 7, 240. [Google Scholar] [CrossRef] [Green Version]
- Ruiz, J.J.; Perez, M.D.L.O.L.; Vidoy-Mercado, I.; Barceló-Muñóz, A.; Luque, F. Transcriptomic time-series analysis of early development in olive from germinated embryos to juvenile tree. BMC Genom. 2018, 19, 824. [Google Scholar] [CrossRef]
- Belaj, A.; De La Rosa, R.; Lorite, I.J.; Mariotti, R.; Cultrera, N.; Beuzón, C.R.; Plaza, J.J.G.; Merida, A.M.; Trelles, O.; Baldoni, L. Usefulness of a New Large Set of High Throughput EST-SNP Markers as a Tool for Olive Germplasm Collection Management. Front. Plant Sci. 2018, 9, 9. [Google Scholar] [CrossRef] [Green Version]
- Aronesty, E. Ea-Utils: ‘Command-Line Tools for Processing Biological Sequencing Data’. 2011. Available online: https://github.com/ExpressionAnalysis/ea-utils (accessed on 11 January 2017).
- Patel, R.; Jain, M. NGS QC Toolkit: A Toolkit for Quality Control of Next Generation Sequencing Data. PLoS ONE 2012, 7, e30619. [Google Scholar] [CrossRef]
- Conesa, A.; Götz, S.; García-Gómez, J.M.; Terol, J.; Talon, M.; Robles, M. Blast2GO: A universal tool for annotation, visualization and analysis in functional genomics research. Bioinformatics 2005, 21, 3674–3676. [Google Scholar] [CrossRef] [Green Version]
- Eisenberg, E.; Levanon, E.Y. Human housekeeping genes, revisited. Trends Genet. 2013, 29, 569–574. [Google Scholar] [CrossRef]
- Shulman, Y.; Lavee, S. Gibberellin-like substances during ripening of olive fruit. Sci. Hortic. 1980, 12, 169–175. [Google Scholar] [CrossRef]
- A McAtee, P.; Karim, S.; Schaffer, R.; David, K. A dynamic interplay between phytohormones is required for fruit development, maturation, and ripening. Front. Plant Sci. 2013, 4, 79. [Google Scholar] [CrossRef] [PubMed] [Green Version]
- Shockey, J.; Fulda, M.S.; Browse, J. Arabidopsis Contains Nine Long-Chain Acyl-Coenzyme A Synthetase Genes That Participate in Fatty Acid and Glycerolipid Metabolism1. Plant Physiol. 2002, 129, 1710–1722. [Google Scholar] [CrossRef] [PubMed] [Green Version]
- Schnurr, J.; Shockey, J.; Browse, J. The Acyl-CoA Synthetase Encoded by LACS2 Is Essential for Normal Cuticle Development in Arabidopsis. Plant Cell 2004, 16, 629–642. [Google Scholar] [CrossRef] [PubMed] [Green Version]
- Chen, H.; Kim, H.U.; Weng, H.; Browse, J. Malonyl-CoA Synthetase, Encoded by ACYL ACTIVATING ENZYME13, Is Essential for Growth and Development of Arabidopsis[C][W][OA]. Plant Cell 2011, 23, 2247–2262. [Google Scholar] [CrossRef] [Green Version]
- Heath, R.J.; O Rock, C. Roles of the FabA and FabZ beta-hydroxyacyl-acyl carrier protein dehydratases in Escherichia coli fatty acid biosynthesis. J. Boil. Chem. 1996, 271, 27795–27801. [Google Scholar] [CrossRef] [Green Version]
- A Wilson, Z.; Morroll, S.M.; Dawson, J.; Swarup, R.; Tighe, P. The Arabidopsis MALE STERILITY1 (MS1) gene is a transcriptional regulator of male gametogenesis, with homology to the PHD-finger family of transcription factors. Plant J. 2001, 28, 27–39. [Google Scholar] [CrossRef]
- Ito, T.; Nagata, N.; Yoshiba, Y.; Ohme-Takagi, M.; Ma, H.; Shinozaki, K. Arabidopsis MALE STERILITY1 Encodes a PHD-Type Transcription Factor and Regulates Pollen and Tapetum Development[W]. Plant Cell 2007, 19, 3549–3562. [Google Scholar] [CrossRef] [Green Version]
- Ostergaard, L.; Petersen, M.; Mattsson, O.; Mundy, J. An Arabidopsis callose synthase. Plant Mol. Boil. 2002, 49, 559–566. [Google Scholar] [CrossRef]
- Enns, L.C.; Kanaoka, M.; Torii, K.; Comai, L.; Okada, K.; Cleland, R.E. Two callose synthases, GSL1 and GSL5, play an essential and redundant role in plant and pollen development and in fertility. Plant Mol. Boil. 2005, 58, 333–349. [Google Scholar] [CrossRef]
- Tarchoune, I.; Sgherri, C.; Eddouzi, J.; Zinnai, A.; Quartacci, M.F.; Zarrouk, M. Olive Leaf Addition Increases Olive Oil Nutraceutical Properties. Molecules 2019, 24, 545. [Google Scholar] [CrossRef] [PubMed] [Green Version]
- Ruzzolini, J.; Peppicelli, S.; Andreucci, E.; Bianchini, F.; Scardigli, A.; Romani, A.; La Marca, G.; Nediani, C.; Calorini, L. Oleuropein, the Main Polyphenol of Olea europaea Leaf Extract, Has an Anti-Cancer Effect on Human BRAF Melanoma Cells and Potentiates the Cytotoxicity of Current Chemotherapies. Nutrients 2018, 10, 1950. [Google Scholar] [CrossRef] [PubMed] [Green Version]
- Liu, X.L.; Covington, M.F.; Fankhauser, C.; Chory, J.; Wagner, D.R. ELF3 encodes a circadian clock-regulated nuclear protein that functions in an Arabidopsis PHYB signal transduction pathway. Plant Cell 2001, 13, 1293–1304. [Google Scholar] [PubMed]
- Gindt, Y.M.; Messyasz, A.; Jumbo, P.I. Binding of Substrate Locks the Electrochemistry of CRY-DASH into DNA Repair. Biochemistry 2015, 54, 2802–2805. [Google Scholar] [CrossRef] [PubMed]
- Mei, Q.; Dvornyk, V. Evolutionary History of the Photolyase/Cryptochrome Superfamily in Eukaryotes. PLoS ONE 2015, 10, e0135940. [Google Scholar] [CrossRef] [PubMed] [Green Version]
- Fernández-González, A.J.; Villadas, P.J.; Cabanás, C.G.-L.; Valverde-Corredor, A.; Belaj, A.; Mercado-Blanco, J.; Fernández-López, M. Defining the root endosphere and rhizosphere microbiomes from the World Olive Germplasm Collection. Sci. Rep. 2019, 9, 20423–13. [Google Scholar] [CrossRef] [Green Version]
- Ponting, C.P.; Aravind, L. START: A lipid-binding domain in StAR, HD-ZIP and signalling proteins. Trends Biochem. Sci. 1999, 24, 130–132. [Google Scholar] [CrossRef]
- Wang, Y.; Yang, L.; Chen, X.; Ye, T.; Zhong, B.; Liu, R.; Wu, Y.; Chan, Z. Major latex protein-like protein 43 (MLP43) functions as a positive regulator during abscisic acid responses and confers drought tolerance in Arabidopsis thaliana. J. Exp. Bot. 2015, 67, 421–434. [Google Scholar] [CrossRef] [Green Version]
- Lu, H.; Zou, Y.; Feng, N. Overexpression of AHL20 Negatively Regulates Defenses in Arabidopsis. J. Integr. Plant Boil. 2010, 52, 801–808. [Google Scholar] [CrossRef]
- Fankhauser, C. PKS1, a Substrate Phosphorylated by Phytochrome That Modulates Light Signaling in Arabidopsis. Science 1999, 284, 1539–1541. [Google Scholar] [CrossRef]
- Lariguet, P.; Schepens, I.; Hodgson, D.; Pedmale, U.V.; Trevisan, M.; Kami, C.; De Carbonnel, M.; Alonso, J.M.; Ecker, J.R.; Liscum, E.; et al. PHYTOCHROME KINASE SUBSTRATE 1 is a phototropin 1 binding protein required for phototropism. Proc. Natl. Acad. Sci. USA 2006, 103, 10134–10139. [Google Scholar] [CrossRef] [PubMed] [Green Version]
- Boccalandro, H.E.; De Simone, S.N.; Bergmann-Honsberger, A.; Schepens, I.; Fankhauser, C.; Casal, J.J. PHYTOCHROME KINASE SUBSTRATE1 Regulates Root Phototropism and Gravitropism1[C][W][OA]. Plant Physiol. 2007, 146, 108–115. [Google Scholar] [CrossRef] [PubMed] [Green Version]
- Sakuma, Y.; Liu, Q.; Dubouzet, J.G.; Abe, H.; Shinozaki, K.; Yamaguchi-Shinozaki, K. DNA-Binding Specificity of the ERF/AP2 Domain of Arabidopsis DREBs, Transcription Factors Involved in Dehydration- and Cold-Inducible Gene Expression. Biochem. Biophys. Res. Commun. 2002, 290, 998–1009. [Google Scholar] [CrossRef] [PubMed]


© 2020 by the authors. Licensee MDPI, Basel, Switzerland. This article is an open access article distributed under the terms and conditions of the Creative Commons Attribution (CC BY) license (http://creativecommons.org/licenses/by/4.0/).
Share and Cite
Ramírez-Tejero, J.A.; Jiménez-Ruiz, J.; Leyva-Pérez, M.d.l.O.; Barroso, J.B.; Luque, F. Gene Expression Pattern in Olive Tree Organs (Olea europaea L.). Genes 2020, 11, 544. https://doi.org/10.3390/genes11050544
Ramírez-Tejero JA, Jiménez-Ruiz J, Leyva-Pérez MdlO, Barroso JB, Luque F. Gene Expression Pattern in Olive Tree Organs (Olea europaea L.). Genes. 2020; 11(5):544. https://doi.org/10.3390/genes11050544
Chicago/Turabian StyleRamírez-Tejero, Jorge A., Jaime Jiménez-Ruiz, María de la O Leyva-Pérez, Juan Bautista Barroso, and Francisco Luque. 2020. "Gene Expression Pattern in Olive Tree Organs (Olea europaea L.)" Genes 11, no. 5: 544. https://doi.org/10.3390/genes11050544