1. Introduction
Photovoltaic (PV) power that uses solar energy plays a crucial role in electric power generation as a renewable energy source. Photovoltaic solar energy will become more vital by virtue of the shortage of fossil fuels and their harmful environmental effects. In 2019, photovoltaic solar systems were used to generate a total world cumulative solar power capacity of 633 GW. This power is expected to increase to 770 GW by the end of 2020. In 2014, PV systems were used to generate a total world cumulative solar power capacity of 177 GW, and this difference shows how PV systems are developing and having interest.
Photovoltaic systems are classified into three categories: standalone (off-grid), grid-tied, and grid-tied with battery back-up PV systems. Standalone PV systems are intended to operate without a grid power source and are often used in remote areas with low or no residents. The grid-tied PV system is generally connected to an existing electricity grid in a way that will allow for transmitting electricity. Grid-tied with battery back-up PV systems are also known as grid-hybrid PV systems, which allow using electricity from batteries when power outages occur.
Thermal and electrical modeling of photovoltaic systems, design of power converters, maximum power point tracking algorithms, power conversion efficiency, and solar energy storage are included in the solar energy research area [
1]. From a literature review [
2,
3,
4], it can be observed that researchers have focused on photovoltaic cell modeling using single-diode or double-diode topology. These topologies are used based on the application of the researchers.
Many MPPT techniques have been proposed with different convergence speed, cost, complexity, overall efficiency, and tracking efficiency [
5]. Perturb and observe (P&O) [
6,
7,
8], incremental conductance [
9,
10,
11], fuzzy logic control [
12,
13], sliding mode control [
14], and neural network control [
15,
16] algorithms have been widely studied. In the PV system, MPPT algorithms require voltage variations to guide the maximum power point search. In perturb and observe (P&O) [
6,
7] and incremental conductance [
11], the voltage variations can be generated by the MPPT itself to guide to find the MPP. Therefore, MPPT methods can use oscillations that occur in the system for guidance.
DC–DC converters are used to average the output voltage by matching the resistance seen by the photovoltaic system. Therefore, researchers have used different types of DC–DC converters to control photovoltaic systems. The Ćuk [
17] converter is one of the DC–DC converters, fundamentally a step-up (boost) converter followed by a step-down (buck) converter. However, one of the drawbacks of the Ćuk converter is the high complexity of implementation. On the other hand, the single-ended primary inductance converter (SEPIC) [
18], boost [
19], and buck-boost [
20] are also widely used. The advantage of using the SEPIC converter is having a high voltage gain compared to the Ćuk converter. However, the disadvantage of the SEPIC is a high input surge current, causing short-circuit faults on the load side [
21].
In this article, a single-diode model is used to demonstrate the photovoltaic cell and assess the maximum power point tracking (MPPT) algorithms. In order to match the resistance seen by the photovoltaic system, a DC–DC step-up converter is implemented in the model. The boost converter is also used to overcome PV power generation’s continuous output power variation and harvest the peak power from a PV system. In addition, this paper is organized as follows: the single diode of the PV cell is illustrated with its performance characteristics under different solar irradiation levels. The importance of the MPPT algorithms, along with the two analyzed MPPT algorithms, are explained. The major novelty of this paper is that two MPPT techniques have been modified and proposed to improve tracking efficiency, overall system efficiency, and response time. The model is developed and detailed in the MATLAB/Simulink software, and comparative analysis of the modified and proposed P&O and IncCond algorithms with the original algorithms is conducted. The simulated dynamic irradiation conditions performance results are disclosed. Simulation results justify the effectiveness of the modified and proposed algorithms.
2. Single-Diode Model of Photovoltaic Cell
By creating an electrically equivalent model, the solar cell’s behavior can be understood. The current–voltage curve (I–V curve) consists of short-circuit current,
ISC; open-circuit voltage,
VOC; maximum voltage,
VMPP; and current,
IMPP. Therefore, these are used to design the single-diode model of the photovoltaic cell. The equivalent circuit of the single-diode model of the PV cell is shown in
Figure 1, where
IPV represents PV cell output current and
V represents PV cell output voltage.
IPH refers to the photo-generated controlled current. The
ID is the current in the diode branch,
Rs is the series resistance, which takes into account losses in cell interconnection and junction.
Rsh is the shunt resistance that includes the current leakage to the ground in the case when the diode is in reverse bias. Therefore, the current–voltage characteristics of the circuit can be expressed with the following equations:
In Equation (2),
α and
γ represent the diode ideality and the Boltzmann’s constant, respectively. The terms
T and
q refer to the absolute operating temperature and charge of the electron. Equations (2) and (3) are inserted into Equation (1) and rearranged to get the following Equation (4).
A solar panel is made of several series of parallel connected solar cells. Thus, the output voltage and current of the PV panel can be adjusted high enough to the requirements. The I–V characteristics of a solar panel are expressed in Equation (5), where the number of solar cells in series,
ns, and the number of solar cells in parallel,
np.
where
kc is the temperature coefficient of the short-circuit current (
ISC), and
GSTC is the solar irradiation at standard test conditions (STC). As can be seen From Equation (6), the current is directly proportional to the ratio of present solar irradiation,
G to the solar irradiation at standard test conditions,
GSTC.
where
kv is the thermal coefficient of voltage and
VOCSTC is the PV cell open-circuit voltage in standard test conditions. Equation (7) indicates that the open-circuit voltage is linearly dependent on temperature.
The power in direct current (DC) can be calculated with the formula below.
I,
V, and
P refer to current, voltage, and power, respectively, in Equation (8). The maximum power point where the product of
V and
I is maximum in the curve of I–V characteristics. The maximum power points for a PV cell under different solar irradiation levels are demonstrated in
Figure 2a,b.
Fill factor (
FF) is fundamentally a measure of the quality of PV cells. Thus, it is the ratio of maximum power to theoretical power. The formula for the fill factor can be defined as in Equation (9).
3. Necessity of Maximum Power Point Tracking (MPPT) Techniques
The illustrated single-diode circuit model of the PV cell is shown in
Figure 1, and the I–V characteristics in
Figure 2a,b. Thus, it can be observed that there is a unique MPP on the I–V curve for the different irradiation levels. Moreover,
Figure 2a,b emphasizes the importance of maximum power point tracking. It can be concluded that it is critical to operate the solar power generation systems at MPP to reduce the cost of PV systems as these systems have low power conversion efficiency. The MPPT controllers are used to continuously track the MPP, and these controllers are integrated with PV systems.
The MPPT controllers seek to find the true MPP by controlling the equivalent resistance of the solar panel. Different MPPT algorithms are implemented to control the duty cycle of converters for dynamic loads. As was mentioned before, the DC–DC step-up converter is used to handle the duty cycle for tracking the MPP in this work.
The maximum power point depends on the I–V characteristics and the load line. If the resistive load changes, the operating point of the PV panel also changes. Similarly, if the solar irradiation changes from 1000 to 800 W/m
2, as in
Figure 2a,b, the operating point of the PV cell moves to another point in the I–V curve. The load resistance and I–V characteristics are not constant for real-time operating conditions. Due to the reasons explained, the MPPT controller must be placed for tracking the MPP to harvest maximum power from the PV system. The perturb and observe (P&O) and incremental conductance (IncCond) algorithms are analyzed in this section, due to the reasons explained.
3.1. Perturb and Observe (P&O) Technique
The original perturb and observe algorithm is one of the MPPT algorithms. Thus, it is widely used due to the simplicity of the technique and does not require the measurement of solar intensity and solar cell temperature. As can be understood from the technique’s name, the algorithm observes and perturbs the PV panel terminal voltage. Firstly, the algorithm starts sensing the voltage and current and calculate the power. Secondly, it compares the power and voltages of the present time (k) with the previous time (k − 1). When the difference between present power P(k) and previous power P(k − 1) is not equal to zero, this algorithm will endeavor to find the optimal point on the left or right side of the present position. If the power is improved due to this perturbation, then the perturbation is continued in this direction. Otherwise, the perturbation is reversed. Finally, when ∆P is equal to zero, the maximum power point is reached, and the algorithm then continues perturbation around this MPP point. The flowchart of the perturb and observe algorithm is demonstrated in
Figure 3.
3.2. Incremental Conductance (IncCond) Algorithm
The original incremental conductance algorithm uses the ratio of the output power of the solar panel to the output voltage of the solar panel, which is also called the slope. The algorithm finds the MPP where the value of the slope is equal to zero. Furthermore, the slope’s value is positive on the left side of the MPP, whereas it is negative on the right side of the MPP.
In Equation (11),
dIpv and
dVpv can be approximated.
The inequalities are used to review the operation of the PV panel and the power at the load from the equations below.
In general, the IncCond technique uses a fixed step size by means of increment or decrement of the duty cycle. Thus, in varying the duty cycle, the PV voltage is decreased when the MPP lies on the right side, whereas the PV voltage is increased if the MPP takes place on the left side. The size of increment or decrement in the duty cycle determines how fast the MPP is reached. However, the IncCond algorithm has a significant disadvantage, in which the algorithm can easily lose track of MPP under fast-changing solar irradiation.
3.3. Modified and Proposed Perturb and Observe Algorithm
In order to enhance and overcome the limitations of the original perturb and observe method, a modified perturb and absorb algorithm is proposed. Similar to the original P&O method, the modified P&O also starts by receiving the value of current and voltage, then computes the power, as illustrated in
Figure 4.
A third parameter, that is current change, is defined to improve the tracking efficiency and response time of the algorithm under fast-changing solar irradiation. Four correction factors are also added to minimize the oscillations close to MPP. The original P&O method consists of four operating point perturbation cases, whereas the modified algorithm comprises eight cases.
In this modified and proposed P&O method, the algorithm is able to distinguish the power change in the system due to solar irradiation or matter of voltage perturbation. Moreover, four correction factors are derived using an iterative method and are chosen as the best possible values to evade diverging from MPP and minimize the oscillations. In the iterative method, the range of
δ1 and
δ2 was chosen to be between 0.90 and 0.95, whereas this range was between 0.80 and 0.85 for the value of
δ3, between 2.30 and 2.50 for the value of
δ4. These ranges were chosen by observing the wrong decisions made by the original P&O algorithm. Thus, correction factors are tested for five different PV systems. Based on tests, values for
δ1,
δ2,
δ3, and
δ4 were found. More explanation is given in
Table 1, demonstrating perturbation cases, the tracking direction, and the values of the four correction factors.
3.4. Modified and Proposed Incremental Conductance Algorithm
By measuring the increase in voltage and current, the immediate change in solar irradiation can be detected. In the modified and proposed IncCond method, an error is defined to minimize oscillations around the MPP and detect when MPP is reached. Thus, the algorithm stabilizes the system around MPP. The permittable error can be seen in Equation (17).
The proposed algorithm analyzes increments in the voltage and current. If there is no increment, it means that there is no instantaneous change in solar irradiance. Consequently, using this procedure, the algorithm overcomes the incorrect decisions when there is an increment or decrement in solar irradiance. The modified IncCond algorithm flowchart is illustrated in
Figure 5.
The original incremental conductance method drives the power to deviate far from the MPP under fast-changing solar irradiation. As a result, the algorithm makes a wrong decision, and more time is needed for the system to find the new MPP. Additionally, oscillations occur after MPP is reached at a steady state. On the other hand, the modified algorithm detects the rapid increase in solar irradiation and executes an appropriate decision. Therefore, the power converges to the new MPP from the beginning, and it is retained at it. Consequently, using the modified incremental conductance algorithm, the power converges faster than the response does by the original incremental conductance algorithm.
4. Discussion of Simulation Results
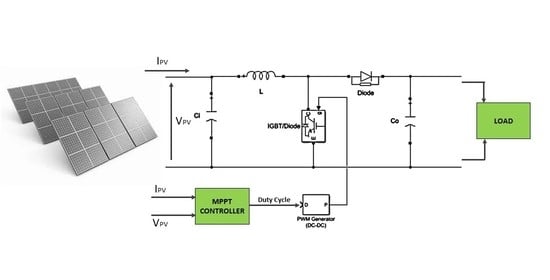
In this article, original P&O, IncCond, and modified P&O and IncCond algorithms are implemented to the PV system in order to acquire the maximum power. The performance of MPPT algorithms is analyzed at dynamic irradiation conditions. The model is developed in MATLAB/Simulink software and consists of the PV array, DC–DC boost converter, and PWM generator. In addition, two different PV modules and the different sizes of PV systems were simulated to demonstrate that the modified algorithms are suitable for low-power and high-power systems. Thus, the only change in the model is inside the PV array block to modify PV panels. The boost converters’ operating switching frequency is chosen to be 5 kHz; thus, their design parameters are given in
Table 2.
A schematic of the complete model is shown in
Figure 6.
The irradiation signal is built using a signal builder in the MATLAB/Simulink software to simulate and test the MPPT techniques. During the simulations, the temperature was chosen to be 25 °C. The time-varying and fast-changing dynamic solar irradiation signal can be seen in
Figure 7.
The step size of the duty cycle is used for all simulations, and it was chosen as 0.0001. The MPPT function block adjusts the duty cycle to match the PV array side’s impedance and the output side. The first system is a low-power PV system that has only one PV module. Thus, the Znshine PV-Tech ZXM6-60-265-M model PV panel is chosen, and the parameters of the PV module characteristics under STC are given in
Table 3.
On the other hand, the second system is a high-power PV system that comprises six PV panels consisting of three parallel strings, and each string has three series-connected modules. Thus, the 1Soltech 1STH-230-P model PV module is selected, and its parameter characteristics under STC are given in
Table 4.
4.1. Simulation Results of Original and Modified P&O Algorithms for the Low-Power PV System
The original P&O technique, shown in
Figure 3, and the modified P&O technique, illustrated in
Figure 4, are implemented in MATLAB/Simulink software using the model as shown in
Figure 6 for the low-power PV system. Tracking efficiency, overall system efficiency, and response time of these algorithms were compared. The comparison of tracking efficiency, overall efficiency, and the PV output power is shown in
Figure 8a–d.
The mean tracking efficiency and overall system efficiency are 0.9508 and 0.9127, respectively, for the original P&O technique. On the other hand, these values for the modified P&O technique increase to 0.9884 and 0.9647 for tracking and overall system efficiencies, respectively. Therefore, the response time of the tracking is also improved and is shown in
Figure 9a,b. For the original P&O technique, reaching the MPP takes around 40 ms, whereas it takes 15 ms to reach MPP and continue tracking for the modified P&O technique.
The perturbations are almost neglected with slight modifications and added constants in decisions in the original algorithm.
4.2. Simulation Results of Original and Modified IncCond Algorithms for the Low-Power PV System
In this section, the original incremental conductance and the modified incremental conductance algorithms are simulated and compared to each other using the model shown in
Figure 6. According to the results of simulations, the original incremental conductance method has a tracking efficiency of 0.9127 and overall system efficiency of 0.8745. By contrast, these values increase to 0.9882 for tracking efficiency and 0.9561 for overall system efficiency in the modified incremental conductance method.
The comparison of tracking efficiency, overall efficiency, and PV output power is shown in
Figure 10a–d. The modified algorithm can detect a fast increase in irradiation. Thus, it performs the correct decision for the duty cycle. The response time for the original algorithm is around 23 ms and around 20 ms for the modified algorithm.
The oscillations are minimized using the admitted error and shown in
Figure 11a,b. By contrast, the modified incremental conductance method can detect the confusion faced by the original algorithm.
4.3. Simulation Results of Original and Modified P&O Algorithms for the High-Power PV System
The original P&O and modified P&O algorithms are tested for a high-power PV system using the same models shown in
Figure 6 and
Figure 7. The results of simulations present that track efficiency and overall efficiency of the original P&O algorithm are 0.9516 and 0.9209, respectively. Thus, the response time of the algorithm is 40 ms for the high-power PV system. On the other hand, the modified P&O has a tracking efficiency of 0.9938 and overall efficiency of 0.9687. Furthermore, the response time is similar to that of the low-power PV system, and it takes around 15 ms to reach the MPP. The simulation results are demonstrated in
Figure 12a–d.
The oscillations and response time of the algorithms are given in
Figure 13a,b.
4.4. Simulation Results of Original and Modified IncCond Algorithms for the High-Power PV System
In this section, the original incremental conductance and the modified incremental conductance techniques are simulated and compared to each other for the high-power PV system using the model given in
Figure 6 and
Figure 7. The original incremental conductance method has a tracking efficiency of 0.9080 and overall system efficiency of 0.8779. By contrast, these values increase to 0.9921 for tracking efficiency and 0.9619 for overall system efficiency in the modified incremental conductance method. The comparison of tracking efficiency, overall efficiency, and PV output power is illustrated in
Figure 14a–d.
In addition, the algorithms take a similar time to reach the MPP as in a low-power PV system. The response time of the algorithms is shown in
Figure 15a,b.
4.5. Analysis of Simulation Results
The well-known and popular maximum power point tracking algorithms that can find the true maximum power point are discussed in this subsection. Perturb and observe, and incremental conductance algorithms were chosen for simplicity, effectiveness, and low-cost reasons. Thus, their performance and dynamic MPPT efficiencies were studied.
In order to show that the modified algorithms are suitable for each PV system, the algorithms were tested for low-power and high-power PV systems under time-varying solar irradiation. The summary of the simulation results is given in
Table 5.
The following conclusions are drawn for the simulation results:
The proposed P&O algorithm can smoothly track the fast-changing and time-varying solar irradiation with less divergence from the maximum power points. The algorithm also has high dynamic efficiency and acceptable steady-state oscillations around MPP with its simple implementation structure. On the other hand, in the proposed IncCond, the algorithm can detect incorrect decisions made by the original incremental conductance method. In addition, in using the admitted error, oscillations are also minimized.
From the performance results, it is inferred that the modified and proposed P&O and IncCond techniques have higher dynamic tracking efficiency and faster response time than the original techniques. As a result, the proposed algorithms ensure that the PV system achieves high overall efficiency. In addition, the modified P&O algorithm significantly minimized the oscillations.
5. Conclusions
The objective of this article was to modify and propose two MPPT algorithms to improve the tracking efficiency, response time, and overall system efficiency of PV systems. From the simulation results, it can be concluded that the proposed algorithms, with their simple structure, can track the MPPs correctly with less divergence under fast-changing solar irradiation. These algorithms do not require sophisticated hardware for implementation. Moreover, the tracking efficiency, overall system efficiency, and response time of algorithms were enhanced. One can say that the modified P&O technique has higher dynamic tracking efficiency than the modified IncCond technique and is suitable for MPPT tracking in PV systems at static and dynamic irradiation conditions. In addition, it has acceptable steady-state oscillations.
The conclusions are based on simulations in MATLAB/Simulink software. No experimental validation could be done.


