
Ocular Surface Pathology in Patients Suffering from Mercury Intoxication

 ,
,  , , , and
Abstract
:1. Introduction
2. Methods
2.1. Patients
2.2. Clinical Evaluation and Tear Sample Collection
- (1)
- Ocular surface-related symptom questionnaire. The Ocular Surface Disease Index (OSDI), consisted of 12 questions that evaluated symptoms experienced in the preceding week. The questionnaire was self-administered and scored on a range of 0 to 100. Based on their OSDI score, each patient was categorized as having no symptoms (score 0–12) or as having mild (score 13–22), moderate (score 23–32 points), or severe (score 33–100) ocular surface-related symptoms [9].After completing the OSDI questionnaire, we asked each patient which eye he considered the most symptomatic. That eye was used for tear sampling, osmolarity measurement, esthesiometry, microscopy, and in statistical analyses of the clinical tests. If both eyes were equally symptomatic, the eye was selected by computer-generated randomization.
- (2)
- Tear sample collection for molecular analysis. We followed our previous protocol in which unstimulated basal tear samples were collected non-traumatically from the external canthus, avoiding reflex tearing as much as possible [10]. One microliter of tear sample was collected with a glass capillary micropipette (Drummond, Broomall, PA, USA). Each sample was then diluted 1:10 in a sterile collection tube containing ice-cold Cytokine Assay Buffer (Milliplex, Millipore Merck Life Science SLU, Madrid, Spain). Tubes with tear samples were kept cold (4 °C) during collection and then stored at −80 °C until assayed.
- (3)
- Tear osmolarity. The osmolarity of each tear sample was assessed by the TearLab osmometer (TearLab Corporation, San Diego, CA, USA) analysis of a 50-nL tear sample collected from the external canthus. Although the cutoff value for abnormal tear osmolarity can vary according to different authors, following the manufacturer’s indications, values above 308 mOsm/L were considered higher than normal [11].
- (4)
- Conjunctival bulbar hyperemia. The nasal and temporal conjunctivas were assessed independently with a slit-lamp biomicroscope (SL-8Z; Topcon Corp, Tokyo, Japan) based on the Efron scale (0–4 score). The final score was the average of the nasal and temporal values [11].
- (5)
- Tear break-up time (T-BUT). Tear stability was assessed by T-BUT. After instillation of 5 μL of 2% sodium fluorescein into the inferior fornix, the time between the last of three blinks and the appearance of the first dry spot was measured three times, and the mean value was recorded. Values of less than 7 s are currently considered abnormal [11].
- (6)
- Ocular surface integrity. Corneal and conjunctival integrity were evaluated with fluorescein and lissamine green staining, respectively. The Oxford scheme (0–5 score) for grading the staining of both areas was used [11]. Corneal fluorescein staining was evaluated 2 min after instillation of 5 μL of 2% sodium fluorescein. The cobalt blue filter of the slit lamp was used with a yellow Wratten no. 12 filter (Eastman Kodak, Rochester, NY, USA) over the light source. Nasal and temporal bulbar conjunctival staining was evaluated using lissamine green strips (GreenGlo; HUB Pharmaceuticals, LLC, Rancho Cucamonga, CA, USA) wetted with 25 μL sodium chloride and then gently applied into the inferior fornix.
- (7)
- Tear production. Tear production was assessed with two different tests: tear lysozyme level assay and Schirmer’s test without topical anesthesia. The tear lysozyme concentration test is routinely performed in our institution as a marker of aqueous-deficient dry eye (DE), as previously detailed [12]. Briefly, tears were sampled by applying a 5-mm diameter filter paper disc in the inferior fornix, and the eye was held closed for 1 min. The assay was carried out with the Micrococcus lysodeikticus (ATCC 4698, M3770; Sigma-Aldrich, St. Louis, MO, USA) agar diffusion assay in Mueller Hinton agar plates (Bio Merieux, Marcy l’Etoile, France). Lysozyme concentration was calculated from a standard curve of the inhibition hallux generated with several concentrations of commercial lysozyme (ATCC 4698, L6876; Sigma-Aldrich). Values of less than 1000 μg/mL were considered abnormal and thus indicative of low tear production [12].Immediately after the lysozyme tear production assay, the Schirmer test was performed by placing a sterile strip (I-DEW tear strips, Entod Research Cell UK, Ltd., London, UK) in the lateral canthus of the inferior lid margin. Subjects were asked to maintain eye closure during the test, and the length of wetting was measured after 5 min. Results below 5-mm length were considered abnormal [11].
- (8)
- Corneal sensitivity. Corneal sensitivity was measured with a prototype Belmonte’s non-contact gas esthesiometer as previously reported by our group [13]. The corneal threshold for mechanical and thermal (cold and heat) sensitivities was determined in the central cornea using the method of levels. Three-second air pulses of adjustable flow rate and temperature were applied to the center of the cornea for determining corneal sensitivity thresholds. The mechanical threshold was always determined first. The probe of the esthesiometer was mounted on a base adapted to a slit lamp. Subjects were instructed to look at a fixation target at 3 m, and the tip was placed perpendicular to the corneal apex, 5 mm from the surface, measured with a transparent ruler. Mechanical stimulation consisted of a series of variable flows of medicinal air (0–200 mL/min). Air was heated at the tip of the probe at 50 °C so that it reached the ocular surface at 34 °C to prevent a change in corneal temperature caused by the airflow. Thermal thresholds were determined by heating or cooling the air to produce changes in basal corneal temperature of ± 0.1 °C, with a 10 mL/min flow below the mechanical threshold. A noise (a click produced by opening the gas valve) indicated the start of the pulse. Immediately after each stimulation pulse, the subject was asked to report the presence or absence of sensation. The order of heat and cold threshold measurement was randomized. Results were compared with a control group of 22 healthy males whose characteristics have been described above.
- (9)
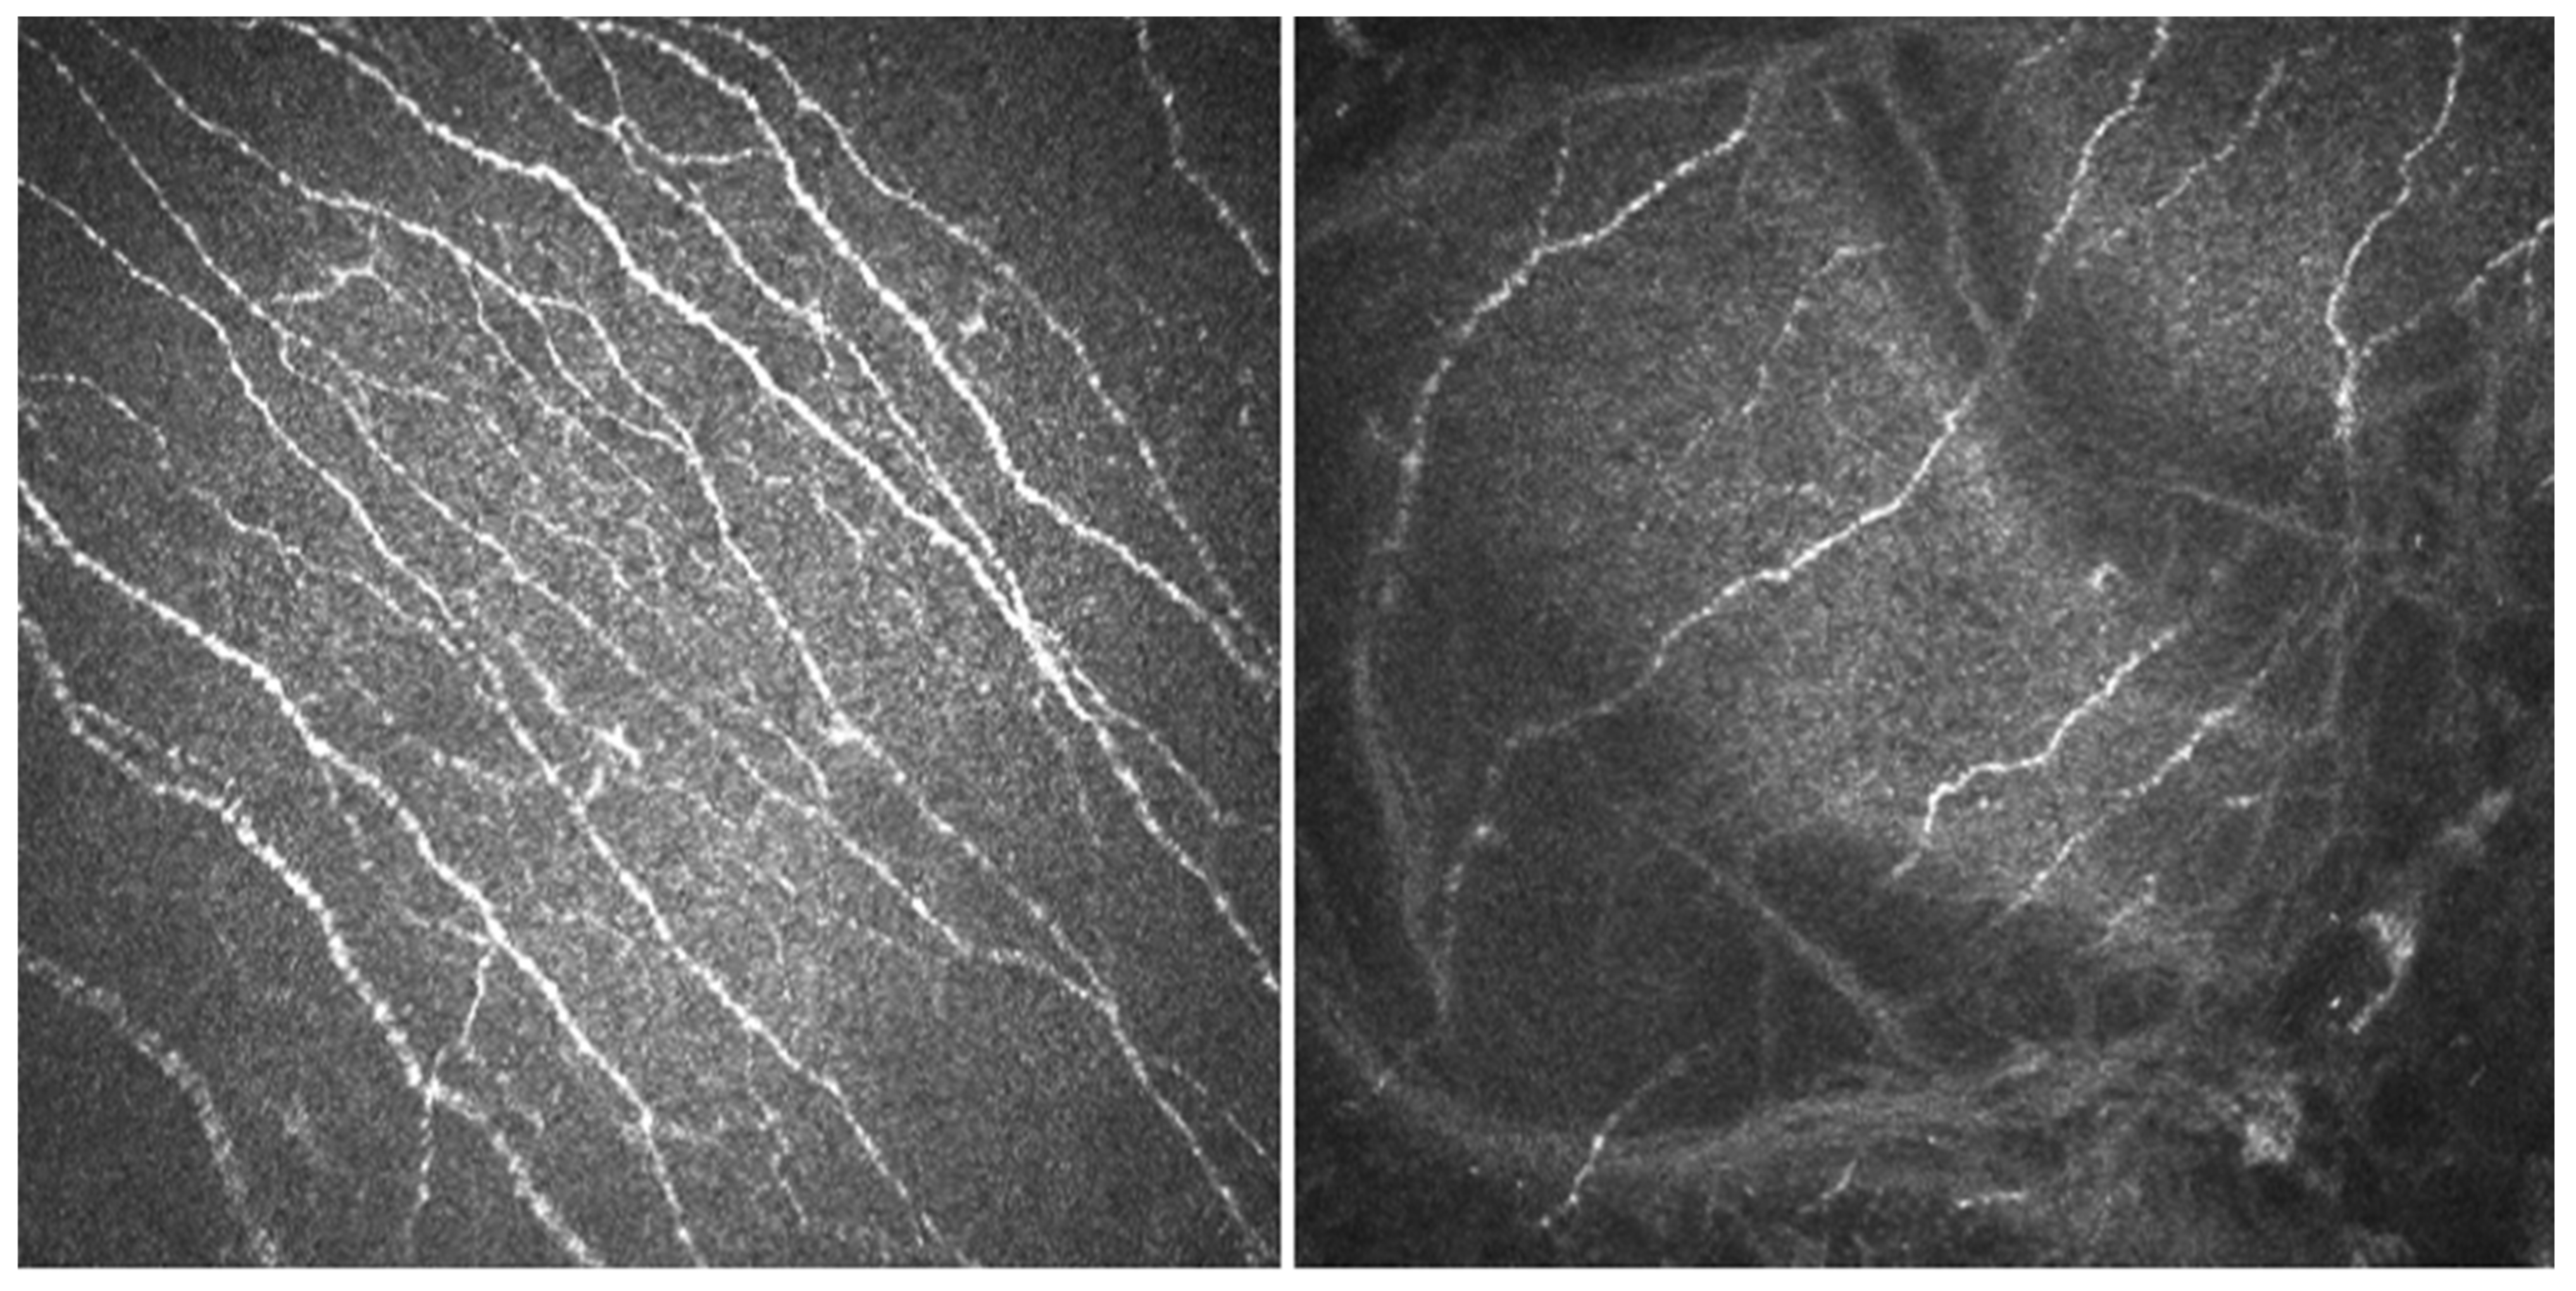
- In vivo confocal microscopy (IVCM). Laser scanning IVCM of the cornea was performed using the Rostock cornea module of the Heidelberg Retina Tomograph 3 (Heidelberg Engineering GmbH, Heidelberg, Germany). Before examination, a drop of anesthetic was instilled, and an eye speculum was used to keep the lids wide open. A drop of Viscotears Gel (Carbomer 980, 0.2%; Novartis Farmacéutica S.A., Barcelona, Spain) was deposited on the objective lens, thus avoiding direct contact of the TomoCap with the cornea. At least three good quality, non-overlapping images from the sub-basal nerve plexus of the central cornea were obtained using sequence and/or volume scans, and were used for the analysis. Each image was comprised of 384 × 384 pixels covering an area of 400 × 400 μM (0.16 mm2) with a transverse optical resolution of 2 μM, an axial optical resolution of 4 μM, and an acquisition time of 0.024 s.For IVCM image analysis, two masked observers analyzed the following in the three images: (1) nerve morphology parameters of density, length, branching density, and grade of tortuosity; (2) density of dendritic cells; (3) presence of neuromas; and (4) reflectivity from the confocal images, as an index of optic densitometry or transparency of cornea [14]. The mean value between the two observers for each parameter was computed for statistical analysis.Nerve density (n/mm2) and length (mm/mm2) were measured using the plugin NeuronJ (http://www.imagescience.org/meijering/software/neuronj/ accessed on 25 May 2021) from the ImageJ and provides quantification. The number of nerve branch points and dendritic cells (identified in the sub-basal nerve plexus by their distinctive features, i.e., bright cell bodies with dendritic form structures), were manually determined using the multipoint tool of the ImageJ software, and the densities calculated (n/mm2) as described in a previous study [15]. The grade of nerve tortuosity was evaluated according to the scale (0–4) reported by Oliveira-Soto and Efron [16] for main nerves. The histogram of each image based on the ImageJ plugin was used to obtain the mean reflectivity or optic densitometry [14]. These parameters were compared with well-established values for normal corneas and performed with the same type of confocal microscope. Specifically, we used data from Giannacare et al. [17] for nerve length, and from our group for nerve density, density of nerve branches, density of dendritic cells, [15] and nerve tortuosity and reflectivity [14].
- (10)
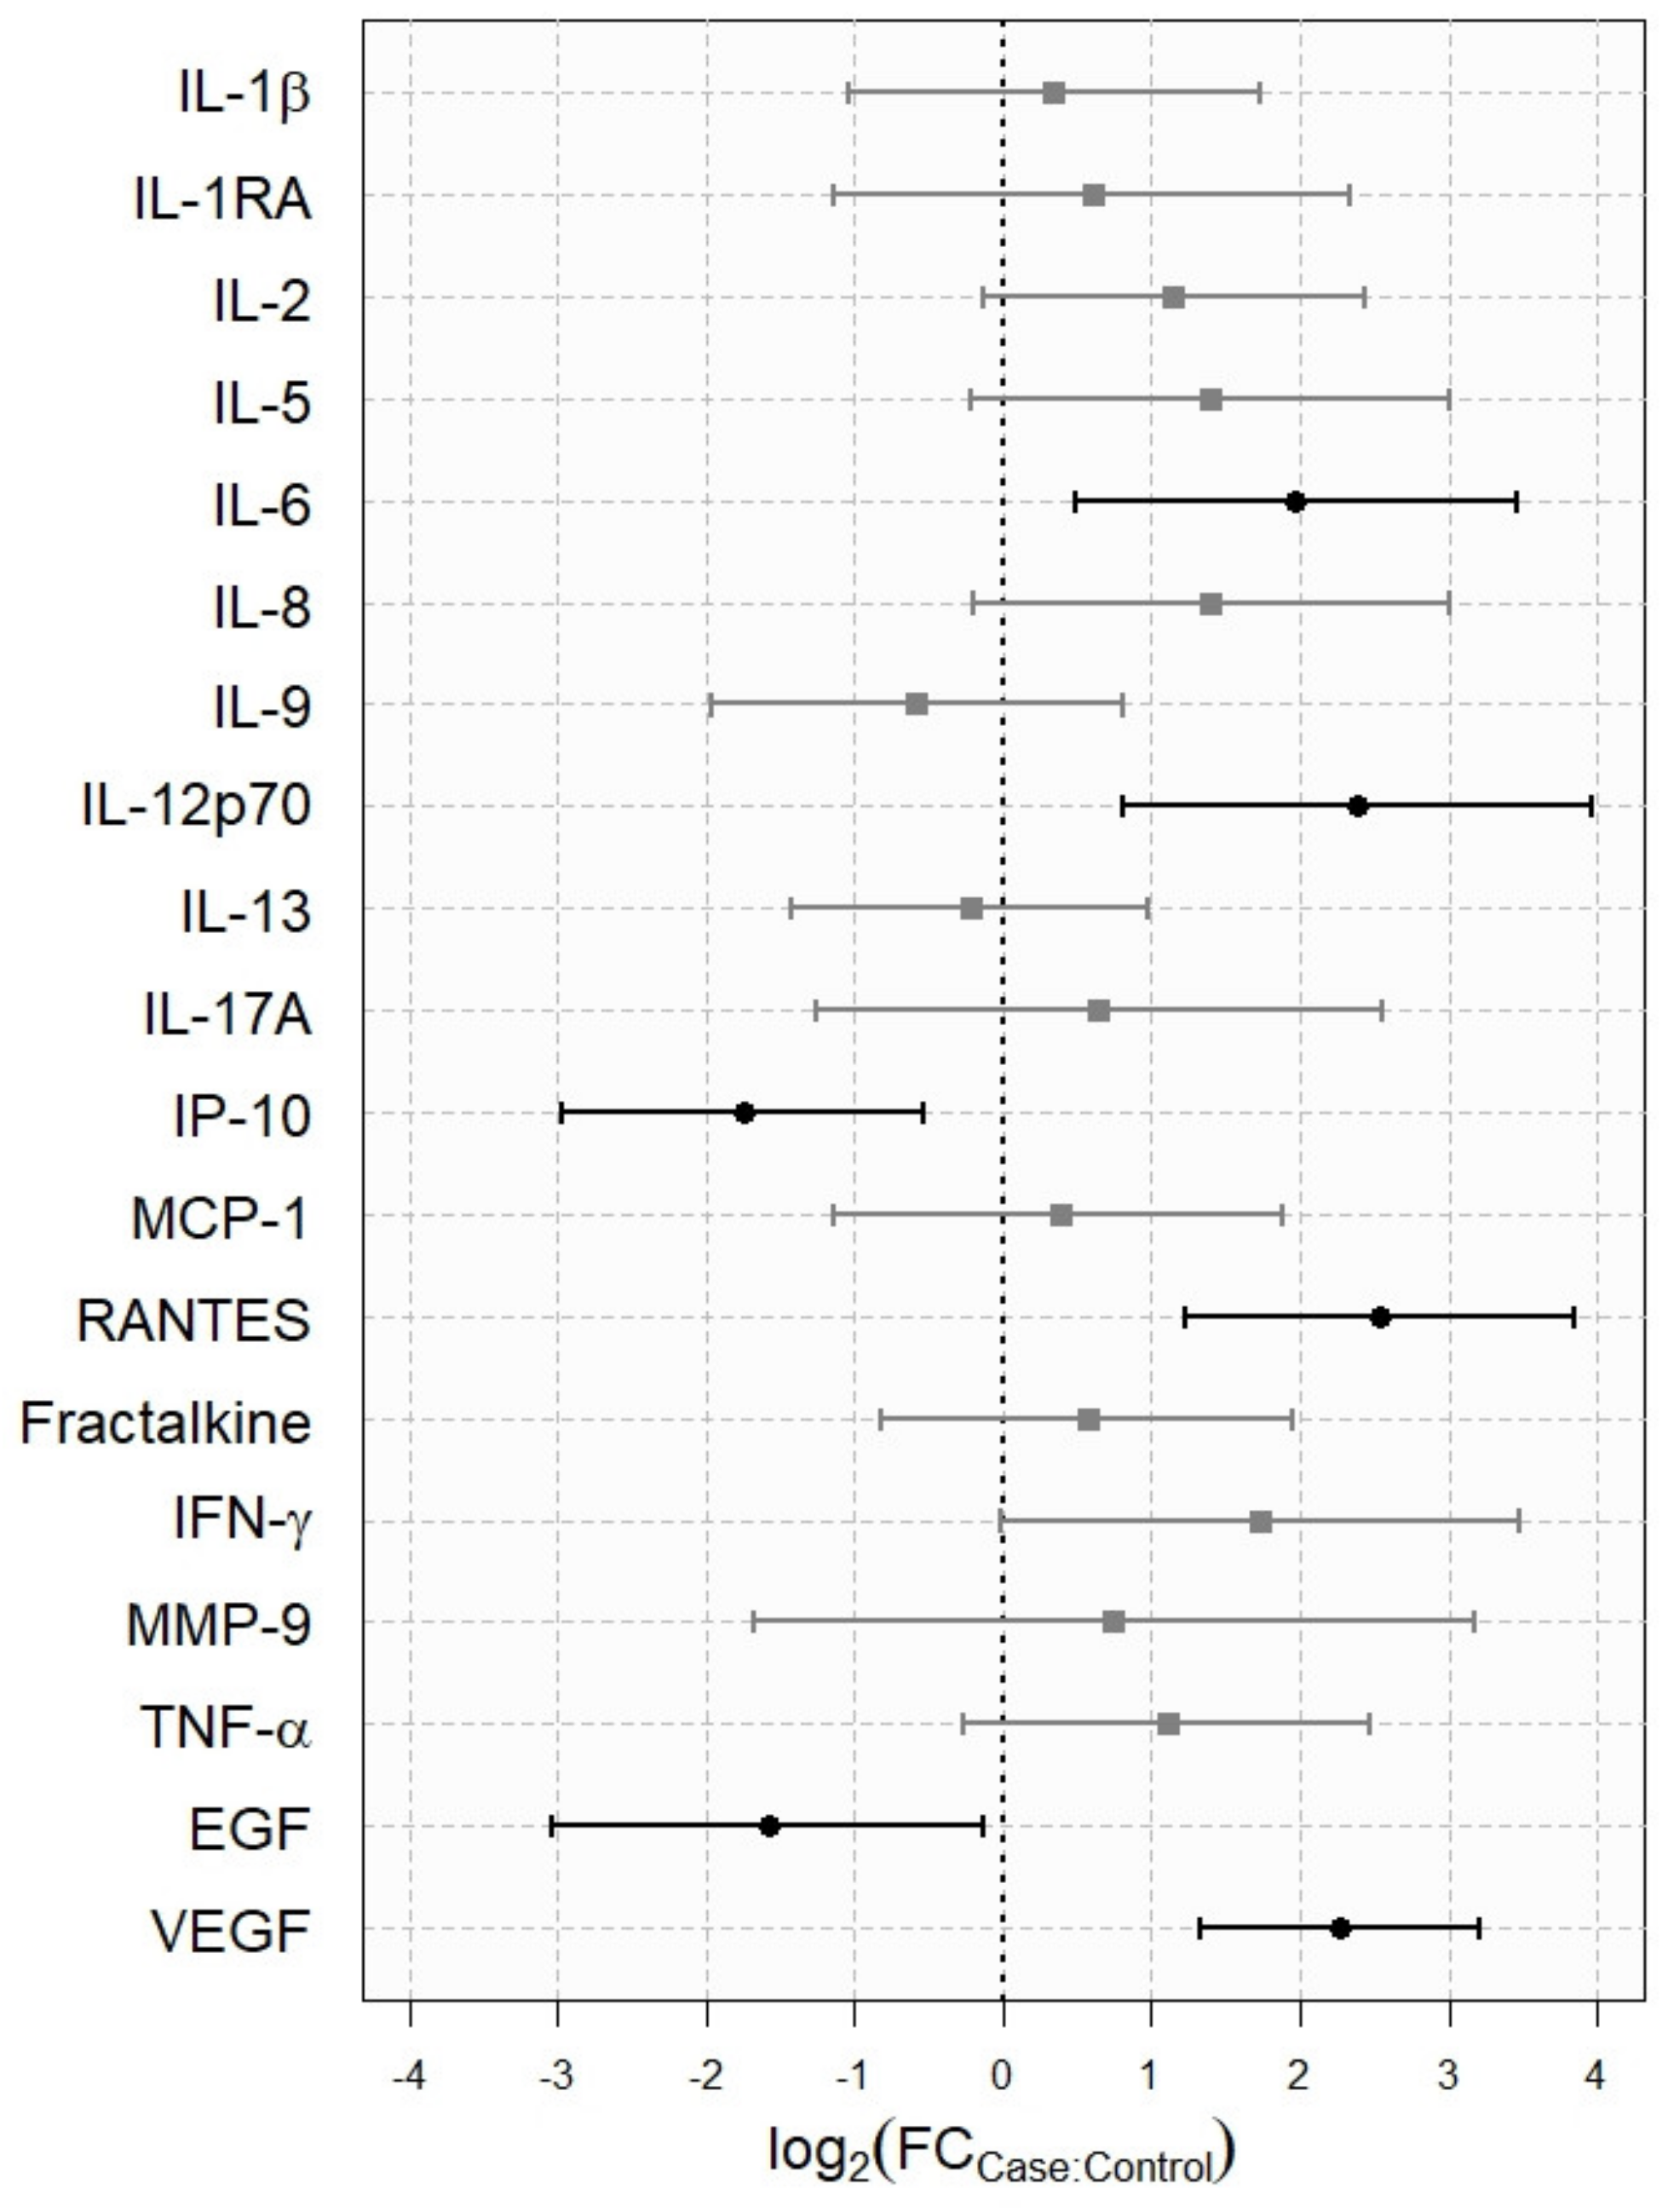
- Analysis of tear cytokine concentrations. A commercial customized immunobead-based array was used to analyze the concentration of 23 cytokines and chemokines in tear samples with a Luminex IS-100 (Luminex Corporation, Austin, TX, USA). The concentrations of interleukin (IL)-1β IL-1 receptor antagonist (IL-1RA), IL-2, IL-4, IL-5, IL-6, chemokine (C-XC motif) ligand 8 (CXCL8)/IL-8, IL-9, IL-10, IL-12p70, IL-13, IL-17A, chemokine (C-X-C motif) ligand 10 (CXCL10)/interferon gamma-induced protein 10 (IP-10), chemokine (C-C motif) ligand 2 (CCL2)/MCP-1, chemokine (C-C motif) ligand 3 (CCL3)/MIP1-αchemokine (C-C motif) ligand 5 (CCL5)/regulated on activation, normal T-cell expressed and secreted (RANTES), chemokine (C-C motif) ligand 11 (CCL11/eotaxin-1), chemokine (C-X3-C motif) ligand 1 (CX3CL1)/fractalkine, interferon gamma (IFN)-γ, matrix metalloproteinase-9 (MMP-9), tumor necrosis factor (TNF)-α, epidermal growth factor (EGF), and vascular endothelial growth factor (VEGF) were measured simultaneously with a customized 23-plex SPR assay (SPR591 HCYTO- 60K, 23X-Milliplex). The samples were analyzed following the manufacturer’s low volume sample protocol that only uses 10 μL of sample/standards per assay, as previously described [10]. Data were stored and analyzed with the “Bead View Software” (Upstate-Millipore Corporation, Watford, UK). Standard curves were used to convert fluorescence units to molecule concentrations (pg/mL). The minimum detectable concentration, based on manufacturer specifications, was 1.2 pg/mL. Molecules that were detected in less than 30% of the samples were not statistically analyzed any further. Results were compared with a control group of 22 healthy males from our files, whose characteristics have been described above.
2.3. Statistical Analysis
3. Results
3.1. Clinical Tests
3.2. Corneal Sensitivity
3.3. IVCM Findings
3.4. Analysis of Tear Cytokine Concentration
4. Discussion
Author Contributions
Funding
Institutional Review Board Statement
Informed Consent Statement
Data Availability Statement
Conflicts of Interest
References
- Bank, M.S. The mercury science-policy interface: History, evolution and progress of the Minamata Convention. Sci. Total Environ. 2020, 722, 137832. [Google Scholar] [CrossRef]
- Yang, L.; Zhang, Y.; Wang, F.; Luo, Z.; Guo, S.; Strahle, U. Toxicity of mercury: Molecular evidence. Chemosphere 2020, 245, 125586. [Google Scholar] [CrossRef]
- Rooney, J.P. The retention time of inorganic mercury in the brain—A systematic review of the evidence. Toxicol. Appl. Pharmacol. 2014, 274, 425–435. [Google Scholar] [CrossRef] [PubMed]
- Bernhoft, R.A. Mercury toxicity and treatment: A review of the literature. J. Environ. Public Health 2012, 2012, 460508. [Google Scholar] [CrossRef] [PubMed]
- El-Sherbeeny, A.M.; Odom, J.V.; Smith, J.E. Visual system manifestations due to systemic exposure to mercury. Cutan Ocul. Toxicol. 2006, 25, 173–183. [Google Scholar] [CrossRef] [PubMed]
- Lushei, E.; Mottet, N.K.; Shaw, C.M. Chronic methylmercury exposure in the monkey (Macaca mulatta). Behavioral test of peripheral vision, signs of neurotoxicity, and blood concentration in relation to dose and time. Arch. Environ. Health 1977, 32, 126–131. [Google Scholar] [CrossRef]
- Willes, R.F.; Truelove, J.F.; Nera, E.A. Neurotoxic response of infant monkeys to methylmercury. Toxicology 1978, 9, 10. [Google Scholar] [CrossRef]
- Kulczycka, B. Resorption of metallic mercury by the conjunctiva. Nature 1965, 206, 943. [Google Scholar] [CrossRef]
- Miller, K.L.; Walt, J.G.; Mink, D.R.; Satram-Hoang, S.; Wilson, S.E.; Perry, H.D.; Asbell, P.A.; Pflugfelder, S.C. Minimal clinically important difference for the ocular surface disease index. Arch. Ophthalmol. 2010, 128, 94–101. [Google Scholar] [CrossRef] [PubMed]
- Pinto-Fraga, J.; Enriquez-de-Salamanca, A.; Calonge, M.; Gonzalez-Garcia, M.J.; Lopez-Miguel, A.; Lopez-de la Rosa, A.; Garcia-Vazquez, C.; Calder, V.; Stern, M.E.; Fernandez, I. Severity, therapeutic, and activity tear biomarkers in dry eye disease: An analysis from a phase III clinical trial. Ocul. Surf. 2018, 16, 368–376. [Google Scholar] [CrossRef]
- Wolffsohn, J.S.; Arita, R.; Chalmers, R.; Djalilian, A.; Dogru, M.; Dumbleton, K.; Gupta, P.K.; Karpecki, P.; Lazreg, S.; Pult, H.; et al. TFOS DEWS II diagnostic methodology report. Ocul. Surf. 2017, 15, 539–574. [Google Scholar] [CrossRef] [PubMed]
- Enriquez-de-Salamanca, A.; Castellanos, E.; Stern, M.E.; Fernandez, I.; Carreno, E.; Garcia-Vazquez, C.; Herreras, J.M.; Calonge, M. Tear cytokine and chemokine analysis and clinical correlations in evaporative-type dry eye disease. Mol. Vis. 2010, 16, 862–873. [Google Scholar] [PubMed]
- Lopez-de la Rosa, A.; Martin-Montanez, V.; Lopez-Miguel, A.; Calonge, M.; Enriquez-de-Salamanca, A.; Gonzalez-Garcia, M.J. Corneal sensitivity and inflammatory biomarkers in contact lens discomfort. Optom. Vis. Sci. 2016, 93, 892–900. [Google Scholar] [CrossRef] [PubMed]
- Garcia-Gonzalez, M.; Canadas, P.; Gros-Otero, J.; Rodriguez-Perez, I.; Canones-Zafra, R.; Kozobolis, V.; Teus, M.A. Long-term corneal subbasal nerve plexus regeneration after laser in situ keratomileusis. J. Cataract Refract. Surg. 2019, 45, 966–971. [Google Scholar] [CrossRef] [PubMed]
- Lopez-De La Rosa, A.; Arroyo-Del Arroyo, C.; Canadas, P.; Lopez-Miguel, A.; Calonge, M.; Enriquez-De-Salamanca, A.; Gonzalez-Garcia, M.J. Are contact lens discomfort or soft contact lens material properties associated with alterations in the corneal sub-basal nerve plexus? Curr. Eye Res. 2018, 43, 487–492. [Google Scholar] [CrossRef] [PubMed]
- Oliveira-Soto, L.; Efron, N. Morphology of corneal nerves using confocal microscopy. Cornea 2001, 20, 374–384. [Google Scholar] [CrossRef]
- Giannaccare, G.; Pellegrini, M.; Sebastiani, S.; Moscardelli, F.; Versura, P.; Campos, E.C. In vivo confocal microscopy morphometric analysis of corneal subbasal nerve plexus in dry eye disease using newly developed fully automated system. Graefes Arch. Clin. Exp. Ophthalmol. 2019, 257, 583–589. [Google Scholar] [CrossRef]
- Cruzat, A.; Qazi, Y.; Hamrah, P. In vivo confocal microscopy of corneal nerves in health and disease. Ocul. Surf. 2017, 15, 15–47. [Google Scholar] [CrossRef] [Green Version]
- Calonge, M.; Perez, I.; Galindo, S.; Nieto-Miguel, T.; Lopez-Paniagua, M.; Fernandez, I.; Alberca, M.; Garcia-Sancho, J.; Sanchez, A.; Herreras, J.M. A proof-of-concept clinical trial using mesenchymal stem cells for the treatment of corneal epithelial stem cell deficiency. Transl. Res. 2019, 206, 18–40. [Google Scholar] [CrossRef] [Green Version]
- Benitez-Del-Castillo, J.M.; Acosta, M.C.; Wassfi, M.A.; Diaz-Valle, D.; Gegundez, J.A.; Fernandez, C.; Garcia-Sanchez, J. Relation between corneal innervation with confocal microscopy and corneal sensitivity with noncontact esthesiometry in patients with dry eye. Investg. Ophthalmol. Vis. Sci. 2007, 48, 173–181. [Google Scholar] [CrossRef] [PubMed] [Green Version]
- Nettune, G.R.; Pflugfelder, S.C. Post-LASIK tear dysfunction and dysesthesia. Ocul. Surf. 2010, 8, 135–145. [Google Scholar] [CrossRef] [Green Version]
- Yi, H.C.; Lee, Y.P.; Shin, Y.J. Influence of nasal tear osmolarity on ocular symptoms related to dry eye disease. Am. J. Ophthalmol. 2018, 189, 71–76. [Google Scholar] [CrossRef] [PubMed]
- Gjerdrum, B.; Gundersen, K.G.; Lundmark, P.O.; Potvin, R.; Aakre, B.M. Prevalence of signs and symptoms of dry eye disease 5 to 15 after refractive surgery. Clin. Ophthalmol. 2020, 14, 269–279. [Google Scholar] [CrossRef] [PubMed] [Green Version]
- Bourcier, T.; Acosta, M.C.; Borderie, V.; Borras, F.; Gallar, J.; Bury, T.; Laroche, L.; Belmonte, C. Decreased corneal sensitivity in patients with dry eye. Investg. Ophthalmol. Vis. Sci. 2005, 46, 2341–2345. [Google Scholar] [CrossRef] [PubMed]
- Labbe, A.; Alalwani, H.; van Went, C.; Brasnu, E.; Georgescu, D.; Baudouin, C. The relationship between subbasal nerve morphology and corneal sensation in ocular surface disease. Investg. Ophthalmol. Vis. Sci. 2012, 53, 4926–4931. [Google Scholar] [CrossRef] [PubMed]
- Yamaguchi, T.; Hamrah, P.; Shimazaki, J. Bilateral alterations in corneal nerves, dendritic cells, and tear cytokine levels in ocular surface disease. Cornea 2016, 35 (Suppl. 1), S65–S70. [Google Scholar] [CrossRef] [PubMed] [Green Version]
- Tuominen, I.S.; Konttinen, Y.T.; Vesaluoma, M.H.; Moilanen, J.A.; Helinto, M.; Tervo, T.M. Corneal innervation and morphology in primary Sjogren’s syndrome. Investg. Ophthalmol. Vis. Sci. 2003, 44, 2545–2549. [Google Scholar] [CrossRef] [PubMed] [Green Version]
- Zhang, M.; Chen, J.; Luo, L.; Xiao, Q.; Sun, M.; Liu, Z. Altered corneal nerves in aqueous tear deficiency viewed by in vivo confocal microscopy. Cornea 2005, 24, 818–824. [Google Scholar] [CrossRef] [PubMed]
- Klitsch, A.; Evdokimov, D.; Frank, J.; Thomas, D.; Saffer, N.; Altenschildesche, C.M.Z.; Sisignano, M.; Kampik, D.; Malik, R.A.; Sommer, C.; et al. Reduced association between dendritic cells and corneal sub-basal nerve fibers in patients with fibromyalgia syndrome. J. Peripher. Nerv. Syst. 2020, 25, 9–18. [Google Scholar] [CrossRef] [Green Version]
- Gao, N.; Lee, P.; Yu, F.S. Intraepithelial dendritic cells and sensory nerves are structurally associated and functional interdependent in the cornea. Sci. Rep. 2016, 6, 36414. [Google Scholar] [CrossRef] [PubMed] [Green Version]
- Patel, D.V.; McGhee, C.N. In vivo confocal microscopy of human corneal nerves in health, in ocular and systemic disease, and following corneal surgery: A review. Br. J. Ophthalmol. 2009, 93, 853–860. [Google Scholar] [CrossRef] [Green Version]
- Gardner, R.M.; Nyland, J.F.; Silbergeld, E.K. Differential immunotoxic effects of inorganic and organic mercury species in vitro. Toxicol. Lett. 2010, 198, 182–190. [Google Scholar] [CrossRef] [Green Version]
- Hagan, S.; Martin, E.; Enriquez-de-Salamanca, A. Tear fluid biomarkers in ocular and systemic disease: Potential use for predictive, preventive and personalised medicine. EPMA J. 2016, 7, 15. [Google Scholar] [CrossRef] [Green Version]
- Di Zazzo, A.; Micera, A.; de Piano, M.; Cortes, M.; Bonini, S. Tears and ocular surface disorders: Usefulness of biomarkers. J. Cell Physiol. 2019, 234, 9982–9993. [Google Scholar] [CrossRef] [PubMed]
- Lopez-Miguel, A.; Teson, M.; Martin-Montanez, V.; Enriquez-de-Salamanca, A.; Stern, M.E.; Gonzalez-Garcia, M.J.; Calonge, M. Clinical and molecular inflammatory response in sjogren syndrome-associated dry eye patients under desiccating stress. Am. J. Ophthalmol. 2016, 161, 133–141.e2. [Google Scholar] [CrossRef] [PubMed] [Green Version]
- Lam, H.; Bleiden, L.; de Paiva, C.S.; Farley, W.; Stern, M.E.; Pflugfelder, S.C. Tear cytokine profiles in dysfunctional tear syndrome. Am. J. Ophthalmol. 2009, 147, 198–205.e1. [Google Scholar] [CrossRef] [PubMed] [Green Version]
- Teson, M.; Gonzalez-Garcia, M.J.; Lopez-Miguel, A.; Enriquez-de-Salamanca, A.; Martin-Montanez, V.; Benito, M.J.; Mateo, M.E.; Stern, M.E.; Calonge, M. Influence of a controlled environment simulating an in-flight airplane cabin on dry eye disease. Investg. Ophthalmol. Vis. Sci. 2013, 54, 2093–2099. [Google Scholar] [CrossRef] [Green Version]
- Lopez-Miguel, A.; Teson, M.; Martin-Montanez, V.; Enriquez-de-Salamanca, A.; Stern, M.E.; Calonge, M.; Gonzalez-Garcia, M.J. Dry eye exacerbation in patients exposed to desiccating stress under controlled environmental conditions. Am. J. Ophthalmol. 2014, 157, 788–798.e2. [Google Scholar] [CrossRef]
- Cocho, L.; Fernandez, I.; Calonge, M.; Martinez, V.; Gonzalez-Garcia, M.J.; Caballero, D.; Lopez-Corral, L.; Garcia-Vazquez, C.; Vazquez, L.; Stern, M.E.; et al. Biomarkers in ocular chronic graft versus host disease: Tear cytokine- and chemokine-based predictive model. Investg. Ophthalmol. Vis. Sci. 2016, 57, 746–758. [Google Scholar] [CrossRef] [Green Version]
- Gonzalez-Garcia, M.J.; Murillo, G.M.; Pinto-Fraga, J.; Garcia, N.; Fernandez, I.; Maldonado, M.J.; Calonge, M.; Enriquez-de-Salamanca, A. Clinical and tear cytokine profiles after advanced surface ablation refractive surgery: A six-month follow-up. Exp. Eye Res. 2020, 193, 107976. [Google Scholar] [CrossRef]
- Zhang, C.; Ding, H.; He, M.; Liu, L.; Li, G.; Niu, B.; Zhong, X. Comparison of early changes in ocular surface and inflammatory mediators between femtosecond lenticule extraction and small-incision lenticule extraction. PLoS ONE 2016, 11, e0149503. [Google Scholar] [CrossRef] [Green Version]
- Gonzalez-Perez, J.; Villa-Collar, C.; Gonzalez-Meijome, J.M.; Porta, N.G.; Parafita, M.A. Long-term changes in corneal structure and tear inflammatory mediators after orthokeratology and LASIK. Investg. Ophthalmol. Vis. Sci. 2012, 53, 5301–5311. [Google Scholar] [CrossRef] [Green Version]
- Chao, C.; Golebiowski, B.; Zhao, X.; Chen, S.; Zhou, S.; Stapleton, F. Long-term effects of LASIK on corneal innervation and tear neuropeptides and the associations with dry eye. J. Refract. Surg. 2016, 32, 518–524. [Google Scholar] [CrossRef] [PubMed]
- Na, K.S.; Mok, J.W.; Kim, J.Y.; Rho, C.R.; Joo, C.K. Correlations between tear cytokines, chemokines, and soluble receptors and clinical severity of dry eye disease. Investg. Ophthalmol. Vis. Sci. 2012, 53, 5443–5450. [Google Scholar] [CrossRef] [Green Version]
- Ueta, M.; Nishigaki, H.; Sotozono, C.; Kinoshita, S. Downregulation of interferon-γ-induced protein 10 in the tears of patients with Stevens-Johnson syndrome with severe ocular complications in the chronic stage. BMJ Open Ophthalmol. 2017, 1, e000073. [Google Scholar] [CrossRef]
- Yoshikawa, Y.; Ueta, M.; Nishigaki, H.; Kinoshita, S.; Ikeda, T.; Sotozono, C. Predictive biomarkers for the progression of ocular complications in chronic Stevens-Johnson syndrome and toxic Eeidermal necrolysis. Sci. Rep. 2020, 10, 18922. [Google Scholar] [CrossRef]
- Gurumurthy, S.; Iyer, G.; Srinivasan, B.; Agarwal, S.; Angayarkanni, N. Ocular surface cytokine profile in chronic Stevens-Johnson syndrome and its response to mucous membrane grafting for lid margin keratinisation. Br. J. Ophthalmol. 2018, 102, 169–176. [Google Scholar] [CrossRef] [PubMed] [Green Version]
- Liu, G.; Zhang, W.; Xiao, Y.; Lu, P. Critical role of IP-10 on reducing experimental corneal neovascularization. Curr. Eye Res. 2015, 40, 891–901. [Google Scholar] [CrossRef]
- Nyland, J.F.; Fillion, M.; Barbosa, F., Jr.; Shirley, D.L.; Chine, C.; Lemire, M.; Mergler, D.; Silbergeld, E.K. Biomarkers of methylmercury exposure immunotoxicity among fish consumers in Amazonian Brazil. Environ. Health Perspect. 2011, 119, 1733–1738. [Google Scholar] [CrossRef] [Green Version]

| Patient N°/Age | Onset of Symptoms (Weeks after Exposure) | Osdi (Range 0–100; Normal <12) | Tear Osmolarity (Normal <308 Mosms/L) | Conjunctival Redness (0–4) | T-But (Normal ≥7 s) | Corneal/Conjunctival Staining (Range 0–5) | Schirmer Test (Normal >5 Mm)/Tear Lysozyme Level (Normal ≥1000 μM/mL) | Corneal Sensitivity Thresholds * Mechanical/Heat/Cold |
|---|---|---|---|---|---|---|---|---|
| 1/45 | 10 | 35.00 | 330 | 0 | 2 | 0/1 | 5/881 | 165/+2.16/−1.12 |
| 2/29 | 12 | 20.80 | 329 | 0 | 10 | 0/0 | 25/4934 | 100/+0.80/−0.80 |
| 3/49 | 1 | 52.00 | 323 | 0 | 2 | 1/1 | 22/1369 | 200/+0.80/−2.72 |
| 4/47 | 1 | 84.00 | 353 | 0 | 12 | 0/0 | 10/511 | 160/+2.16/−3.20 |
| 5/39 | 2 | 14.50 | 377 | 0 | 9 | 0/0 | 18/209 | 90/+1.60/−0.80 |
| 6/28 | 0 | 14.50 | 298 | 0 | 6 | 0/0 | 3/548 | 50/+1.60/−1.20 |
| 7/30 | 1 | 50.00 | 318 | 0 | 16 | 0/0 | 6/1000 | 85/+4.00/−4.00 |
| 8/37 | 1 | 58.30 | 330 | 0 | 9 | 1/1 | 4/593 | 190/+1.60/−2.40 |
| 9/50 | 2 | 50.00 | 330 | 1 | 7 | 0/0 | 11/654 | 172/+2.80/−3.52 |
| 10/44 | 2 | 22.90 | 316 | 0 | 16 | 0/0 | 25/1415 | 190/+2.16/−1.44 |
| 11/42 | 2 | 29.10 | 338 | 0 | 12 | 0/0 | 6/629 | Not performed |
| 12/52 | 0 | 27.00 | 400 | 0 | 14 | 0/0 | 15/1186 | 200/+3.20/−3.52 |
| 13/51 | 3 | 65.90 | 323 | 2 | 3 | 1/1 | 1/391 | 200/+0.32/−3.20 |
| 14/36 | 4 | 70.40 | 332 | 0 | 11 | 0/0 | 13/153 | 120/+3.20/−1.20 |
| 15/45 | 1 | 50.00 | 356 | 0 | 10 | 0/0 | 8/316 | 200/+4.00/−4.00 |
| 16/36 | 2 | 35.00 | 330 | 0 | 2 | 0/1 | 5/881 | 100/+2.80/−2.20 |
| 17/47 | 1 | 75.00 | 338 | 0 | 8 | 2/1 | 13/1000 | 142/+2.80/−4.00 |
| 18/38 | 4 | 12.00 | 297 | 0 | 9 | 0/0 | 7/588 | 200/+3.60/−3.20 |
| 19/40 | 3 | 27.00 | 400 | 0 | 14 | 0/0 | 15/1186 | 175/+1.20/−2.80 |
| 20/42 | 1 | 45.00 | 349 | 0 | 12 | 0/0 | 6/1849 | 200/+2.64/−4.00 |
| 21/56 | 2 | 75.00 | 342 | 0 | 12 | 1/1 | 5/760 | 130/+1.92/−0.56 |
| 22/41 | 1 | 64.50 | 288 | 2 | 14 | 1/1 | 10/316 | 35/+4.00/−4.00 |
| Mean (SD) | 2.54 (2.95) | 44.5 (22.04) | 336.23 (28.71) | 9.55 (4.39) | 10.59 (6.97)/970.90 (984.02) | 147.81 (53.36)/ +2.35 (+1.10)/ −2.57 (−1.24) | ||
| Median [IQR] | 0 [0] | 0 [0.75]/0 [1] |
| Study Group (n = 21) | Control Group (n = 22) | ||||||
|---|---|---|---|---|---|---|---|
| Sensitivity Threshold | Mean (SD) | 95% CI | Mean (SD) | 95% CI | p Value | ||
| Inferior | Superior | Inferior | Superior | ||||
| Mechanical (mL/min) | 147.81(53.36) | 123.52 | 172.10 | 69.64 (43.07) | 49.49 | 89.80 | 0.0001 |
| Thermal hot (°C) | +2.35 (+1.10) | +1.85 | +2.85 | +1.3 (+0.89) | +0.89 | +1.72 | 0.0018 |
| Thermal cold (°C) | −2.57 (−1.24) | −3.13 | −2.00 | −1.83 (−1.32) | −2.45 | −1.22 | 0.0470 |
| Nerve Parameters | ||||||
|---|---|---|---|---|---|---|
| Patient No./Age * (years) | Density (n/mm2) | Length (mm/mm2) | Tortuosity (0–4) | Density of Branching (n/mm2) | Dendritic Cell Density (n/mm2) | Reflectivity (Gray Units) |
| 1/45 | 9.0 | 10.90 | 3.0 | 6.5 | 3.5 | 99.70 |
| 2/29 | 8.0 | 13.77 | 3.0 | 3.0 | 0.5 | 76.29 |
| 3/49 | 4.0 | 19.91 | 3.0 | 0.5 | 0.0 | 92.00 |
| 4/47 | 7.0 | 16.05 | 2.0 | 0.0 | 14.0 | 83.97 |
| 5/39 | 4.0 | 11.39 | 1.5 | 0.0 | 3.0 | 98.97 |
| 6/28 | 8.0 | 11.99 | 2.0 | 0.5 | 2.0 | 88.22 |
| 9/50 | 4.5 | 9.06 | 2.0 | 0.0 | 12.0 | 79.30 |
| 10/44 | 3.5 | 20.51 | 2.0 | 1.0 | 28.5 | 99.50 |
| 11/42 | 6.0 | 11.79 | 1.0 | 0.0 | 0.0 | 93.66 |
| 12/52 | 5.0 | 19.45 | 3.0 | 1.0 | 4.5 | 83.42 |
| 14/36 | 2.0 | 26.15 | 3.0 | 0.0 | 5.0 | 101.23 |
| 17/47 | 4.0 | 17.78 | 2.0 | 1.0 | 15.5 | 118.75 |
| 18/38 | 13.0 | 16.04 | 3.0 | 5.5 | 23.0 | 104.56 |
| 19/40 | 8.5 | 16.81 | 2.0 | 6.5 | 16.5 | 79.02 |
| 21/56 | 9.5 | 16.89 | 2.0 | 4.5 | 8.50 | 97.72 |
| Mean (SD) | 6.4 (2.9) | 15.90 (4.54) | 2 (2.5) | 9.1 (8.9) | 93.09 (11.56) | |
| Median [IQR] | 2.0 [1.0] | |||||
| Study Group Mean (SD) or Median [IQR] | Control Group Mean (SD) or Median [IQR] | p Value | |
|---|---|---|---|
| Nerve density (n/mm2) | 6.4 (2.9) | 10.5 (3.3) [15] | 0.0006 |
| Nerve length (mm/mm2) | 15.90 (4.54) | 14.50 (2.90) [17] | 0.2151 |
| Density of nerve branching (n/mm2) | 2.0 (2.5) | 52.4 (26.2) [15] | <0.0001 |
| Grade of nerve tortuosity (0–4) | 2.0 [1.0] | 1.9 (0.8) [14] | 0.1201 |
| Density of dendritic cells (n/mm2) | 9.1 (8.8) | 57.5 (70.2) [15] | 0.0063 |
| Reflectivity (Gray units) | 93.09 (11.56) | 87.16 (13.10) [14] | 0.1731 |
| Tear Cytokine | Study Group | Control Group | p Value * | ||||
|---|---|---|---|---|---|---|---|
| Detection | Concentration pg/mL | Detection | Concentration pg/mL | ||||
| n | % [95%CI] | mean [95%CI] | n | % [95%CI] | mean [95%CI] | ||
| IL-1β | 11 | 50.0 [30.72; 69.28] | 18.36 [9.32; 36.16] | 10 | 45.5 [25.07; 67.33] | 14.52 [7.07; 29.82] | 0.6247 |
| IL-1RA | 19 | 86.4 [64.04; 96.41] | 1559.04 [612.89; 3965.78] | 12 | 57.1 [34.44; 77.41] | 1031.97[457.15; 2329.54] | 0.4923 |
| IL-2 | 14 | 63.6 [40.83; 81.97] | 38.83 [20.81; 72.44] | 6 | 40 [17.46; 67.11] | 17.45 [10.53; 28.93] | 0.0761 |
| IL-4 | 13 | 59.1 [36.68; 78.52] | nc | 6 | 28.6 [12.19; 52.31] | nc | - |
| IL-5 | 10 | 45.5 [25.07; 67.33] | 16.75 [7.10; 39.49] | 9 | 40.9 [21.48; 63.32] | 6.36 [2.94; 13.62] | 0.0878 |
| IL-6 | 19 | 86.4 [64.04; 96.41] | 93.53 [56.92; 153.68] | 22 | 100 [81.50; 100] | 23.82 [9.4; 60.34] | 0.011 |
| IL-8/CXCL8 | 18 | 81.8 [58.99; 94.01] | 62.53 [29.73; 131.53] | 11 | 50 [30.72; 69.28] | 23.64 [9.99; 55.88] | 0.0856 |
| IL-9 | 15 | 68.2 [45.12; 85.27] | 32.81 [17.58; 61.24] | 9 | 60 [32.89; 82.54] | 49.00 [27.12; 88.54] | 0.4011 |
| IL-10 | 7 | 31.8 [14.73; 54.88] | nc | 2 | 22.2 [3.95; 59.81] | nc | - |
| IL-12p70 | 10 | 45.5 [25.07; 54.88] | 329.58 [204.46; 531.28] | 15 | 68.2 [45.12; 85.27] | 63.31 [23.70; 169.13] | 0.0045 |
| IL-13 | 19 | 86.4 [64.04; 96.41] | 131.22 [74.39; 231.45] | 21 | 95.5 [75.12; 99.76] | 152.63 [80.37; 289.86] | 0.7154 |
| IL-17A | 10 | 45.5 [25.07; 67.33] | 56.04 [31. 9; 98.48] | 4 | 80 [29.88; 98.95] | 35.86 [19.36; 66.43] | 0.4916 |
| IP-10/CXCL10 | 21 | 95.5 [75.12; 99.76] | 6806.46 [3124.56; 14,826.99] | 21 | 100 [80.76; 100] | 22,900.94 [16,099.67; 32,575.40] | 0.0063 |
| MCP-1/CCL2 | 18 | 81.8 [58.99; 94.01] | 427.52[219.29; 833.51] | 10 | 90.9 [57.12; 99.52] | 329.39 [201.37; 538.80] | 0.6151 |
| MIP-1αCCL3 | 4 | 18.2 [5.99; 41.01] | nc | 0 | 0 [0.00; 34.45] | nc | - |
| RANTES CCL5 | 13 | 59.1 [36.68; 78.52] | 354.00 [192.08; 652.42] | 17 | 81 [57.42; 93.71] | 61.14 [30.51; 122.50] | 0.0003 |
| Eotaxin/CCL11 | 7 | 31.8 [14.73; 54.88] | n/c | 2 | 18.2 [3.21; 52.25] | nc | - |
| Fractalkine/ CX3CL1 | 14 | 63.6 [40.83; 81.97 | 1621.12 [838.99; 3132.34] | 14 | 87.5 [60.41; 97.80] | 1094.22 [593.23; 2018.30] | 0.4125 |
| IFN-γ | 13 | 59.1 [36.68; 78.52] | 50.69 [19.26; 133.37] | 11 | 52.4 [30.34; 73.61] | 15.25 [7.13; 32.62] | 0.0521 |
| MMP-9 | 18 | 81.8 [58.99; 94.01] | 524.80 [205.12; 1342.73] | 12 | 92.3 [62.09; 99.60] | 313.56 [92.99; 1057.38] | 0.5378 |
| TNF-α | 14 | 63.6 [40.83; 81.97] | 24.97 [12.55; 49.68] | 11 | 50.0 [30.72; 69.28] | 11.61[5.80; 23.23] | 0.1103 |
| EGF | 17 | 77.3 [54.18; 91.31] | 445.69 [177.01; 1122.21]) | 22 | 100 [81.50; 100] | 1333.78 [852.56; 2086.60] | 0.0339 |
| VEGF | 19 | 86.4 [64.04; 96.41] | 4733.30 [3406.12; 6577.61] | 10 | 66.7 [38.69; 87.01] | 983.05 [573.75; 1684.33] | <0.0001 |
| Tear Molecule | Concentration (pg/mL) Mean (Standard Deviation)/Median [Interquartile Range] | Fold Change (Log2) | Adjusted p Value | |
|---|---|---|---|---|
| Cluster 1 | Cluster 2 | |||
| IL-1β | 12.47 (9.89)/9.94 [11.80] | 108.82 (73)/109.45 [73.58] | 3.02 | 0.0009 |
| IL-1RA | 17918.94 (42897.86)/1120.00 [5331.25] | 3075.62 (2899.16)/1455.00 [3310.00] | 0.70 | 0.6152 |
| IL-2 | 22.39 (18.04)/17.99 [22.57] | 197.18 (92.58)/182.00 [43.25] | 3.48 | <0.0001 |
| IL-4 | 217.01 (191.75)/149.35 [204.63] | 1129 (774.36)/1138.50 [1009.25] | 2.57 | 0.0003 |
| IL-5 | 8.95 (8.66)/6.14 [10.52] | 175.86 (125.80)/169.00 [141.93] | 4.67 | <0.0001 |
| IL-6 | 69.05 (51.35)/61.4 [85.19] | 305.62 (156.63)/314.50 [124.50] | 2.44 | 0.0001 |
| IL-8/CXCL8 | 289.27 (883.19)/33.35 [72.04] | 192.36 (113.63)/158.00 [162.90] | 2.21 | 0.0144 |
| IL-9 | 19.9 (15.13)/16.71 [23.90] | 169.93 (107.48)/156.00 [33.68] | 3.34 | <0.0001 |
| IL-10 | 61.22 (44.61)/53.41 [67.89] | 509.64 (415.36)/535.00 [423.75] | 2.62 | 0.0078 |
| IL-12p70 | 195.14 (101.51)/188.51 [172.44] | 1163.38 (456.5)/1065.00 [491.75] | 2.72 | <0.0001 |
| IL-13 | 91.64 (65.76)/88.70 [91.02] | 511.62 (256.37)/466.50 [177.75] | 2.84 | 0.0001 |
| IL-17A | 32.19 (20.14)/29.02 [31.45] | 250.71 (118.73)/260.50 [93.50] | 3.13 | <0.0001 |
| IP-10/CXCL10 | 21,081.29 (33,089.71)/10,660.00 [19,848.25] | 13,318.75 (5612.46)/12,800.00 [6342.50] | 1.33 | 0.1529 |
| MCP-1/CCL2 | 578.88 (1088.12)/237.50 [397.44] | 1931.38 (1509.72)/2065.00 [2257.75] | 2.50 | 0.0083 |
| RANTES/CCL5 | 224.68 (214.75)/145.24 [118.81] | 1652.62 (613.31)/1625.00 [382.50] | 3.37 | <0.0001 |
| Eotaxin/CCL11 | 35.72 (54.9)/19.54 [27.23] | 218.59 (263.31)/142.70 [212.31] | 2.38 | 0.0284 |
| Fractalkine/CX3CL1 | 1596.81 (3124.23)/643.47 [555.99] | 7427.5 (1900.32)/7595.00 [1407.50] | 3.38 | 0.0001 |
| IFN-γ | 27.2 (34.91)/15.86 [17.22] | 650.12 (352.83)/662.50 [316.25] | 5.44 | <0.0001 |
| MMP-9 | 11,773.76 (40,665.8)/289.00 [1937.85] | 1233.25 (902.46)/837.50 [1375.75] | 1.42 | 0.2081 |
| TNF-α | 14.18 (11.59)/10.67 [15.54] | 154.51 (97.55)/138.50 [48.38] | 3.79 | <0.0001 |
| EGF | 2982.49 (8168.04)/145.50 [2205.38] | 1728.88 (1192.08)/1895.00 [2116.25] | 2.29 | 0.0981 |
| VEGF | 3644.16 (1891.64)/3585.00 [2770.00] | 10,180 (3691.33)/10,200.00 [3345.00] | 1.60 | 0.0002 |
| Test | Cluster 1 | Cluster 2 | p Value |
|---|---|---|---|
| OSDI questionnaire (0–100) mean (SD) | 38.09 (20.19) | 55.58 (21.89) | 0.0723 |
| Tear osmolarity (mOsms/L) mean (SD) | 338.64 (31.03) | 332 (25.56) | 0.6137 |
| Conjunctival redness (0–4) median [IQR] | 0 [0] | 0 [0.5] | 0.2295 |
| T-BUT (seconds) mean (SD) | 10.57 (3.98) | 7.75 (4.77) | 0.1517 |
| Ocular surface integrity (0–5) median Corneal staining Conjunctival staining | 0 [0] 0 [0] | 0.5 [1.0] 1.0 [1.0] | 0.1246 0.0656 |
| Tear production mean (SD) Schirmer test (mm/5 min) Lysozyme tear level (μg/mL) | 10.71 (7.14) 1209.79 (1143.54) | 10.38 (7.15) 552.88 (403.12) | 0.8372 0.0189 |
| Corneal sensitivity thresholds mean (SD) Mechanical (mL/min) Thermal hot (°C) Thermal cold (°C) | 149.54 (51.94) +2.58 (+1.01) −2.71 (−1.31) | 145 (59.10) +1.98 (+1.20) −2.33 (−1.17) | 0.8555 0.2342 0.4008 |
| Corneal imaging in vivo confocal microscopy Nerve density (n/mm2) mean (SD) Nerve length (mm/mm2) mean (SD) Nerve branching density (n/mm2) mean (SD) Nerve tortuosity (0–4) median [IQR)]Dendritic cell density (n/mm2) mean (SD) Reflectivity (Gray units) mean (SD) | 7.0 (2.9) 15.41 (3.65) 2.3 (2.4) 2.2 [0.6] 11.10 (9.79) 92.05 (13.46) | 5.2 (2.8) 16.88 (6.35) 0.1 (0.3) 2.5 [0.7] 2.88 (2.1) 95.17 (7.20) | 0.2786 0.5728 0.0417 0.5034 0.0291 0.6391 |
| Maximum mercury levels * mean (SD) Blood (μg/L) Urine (μg/g creatinine) | 398.57 (273.61) 121.64 (121.65) | 359.75 (314.61) 384.75 (396.88) | 0.7647 0.0373 |
Publisher’s Note: MDPI stays neutral with regard to jurisdictional claims in published maps and institutional affiliations. |
© 2021 by the authors. Licensee MDPI, Basel, Switzerland. This article is an open access article distributed under the terms and conditions of the Creative Commons Attribution (CC BY) license (https://creativecommons.org/licenses/by/4.0/).
Share and Cite
Cañadas, P.; Lantigua, Y.; Enríquez-de-Salamanca, A.; Fernandez, I.; Pastor-Idoate, S.; Sobas, E.M.; Dueñas-Laita, A.; Pérez-Castrillón, J.L.; Pastor Jimeno, J.C.; Calonge, M. Ocular Surface Pathology in Patients Suffering from Mercury Intoxication. Diagnostics 2021, 11, 1326. https://doi.org/10.3390/diagnostics11081326
Cañadas P, Lantigua Y, Enríquez-de-Salamanca A, Fernandez I, Pastor-Idoate S, Sobas EM, Dueñas-Laita A, Pérez-Castrillón JL, Pastor Jimeno JC, Calonge M. Ocular Surface Pathology in Patients Suffering from Mercury Intoxication. Diagnostics. 2021; 11(8):1326. https://doi.org/10.3390/diagnostics11081326
Chicago/Turabian StyleCañadas, Pilar, Yrbani Lantigua, Amalia Enríquez-de-Salamanca, Itziar Fernandez, Salvador Pastor-Idoate, Eva M. Sobas, Antonio Dueñas-Laita, José Luis Pérez-Castrillón, Jose C. Pastor Jimeno, and Margarita Calonge. 2021. "Ocular Surface Pathology in Patients Suffering from Mercury Intoxication" Diagnostics 11, no. 8: 1326. https://doi.org/10.3390/diagnostics11081326
APA StyleCañadas, P., Lantigua, Y., Enríquez-de-Salamanca, A., Fernandez, I., Pastor-Idoate, S., Sobas, E. M., Dueñas-Laita, A., Pérez-Castrillón, J. L., Pastor Jimeno, J. C., & Calonge, M. (2021). Ocular Surface Pathology in Patients Suffering from Mercury Intoxication. Diagnostics, 11(8), 1326. https://doi.org/10.3390/diagnostics11081326