
A Combination of Amide Proton Transfer, Tumor Blood Flow, and Apparent Diffusion Coefficient Histogram Analysis Is Useful for Differentiating Malignant from Benign Intracranial Tumors in Young Patients: A Preliminary Study

 , , , , ,
Abstract
:1. Introduction
2. Materials and Methods
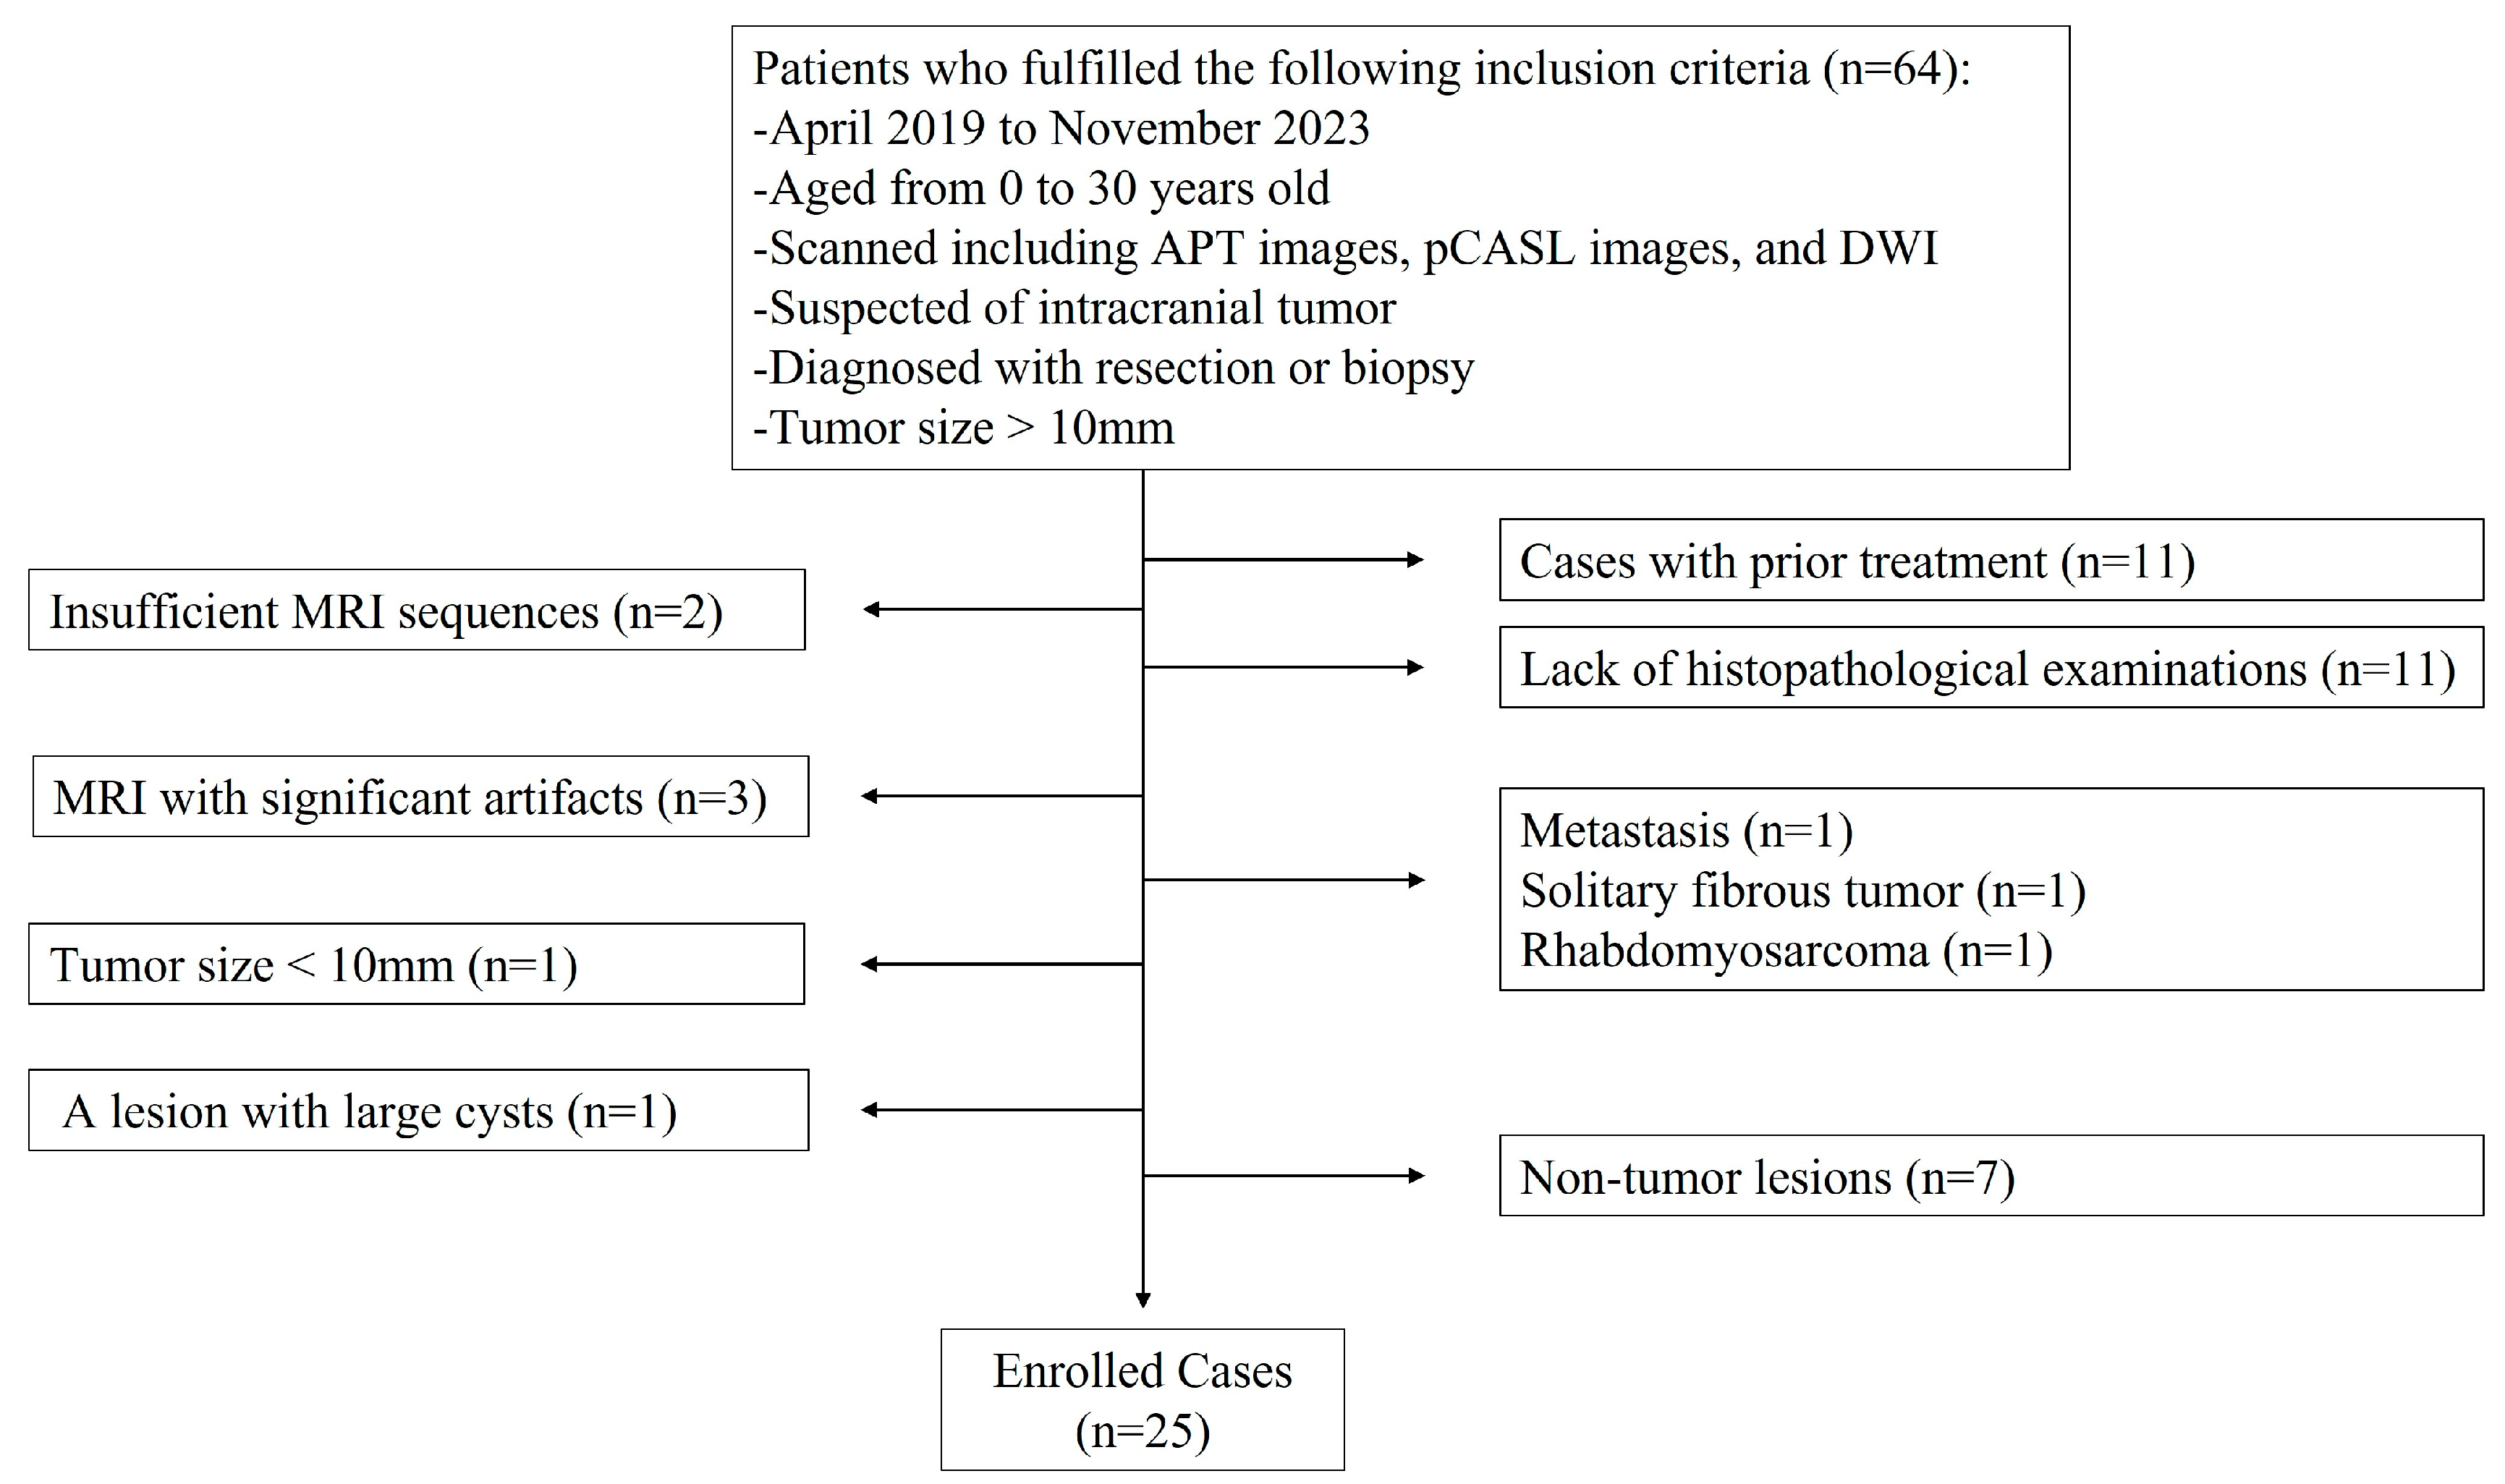
2.1. Subjects
2.2. MRI Protocol
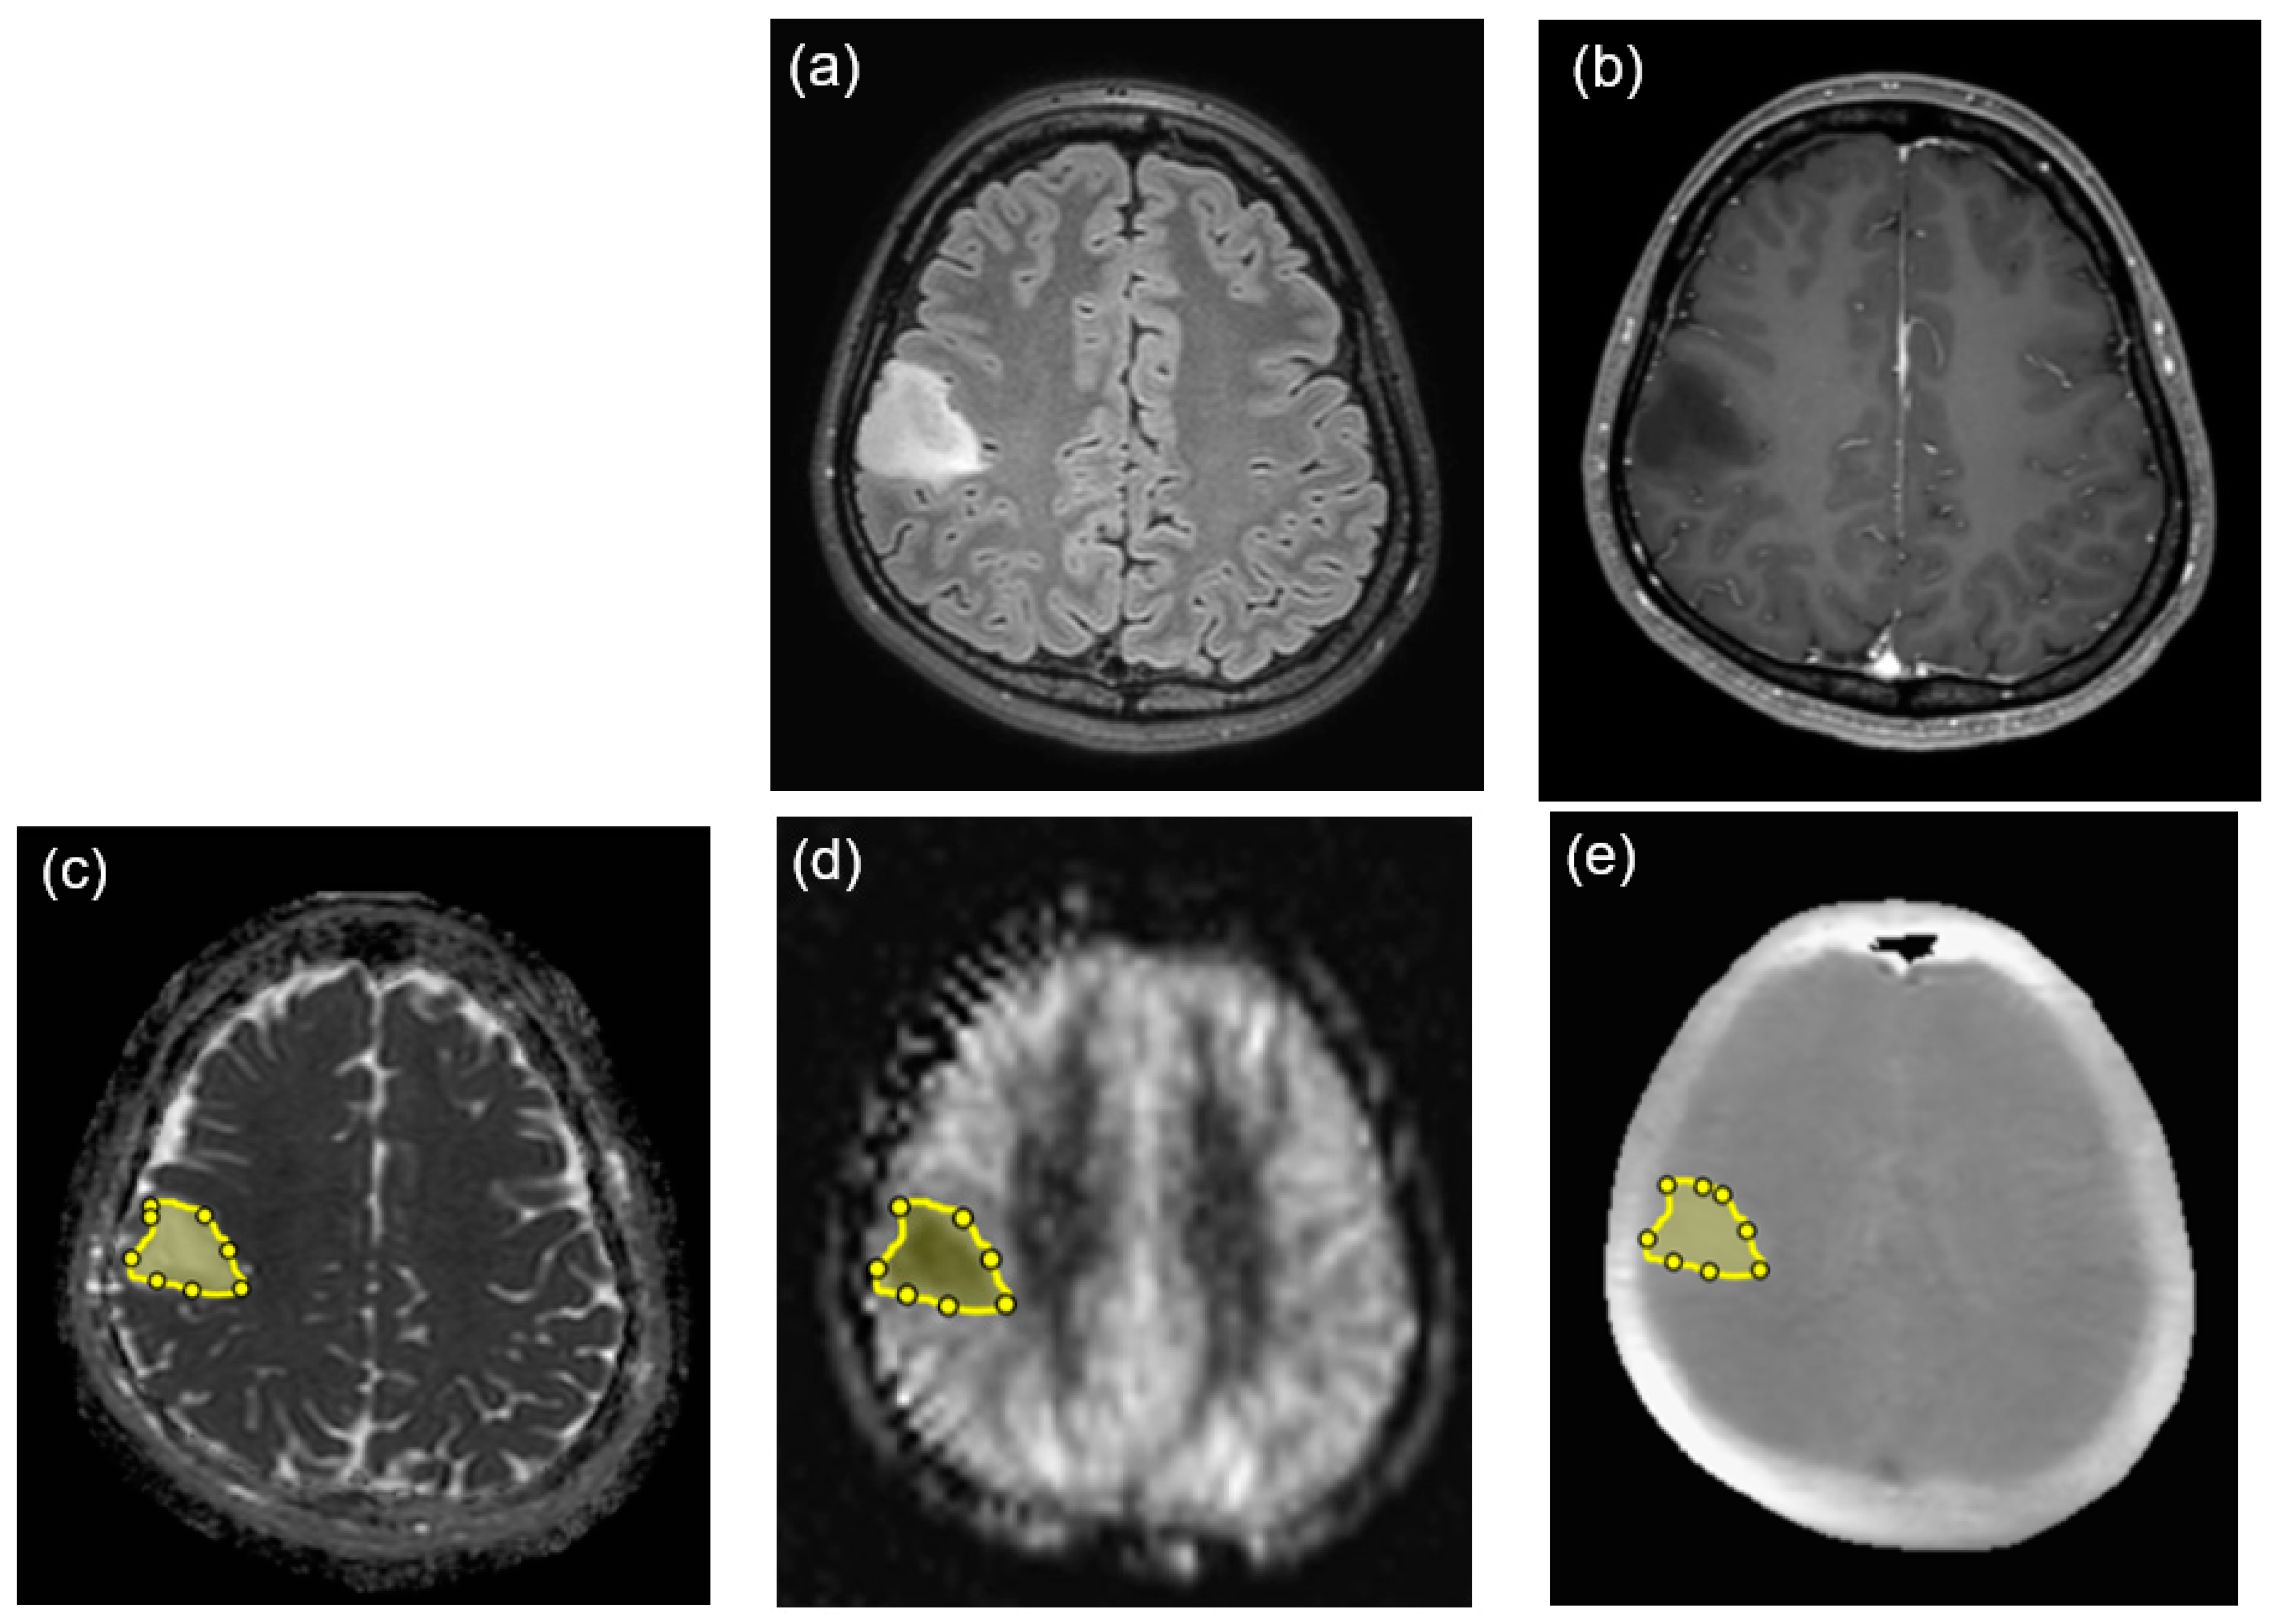
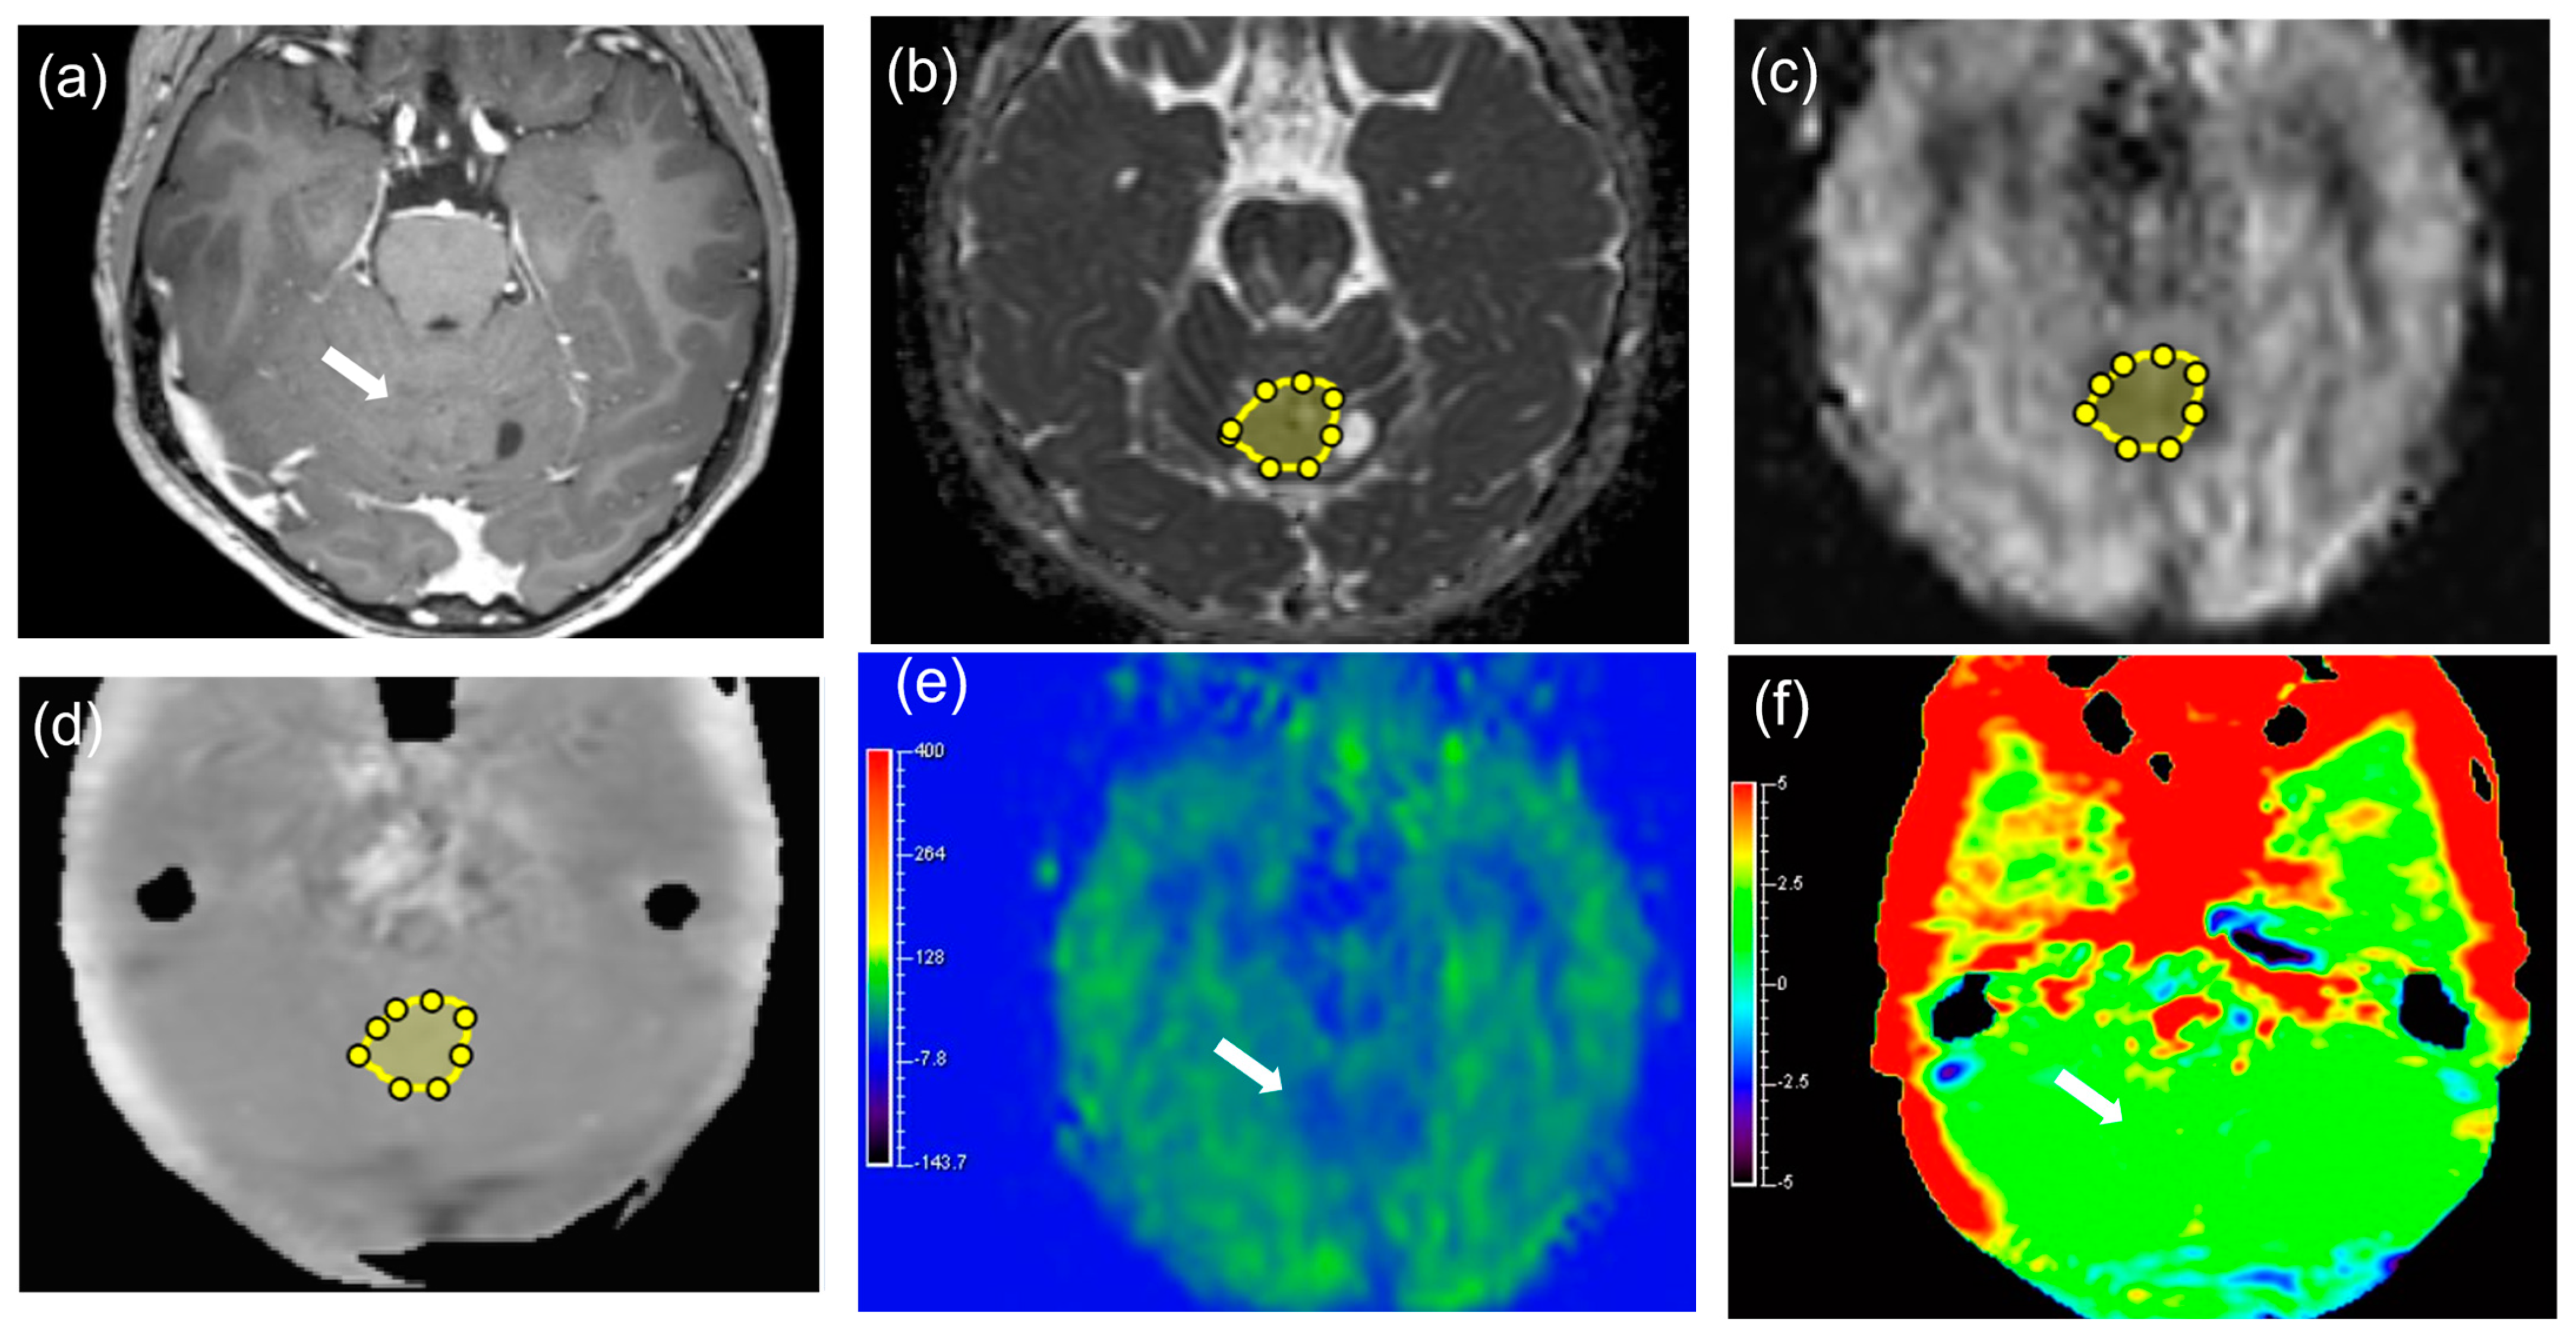
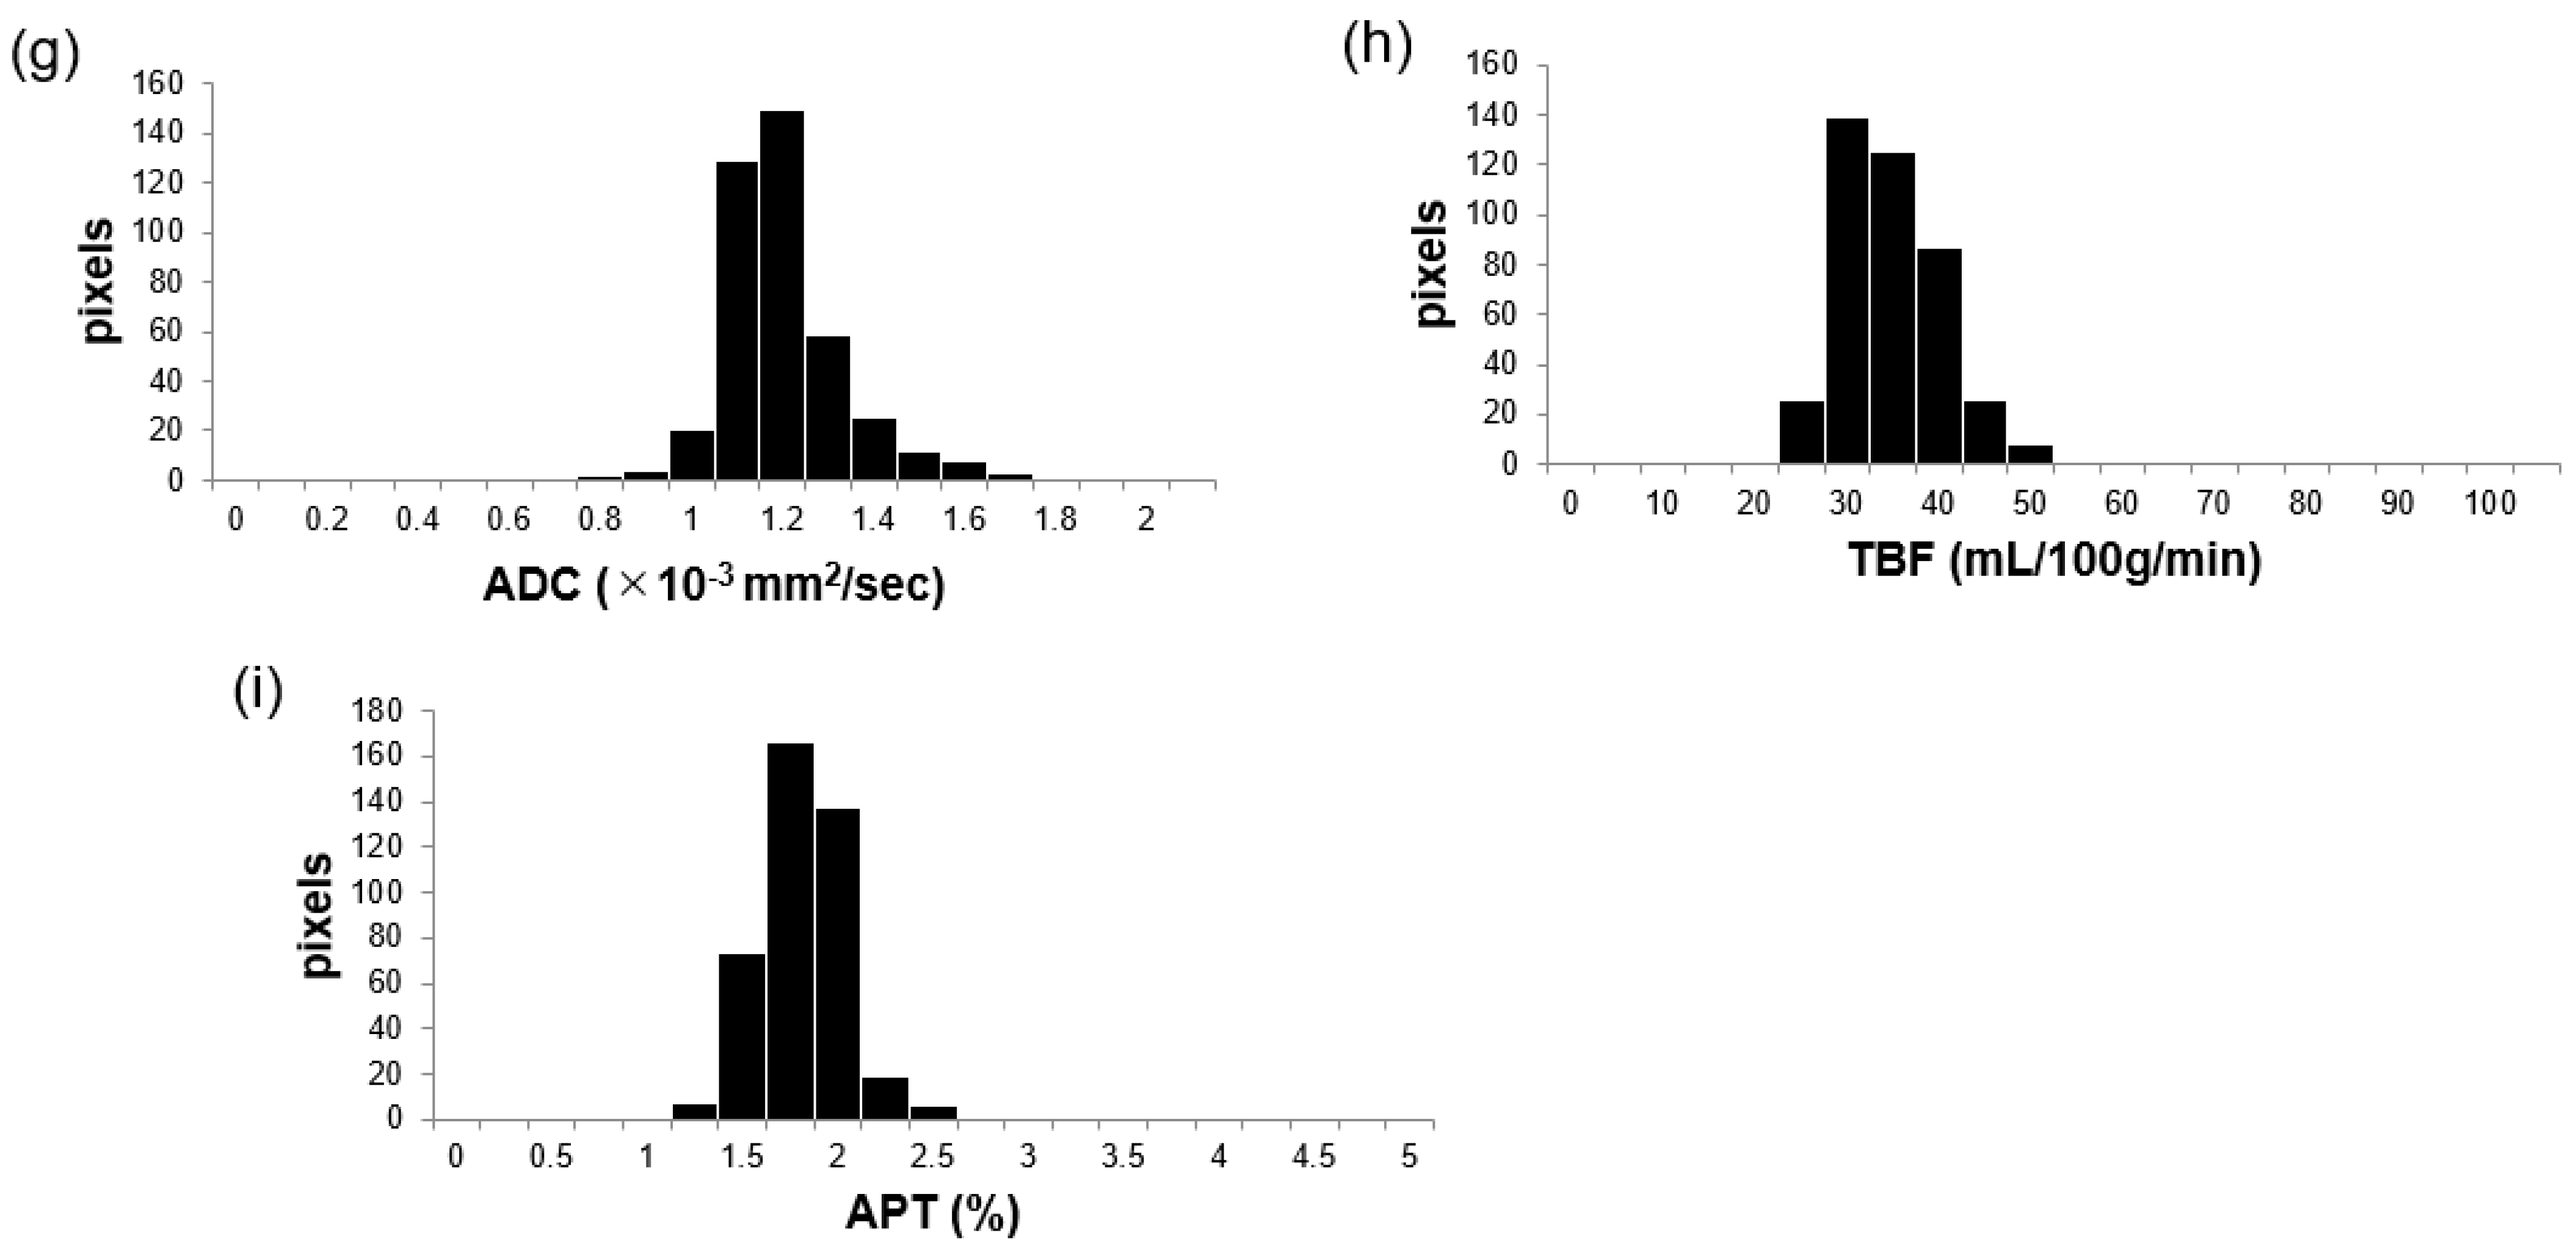
2.3. Image Analysis
2.4. Statistical Analysis
3. Results
3.1. Patients
3.2. Interobserver Agreement
3.3. Comparisons of APT, TBF, and ADC Parameters between MTs and BTs
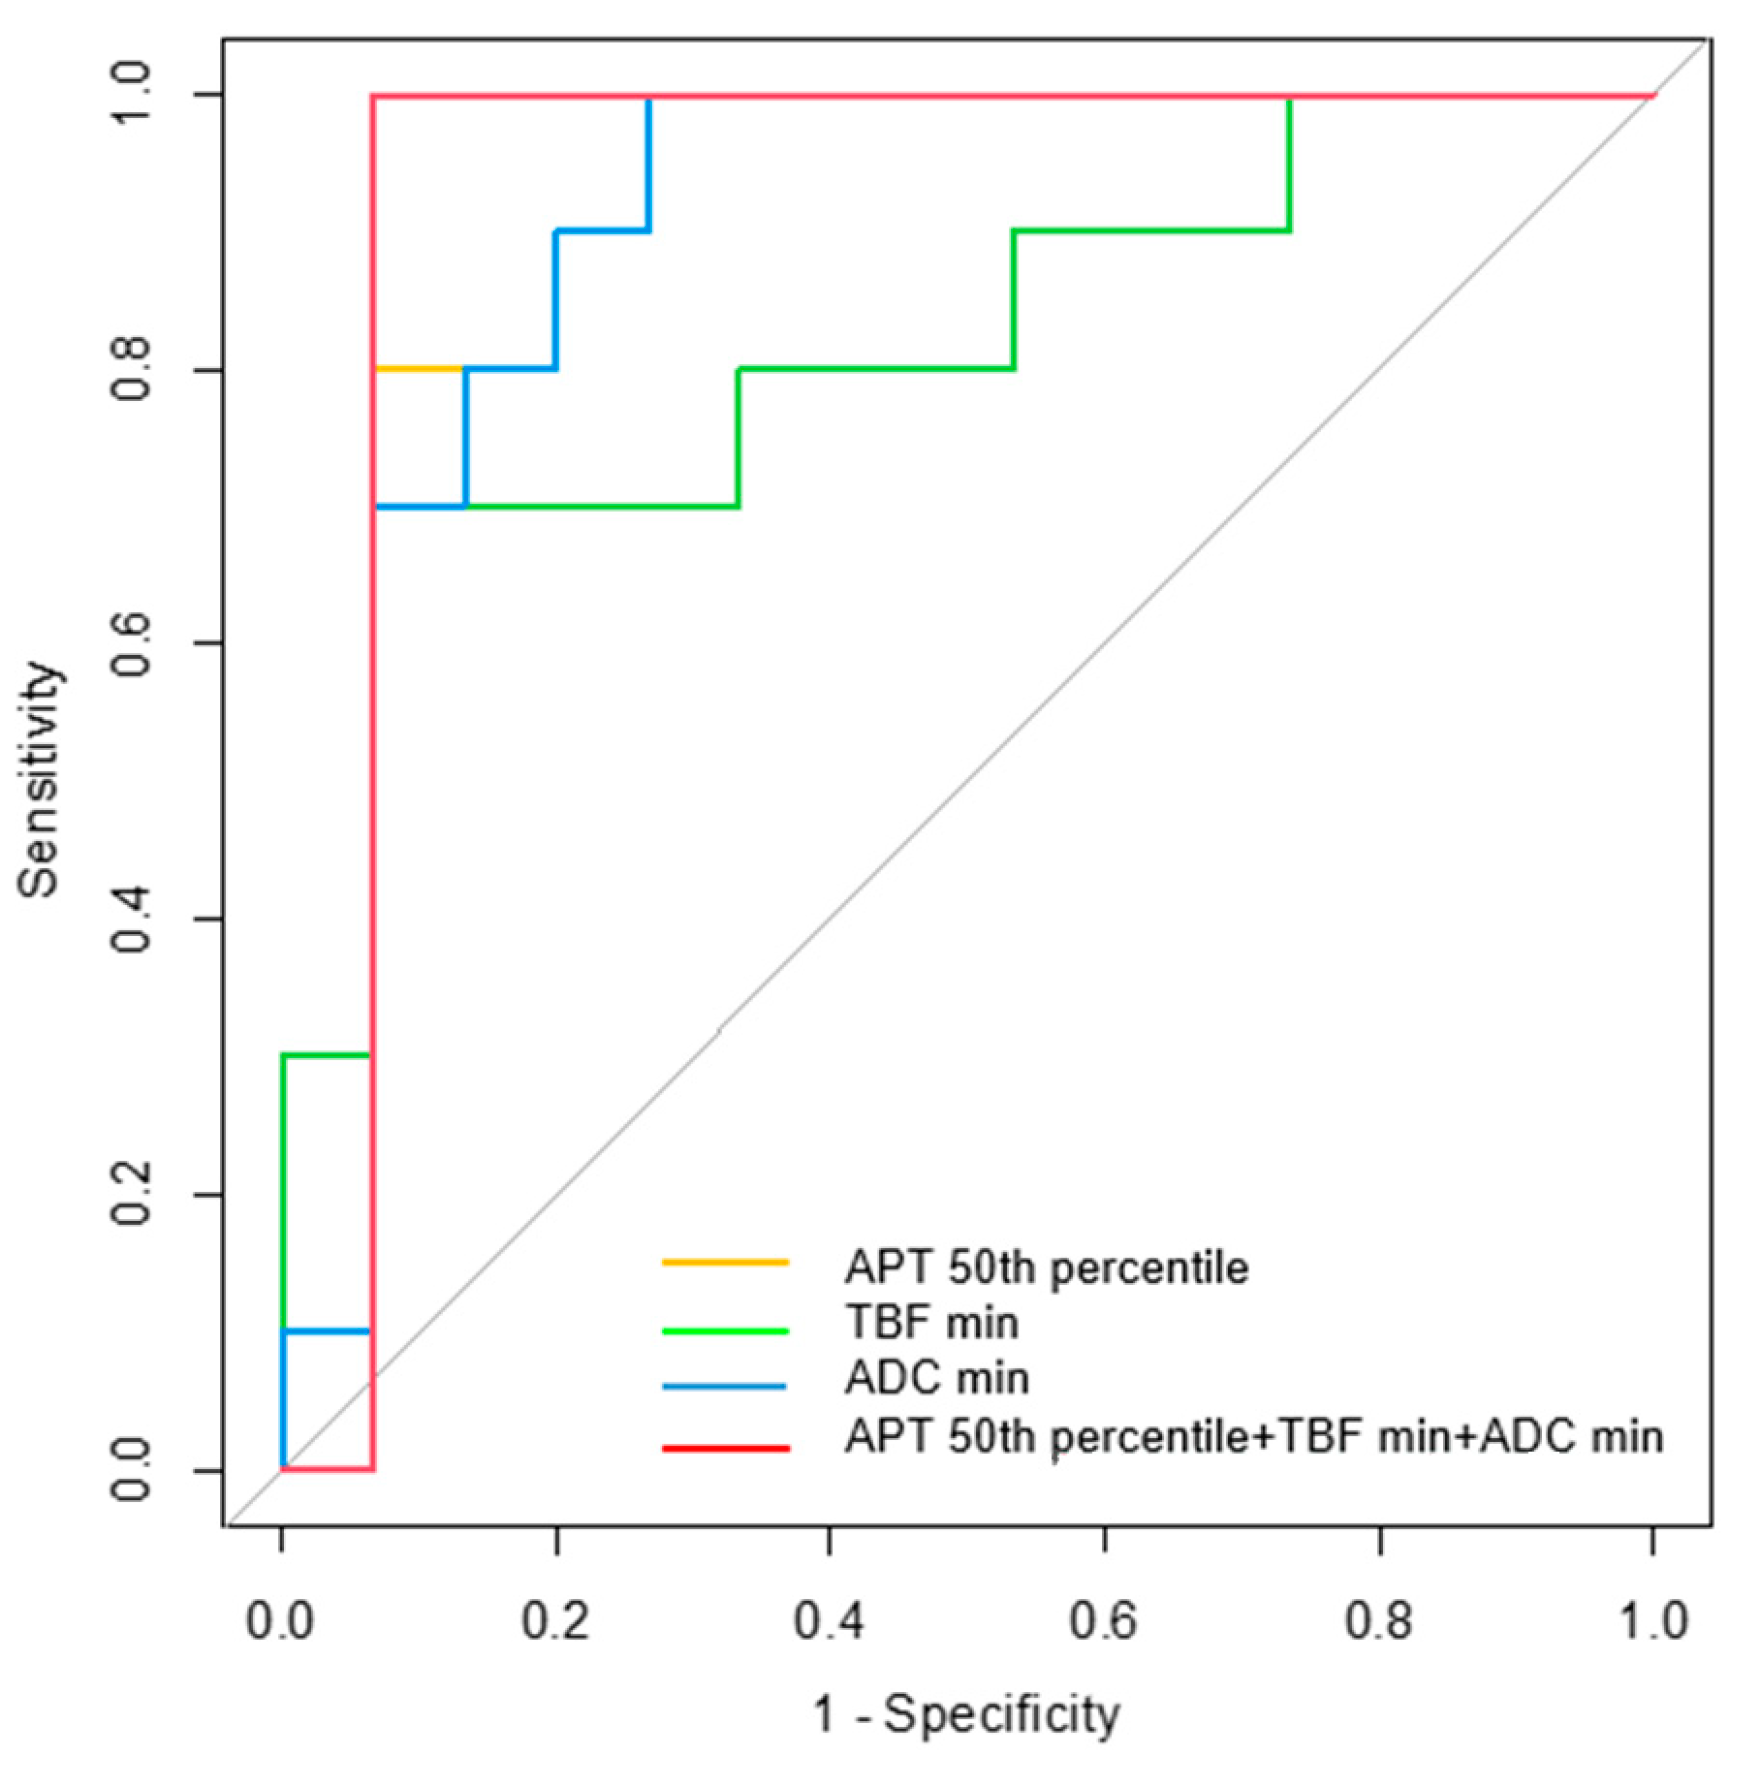
3.4. Diagnostic Performance for Differentiating MTs from BTs
4. Discussion
5. Conclusions
Supplementary Materials
Author Contributions
Funding
Institutional Review Board Statement
Informed Consent Statement
Data Availability Statement
Acknowledgments
Conflicts of Interest
References
- Epelman, S. The adolescent and young adult with cancer: State of the art—Brain tumor. Curr. Oncol. Rep. 2013, 15, 308–316. [Google Scholar] [CrossRef] [PubMed]
- Poussaint, T.Y.; Panigrahy, A.; Huisman, T.A. Pediatric brain tumors. Pediatr. Radiol. 2015, 45, S443–S453. [Google Scholar] [CrossRef] [PubMed]
- Udaka, Y.T.; Packer, R.J. Pediatric brain tumors. Neurol. Clin. 2018, 36, 533–556. [Google Scholar] [CrossRef] [PubMed]
- Zapotocky, M.; Ramaswamy, V.; Lassaletta, A.; Bouffet, E. Adolescents and young adults with brain tumors in the context of molecular advances in neuro-oncology. Pediatr. Blood Cancer 2018, 65, e26861. [Google Scholar] [CrossRef]
- Miller, K.D.; Ostrom, Q.T.; Kruchko, C.; Patil, N.; Tihan, T.; Cioffi, G.; Fuchs, H.E.; Waite, K.A.; Jemal, A.; Siegel, R.L.; et al. Brain and other central nervous system tumor statistics, 2021. CA Cancer J. Clin. 2021, 71, 381–406. [Google Scholar] [CrossRef] [PubMed]
- Thorbinson, C.; Kilday, J.P. Childhood malignant brain tumors: Balancing the bench and bedside. Cancers 2021, 13, 6099. [Google Scholar] [CrossRef] [PubMed]
- Green, S.; Vuong, V.D.; Khanna, P.C.; Crawford, J.R. Characterization of pediatric brain tumors using pre-diagnostic neuroimaging. Front. Oncol. 2022, 12, 977814. [Google Scholar] [CrossRef] [PubMed]
- Zumel-Marne, A.; Kundi, M.; Castano-Vinyals, G.; Alguacil, J.; Petridou, E.T.; Georgakis, M.K.; Morales-Suárez-Varela, M.; Sadetzki, S.; Piro, S.; Nagrani, R.; et al. Clinical presentation of young people (10–24 years old) with brain tumors: Results from the international MOBI-Kids study. J. Neurooncol. 2020, 147, 427–440. [Google Scholar] [CrossRef] [PubMed]
- Gonçalves, F.G.; Zandifar, A.; Kim, J.D.U.; Tierradentro-García, L.O.; Ghosh, A.; Khrichenko, D.; Andronikou, S.; Vossough, A. Application of apparent diffusion coefficient histogram metrics for differentiation of pediatric posterior fossa tumors: A Large Retrospective Study and Brief Review of Literature. Clin. Neuroradiol. 2022, 32, 1097–1108. [Google Scholar] [CrossRef] [PubMed]
- Louis, D.N.; Perry, A.; Wesseling, P.; Brat, D.J.; Cree, I.A.; Figarella-Branger, D.; Hawkins, C.; Ng, H.K.; Pfister, S.M.; Reifenberger, G.; et al. The 2021 WHO classification of tumors of the central nervous system: A summary. Neuro Oncol. 2021, 23, 1231–1251. [Google Scholar] [CrossRef]
- Koob, M.; Girard, N.; Ghattas, B.; Fellah, S.; Confort-Gouny, S.; Figarella-Branger, D.; Scavarda, D. The diagnostic accuracy of multiparametric MRI to determine pediatric brain tumor grades and types. J. Neurooncol. 2016, 127, 345–353. [Google Scholar] [CrossRef] [PubMed]
- Tanaka, F.; Umino, M.; Maeda, M.; Nakayama, R.; Inoue, K.; Kogue, R.; Obara, M.; Sakuma, H. Tumor blood flow and apparent diffusion coefficient histogram analysis for differentiating malignant salivary tumors from pleomorphic adenomas and Warthin’s tumors. Sci. Rep. 2022, 12, 5947. [Google Scholar] [CrossRef] [PubMed]
- Tanaka, F.; Umino, M.; Maeda, M.; Nakayama, R.; Inoue, K.; Kogue, R.; Obara, M.; Sakuma, H. Pseudocontinuous arterial spin labeling: Clinical applications and usefulness in head and Neck Entities. Cancers 2022, 14, 3872. [Google Scholar] [CrossRef] [PubMed]
- Zhang, H.; Zhang, H.; Zhang, Y.; Zhou, B.; Wu, L.; Yang, W.; Lei, Y.; Huang, B. Multiparametric MRI-based fusion radiomics for predicting telomerase reverse transcriptase (TERT) promoter mutations and progression-free survival in glioblastoma: A multicentre study. Neuroradiology 2024, 66, 81–92. [Google Scholar] [CrossRef] [PubMed]
- Kang, Y.; Choi, S.H.; Kim, Y.J.; Kim, K.G.; Sohn, C.-H.; Kim, J.-H.; Yun, T.J.; Chang, K.-H. Gliomas: Histogram analysis of apparent diffusion coefficient maps with standard- or high-b-value diffusion-weighted MR imaging—Correlation with tumor grade. Radiology 2011, 261, 882–890. [Google Scholar] [CrossRef] [PubMed]
- She, D.; Lin, S.; Guo, W.; Zhang, Y.; Zhang, Z.; Cao, D. Grading of pediatric intracranial tumors: Are Intravoxel Incoherent Motion and Diffusional Kurtosis Imaging Superior to Conventional DWI? AJNR Am. J. Neuroradiol. 2021, 42, 2046–2053. [Google Scholar] [CrossRef] [PubMed]
- Bull, J.G.; Saunders, D.E.; Clark, C.A. Discrimination of paediatric brain tumours using apparent diffusion coefficient histograms. Eur. Radiol. 2012, 22, 447–457. [Google Scholar] [CrossRef] [PubMed]
- Al-Sharydah, A.M.; Al-Arfaj, H.K.; Al-Muhaish, H.S.; Al-Suhaibani, S.S.; Al-Aftan, M.S.; Almedallah, D.K.; Al-Abdulwahhab, A.H.; Al-Hedaithy, A.A.; Al-Jubran, S.A. Can apparent diffusion coefficient values help distinguish between different types of pediatric brain tumors? Eur. J. Radiol. Open 2019, 6, 49–55. [Google Scholar] [CrossRef] [PubMed]
- Alsop, D.C.; Detre, J.A.; Golay, X.; Günther, M.; Hendrikse, J.; Hernandez-Garcia, L.; Lu, H.; MacIntosh, B.J.; Parkes, L.M.; Smits, M.; et al. Recommended implementation of arterial spin-labeled perfusion MRI for clinical applications: A consensus of the ISMRM perfusion study group and the European consortium for ASL in dementia. Magn. Reson. Med. 2015, 73, 102–116. [Google Scholar] [CrossRef]
- Yeom, K.W.; Mitchell, L.A.; Lober, R.M.; Barnes, P.D.; Vogel, H.; Fisher, P.G.; Edwards, M.S. Arterial spin-labeled perfusion of pediatric brain tumors. AJNR Am. J. Neuroradiol. 2014, 35, 395–401. [Google Scholar] [CrossRef]
- Dangouloff-Ros, V.; Deroulers, C.; Foissac, F.; Badoual, M.; Shotar, E.; Grévent, D.; Calmon, R.; Pagès, M.; Grill, J.; Dufour, C.; et al. Arterial spin labeling to predict brain tumor grading in children: Correlations between histopathologic vascular density and perfusion MR Imaging. Radiology 2016, 281, 553–566. [Google Scholar] [CrossRef] [PubMed]
- Zhou, J.; Payen, J.F.; Wilson, D.A.; Traystman, R.J.; van Zijl, P.C.M. Using the amide proton signals of intracellular proteins and peptides to detect pH effects in MRI. Nat. Med. 2003, 9, 1085–1090. [Google Scholar] [CrossRef] [PubMed]
- Zhou, J.; Lal, B.; Wilson, D.A.; Laterra, J.; van Zijl, P.C.M. Amide proton transfer (APT) contrast for imaging of brain tumors. Magn. Reson. Med. 2003, 50, 1120–1126. [Google Scholar] [CrossRef] [PubMed]
- Togao, O.; Yoshiura, T.; Keupp, J.; Hiwatashi, A.; Yamashita, K.; Kikuchi, K.; Suzuki, Y.; Suzuki, S.O.; Iwaki, T.; Hata, N.; et al. Amide proton transfer imaging of adult diffuse gliomas: Correlation with histopathological grades. Neuro Oncol. 2014, 16, 441–448. [Google Scholar] [CrossRef] [PubMed]
- Togao, O.; Hiwatashi, A.; Yamashita, K.; Kikuchi, K.; Keupp, J.; Yoshimoto, K.; Kuga, D.; Yoneyama, M.; Suzuki, S.O.; Iwaki, T.; et al. Grading diffuse gliomas without intense contrast enhancement by amide proton transfer MR imaging: Comparisons with diffusion- and perfusion-weighted imaging. Eur. Radiol. 2017, 27, 578–588. [Google Scholar] [CrossRef] [PubMed]
- Kanda, T.; Fukusato, T.; Matsuda, M.; Toyoda, K.; Oba, H.; Kotoku, J.; Haruyama, T.; Kitajima, K.; Furui, S. Gadolinium-based contrast agent accumulates in the brain even in subjects without severe renal dysfunction: Evaluation of autopsy brain specimens with inductively coupled plasma mass spectroscopy. Radiology 2015, 276, 228–232. [Google Scholar] [CrossRef] [PubMed]
- Stanescu, A.L.; Shaw, D.W.; Murata, N.; Murata, K.; Rutledge, J.C.; Maloney, E.; Maravilla, K.R. Brain tissue gadolinium retention in pediatric patients after contrast-enhanced magnetic resonance exams: Pathological confirmation. Pediatr. Radiol. 2020, 50, 388–396. [Google Scholar] [CrossRef]
- Zhang, H.; Yong, X.; Ma, X.; Zhao, J.; Shen, Z.; Chen, X.; Tian, F.; Chen, W.; Wu, D.; Zhang, Y. Differentiation of low- and high-grade pediatric gliomas with amide proton transfer imaging: Added value beyond quantitative relaxation times. Eur. Radiol. 2021, 31, 9110–9119. [Google Scholar] [CrossRef]
- Bobak, C.A.; Barr, P.J.; O’Malley, A.J. Estimation of an inter-rater intra-class correlation coefficient that overcomes common assumption violations in the assessment of health measurement scales. BMC Med. Res. Methodol. 2018, 18, 93. [Google Scholar] [CrossRef]
- Wen, Z.; Hu, S.; Huang, F.; Wang, X.; Guo, L.; Quan, X.; Wang, S.; Zhou, J. MR imaging of high-grade brain tumors using endogenous protein and peptide-based contrast. Neuroimage 2010, 51, 616–622. [Google Scholar] [CrossRef]
- Park, J.E.; Kim, H.S.; Park, K.J.; Choi, C.G.; Kim, S.J. Histogram analysis of amide proton transfer imaging to identify contrast-enhancing low-grade brain tumor that mimics high-grade tumor: Increased accuracy of MR perfusion. Radiology 2015, 277, 151–161. [Google Scholar] [CrossRef] [PubMed]
- Nakajo, M.; Bohara, M.; Kamimura, K.; Higa, N.; Yoshiura, T. Correlation between amide proton transfer-related signal intensity and diffusion and perfusion magnetic resonance imaging parameters in high-grade glioma. Sci. Rep. 2021, 11, 11223. [Google Scholar] [CrossRef] [PubMed]
- Kang, X.W.; Xi, Y.B.; Liu, T.T.; Wang, N.; Zhu, Y.-Q.; Wang, X.-R.; Guo, F. Grading of glioma: Combined diagnostic value of amide proton transfer weighted, arterial spin labeling and diffusion weighted magnetic resonance imaging. BMC Med. Imaging 2020, 20, 50. [Google Scholar] [CrossRef] [PubMed]
- Sakata, A.; Fushimi, Y.; Okada, T.; Arakawa, Y.; Kunieda, T.; Minamiguchi, S.; Kido, A.; Sakashita, N.; Miyamoto, S.; Togashi, K. Diagnostic performance between contrast enhancement, proton MR spectroscopy, and amide proton transfer imaging in patients with brain tumors. J. Magn. Reson. Imaging 2017, 46, 732–739. [Google Scholar] [CrossRef] [PubMed]
- Su, C.; Jiang, J.; Liu, C.; Shi, J.; Li, S.; Chen, X.; Ao, Q. Comparison of amide proton transfer imaging and magnetization transfer imaging in revealing glioma grades and proliferative activities: A histogram analysis. Neuroradiology 2021, 63, 685–693. [Google Scholar] [CrossRef] [PubMed]
- Just, N. Improving tumour heterogeneity MRI assessment with histograms. Br. J. Cancer 2014, 111, 2205–2213. [Google Scholar] [CrossRef] [PubMed]
- Morana, G.; Tortora, D.; Staglianò, S.; Nozza, P.; Mascelli, S.; Severino, M.; Piatelli, G.; Consales, A.; Lequin, M.; Garrè, M.L.; et al. Pediatric astrocytic tumor grading: Comparison between arterial spin labeling and dynamic susceptibility contrast MRI perfusion. Neuroradiology 2018, 60, 437–446. [Google Scholar] [CrossRef] [PubMed]
- Nikam, R.M.; Yue, X.; Kaur, G.; Kandula, V.; Khair, A.; Kecskemethy, H.H.; Averill, L.W.; Langhans, S.A. Advanced neuroimaging approaches to pediatric brain tumors. Cancers 2022, 14, 3401. [Google Scholar] [CrossRef] [PubMed]
- Sugahara, T.; Korogi, Y.; Kochi, M.; Ikushima, I.; Shigematu, Y.; Hirai, T.; Okuda, T.; Liang, L.; Ge, Y.; Komohara, Y.; et al. Usefulness of diffusion-weighted MRI with echo-planar technique in the evaluation of cellularity in gliomas. J. Magn. Reson. Imaging 1999, 9, 53–60. [Google Scholar] [CrossRef]
- Sakata, A.; Okada, T.; Yamamoto, A.; Kanagaki, M.; Fushimi, Y.; Okada, T.; Dodo, T.; Arakawa, Y.; Schmitt, B.; Miyamoto, S.; et al. Grading glial tumors with amide proton transfer MR imaging: Different analytical approaches. J. Neurooncol. 2015, 122, 339–348. [Google Scholar] [CrossRef]
- Sachdeva, P.; Ghosh, S.; Ghosh, S.; Han, S.; Banerjee, J.; Bhaskar, R.; Sinha, J.K. Childhood obesity: A potential key factor in the development of glioblastoma multiforme. Life 2022, 12, 1673. [Google Scholar] [CrossRef] [PubMed]


| MTs (n = 15) | BTs (n = 10) | p-Value | |
|---|---|---|---|
| Sex | 0.405 | ||
| Male: Female | 10:5 | 5:5 | |
| Age | 0.415 | ||
| Range (years old) | 0–29 | 1–30 | |
| Mean age (years old) | 10.87 ± 9.17 | 14.30 ± 11.44 | |
| Tumor maximum diameter | 0.061 | ||
| Range (mm) | 28–83 | 15–87 | |
| Mean (mm) | 50.67 ± 16.49 | 35.40 ± 22.32 | |
| Diagnostic method | 0.096 | ||
| Resection: Biopsy | 11:4 | 5:5 | |
| Tumor Type | Patient Number | Age | Sex | Location | Diameter (mm) | Diagnostic Method | Diagnosis and WHO2021 Grade or ICD Behavior Code | Histopathological Diagnosis and Molecular Status |
|---|---|---|---|---|---|---|---|---|
| M | 1 | 3 | F | Lt. cerebellopontine angle | 58 | 70% resection | Diffuse midline glioma H3 K27-altered, grade4 | Glioblastoma Histone H3 K27M mutation was detected. |
| M | 2 | 6 | M | Bilateral thalamus | 34 | Biopsy | Diffuse midline glioma H3 K27-altered, grade4 | Diffuse astrocytoma without microvascular proliferation or necrosis Histone H3 K27M mutation was detected. |
| M | 3 | 29 | M | Bilateral thalamus~midbrain~cerebellum | 81 | 20% resection | Diffuse midline glioma H3 K27-altered, grade4 | Diffuse astrocytoma without microvascular proliferation or necrosis Histone H3 K27M mutation was detected. |
| M | 4 | 1 | F | Lt. lateral ventricle~frontal lobe | 83 | 20% resection | Astroblastoma, MN1-altered, ICD/3 | Astroblastoma, high-grade, with MN1 alteration |
| M | 5 | 9 | M | Rt. occipital lobe | 68 | 80% resection | Paediatric-type diffuse high-grade glioma, NOS | Glioblastoma |
| M | 6 | 12 | F | Rt. frontal lobe | 50 | 100% resection | Paediatric-type diffuse high-grade glioma, H3-wildtype and IDH-wildtype, grade4 | Glioblastoma |
| M | 7 | 17 | M | Fourth ventricle | 44 | 70% resection | Medulloblastoma, non-WNT/non-SHH, grade 4 | Medulloblastoma |
| M | 8 | 5 | M | Fourth ventricle | 49 | 100% resection | Medulloblastoma, NOS, grade 4 | Medulloblastoma |
| M | 9 | 3 | F | Rt. lateral ventricle | 58 | 100% resection | Atypical teratoid/rhabdoid tumor, grade 4 | Atypical teratoid/rhabdoid tumor |
| M | 10 | 11 | F | Lt. basal ganglia | 50 | 80% resection | Germinoma, ICD/3 | Germinoma |
| M | 11 | 22 | M | Pineal region | 28 | 100% resection | Germinoma, ICD/3 | Germinoma |
| M | 12 | 27 | M | Pineal region | 33 | Biopsy | Germinoma, ICD/3 | Germinoma |
| M | 13 | 0 (1 month) | M | Fourth ventricle | 45 | 90% resection | Immature teratoma, ICD/3 | Immature teratoma, |
| M | 14 | 6 | M | Pineal region | 39 | Biopsy | Immature teratoma, ICD/3 | Immature teratoma |
| M | 15 | 12 | M | Suprasellar region | 40 | Biopsy | Mixed germ cell tumor, ICD/3 | germinoma and immature teratoma |
| B | 16 | 30 | F | Rt. parietal lobe | 36 | Biopsy | Astrocytoma, IDH-mutant, grade 2 | Diffuse astrocytoma without microvascular proliferation, or necrosis Homozygous deletion of CDKN2A/B was not detected. |
| B | 17 | 22 | M | Lt. thalamus~midbrain | 19 | 60% resection | Diffuse low-grade astrocytoma, NOS | Diffuse astrocytoma, IDH-wildtype without microvascular proliferation, or necrosis No TERT promoter mutation, EGFR gene amplification, or +7/−10 chromosome copy-number alterations were detected. |
| B | 18 | 30 | F | Lt. thalamus~hypothalamus | 15 | Biopsy | Diffuse low-grade astrocytoma, NOS | Diffuse astrocytoma, IDH-wildtype without microvascular proliferation, or necrosis No TERT promoter mutation, EGFR gene amplification, or +7/−10 chromosome copy-number alterations were detected. |
| B | 19 | 3 | M | Lt. temporal lobe | 23 | 100% resection | Diffuse low-grade astrocytoma, NOS | Diffuse astrocytoma IDH wildtype without microvascular proliferation, or necrosis BRAF p.V600E mutation was detected. |
| B | 20 | 6 | F | Lt. thalamus~midbrain | 27 | Biopsy | Diffuse low-grade astrocytoma, NOS | Diffuse astrocytoma without microvascular proliferation, or necrosis Histone H3 K27M mutation was not detected. |
| B | 21 | 6 | F | Lt. frontal lobe | 52 | 80% resection | Angiocentric glioma, grade 1 | Angiocentric glioma |
| B | 22 | 26 | M | Rt. thalamus~midbrain | 18 | Biopsy | Pilocytic astrocytoma, grade 1 | Pilocytic astrocytoma |
| B | 23 | 1 | M | Fourth ventricle | 51 | 70% resection | Posterior fossa ependymoma, group A, grade 2 | Ependymoma |
| B | 24 | 9 | M | Lt. lateral ventricle | 87 | 70% resection | Supratentorial ependymoma, NOS, grade 2 | Ependymoma |
| B | 25 | 10 | F | Cerebellar vermis | 26 | Biopsy | Pilocytic astrocytoma, grade 1 | Pilocytic astrocytoma |
| MTs | BTs | p-Value | |
|---|---|---|---|
| APT max | 5.23 (2.52–10.09) | 2.43 (1.91–10.12) | 0.004 * |
| APT min | 0.87 (−1.41–3.22) | 0.81 (−9.09–1.26) | 0.807 |
| APT mean | 3.27 (0.64–5.76) | 1.74 (1.15–2.55) | 0.001 * |
| APT 10th percentile | 2.27 (−0.03–4.08) | 1.21 (−1.13–1.80) | 0.008 * |
| APT 25th percentile | 2.85 (0.20–4.41) | 1.41 (0.66–2.23) | 0.003 * |
| APT 50th percentile | 3.26 (0.57–5.91) | 1.76 (1.07–2.65) | <0.001 * |
| APT 75th percentile | 3.72 (1.06–7.83) | 1.87 (1.33–4.11) | 0.003 * |
| APT 90th percentile | 4.03 (1.40–9.57) | 2.20 (1.78–7.18) | 0.010 * |
| APT skewness | −0.17 (−0.70–0.57) | −0.07 (−0.84–1.07) | 0.978 |
| APT kurtosis | 2.93 (2.05–6.97) | 3.02 (2.43–3.99) | 0.683 |
| TBF max | 45.93 (9.37–87.99) | 41.06 (33.01–64.10) | 0.807 |
| TBF min | 3.22 (−2.92–19.35) | 9.46 (0.64–38.02) | 0.008 * |
| TBF mean | 23.44 (1.77–51.46) | 29.09 (13.32–47.65) | 0.196 |
| TBF 10th percentile | 11.76 (−0.16–30.42) | 17.58 (5.09–40.37) | 0.062 |
| TBF 25th percentile | 16.70 (0.15–40.37) | 23.12 (10.34–43.10) | 0.144 |
| TBF 50th percentile | 22.81 (1.19–51.04) | 28.49 (12.32–46.99) | 0.216 |
| TBF 75th percentile | 29.81 (2.91–63.41) | 32.59 (15.23–52.36) | 0.285 |
| TBF 90th percentile | 31.95 (4.60–73.24) | 36.54 (19.51–56.07) | 0.428 |
| TBF skewness | 0.30 (−0.68–1.45) | 0.15 (−0.46–1.37) | 0.892 |
| TBF kurtosis | 3.76 (2.18–5.33) | 2.52 (1.98–5.68) | 0.026 * |
| ADC max | 2.02 (1.05–3.43) | 1.68 (1.18–3.16) | 0.261 |
| ADC min | 0.41 (0.16–1.27) | 0.83 (0.52–1.57) | <0.001 * |
| ADC mean | 0.98 (0.43–1.72) | 1.13 (0.96–1.93) | 0.160 |
| ADC 10th percentile | 0.66 (0.31–1.57) | 0.96 (0.71–1.75) | 0.005 * |
| ADC 25th percentile | 0.82 (0.35–1.68) | 1.01 (0.77–1.86) | 0.023 * |
| ADC 50th percentile | 0.93 (0.39–1.74) | 1.09 (0.86–1.94) | 0.216 |
| ADC 75th percentile | 1.08 (0.44–1.92) | 1.22 (0.99–2.01) | 0.238 |
| ADC 90th percentile | 1.30 (0.52–2.49) | 1.40 (1.13–2.07) | 0.367 |
| ADC skewness | 1.22 (−1.27–4.20) | 0.20 (−1.11–1.93) | 0.103 |
| ADC kurtosis | 4.88 (1.65–23.78) | 3.18 (1.93–8.19) | 0.071 |
| Parameters | AUC | 95% CI | p-Value | Cutoff Value | Sensitivity (%) | Specificity (%) |
|---|---|---|---|---|---|---|
| APT 50th percentile | 0.900 | 0.764–1.000 | 0.001 * | 1.94 | 93.3 | 80.0 |
| TBF min | 0.813 | 0.632–0.995 | 0.009 * | 7.35 | 70.0 | 93.3 |
| ADC min | 0.900 | 0.771–1.000 | 0.001 * | 0.51 | 100.0 | 73.3 |
| APT 50th + TBF min + ADC min | 0.933 | 0.807–1.000 | <0.001 * |  |  |  |
Disclaimer/Publisher’s Note: The statements, opinions and data contained in all publications are solely those of the individual author(s) and contributor(s) and not of MDPI and/or the editor(s). MDPI and/or the editor(s) disclaim responsibility for any injury to people or property resulting from any ideas, methods, instructions or products referred to in the content. |
© 2024 by the authors. Licensee MDPI, Basel, Switzerland. This article is an open access article distributed under the terms and conditions of the Creative Commons Attribution (CC BY) license (https://creativecommons.org/licenses/by/4.0/).
Share and Cite
Tanaka, F.; Maeda, M.; Nakayama, R.; Inoue, K.; Kishi, S.; Kogue, R.; Umino, M.; Kitano, Y.; Obara, M.; Sakuma, H. A Combination of Amide Proton Transfer, Tumor Blood Flow, and Apparent Diffusion Coefficient Histogram Analysis Is Useful for Differentiating Malignant from Benign Intracranial Tumors in Young Patients: A Preliminary Study. Diagnostics 2024, 14, 1236. https://doi.org/10.3390/diagnostics14121236
Tanaka F, Maeda M, Nakayama R, Inoue K, Kishi S, Kogue R, Umino M, Kitano Y, Obara M, Sakuma H. A Combination of Amide Proton Transfer, Tumor Blood Flow, and Apparent Diffusion Coefficient Histogram Analysis Is Useful for Differentiating Malignant from Benign Intracranial Tumors in Young Patients: A Preliminary Study. Diagnostics. 2024; 14(12):1236. https://doi.org/10.3390/diagnostics14121236
Chicago/Turabian StyleTanaka, Fumine, Masayuki Maeda, Ryohei Nakayama, Katsuhiro Inoue, Seiya Kishi, Ryota Kogue, Maki Umino, Yotaro Kitano, Makoto Obara, and Hajime Sakuma. 2024. "A Combination of Amide Proton Transfer, Tumor Blood Flow, and Apparent Diffusion Coefficient Histogram Analysis Is Useful for Differentiating Malignant from Benign Intracranial Tumors in Young Patients: A Preliminary Study" Diagnostics 14, no. 12: 1236. https://doi.org/10.3390/diagnostics14121236