Article

Healthcare Teams Neurodynamically Reorganize When Resolving Uncertainty

1
Brain Research Institute, University of California, Los Angeles School of Medicine, Culver City, CA 90230, USA
2
IMMEX (Interactive Multi-Media Exercises), The Learning Chameleon, Inc., Culver City, CA 90230, USA
3
JUMP Simulation and Education Center, 1306 N Berkeley Ave, Peoria, IL 61603, USA
*
Author to whom correspondence should be addressed.
Entropy 2016, 18(12), 427; https://doi.org/10.3390/e18120427
Submission received: 23 September 2016 / Revised: 13 November 2016 / Accepted: 22 November 2016 / Published: 29 November 2016
(This article belongs to the Special Issue Entropy and Electroencephalography II)

Abstract

:
Research on the microscale neural dynamics of social interactions has yet to be translated into improvements in the assembly, training and evaluation of teams. This is partially due to the scale of neural involvements in team activities, spanning the millisecond oscillations in individual brains to the minutes/hours performance behaviors of the team. We have used intermediate neurodynamic representations to show that healthcare teams enter persistent (50–100 s) neurodynamic states when they encounter and resolve uncertainty while managing simulated patients. Each of the second symbols was developed situating the electroencephalogram (EEG) power of each team member in the contexts of those of other team members and the task. These representations were acquired from EEG headsets with 19 recording electrodes for each of the 1–40 Hz frequencies. Estimates of the information in each symbol stream were calculated from a 60 s moving window of Shannon entropy that was updated each second, providing a quantitative neurodynamic history of the team’s performance. Neurodynamic organizations fluctuated with the task demands with increased organization (i.e., lower entropy) occurring when the team needed to resolve uncertainty. These results show that intermediate neurodynamic representations can provide a quantitative bridge between the micro and macro scales of teamwork.

1. Introduction

1.1. Background

Teams work through coordinated exchanges of information using speech [1], action-understandings like gestures [2,3], posture [4], facial expressions [5], other non-verbal communications [6], and even periods of silence [7], all of which contribute to the team’s dynamics. It is not surprising that neurophysiologic processes underlie these interactions, and, while research is revealing the microscale details of social dynamics [8], the impact of these studies on understanding how to assemble, train and evaluate teams has been minor. This is partially due to the time span of neural involvements in team activities, ranging from the millisecond neurodynamic oscillations in individual brains to the observed performance behaviors in the overall team that occur over hours/days.
The power–law structures of the data streams left by individuals at both the neuronal level (10−3–10 s) [9,10] as well as processes left by spontaneous (100–105 s) human behavior [11,12] and teamwork (i.e., speech) [13], however, suggests that points may exist along this 108 s time scale, where intermediate representations could capture the micro-neurodynamics and transform them into other representations that link to higher level team behaviors [14]. In these representations, what would be lost in the mechanistic details of neuronal spike generation and propagation would be gained by tighter relationships with more easily-recognized, observer-defined variables such as team coherence, flexibility or resilience.
Several years ago, we explored an information/organization-centric approach for developing transitional neurodynamic representations with the goal of quantitatively mapping the neurophysiologic organizations of teams and relating their fluctuating dynamics to team activities, communications, and performance [15,16].
Long-term, the benefits of such quantitative models of teamwork, if appropriately positioned along the micro–macro continuum of teamwork, would include the ability to compare across teams, or training sites, or training protocols, and to follow team training progress over time. Reiteratively, if appropriately positioned below the domain specificity of complex tasks, but above the 100–300 millisecond timings of responses like imitation and action perception [17], these modeling approaches would be applicable to many complex teaming situations.
We accomplished these goals with measures that were rapid yet encompassed many facets of cognition. Electroencephalography (EEG) was chosen for these studies as it provided real-time and high resolution temporal recording of the brain’s electrical activity of an alternating type at different regions along the scalp and at different frequencies measured in an unobtrusive fashion.

1.2. Neurodynamic Modeling

The goal of the neurodynamic modeling was to develop data streams that contained temporal information about the organization, function and performance of teams. The first step in the neurodynamic modeling was to generate Neurodynamic Symbols (NS), which are symbolic representations of the momentary power levels of a neurodynamic marker for each team member. Every second, the power levels of one of the EEG frequencies (i.e., 40 Hz) bins of each of the three team members were compared to his/her own task balance levels. This identified whether at a particular time point a person was experiencing above or below average levels of an EEG marker, and also showed whether the team as a whole was experiencing above or below average levels.
In this study, we highlight the 10 Hz frequency, which is involved in attention and prioritizing stimuli [18,19], the 16 Hz frequency that is involved in action understandings [17], and the 40 Hz frequency involved in maintaining working memory and long-term memory encoding and retrieval [20,21]. The frequencies that were chosen for this study were based on prior work that revealed their involvement in team neurodynamics [16,22].
It is important to note that, functionally, high and low EEG power in these frequency bands should not be thought of as good or bad, as different power levels may serve different purposes. For instance, during spontaneous coordination, the mu medial rhythm is synchronized (i.e., high power), but becomes suppressed or desynchronized (i.e., low power) during social interaction [8]. Similarly, synchronized (i.e., high power) alpha may provide a mechanism for selective attention while desynchronized alpha may promote working memory formation [19].
During neurodynamic modeling, the frequency-specific EEG power levels become partitioned into the upper 33%, the lower 33% and the middle 33%, which were assigned values of 3, −1, and 1, respectively, and these values were chosen for data visualization purposes. Each second, the values for each person were combined into a three-element vector. The values for the three histograms in Figure 1A indicate that, at this point in time, team member 1 had below average frequency-specific EEG power levels, team member 2 had above average, and team member 3 had average levels, and so the vector for this neurodynamic symbol (NS) would be −1, 3, 1. The three element vectors created each second for the performance were classified by unsupervised artificial neural networks to create a twenty-one symbol neurodynamic state space (NSS) (Figure 1B).
In the process of developing the NSS, a topology was generated such that the early symbols (numbered row wise 1–5, 6–10, etc.) represented times when most team members had average/low levels of EEG power, while the symbols on the bottom row, numbers 20–25 represented times when most team members had above average power levels. Each NS in the symbolic state space therefore situated the EEG power levels of each team member in the context of the levels of the other team members. Classifying the set of symbols over entire performances (i.e., Briefing, Scenario and Debriefing segments) provided neurodynamic models encompassing a comprehensive set of task situations/loads [23].
The hypothesis was that brain-wide collections of such sequences would contain second-by-second neurodynamic histories of the team, where the information contained in each second would depend on the EEG frequencies and channels being analyzed. Second-by-second symbolic representations were developed that showed the EEG power levels over the 1–40 Hz spectrum for each team member in relation to those of other team members for the entire performance. The fluctuating information in these symbol streams would then be quantitated using a regularly updated (i.e., each second), 60 s sliding window of Shannon’s entropy [22,24]; the quantitative output measure on the y-axis would be the neurodynamic entropy measured in information bits.
In this process, the millisecond frequency-specific EEG power levels become transformed into quantitative information about the team’s neurodynamic organization. Performance segments with restricted symbol expression had lower NSH levels, which may reflect rigidity, while segments with greater symbol diversity had higher entropy, which may reflect neurodynamic flexibility.
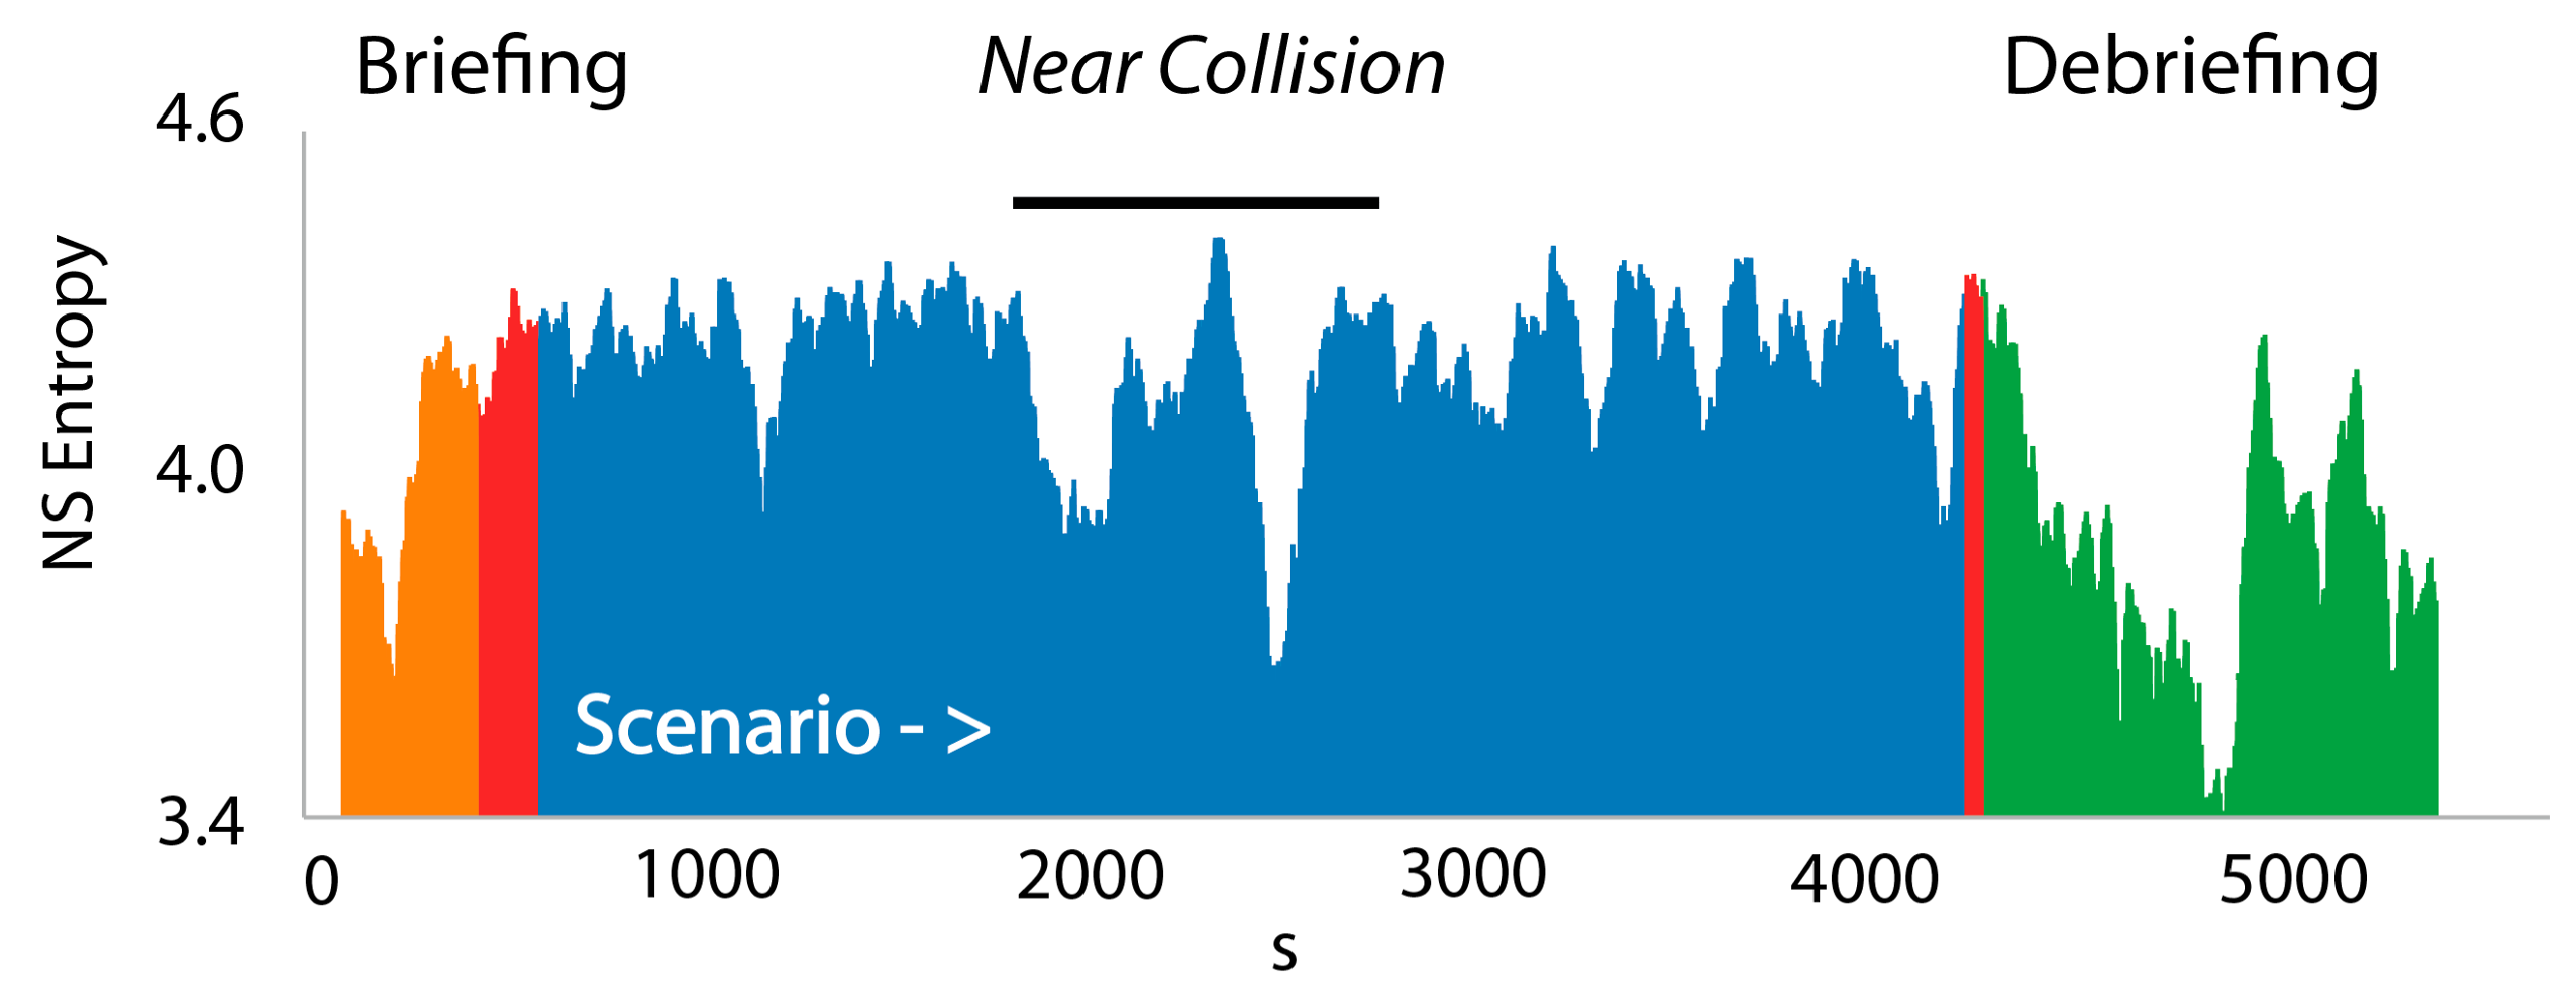
This hypothesis was tested with US Navy submarine navigation teams performing required training simulations [16,25]. The neurodynamic symbol entropy (abbreviated NSH) profile of one team (Figure 2) was irregular with fluctuations occurring in the three training segments. Midway through the Scenario, this team was challenged by fog, heavy currents and multiple other ships in the area while they navigated through a narrow stretch of water. From ~2000 to 2700 s, there was danger of collision with another ship. During this time, the NSH dropped, indicating a change in the level of neurodynamic organization of the team. Decreased NSH indicates that fewer of the available symbols were expressed during the sliding window of time, generally 60 s or 100 s depending on the length of the performance. Further studies showed that these entropy profiles were multifractal [26] with highly dynamic, complex flows of neurodynamic information occurring across the team in response to the changing task demands; these dynamics were particularly increased during periods of apparent stress.
Modeling continuous EEG data streams with teams performing realistic simulations is challenging. Scalp EEG is thought to arise from near-synchronous field activities within small cortical regions or ‘patches’ that are detected by EEG sensors [27]. These rhythms are also volume conducted as far-field signals to other EEG sensors, becoming a mix of signals of within-brain and non-brain contaminating signals. In real-world environments, subjects frequently generate ocular, facial and other muscle artifacts (EMG), which are generally highest in the gamma frequency region (>35 Hz) with less activity in the beta (15–25 Hz) and alpha (8–12 Hz) regions [28]. The EMG noise is lowest along the midline, e.g., FCz, Cz and CPz channels and greatest along the sides of the head, e.g., FC3, FC4, C5 and C6 channels. An important consideration for the detection of the most informative team dynamics is the optimum selection and representation of the EEG sensors and frequencies. Despite these challenges, our prior results suggested that entropic measures of frequency specific EEG-derived symbol streams might provide a way of quantitatively monitoring the neurodynamic organizations of teams.
The first research question for this study was: Are the neurodynamic organizations of teams unique to submarine navigation teams, or are they more fundamental properties of teams performing in complex environments? In this study, we have tested this hypothesis with healthcare teams.
The second research question was: What is the behavioral significance of these intermediate level neurodynamic fluctuations? Earlier work with submarine navigation teams suggested that entropy decreases might be associated with periods of stress and/or uncertainty. The three-member healthcare teams included in this study (rather than the 5–6 member submarine teams) allowed a more detailed mapping of the second-by-second activities of each team member to begin to approach this question. These detailed activity mappings also help address the question of whether the entropy fluctuations were the direct result of excessive EMG activity.

2. Materials and Methods

2.1. Simulations

The simulations developed for this study followed a standard training format beginning with a pre-simulation briefing of approximately ten minutes. This orientation focused on establishing a safe learning environment and provided an introduction to the simulated clinical setting, the equipment and supplies, the mannequin, as well as an overview of what to expect during the post simulation debriefing. Teams were briefed on key roles needed to manage a patient with an urgent/emergent clinical condition; these included: Leadership, Compressions, a Scribe, Airway/Breathing, Medication/Fluid Administration, Electrical Therapy, Pulses and Monitors. This was followed by a short introduction including the simulated patient history and set the stage for the simulation. The briefing was followed by the simulation scenario lasting 15−20 min. A reflective debriefing was then led by the instructor (15−20 min) [29].
The core construct of this simulation series was ventilation with procedural goals of demonstrating the technical skills of supporting the airway of an obtunded patient and cognitive goals of carrying out team-based approaches to patients with decreased mental status, as well as practicing role assignment during care of a patient with an urgent/emergent clinical condition and the discussion of contraindications for Flumazenil-reversal of benzodiazepine (BZD) induced respiratory depression. Benzodiazepines are a commonly prescribed family of depressants that are often used to treat general anxiety, insomnia, depression, panic disorders, seizures and acute stress reactions. This construct was presented to the medical students with a simulated patient found unresponsive in his apartment and transported by Emergency Medical Services to the Emergency Department. The patient was obtunded due to a likely Benzodiazepine overdose and required supportive management. The construct design included the induction (depending on the sequence of team actions) of Benzodiazepine withdrawal syndrome which is a cluster of symptoms that emerge when a person who has taken Benzodiazepine, either medically or recreationally, and has developed a physical dependence, undergoes dosage reduction or discontinuation. This study reports the dynamics of five teams who have performed this or similar healthcare simulations. The study was approved for human use by the Order of Saint Francis IRB and all team performances were rated by experienced TeamSTEPPS® raters [29].
The submarine navigation studies referenced for this study (n = 7) averaged 4676 s in length with a range of 4020–5298 s. The healthcare simulations (n = 11) were shorter, averaging 1787 s with a range of 1081–2534 s. Combined, this represented over 14 h of teamwork.

2.2. Electroencephalography

EEG data was collected using the Quick 20 EEG headset from Cognionics, Inc. (Carlsbad, CA, USA), with 19 recording electrodes in the international 10–20 position with reference on A1, placing channel locations at F7, Fp1, Fp2, F8, F3, Fz, F4, C3, Cz, P8, P7, Pz, P4, T3, P3, O1, O2, C4, T4 monopolar configuration grounded to linked earlobes. The sampling frequency was 500 Hz. EEG data were preprocessed for each team member using FieldTrip (Donders Institute for Brain, Cognition and Behaviour, Nijmegen, NL) [30] by applying high-pass (0.5 Hz) and low-pass filters (50 Hz) and removing bad channels (max = 2). Spatially transformed independent component analysis was performed with RUNICA [31] to detect and remove artifacts associated with eye blinks, electrocardiogram and electromyogram activity. Following artifact rejection using RUNICA, data were back-reconstructed, and channels removed prior to RUNICA decomposition were interpolated back into the data by spherical interpolation.
Frequency decomposition was performed by first segmenting data into 1 s epochs. The EEG data were then windowed into 1 s epochs using Hanning taper and the frequency content of each trial was measured at 1 Hz intervals from 1–40 Hz using Fast Fourier Transform.

3. Results

3.1. Neurodynamic Fluctuations at Different Sensor Channels

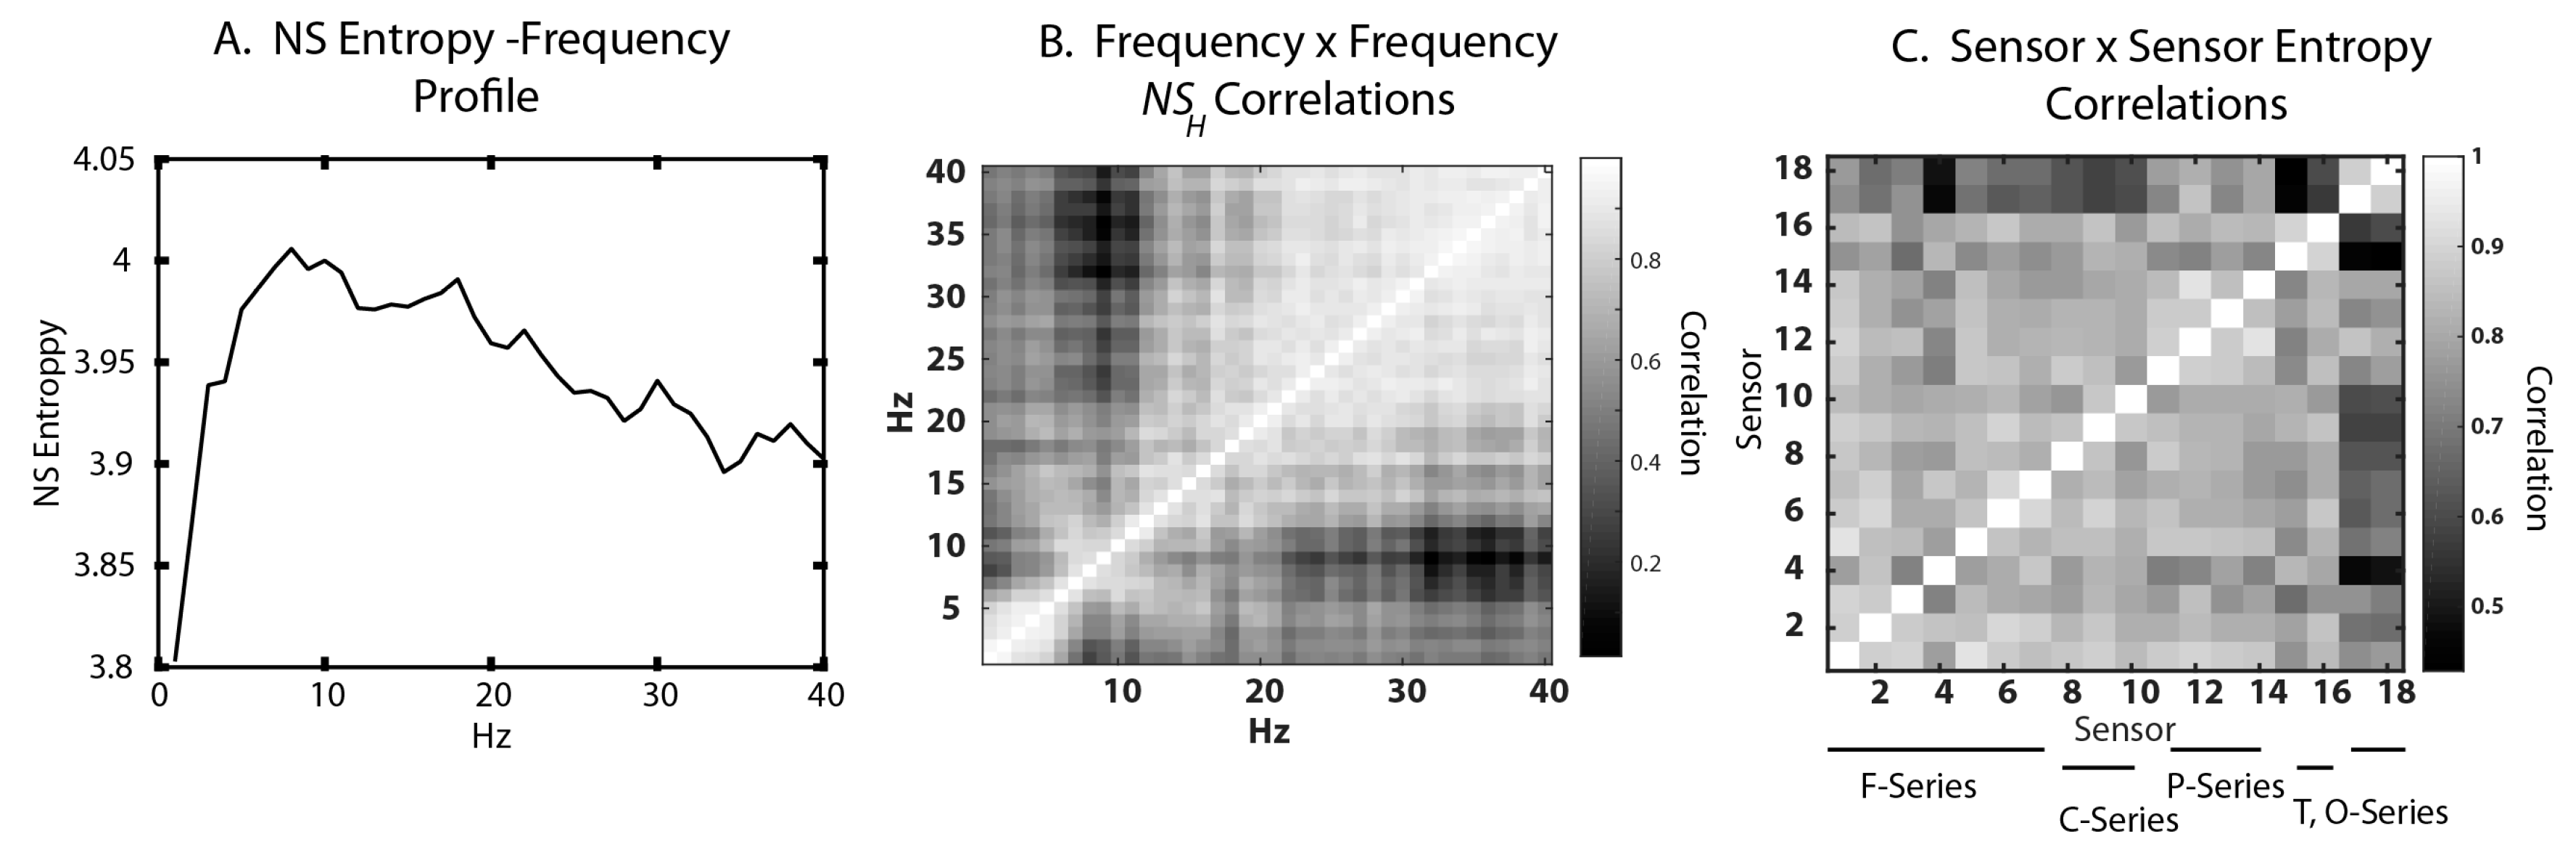
For the current studies, 19 sensor headsets (Cognionics Quick 20, Carlsbad, CA, USA) were available, which allowed us to achieve a finer level of analysis than that afforded by nine sensor headsets in previous studies. With forty 1 Hz frequency bins in each channel, there were 760 frequencydata streams for analysis. To simplify analysis and interpretation of the data, we explored ways of reducing this dimensionality while maintaining core dynamic features of the neurodynamic models. As a prelude to studying the team’s neurodynamic responses, the initial studies first surveyed the frequency profile of the neurodynamic entropy expression over the 1–40 Hz EEG frequency range (Figure 3A), and this was followed by correlation studies among the different frequency bands to detect redundancies and possible cross-frequency interactions (Figure 3B). This was followed by an across scalp survey to determine the sensors with the maximum/minimum neurodynamic entropy levels, as well as possible cross-sensor interactions (Figure 3C).
Previous studies with submarine navigation and high school problem solving teams showed few apparent team neurodynamic organizations in the delta (2–3 Hz) or theta (4–6 Hz) bands, suggesting that the number of frequencies to be analyzed might be reduced to the alpha (8–12 Hz), beta (16–25 Hz) and gamma (32 Hz and higher) bands. Based on the harmonic relationships of these frequencies, maximum distinction between these bands could be achieved by selecting the 10 Hz, 16 Hz and 35–40 Hz frequencies for the initial healthcare studies [19]. As facial EMG noise begin to predominate at above 40 Hz, this frequency range would also be useful for investigating the contribution of EMG to the NSH fluctuations.
The average NSH levels of the nineteen sensor arrays are plotted for the forty 1 Hz frequency bins in Figure 3A. From this profile, we would expect the magnitude, frequency and/or durations of the NSH fluctuations for healthcare teams would be greatest for the 40 Hz profile, less for 16 Hz, and least for 10 Hz. Figure 3B shows the frequency × frequency correlation values for NSH. The correlation between the levels of alpha and gamma NSH from five different teams was low to negative, while the correlations of the beta bands and the alpha and gamma bands were more moderate (r = 0.45–0.58).
The decision as to which sensors to highlight in the modeling was less clear from both the literature and prior experiments as the brain topologies of the EEG power contributing to team neurodynamics are unknown at this time. To estimate the contributions of different sensors to the performance NSH, correlations were made across the 18 sensors using the NSH levels, which were the average of the 40 one Hz frequency bins.
In Figure 3C, the sensors were ordered for the Frontal (F) groups (F7, Fp1, Fp2, F8, F3, Fz, F4), for the Central (C) group (C3, Cz, C4), the Parietal (P) group (P8, Pz, P4, P3), the Temporal (T) group (T3, T4) and the Occipital (O) group (O1, O2). Most of the correlations were high, ranging from r = 0.7 to 0.9 with the exception of the Occipital group, where the correlations with non-occipital sensors were as low as r = 0.45.
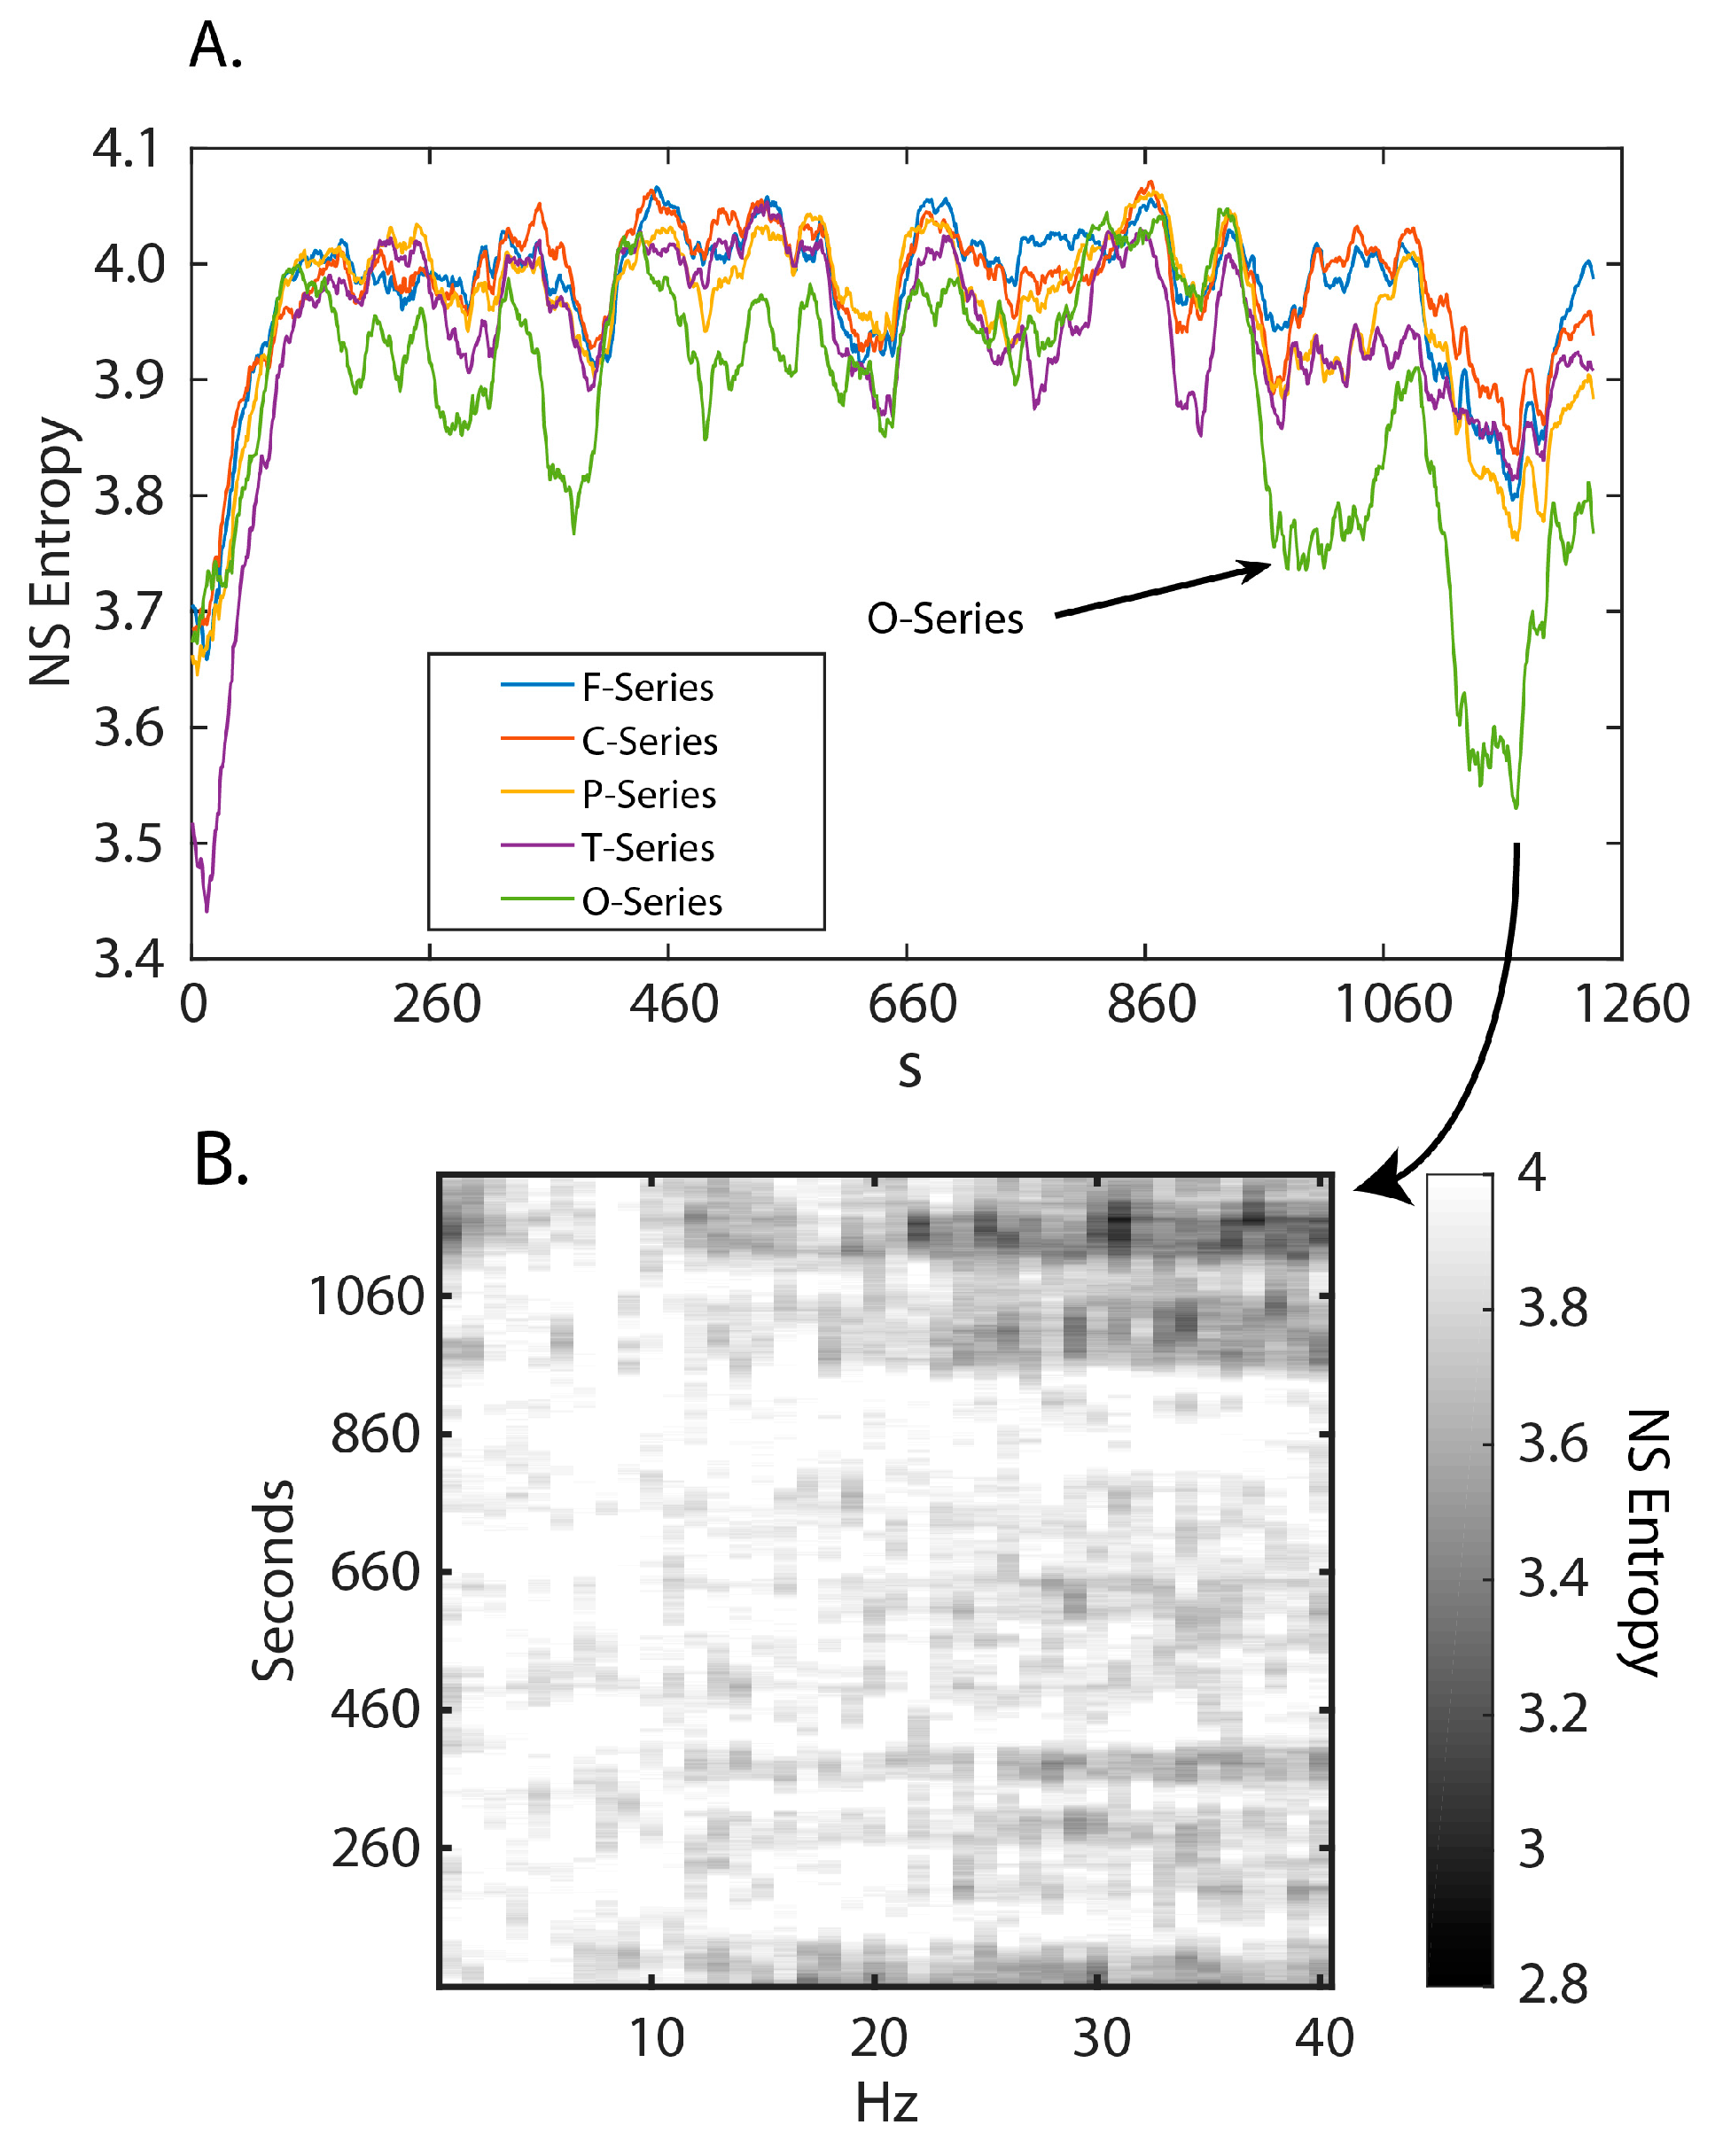
The correlation studies for the EEG sensors were followed by plotting the temporal NSH profiles for these sensor series arranged from the anterior to the posterior of the scalp. These entropy profiles used the average NSH dynamics of the 1–40 Hz frequency spectrum (Figure 4).
The NSH profiles for the five sensor series were qualitatively similar with NSH decreases ~380 s, 650 s, 960 s and 1100 s (Figure 4A). The largest quantitative differences were seen with the O-sensor series which were highest during the Debriefing segment (>800 s). An across-frequency and time plot (Figure 4B) was made of the NSH for the O-series, which showed that much of the decreased NSH activity in the Debriefing segment was across the ~12–40 Hz bands.

3.2. Frequency–Entropy Differences

For studying the detailed across-frequency and across-activity team dynamics, we chose to analyze the 10 Hz, 16 Hz and 40 Hz frequencies from the C4 sensor. These sensor–frequency combinations should provide information regarding the similarity between healthcare teams and submarine navigation teams (where 10 Hz and 40 Hz entropy decreases predominated), and high school map navigation teams (where entropy fluctuations were mainly at the 16 Hz and 40 Hz frequencies). The C4 scalp position should also reveal significant EMG contributions to entropy fluctuations if they were present [28].
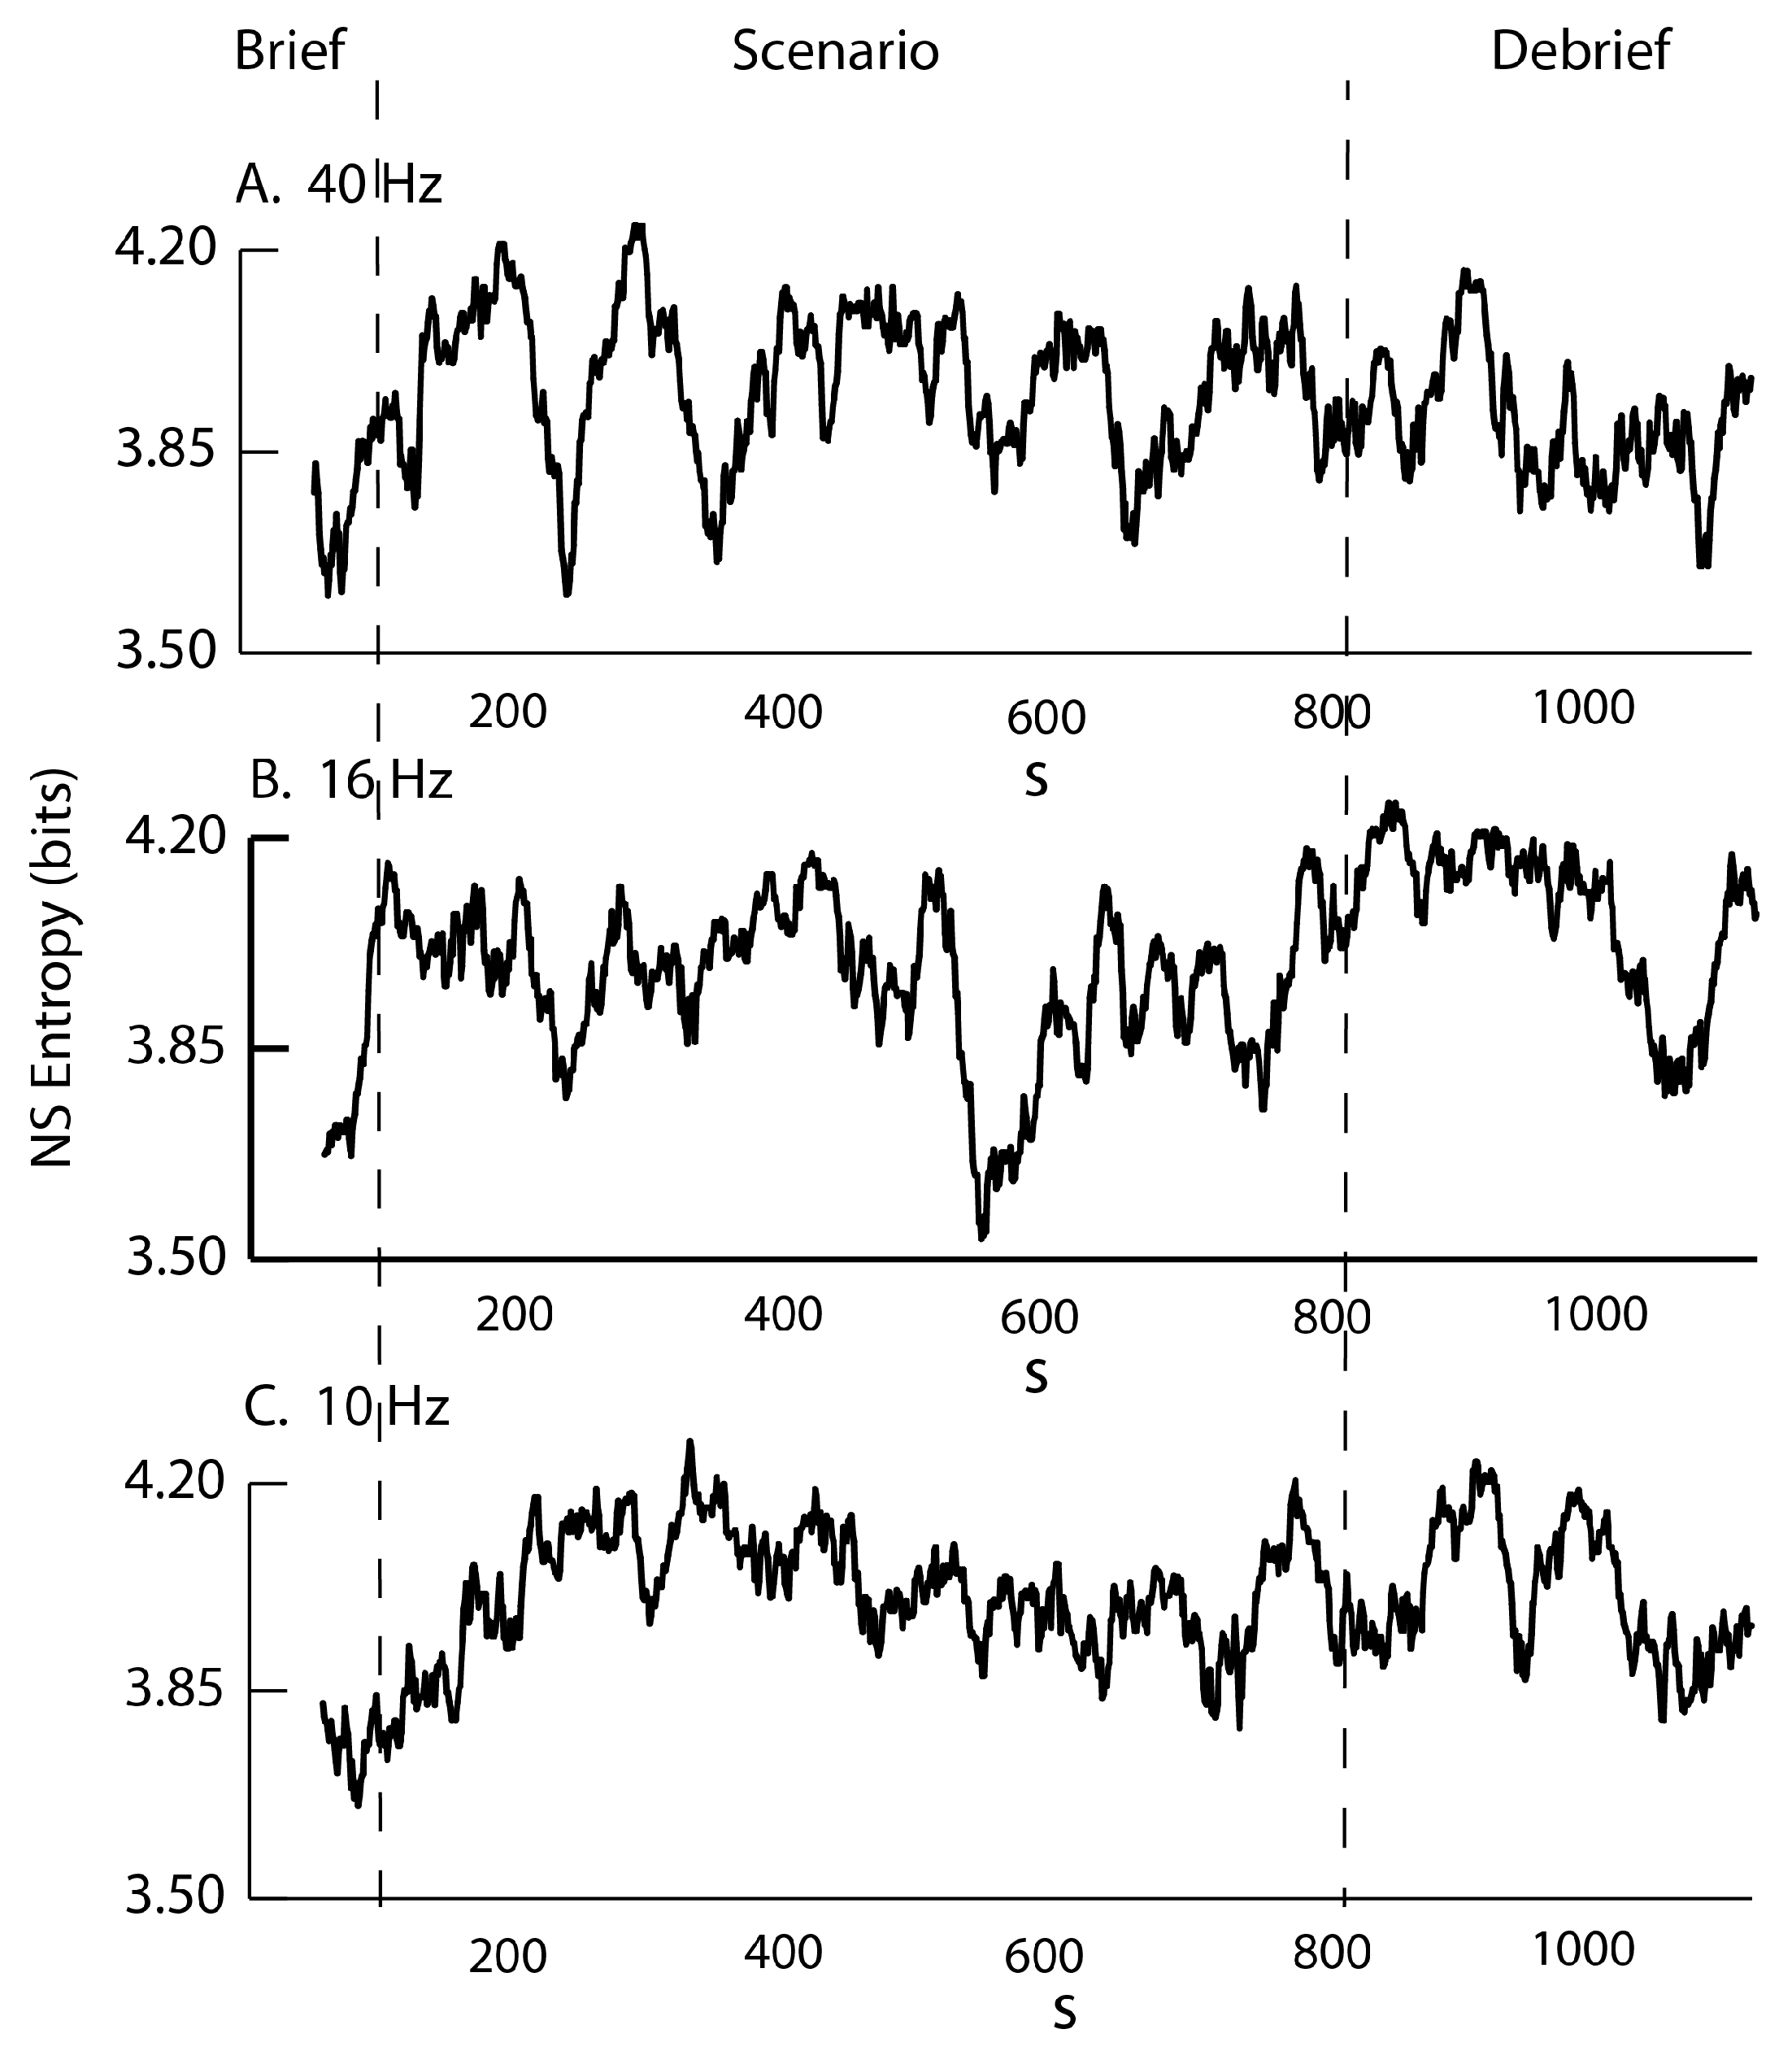
The NSH profiles for one team (J10T2) at the 40 Hz, 16 Hz and 10 Hz frequencies (of the C4 sensor) are shown in Figure 5. There were multiple episodes of decreased NSH in the three frequency bands with the most prominent presented in the 40 Hz frequency band (Figure 5A). As expected from Figure 3B, the overlap of the decreased NSH segments in the different profiles was low.
The maximum entropy from 21 symbols that are randomly distributed in the data stream is 4.39 bits. The maximum entropy across the 1–40 Hz frequency bins for the C4 channel was 4.31 (~20 symbols), suggesting that the symbols were not randomly represented within the data stream (Figure 1C). The minimum entropy (above the 5 Hz frequency) was 3.2 (or ~9 of the 21 symbols) over a 60 s moving window, i.e., about 50% of the available neurodynamic states.
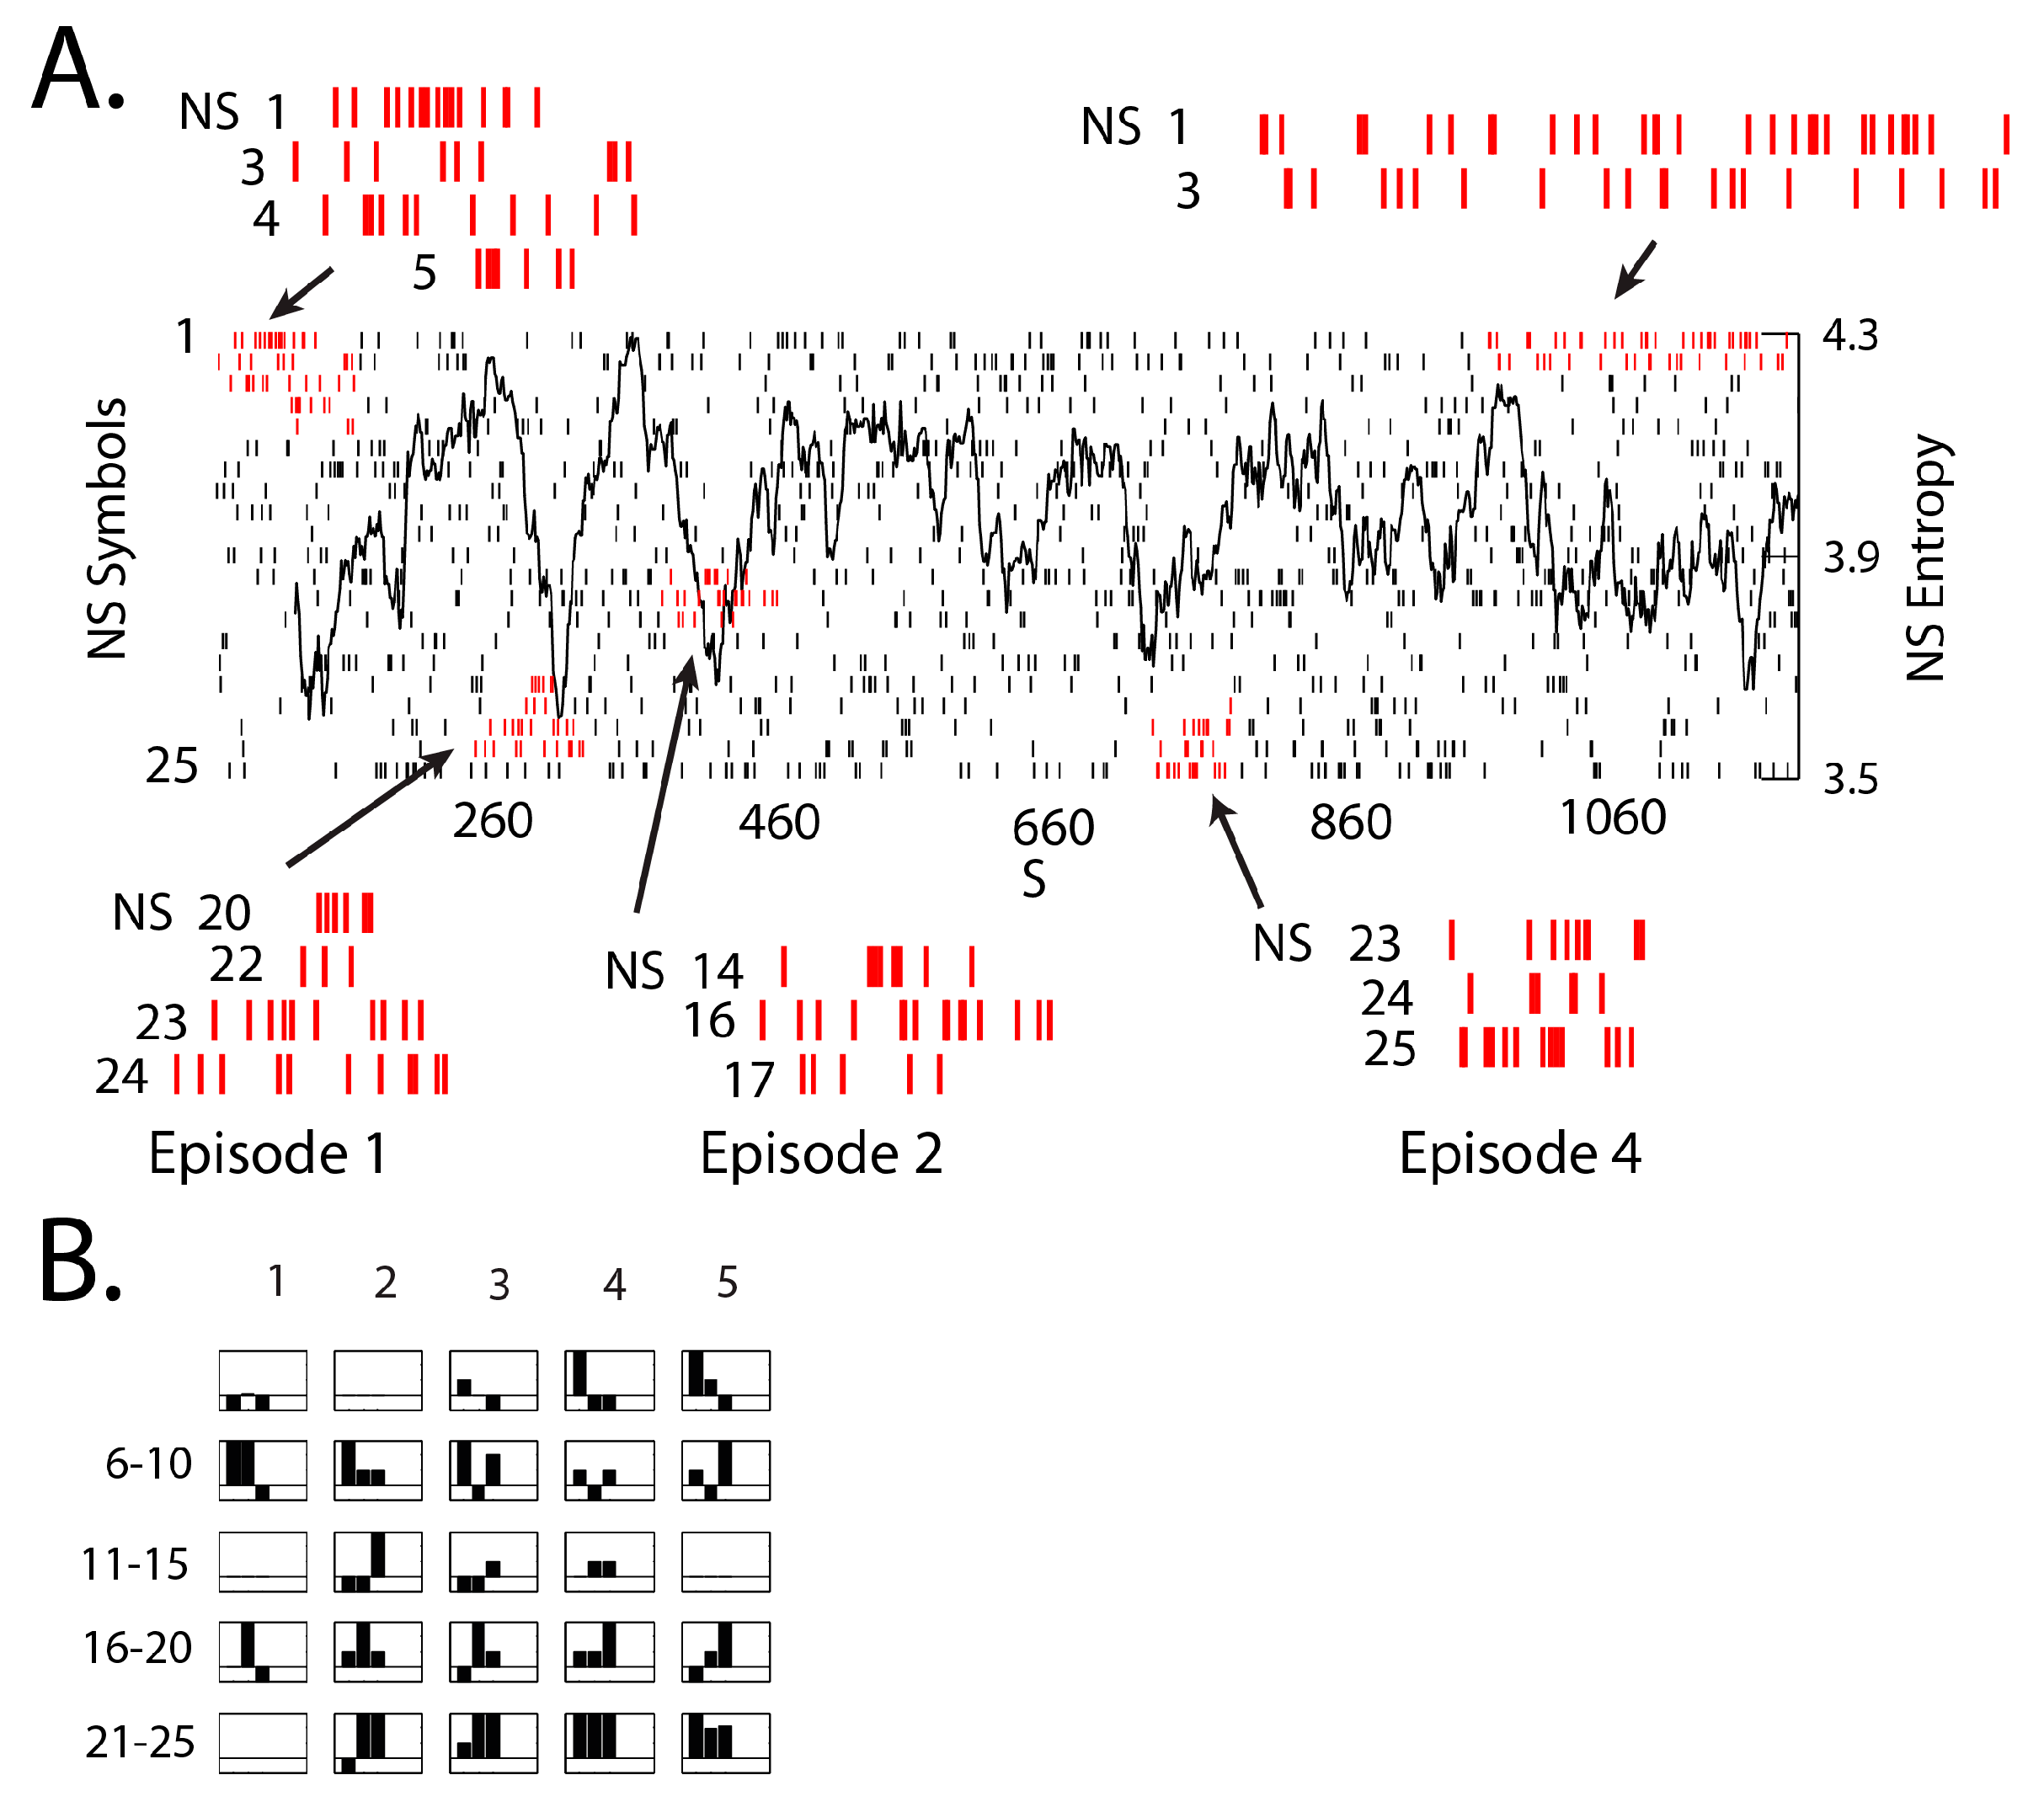
The NSH profiles in Figure 4 and Figure 5 indicated that there were intersegment (i.e., Briefing, Scenario and Debriefing), as well as intra-segment regions of increased symbol organization. In this paper, we highlight the changes in the neurodynamic entropy levels that are shown by the line traces. It is important to note, however, that there is useful information in the symbols themselves that relates to the overall EEG power levels of the different members of the team. These relationships can be visualized by plotting the temporal order of each symbol of the NS sequence of a performance (Figure 6). This figure plots the occurrence of each of the 21 symbols during the performance, and shows that the symbol expression is not random, but is punctuated by periods where sets of symbols are more frequent than others. The dominant symbols during five of these periods are expanded around the central figure.
One feature of these symbol groupings was that the symbols in each group were mostly contiguous. This indicates that changes in the power relationships across the team were small during these persistent states, reminiscent of attractor states seen with the submarine navigation teams [25].
A second feature was that the groupings consisted of periods where all team members had high 40 Hz power levels, or periods where all had low power, or periods with intermediate power levels across the team. For instance, during the Briefing and Debriefing segments, NS 1, 3, and 4 predominated, representing periods where most of the team members had below average 40 Hz EEG power. The NS expressions in the Scenario were more variable with NS 20–24 associated with episode 1, NS 14–17 with episode 2 and NS 23–25 with episode 3.

3.3. NSH Decreases Reflect Teams in the Process of Resolving Uncertainty

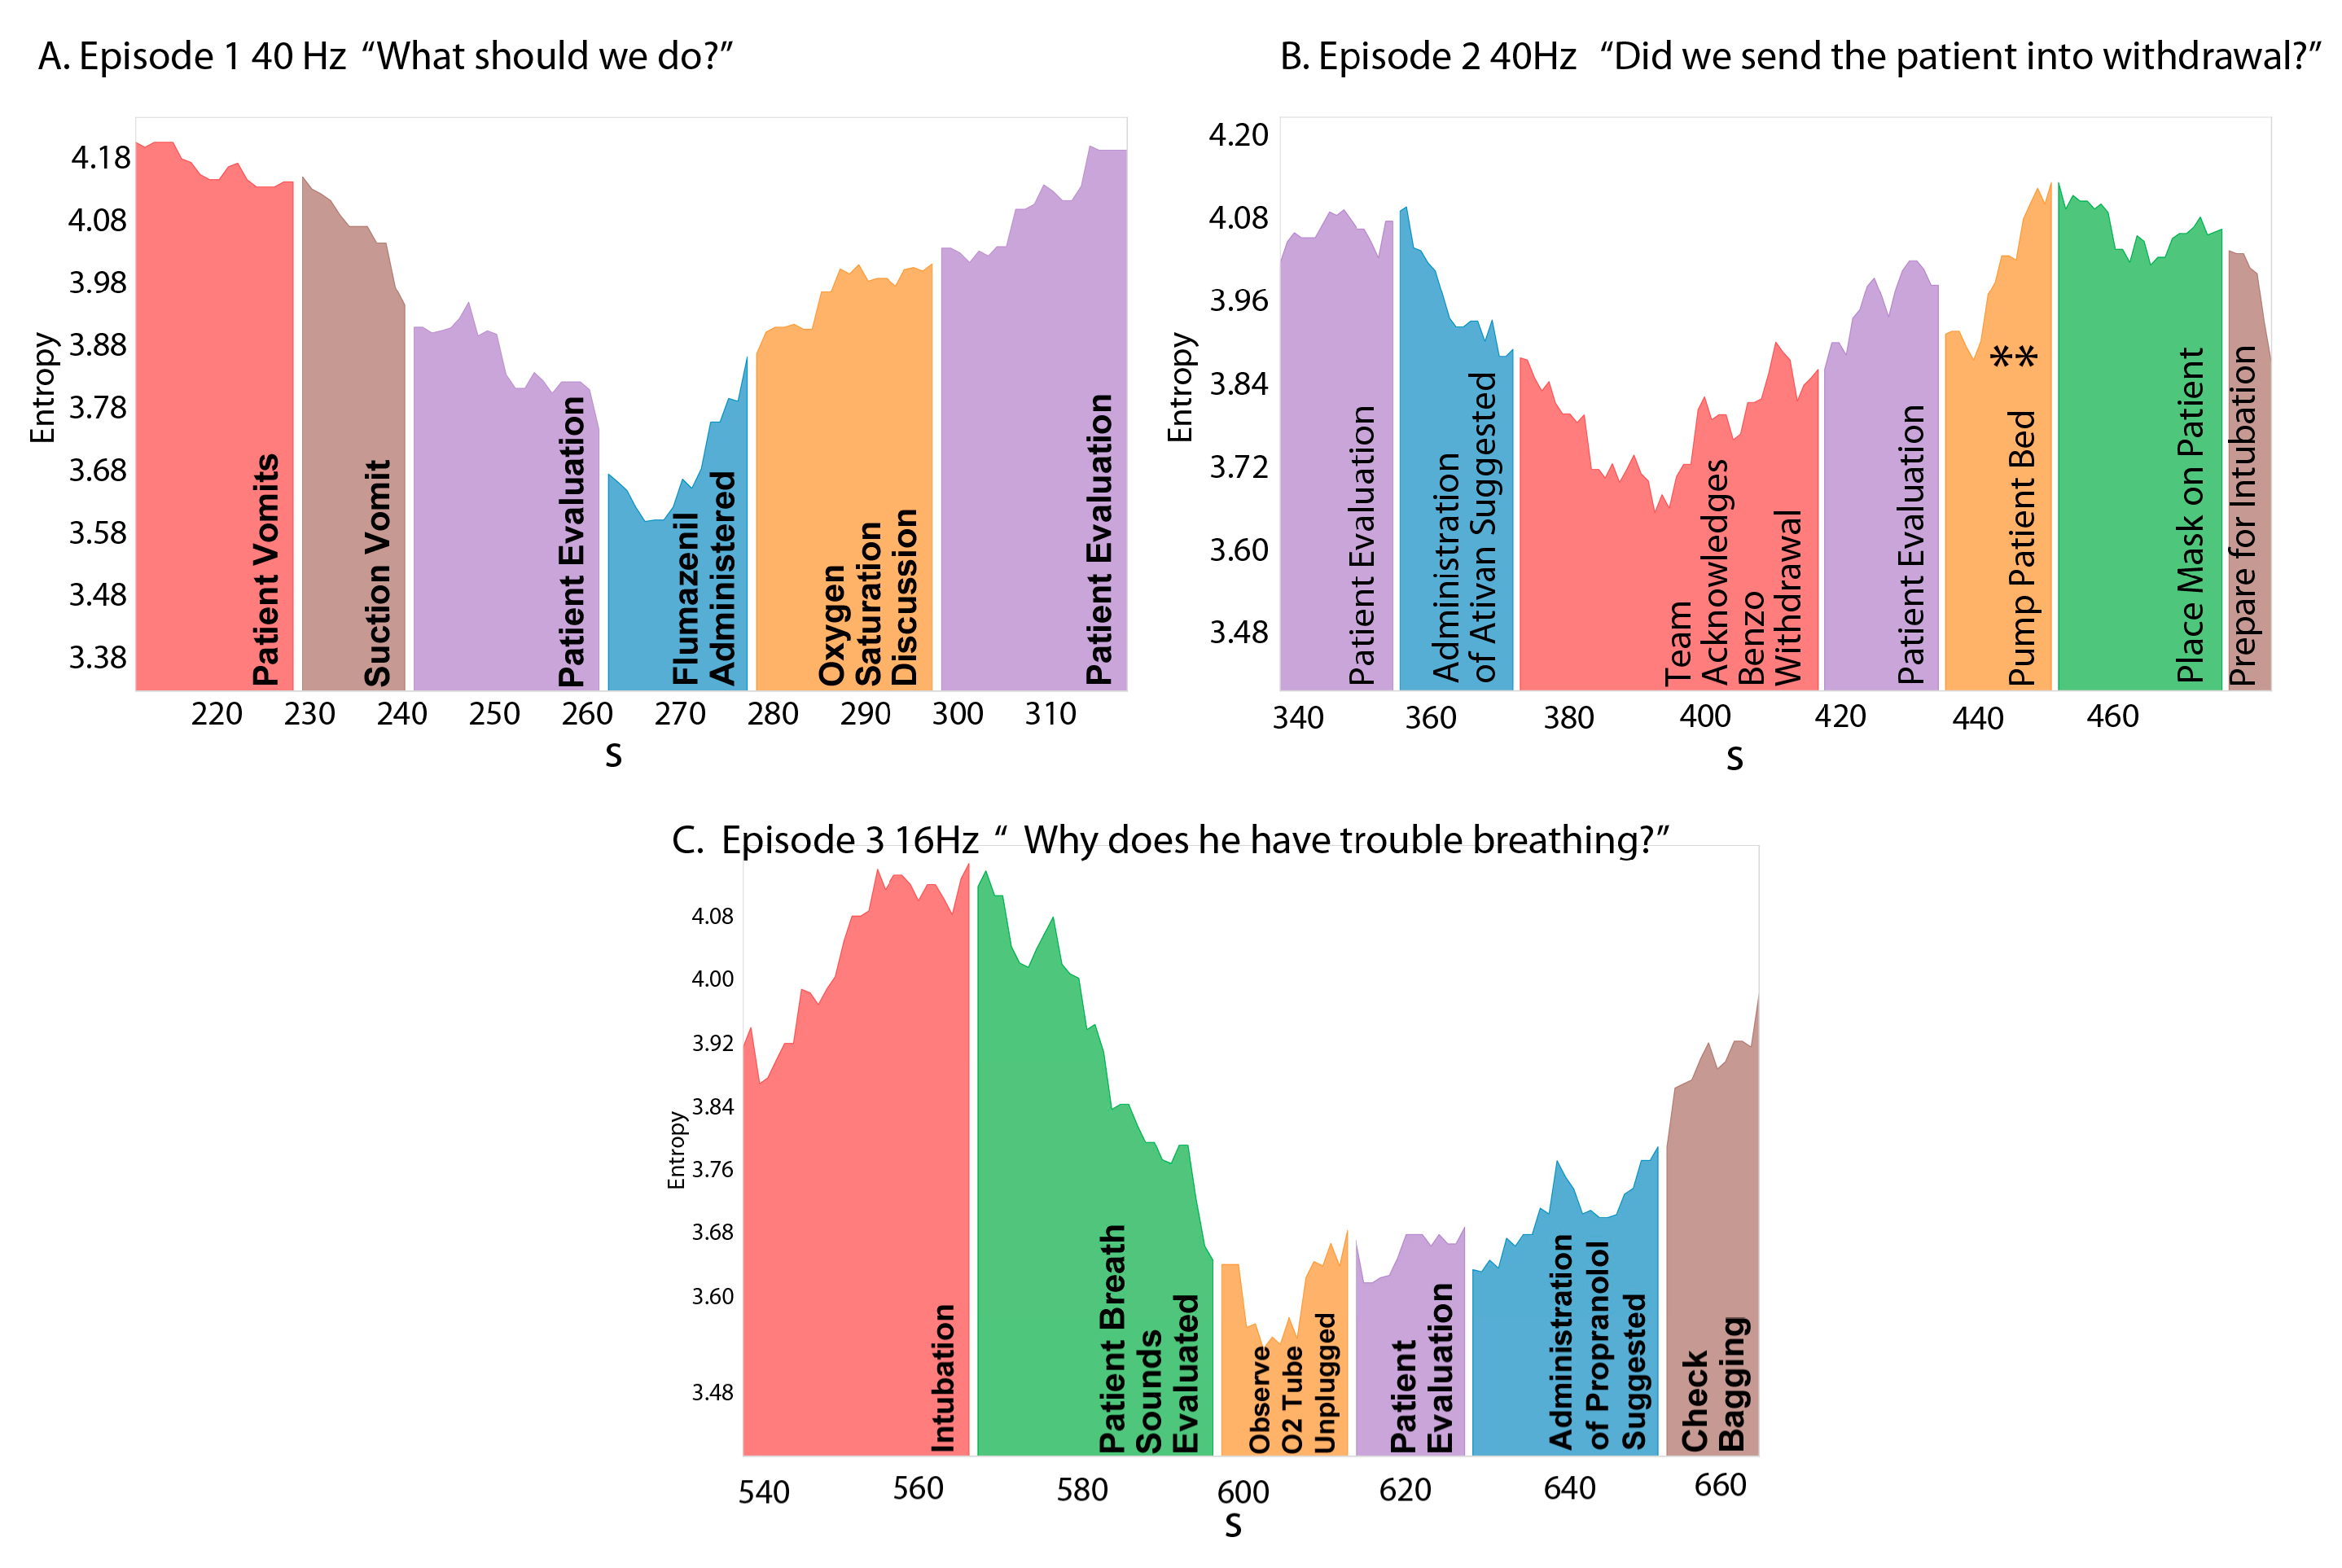
The next series of analyses linked NSH changes with different activities/actions of the team; Episodes 1, 2 and 3 are highlighted in these studies (Figure 7). The first episode of the 40 Hz neurodynamic entropy decrease (215–315 s), Figure 7A, started when the patient vomited (~212 s) initiating a planning discussion among the team members. Suction was started while the team decided to: (a) administer Flumazenil; (b) start fluids and (c) deliver oxygen. Flumazenil is a benzodiazepine receptor antagonist which competes with benzodiazepine for the receptor and reverses the effects of benzodiazepine. The 40 Hz NSH of the team continually dropped during these discussions/decisions, and began to rise after the Flumazenil was administered and fluids were flowing; a few seconds later, the oxygen was started. The team began evaluating the effects of their interventions as the NSH reached earlier levels; the episode lasted 100 s.
The neurodynamic organizations responsible for the decreased entropy were determined from Figure 6 (Episode 1), and most of the team members had high 40 Hz EEG power while NSH was dropping and as NSH rose the 40 Hz power generally decreased.
The second episode of declining 40 Hz NSH began ~340 s when the patient started having seizures as a result of the Flumazenil administration (Figure 7B). The team realized that the patient may have been chronically taking benzodiazepine and was entering withdrawal due to receptor blockage by Flumazenil. At 396 s, Team Member 2 stated: “Get something [benzo] on board if he’s…chronically taking it, we just took it all away from him”. The NSH began rising as the team decided to intubate to maximize ventilation while they searched for Ativan. While Team Member 2 was leading the discussion regarding benzodiazepine withdrawal, the NSH was dropping, and his 40 Hz power levels were high (NS #16 and #17 in Figure 6). Once the team decision was made to intubate the patient (~400 s), Team Member 2’s 40 Hz power levels decreased and remained low, even during the period from 435 to 450 s when he was vigorously pumping up the bed with his right leg to raise the patient for intubation. It is noteworthy that during this period of high physical activity, the NSH continued to rise, suggesting that EMG was not the constitutional contributor to the decreased NSH in this episode.
The third episode of decreased NSH began with the intubation of the patient by Team Member 1 (540–660 s) (Figure 7C). For this figure, the NSH decreases are shown for 16 Hz, as from Figure 5 this was the period of the lowest NSH at 16 Hz. During intubation, the NSH rose and the 16 Hz EEG power levels of Team Member 1 remained around average values; i.e., the intubation process was not associated with low NSH. The patients’ breathing remained wheezy until the team realized the oxygen tube was unplugged. After re-attaching the line, the NSH began to rise as the team discussed how to control the continuing seizures.

3.4. Neurodynamic Organizations

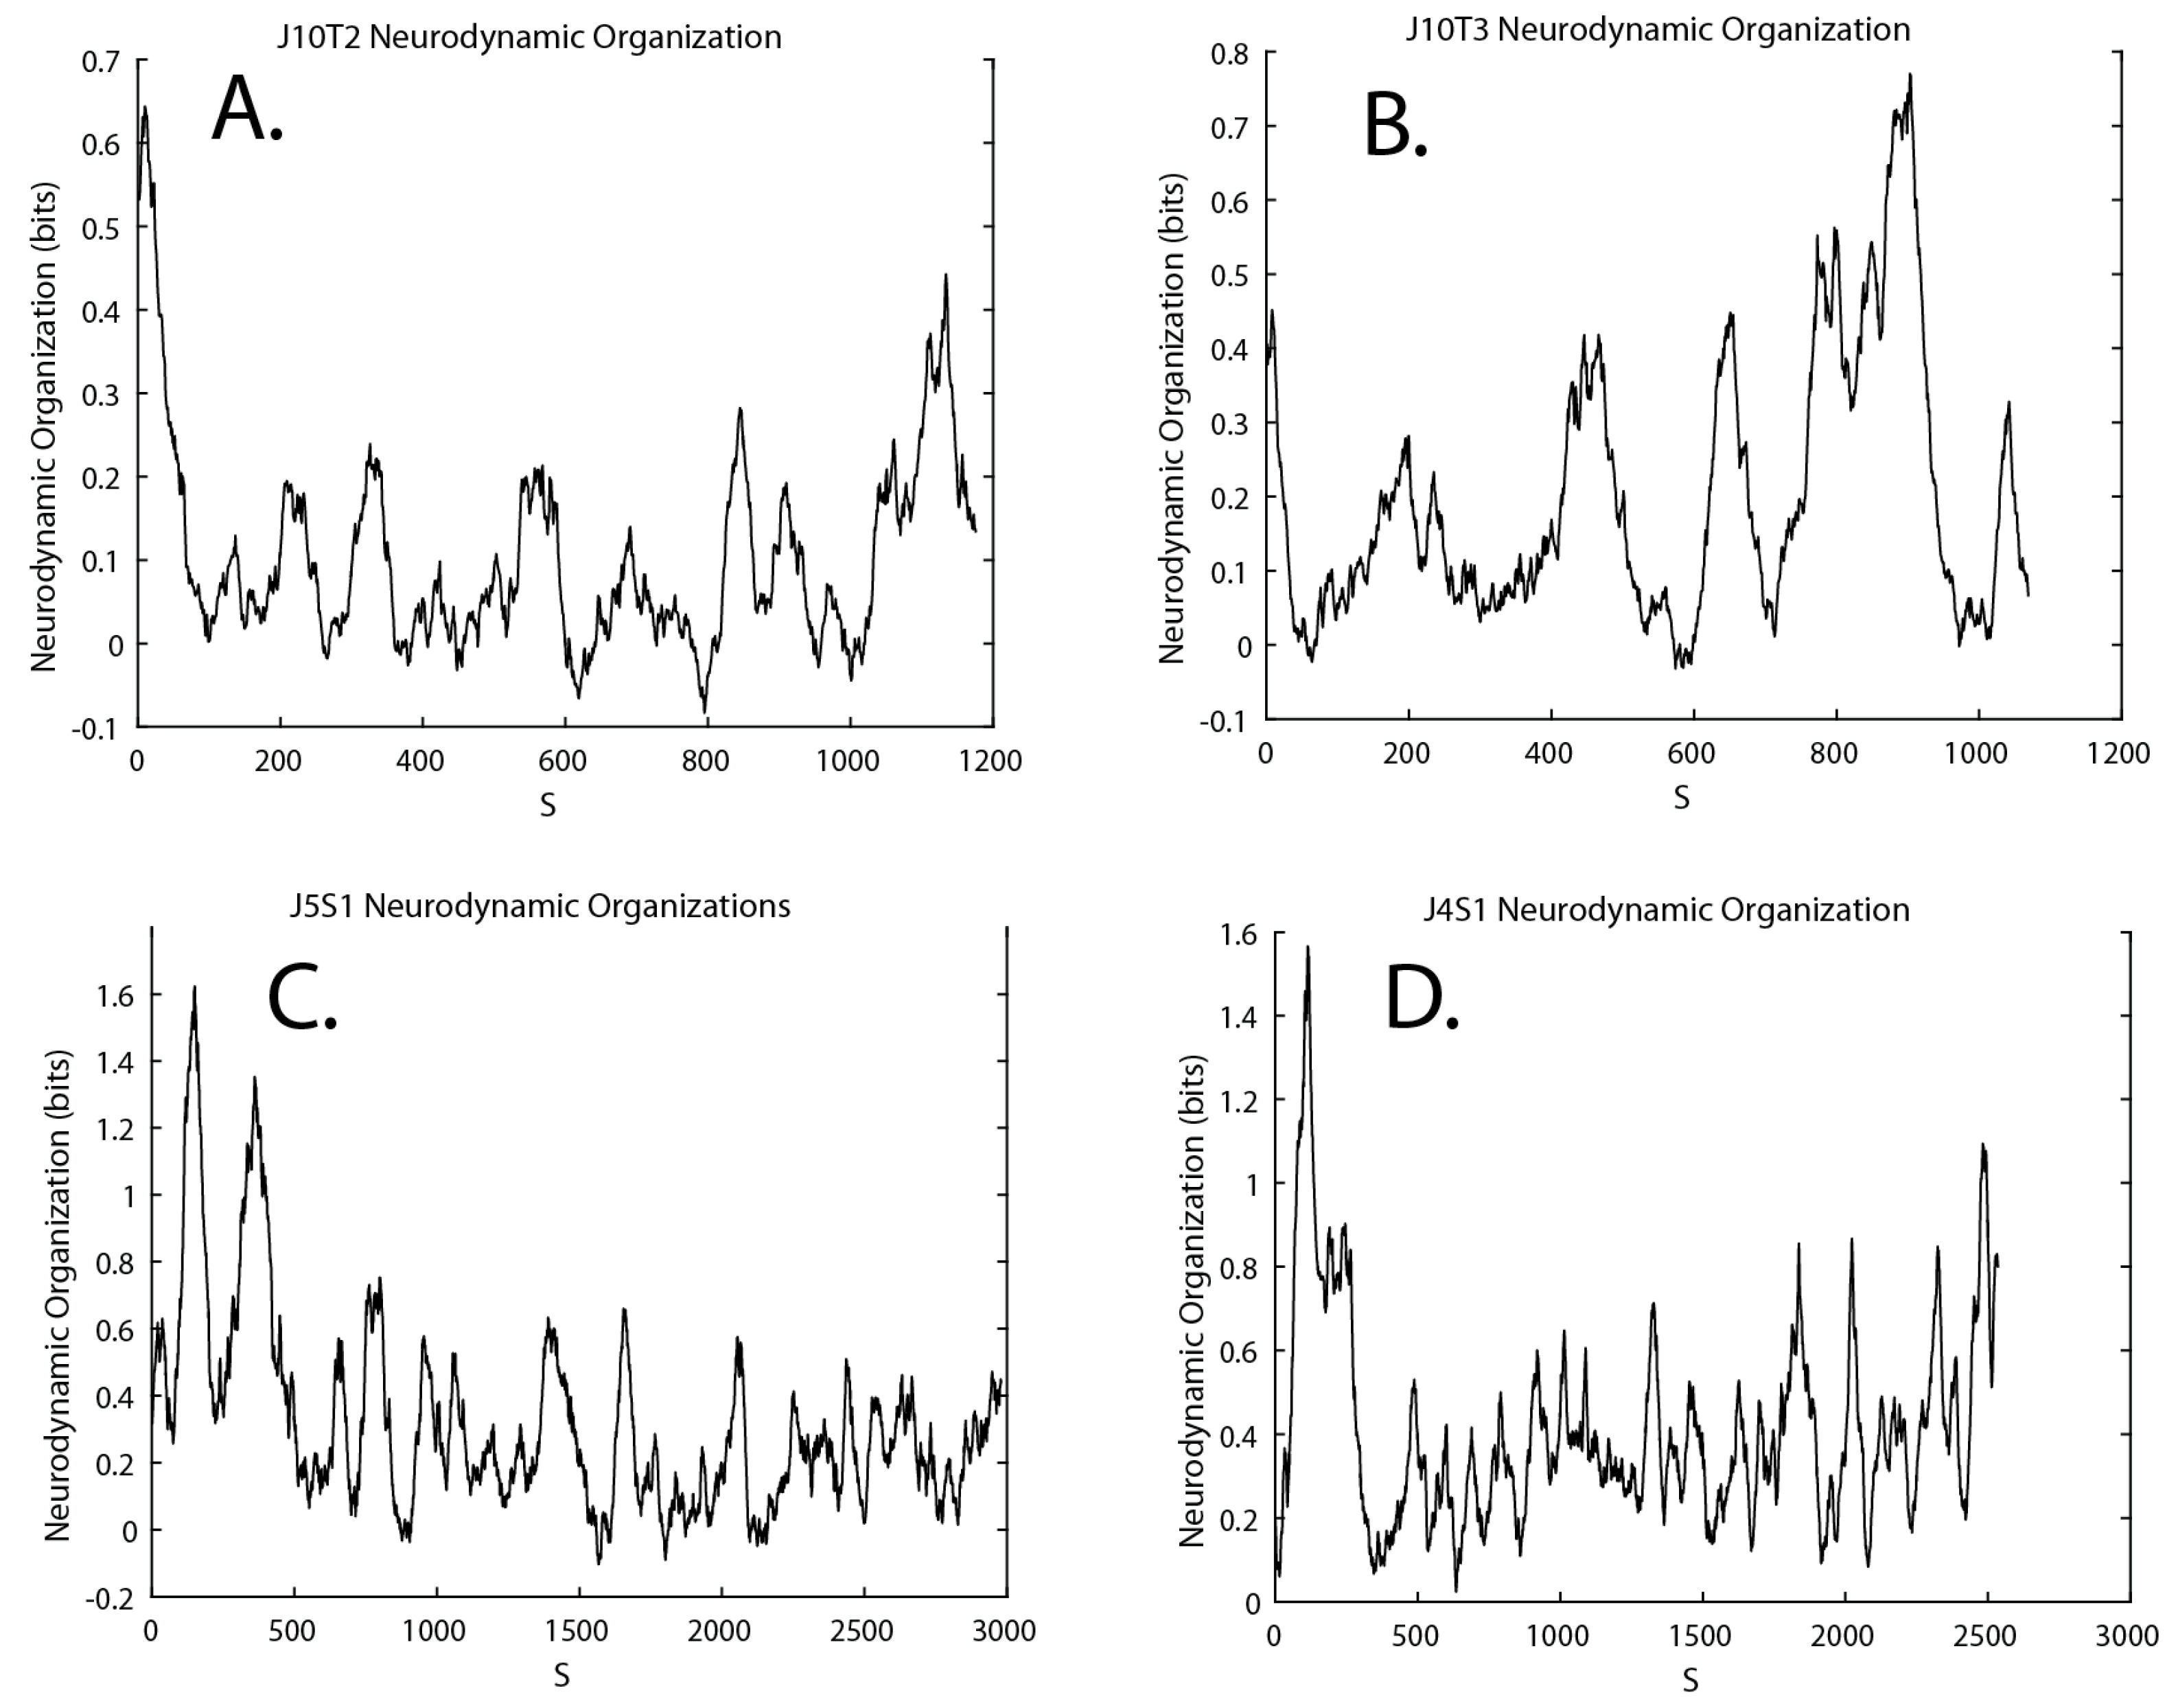
The prior studies demonstrated important properties of team neurodynamics in that decreased NS entropy equals less uncertainty about the state of the team and equals more neurodynamic organization. To better convey these relationships, the periods of increased neurodynamic organization can be expressed in positive terms by subtracting the NS entropy from the entropy obtained when the symbol streams were randomized prior to calculating the entropy levels. These quantitative estimates of the team’s neurodynamic organization (NDΩ) reflect periods of increased order where fewer symbols are being expressed. The NDΩ for four healthcare teams are shown in Figure 8, with a performance highlighted in this paper in Figure 8A. Across the different performances, the NDΩ was generally higher in the Briefing and Debriefing segments than in the Scenarios, a finding similar to what we observed in submarine navigation teams [15].

4. Discussion

The emerging picture of teams from these and previous studies is one of evolving dynamics that are continually punctuated by small and large fluctuations as teams encounter and resolve disturbances to their normal rhythms. Neurodynamic organizational models capture these changing dynamics across levels and time scales of teamwork and relate them to observable performance behaviors indicative of team performance in ways that appear applicable to a variety of teamwork situations.
In this study, we have shown that healthcare teams performing simulations based on patient ventilation show neurodynamic entropy fluctuations of similar magnitudes and durations as those observed previously with submarine navigation teams. The origin of these fluctuations centers on the establishment and persistence of temporal organizations where the frequency-specific EEG power relationships between team members transiently stabilize. These relationships are not synchronized in the sense of frequency or phase locking where each team member shares the same frequency, phase and topology of a particular EEG rhythm, i.e., the rhythmic patterns do not necessarily need to coincide or overlap exactly.
A framework for understanding the meso- and micro-scale temporal dynamics of teams emerges from the neurodynamically linked ideas of brain wave synchronization/entrainment [32], and across-brain social couplings [33]. One possibility is that the rhythm of the team had been captured or entrained by the task situation/events and/or the actions of other members. Entrainment has been defined by [34] (p. 149), as the “…process in which the rhythms displayed by two or more phenomena become synchronized, with one of the rhythms often being more powerful or dominant and capturing the rhythm of the other”.
It is well established that some electrical rhythms of the brain synchronize to external repetitive sounds/images [35,36]. These synchronizations can be a simple reflection of the periodicity of the stimulus sequence, more complex rates of coordinated percepto-motor behaviors like the production of, or listening to music, finger tapping, or sentence comprehension [37,38], or may include very complex within and across-brain rhythms as teams synchronize with the task and other team members. Hasson et al. [39] extended these ideas to more complex situations by having individuals view scenes from a movie. As the video unfolded, the embedded visual and auditory elements entrained the subjects’ cognition with inter-subject synchronizations occurring in the visual, auditory and cortical brain regions. Such synchronization has been repeatedly seen with subjects viewing movie clips [40], especially when those clips contained emotionally rich scenes [41].
Our studies point to teams undergoing neurodynamic organizations during similar emotionally laden-situations, i.e., when there was the need for the team to resolve uncertainty or make a decision. This was primarily seen with gamma oscillations, which have been proposed to be important mechanisms for active maintenance of working memory information [20].
An increase in alpha rhythm power, termed event-related synchronization (ERS), reflects cortical inhibition in the brain regions that are task-irrelevant or potentially interfering processes, i.e., brain regions not directly involved in responding to a stimulus. The decrease in alpha amplitude/power reflects release from inhibition with the magnitude of ERD reflecting the degree of cortical activation [18]. Alpha and gamma frequency oscillations also occur in the same brain regions and interact with each other through cross-frequency coupling in a complex relationship, such that when there is extensive cortical activation (high alpha band levels), gamma rhythm-driven working memory is suppressed [20]. The negative correlation between alpha power and gamma power shown in Figure 3B likely reflects this cross-frequency coupling.
The detailed dynamics of the team shown in Figure 7, where neurodynamic organization increases during periods of uncertainty and decreases once the uncertainty is resolved, are consistent with previous studies with submarine navigation teams indicating that the largest neurodynamic organizations occurred during stressful periods [15,16,25].
These studies expand the potential usefulness of neurodynamic symbols as intermediate representations of team function, by showing that similar principles are operational across multiple teams performing in multiple domains. In this regard, it is worth noting that while the overall principles of team neurodynamics are similar across high school problem-solving, submarine navigation and healthcare teams, differences are seen in the relative proportion of NDΩ in the alpha, beta and gamma frequency bands. The map navigation task performed by high school students is rich in mental imagery, as one student uses speech and gestures to help a second student navigate a path through landmarks on a map. This task primarily results in beta and gamma neurodynamic organizations [22]. The activity level and crew size of submarine navigation teams requires rapid transfer and integration of information across a team whose members hold different pieces of information; these dynamics primarily resulted in alpha and gamma neurodynamic organizations. Finally, the healthcare teams work more from a shared knowledge base and are involved in dynamic problem solving; here, the NDΩ in the gamma band predominates. While there are exceptions to these generalizations, overall, they suggest that the nature of the task ‘recruits’ specific forms of neurodynamic coordination, perhaps providing an avenue for more precise training activities designed to enhance specific NDΩ skills.

5. Conclusions

The similarities in the neurodynamics of healthcare and submarine navigation teams suggests that team neurodynamics may be a fundamental component of teamwork, providing a quantitative framework that may enable comparisons to be made across different kinds of teams, tasks, missions, platforms and environments. These studies may have particular relevance for healthcare teams, where professionals are continually plagued by uncertainty when attending to patients [42]. In particular, a team’s neurodynamics may provide an opportunity to monitor uncertainty in healthcare teams in near real-time.

Acknowledgments

The authors thank the participating staff and students of the Order of Saint Francis Hospital community for their logistical and technical support for these studies. The studies were supported in part by the JUMP Foundation for Simulation Research and the Defense Advanced Research Projects Agency under contract W31P4QC0166.

Author Contributions

All authors helped conceive, design and perform the experiments; R.S. and T.G. analyzed the data and wrote the paper. A.W.-D and D.H. reviewed the manuscript and provided the logistical support and space for the experiments. All authors have read and approved the final manuscript.

Conflicts of Interest

The authors declare no conflict of interest. The funding sponsors had no role in the design of the study; in the collection, analyses, or interpretation of data; in the writing of the manuscript, and in the decision to publish the results.

Glossary of Terms

Neurodynamic Symbols (NS)symbolic representations of the momentary EEG power levels of a neurodynamic marker for each team member
Neurodynamic Symbol States (NSS)a collection of NS that together describe a team performance
Neurodynamic Data Streams (NDS)the second-by-second concatenated sequences of NS that temporally span a task performed by the team
Neurodynamic Entropy (NSH)a quantitative measure of the distributions of NS in a NDS when examined over a moving window of time, often 60–100 s
Neurodynamic Organization (NDΩ)a quantitative estimate of organization reflecting periods of increased neurodynamic order. NDΩ is calculated by subtracting the Shannon entropy of the NDS obtained over a 60 s or 100 s moving window from the entropy of the NS stream after it has been randomized (i.e., NDΩ = NSH random − NSH)

References

  1. Cooke, N.J.; Gorman, J.C.; Kiekel, P. Communication as team-level cognitive processing. In Macrocognition in Teams; Letsky, M.P., Warner, N.W., Fiore, S.M., Smith, C.A.P., Eds.; Ashgate Publishing Ltd.: Burlington, VT, USA, 2008. [Google Scholar]
  2. Schippers, M.; Roebroeck, A.; Renken, R.; Nanetti, L.; Keysers, C. Mapping the information flows from one brain to another during gestural communication. Proc. Natl. Acad. Sci. USA 2010, 107, 9388–9393. [Google Scholar] [CrossRef] [PubMed]
  3. Caetano, G.; Jousmaki, V.; Hari, R. Actor’s and observers primary motor cortices stabilize similarly after seen or heard motor actions. Proc. Natl. Acad. Sci. USA 2007, 104, 9058–9062. [Google Scholar] [CrossRef] [PubMed]
  4. Shockley, K.; Santana, M.-V.; Fowler, C.A. Mutual interpersonal postural constraints are involved in cooperative conversation. J. Exp. Psychol. Hum. Percept. Perform. 2003, 29, 326–332. [Google Scholar] [CrossRef] [PubMed]
  5. Anders, S.; Heinzle, J.; Weiskopf, N.; Ethofer, T.; Haynes, J. Flow of affective information between communicating brains. Neuroimage 2011, 54, 439–446. [Google Scholar] [CrossRef] [PubMed]
  6. Menoret, M.; Varnet, L.; Fargier, R.; Cheylus, A.; Curie, A.; des Portes, V.; Nazir, T.A.; Paulignan, U. Neural correlates of non-verbal social interactions: A dual-EEG study. Neurophyschologia 2014, 55, 85–91. [Google Scholar] [CrossRef] [PubMed]
  7. Gardezi, F.; Lingard, L.; Espin, S.L.; Whyte, S.; Orser, B.; Baker, G.R. Silence, power and communication in the operating room. J. Adv. Nurs. 2009, 65, 1390–1399. [Google Scholar] [CrossRef]
  8. Tognoli, E.; Kelso, J.A. The coordination dynamics of social neuromarkers. arXiv, 2015; arXiv:1310.7275. [Google Scholar]
  9. Palva, J.M.; Zhigalov, A.; Hirvonen, J.; Korhonen, O.; Linkenkaer-Hansen, K.; Palva, S. Neuronal long-range temporal correlations and avalanche dynamics are correlated with behavioral scaling laws. Proc. Natl. Acad. Sci. USA 2013, 110, 3565–3590. [Google Scholar] [CrossRef] [PubMed]
  10. Proekt, A.; Banavar, J.R.; Maritan, A.; Pfaff, D.W. Scale invariance in the dynamics of spontaneous behavior. Proc. Natl. Acad. Sci. USA 2012, 109, 10564–10569. [Google Scholar] [CrossRef] [PubMed]
  11. Gilden, D.L.; Thornton, T.; Mallon, M.W. 1/f noise in human scaling. Science 1995, 5205, 1837–1839. [Google Scholar] [CrossRef]
  12. Van Orden, G.C.; Holden, J.G.; Turvey, M.T. Human cognition and 1/f scaling. J. Exp. Psychol. 2005, 134, 117–133. [Google Scholar] [CrossRef] [PubMed]
  13. Butner, J.; Pasupathi, M.; Vallejos, V. When the facts just don’t add up: The fractal nature of conversational stories. Soc. Cogn. 2008, 26, 670–699. [Google Scholar] [CrossRef]
  14. Flack, J.C. Multiple time-scales and the developmental dynamics of social systems. Philos. Trans. R. Soc. B Biol. Sci. 2012, 367, 1802–1810. [Google Scholar] [CrossRef] [PubMed]
  15. Stevens, R.H.; Galloway, T.; Wang, P.; Berka, C.; Tan, V.; Wohlgemuth, T.; Lamb, J.; Buckles, R. Modeling the neurodynamic complexity of submarine navigation teams. Comput. Math. Organ. Theory 2012, 19, 346–369. [Google Scholar] [CrossRef]
  16. Stevens, R.H.; Galloway, T. Modeling the neurodynamic organizations and interactions of teams. Soc. Neurosci. 2015, 11, 123–139. [Google Scholar] [CrossRef] [PubMed]
  17. Hari, R. Action perception connection and the cortical mu-rhythm. Prog. Brain Res. 2006, 159, 253–260. [Google Scholar] [PubMed]
  18. Klimesch, W.; Sauseng, P.; Hanslmayr, S. EEG alpha oscillations: The inhibition-timing hypothesis. Brain Res. Rev. 2007, 53, 63–88. [Google Scholar] [CrossRef] [PubMed]
  19. Klimesch, W. Alpha-band oscillations, attention and controlled access to stored information. Trends Cogn. Sci. 2012, 16, 606–617. [Google Scholar] [CrossRef] [PubMed]
  20. Roux, F.; Uhlhaas, P. Working memory and neural oscillations: Alpha-gamma versus theta-gamma codes for distinct WM information? Trends Cogn. Sci. 2014, 18, 16–25. [Google Scholar] [CrossRef] [PubMed]
  21. Bonnefond, M.; Jensen, O. Gamma activity coupled to alpha phase as a mechanism for top-down controlled gating. PLoS ONE 2015, 10, e012866. [Google Scholar] [CrossRef] [PubMed] [Green Version]
  22. Stevens, R.H.; Galloway, T. Toward a quantitative description of the neurodynamic organizations of teams. Soc. Neurosci. 2014, 9, 160–173. [Google Scholar] [CrossRef] [PubMed]
  23. Fishel, S.R.; Muth, E.R.; Hoover, A.W. Establishing appropriate physiological baseline procedures for real-time physiological measurement. J. Cogn. Eng. Decis. Mak. 2007, 1, 286–308. [Google Scholar] [CrossRef]
  24. Shannon, C.E. Prediction and entropy of printed English. Bell Syst. Tech. J. 1951, 30, 50–64. [Google Scholar] [CrossRef]
  25. Stevens, R.H.; Gorman, J.C.; Amazeen, P.; Likens, A.; Galloway, T. The organizational dynamics of teams. Nonlinear Dyn. Psychol. Life Sci. 2013, 17, 67–86. [Google Scholar]
  26. Likens, A.D.; Amazeen, P.G.; Stevens, R.; Galloway, T.; Gorman, J.C. Neural signatures of team coordination are revealed by multifractal analysis. Soc. Neurosci. 2014, 9, 219–234. [Google Scholar] [CrossRef] [PubMed]
  27. Delorme, A.; Palmer, J.; Onton, J.; Oostenveld, R.; Makeig, S. Independent EEG sources are dipolar. PLoS ONE 2012, 12, e30135. [Google Scholar] [CrossRef] [PubMed]
  28. Yong, X.; Ward, R.K.; Birch, G.E. Facial EMG contamination of EEG signals: Characteristics and effects of spatial filtering. In Proceedings of the IEEE 3rd International Symposium on Communications, Control and Signal Processing (ISCCSP), St. Julians, Malta, 12–14 March 2008.
  29. Baker, D.P.; Amodeo, A.M.; Krokos, K.J.; Slonim, A.; Herrera, H. Assessing teamwork attitudes in healthcare: Development of the TeamSTEPPS® teamwork attitudes questionnaire. Qual. Saf. Health Care 2010, 19, e49. [Google Scholar] [CrossRef] [PubMed]
  30. Oostenveld, R.; Fries, P.; Maris, E.; Schoffelen, J.-M. FieldTrip: Open source software for advanced analysis of MEG, EEG, and invasive electrophysiological data. Comput. Intell. Neurosci. 2011, 2011, 156869. [Google Scholar] [CrossRef] [PubMed]
  31. Delorme, A.; Sejnowski, T.; Makeig, S. Enhanced detection of artifacts in EEG data using higher-order statistics and independent component analysis. Neuroimage 2007, 34, 1443–1449. [Google Scholar] [CrossRef] [PubMed]
  32. Will, U.; Berg, E. Brainwave synchronization and entrainment to periodic stimuli. Neurosci. Lett. 2007, 424, 55–60. [Google Scholar] [CrossRef] [PubMed]
  33. Hasson, U.; Ghazanfar, A.; Glantucci, B.; Garrod, S.; Keysers, C. Brain-to-brain coupling: A mechanism for creating and sharing a social world. Trends Cogn. Sci. 2011, 17, 413–425. [Google Scholar] [CrossRef] [PubMed]
  34. Bluedorn, A.C. The Human Organization of Time: Temporal Realities and Experience; Stanford University Press: Stanford, CA, USA, 2002. [Google Scholar]
  35. Adrian, E.D.; Matthews, B.H.C. The interpretation of potential waves in the cortex. J. Physiol. 1934, 81, 440–471. [Google Scholar] [CrossRef] [PubMed]
  36. Galambos, R.; Makeig, S.; Talmachoff, P.J. A 40-Hz auditory potential recorded from the human scalp. Proc. Natl. Acad. Sci. USA 1981, 78, 2643–2647. [Google Scholar] [CrossRef] [PubMed]
  37. Van Noorden, L.; Moelants, D. Resonance in the perception of musical pulse. J. New Music Res. 1999, 28, 43–66. [Google Scholar] [CrossRef]
  38. Moreno, I.; de Vega, M.; León, I. Understanding action language modulates oscillatory mu and beta rhythms in the same way as observing actions. Brain Cogn. 2013, 82, 236–242. [Google Scholar] [CrossRef] [PubMed]
  39. Hasson, U.; Nir, Y.; Levy, I.; Fuhrmann, G.; Malach, R. Inter-subject synchronization of cortical activity during natural vision. Science 2004, 303, 1634–1640. [Google Scholar] [CrossRef] [PubMed]
  40. Nummenmaa, L.; Gleran, E.; Viinikainen, M.; Jaaskelainen, P.; Hari, R.; Sams, M. Emotions promote social interaction by synchronizing brain activity across individuals. Proc. Natl. Acad. Sci. USA 2012, 109, 9599–9604. [Google Scholar] [CrossRef] [PubMed]
  41. Dmochowski, J.P.; Sajda, P.; Dias, J.; Parra, L. Correlated components of ongoing EEG point to emotionally laden attention—A possible marker of engagement? Front. Hum. Neurosci. 2012, 6, 112. [Google Scholar] [CrossRef] [PubMed]
  42. Wray, C.M.; Loo, L.K. The diagnosis, prognosis and treatment of medical uncertainty. J. Med. Educ. 2015, 7, 523–527. [Google Scholar] [CrossRef] [PubMed]
Figure 1. Neurodynamic symbols and symbol space. (A) sample neurodynamic symbol (NS) showing the power levels of three team members; (B) the twenty-one symbol state space (NSS) that was used for creating the neurodynamic symbol data streams; and (C) the frequencies of the twenty-one symbols at the 40 Hz frequency from the C4 channel for one performance.
Entropy 18 00427 g001
Figure 2. Neurodynamic entropy profile. Neurodynamic entropy profile for a submarine navigation team highlighting the major task segments (i.e., the Briefing, Scenario and Debriefing segments), as well as a period during the Scenario when the submarine almost collided with another vessel.
Entropy 18 00427 g002
Figure 3. NS Entropy levels for different electroencephalographic (EEG) frequencies and sensors. (A) The average NS entropy for the nineteen EEG sensors is plotted vs. the EEG frequency; (B) Neurodynamic entropy (NSH) correlations across different frequency bands. These correlations were made from five team performances; and (C) the NSH correlations across the EEG sensors montage for one team. The sensors are in the order: F7, Fp1, Fp2, F8, F3, Fz, F4, C3, Cz, C4, P8, Pz, P4, T3, T4, O1, O2. The P7 sensor was not included in the analyses for technical reasons.
Entropy 18 00427 g003
Figure 4. Neurodynamic entropy profiles for EEG sensor series during one healthcare simulation. (A) Average 1–40 Hz NSH dynamics for series of different EEG sensors. The F-series shows the average NS entropy for the Fp2, F8, F4, Fz, F3, F7 and FP1 channels. The C-series were averaged from the C3, Cz and C4 channel sites. The P-series were averaged from the P3, Pz, P4, P5 sensors and the O-series were from the averaged from the O1 and O2 channels; and (B) across-frequency plot of the NSH from the O-series channels.
Entropy 18 00427 g004
Figure 5. NSH profiles at (A) 40 Hz; (B) 16 Hz and (C) 10 Hz. These profiles were from the C4 sensor and is the same data set used for Figure 7.
Entropy 18 00427 g005
Figure 6. Symbol distributions associated with major entropy fluctuations at 40 Hz. (A) The second-by-second expressions of each of the NS are shown for the period of the performance; (B) The symbols expressed during periods of low NSH are highlighted around the expression map.
Entropy 18 00427 g006
Figure 7. Session details for neurodynamic entropy decreases. Three simulation episodes are shown around periods of decreasing NSH. The first segment (A) lasted 100 s and began at 215 s of the performance; the second segment (B) lasted 140 s and began at 340 s of the performance; and, the third segment (C) lasted 120 s and began at 540 s of the performance. The captions describe the problem the team was addressing in each segment.
Entropy 18 00427 g007
Figure 8. Neurodynamic organization profiles. The NSH from the performances by (A) team J10T2; (B) team J10T3; (C) team J5S1; and, (D) team J4S1were averaged across all sensors and frequencies and subtracted from the average of similar profiles from NS that were randomized before the entropy was determined.
Entropy 18 00427 g008