Article

Avalanching Systems with Longer Range Connectivity: Occurrence of a Crossover Phenomenon and Multifractal Finite Size Scaling

1
Dipartimento di Scienze Pure ed Applicate, Università degli Studi di Urbino Carlo Bo, 61029 Urbino, Italy
2
INAF-Istituto di Astrofisica e Planetologia Spaziali, 00133 Roma, Italy
3
Istituto Nazionale di Geofisica e Vulcanologia, 00143 Roma, Italy
4
Kavli Institute for Astrophysics and Space Research, Massachusetts Institute of Technology (MIT), Cambridge, MA 02139, USA
5
Royal Belgian Institute for Space Aeronomy, B-1180 Brussels, Belgium
6
Institute of Space Science, 077125 Magurele, Romania
*
Author to whom correspondence should be addressed.
Entropy 2017, 19(8), 383; https://doi.org/10.3390/e19080383
Submission received: 4 April 2017 / Revised: 11 July 2017 / Accepted: 13 July 2017 / Published: 26 July 2017
(This article belongs to the Special Issue Complex Systems, Non-Equilibrium Dynamics and Self-Organisation)

Abstract

:
Many out-of-equilibrium systems respond to external driving with nonlinear and self-similar dynamics. This near scale-invariant behavior of relaxation events has been modeled through sand pile cellular automata. However, a common feature of these models is the assumption of a local connectivity, while in many real systems, we have evidence for longer range connectivity and a complex topology of the interacting structures. Here, we investigate the role that longer range connectivity might play in near scale-invariant systems, by analyzing the results of a sand pile cellular automaton model on a Newman–Watts network. The analysis clearly indicates the occurrence of a crossover phenomenon in the statistics of the relaxation events as a function of the percentage of longer range links and the breaking of the simple Finite Size Scaling (FSS). The more complex nature of the dynamics in the presence of long-range connectivity is investigated in terms of multi-scaling features and analyzed by the Rank-Ordered Multifractal Analysis (ROMA).

1. Introduction

Many natural systems, slowly driven out-of-equilibrium, respond to external disturbances with scale-invariant relaxation processes. Examples may be found for situations related to earthquakes, solar flares, magnetospheric energy deposition during auroral storms, biological evolution, etc. Such scale-invariant features are fingerprints of the emergence of dynamical complexity. In 1987, Bak, Tang and Weisenfeld [1] coined the term Self-Organized Criticality (SOC) to address the spontaneous emergence of a critical dynamics in natural out-of-equilibrium systems. According to Sornette [2], in a broad sense, SOC occurs when a system slowly driven from the outside spontaneously self-organizes into a globally-stationary state, which is characterized by self-similar distributions of relaxation event sizes and by fractal geometrical features. Quoting Watkins et al. [3], the concept of SOC applies to “Slowly driven, avalanching (intermittent) systems with non linear interactions, that display non-trivial power law correlations (cutoff by the system size) as known from ordinary critical phenomena, but with internal, self-organized, rather than external tuning of a control parameter (to a non-trivial value)”. However, it is now understood that some tuning is generally needed for some so-called SOC systems and the low frequency flicker noise behavior, which Bak and colleagues predicted does not really occur for the original model that they suggested. On the other hand SOC is a concept that has many controversial interpretations and even nowadays is not a well-defined physical process in the context of out-of-equilibrium dynamical systems (see [3] and the references therein).
In spite of the interest in SOC on the theoretical side, avalanche dynamics characterizes several real dynamical systems driven out-of-equilibrium. The occurrence of an avalanche dynamics has been invoked in several different physical contexts from earthquakes to solar flares and Earth’s magnetospheric dynamics during geomagnetic storms and substorms (for a review, refer to [4,5,6]). For instance, in the case of solar physics, there is wide evidence of scale invariance for the statistics of solar flares over a wide energy range, from extreme ultra violet (EUV) to soft X-rays (SXR) and hard X-rays (HXR) [6]. This observation has been read as the signature of a near criticality dynamics of the solar corona [7]. Similar properties have been observed in the cases of high latitude energy releases during geomagnetic substorms and the Earth’s magnetosphere response to solar wind changes [8,9,10,11].
The archetypical model for such avalanching phenomena is the well-known sand pile cellular automaton (sand pile CA) [1]. One of the general features of sand pile CA is the common assumption of next-neighbor interactions, thus neglecting the presence of any possible longer range connectivity. On the contrary, in many open out-of-equilibrium real physical systems there is evidence of the formation of coherent structures (as, for instance, flux tubes, in space plasmas), which involves a complex topology and the occurrence of longer range connectivities. Examples can be found in the framework of space plasmas [6,7,8,9,10,11,12,13]. For instance, in solar dynamics one of the most important and studied examples of longer range-connected coherent structures is represented by solar coronal loops, which are arch-like magnetic flux tubes anchored on the underlying photosphere. The magnetic field lines starting from the same footpoint can end at different footpoints, so that longer range connectivities in the solar atmosphere may be crucial in fully characterizing the coronal magnetic field topology and dynamics for flares and coronal mass ejections (CMEs) (see, e.g., [14] and the references therein). Thus, understanding the critical dynamics of some real physical systems requires the inclusion of longer range connectivities that are not considered in the case of simple archetypical sand pile CA models. Indeed, real complex systems display non-regular structures that are characterized by scale-free connectivity and network topologies. Simulations of the original Bak–Tang–Weisenfeld (BTW) sand pile model [1] on uncorrelated scale-free networks have shown that the structure of the network does not disrupt the scale-free dynamics of the BTW model and that the universality class is dependent on the details of the network structure (see e.g., Marković and Gros [15]). On the other hand, sand pile CA on regular lattices with a certain amount of shortcuts and/or on small world networks displays an avalanche behavior, which is analogous to the mean field prediction [16], so that the effect of shortcuts is analogous to an increase of the system dimensionality and connectivity [17]. In particular, Lahtinen et al. [17] investigated the role that longer range links in small world (see Watts–Strogatz [18]) networks play on the distribution of avalanche size, leading to transition from a non-critical to a critical regime. Moreover, Hoore and Moghimi-Araghi [19] have shown that the effect of adding longer range links in a 2D Abelian BTW sand pile model manifests in the appearance of a secondary power law regime for large avalanches, which is characterized by a steeper scaling exponent depending on the system size. The system size dependence of this secondary scaling exponent is the evidence for multi-scaling (multifractal) features of the avalanching dynamics.
Equilibrium critical phenomena show the existence of an infinite range of scales in which a system is scale invariant. This is strictly valid in the sense of the thermodynamic limit, i.e., N and N / V c o n s t , which implies an infinite system. Conversely, both real and simulated systems near a critical point are of finite size, so that some effects due to the finite size of the system should be expected. In particular, it is reasonable to expect in systems of finite size the emergence of a rounding and shifting of critical singularities, which depends on the linear dimension L and on the correlation dimension [20]. This implies that for a finite system near criticality of linear dimension L, there exists a correction to the scaling, so that experimental and/or simulated data from near-criticality systems of different size L would collapse onto a single characteristic scaling function. This effect is known as the Finite Size Scaling (FSS) effect, and the scaling function enters in the definition of the universality class [20,21,22].
As it occurs in the case of equilibrium critical phenomena, also other near criticality systems are, in principle, expected to obey an FSS ansatz for Probability Distribution Functions (PDFs) of observable quantities [13,23]. Let us consider the probability distribution function P ( x , L ) of measurable quantity x (avalanche size s, time duration T, etc.) and system dimension L, which for systems showing a near criticality dynamics is expected to scale as,
P ( x , L ) x τ x ,
where τ x is the scaling exponent, up to a cut-off scale x c L D x . Here, D x is a scaling exponent characterizing the dependence of the cut-off scale on the system size L. Then, FSS for near criticality systems would predict that,
P ( x , L ) L τ x D x Φ x ( x / L D x )
where Φ x is the scaling function. For real critical systems, the scaling exponent D x is expected to be constant and independent of the size of the local invariant Y = x / L D x . In other words, we are in the presence of simple scale invariance features (mono-fractal behavior). Stochastic sand pile models [24], which imply a redistribution to neighbor sites, have been shown to follow the standard FSS ansatz.
Here, we investigate the effect of the inclusion of longer range connectivity in a simple 1D sand pile model, the stochastic Manna model [24]. This corresponds to moving from lattice simulations to simulations on small-world networks. As we will see, due to the presence of longer range connectivity, we observe the occurrence of a crossover phenomenon in the statistics of the avalanche size s distribution as a function of the fraction of longer range links, implying the appearance of a more complex shape of the PDFs of avalanche size s, which does not follow the standard FSS. By applying the Rank-Ordered Multifractal Analysis (ROMA) [25], we show how the presence of non-local links is associated with the increase of multi-scaling features in the Finite Size Scaling (FSS) ansatz, which manifests in an ROMA spectrum. The motivation of this work is two-fold:
  • to observe the role that a limited number of longer range (non-local) links has on the shape of the PDFs of avalanche sizes; this could be very relevant to discuss some features of the PDFs observed in space plasmas [9] where a complex topology of magnetic field and plasma structures plays a central role in the overall dynamics of the space plasma systems (see, e.g., [26,27]);
  • to investigate the possible lack of a simple FSS and its link with the emergence of multi-scaling features.
However, we note that we do not aim to discuss our results in relationship with the occurrence or not of SOC, but only on the observational side of the effects of the presence of longer range connectivity on the statistics of avalanche features (size s and duration T).
The paper is organized as follows: Section 2 describes the stochastic 1D Manna model and its implementation on the 1D random small world network; Section 3 shows the results of the simulations for different degrees of long range connectivity and the moment and FSS analyses of the observed avalanche statistics; finally, in Section 4, a discussion and the physical relevance of our results are presented.

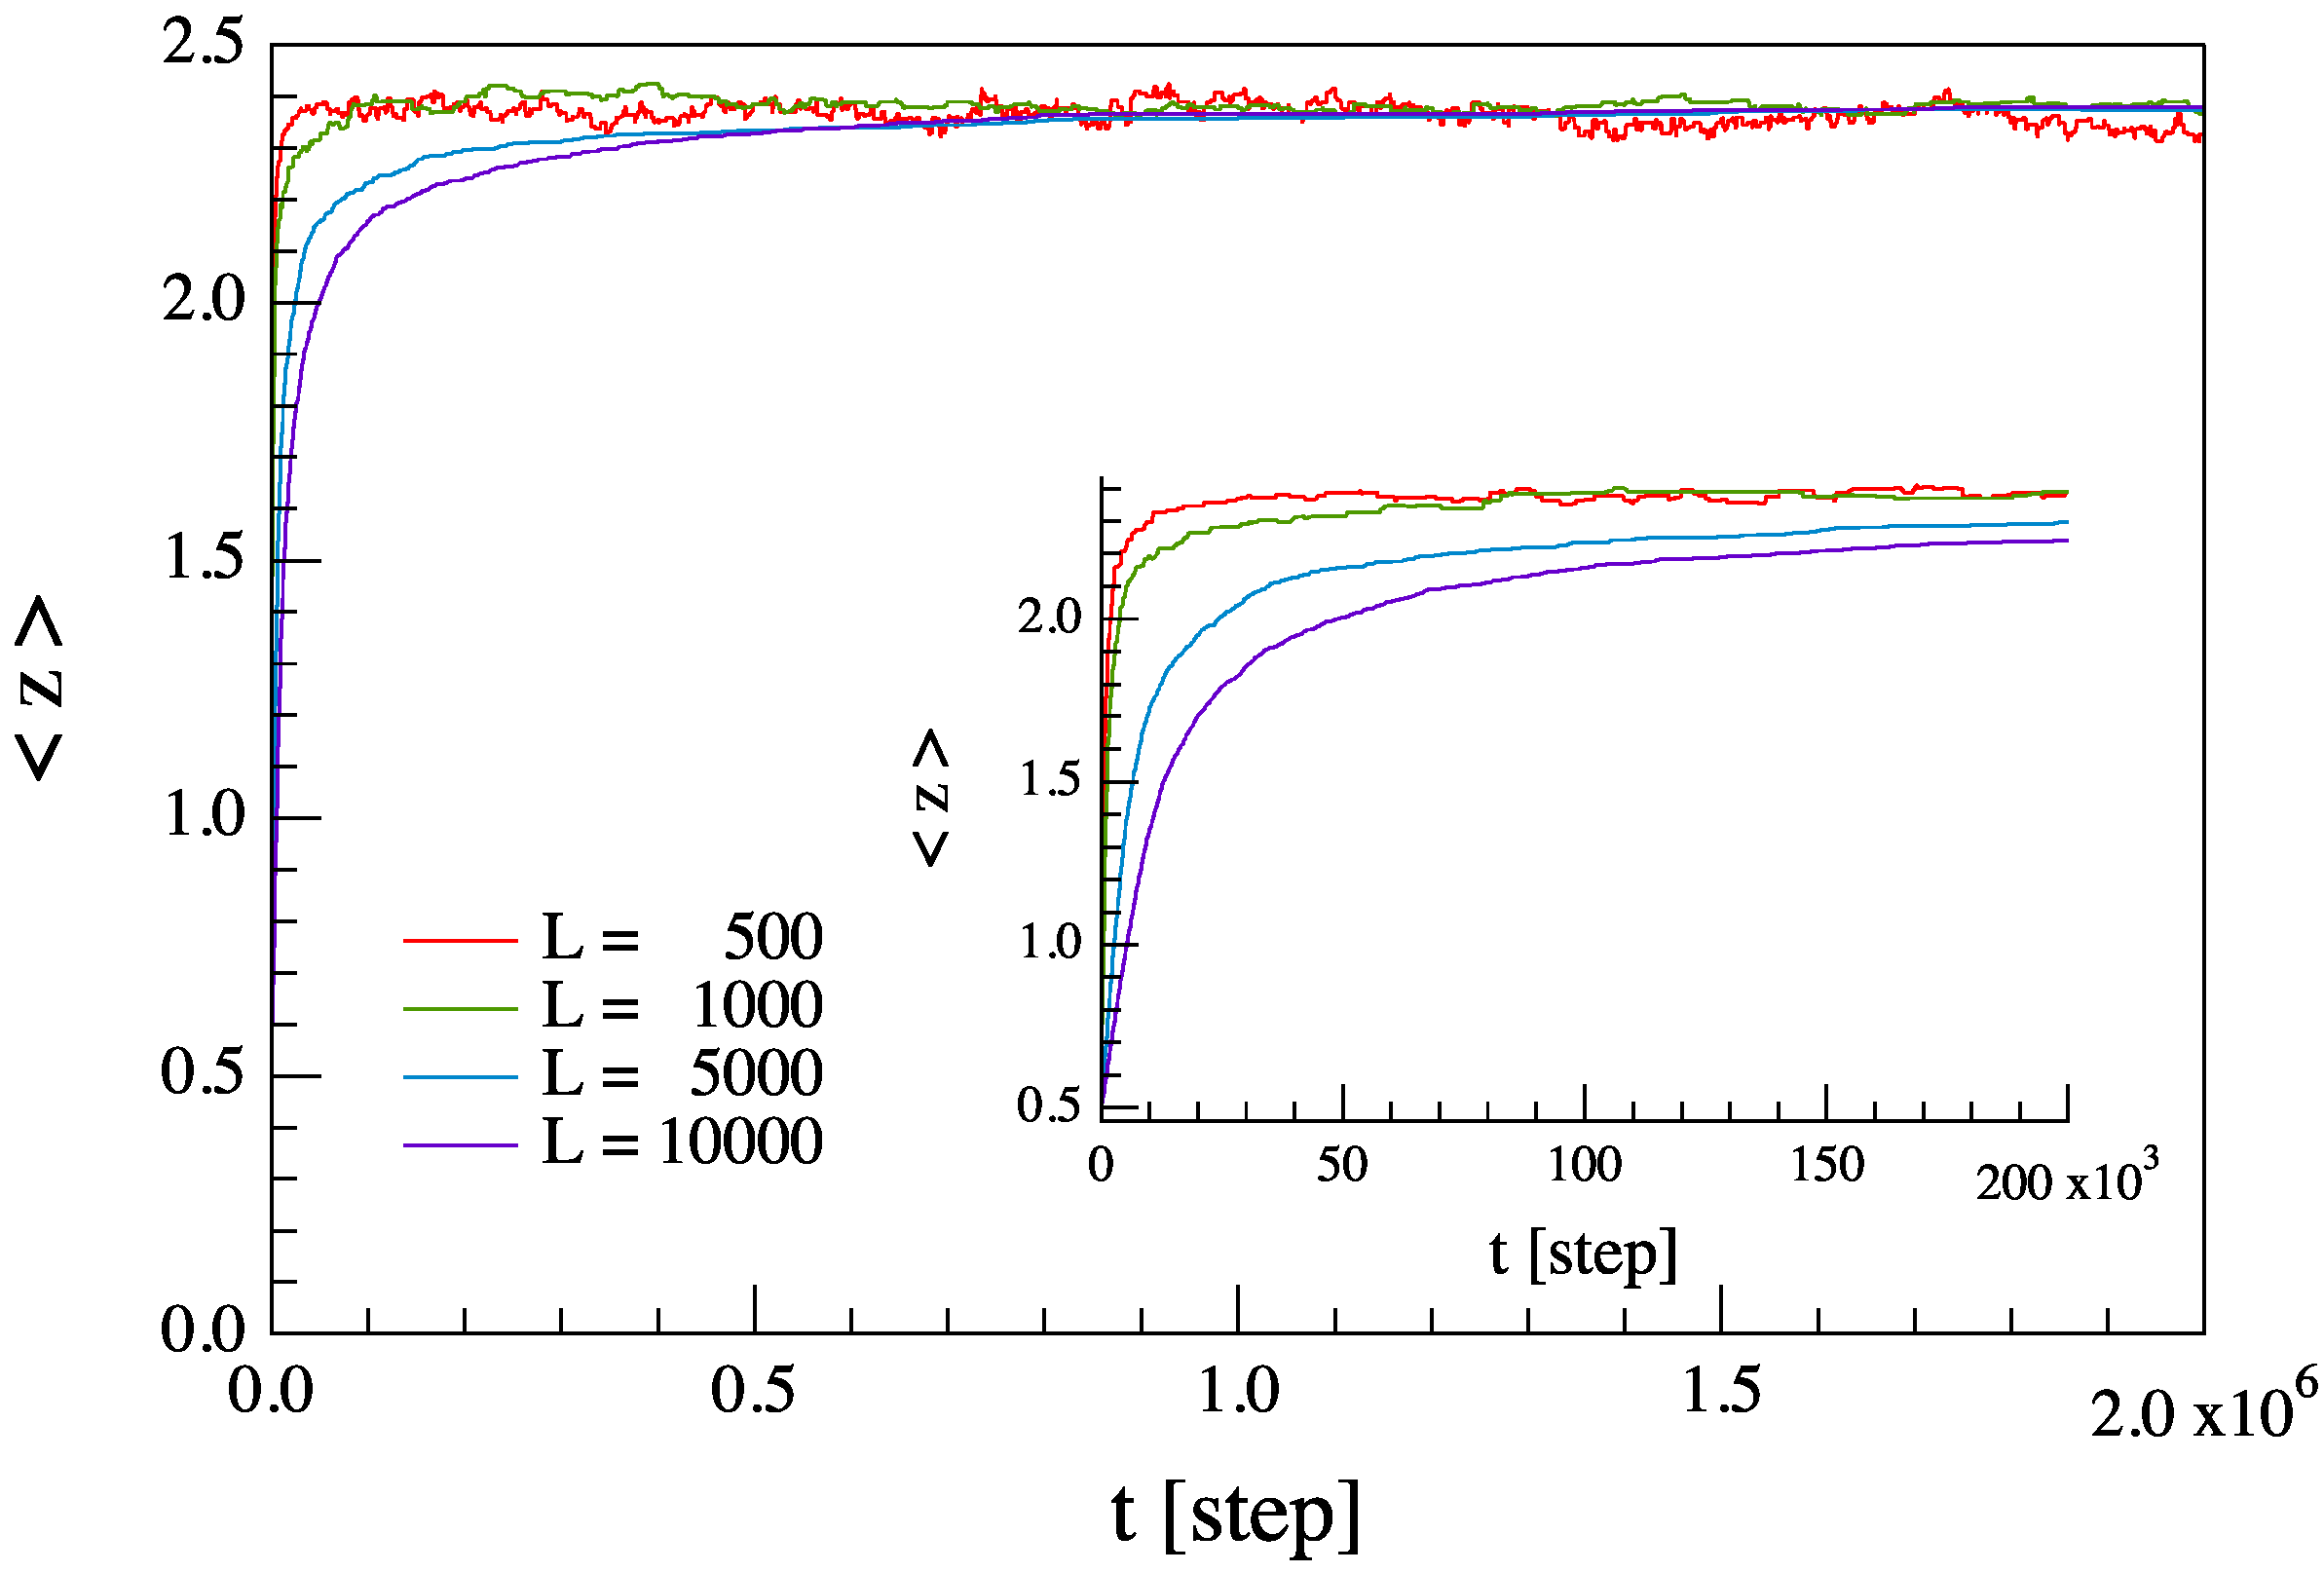
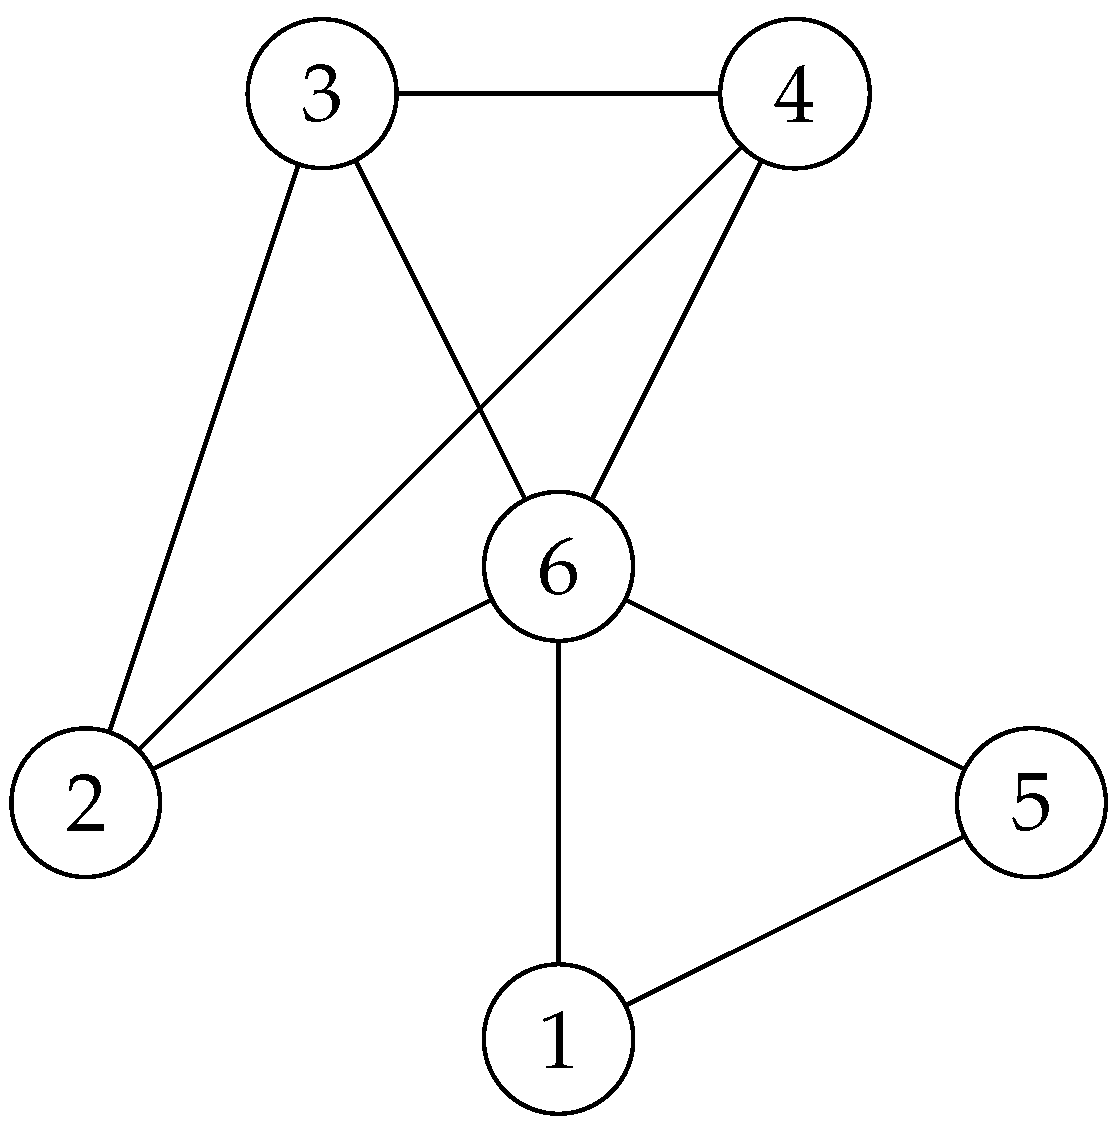
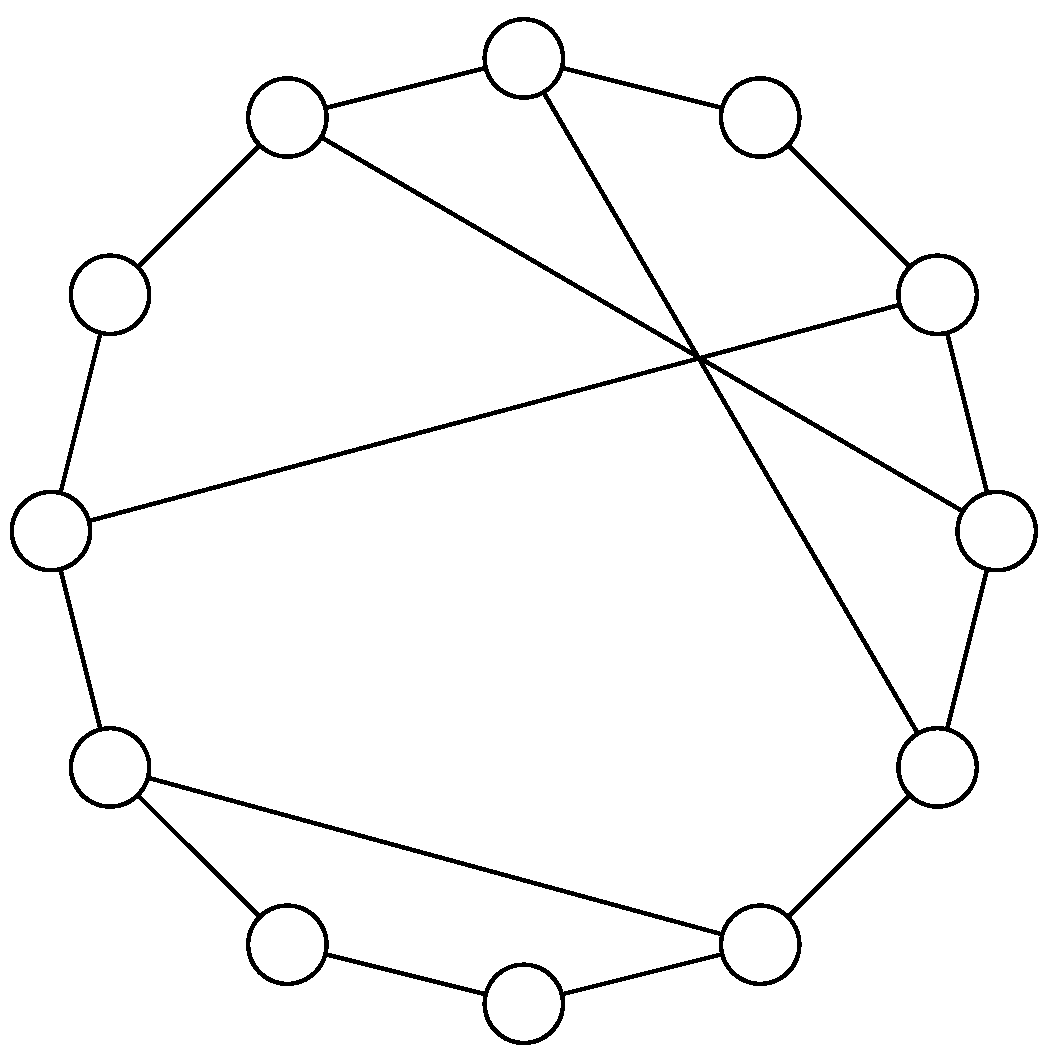
2. The 1D Stochastic Manna Model on Small-World Networks

In this work, we considered the stochastic version of the critical-height sand pile model introduced by Manna [24] and widely studied in the literature. We consider this model because it displays a clear self-organized critical behavior characterized by power law distributions of several quantities (e.g., avalanche size and duration) also in 1D while the classical BTW 1D sand pile model is critical only in the sense that a small perturbation can propagate through the entire system, as occurs for instance in percolative systems [28].
The criticality displayed in the 1D case by the Manna model is a consequence of the different redistribution rules. Indeed, differently from the classical BTW sand pile, the Manna model implies a redistribution of grains that is only on average isotropic with the grains randomly redistributed to the next neighbors. Let us consider a 1D linear lattice consisting of N sites, where each site can assume the values from zero to z c . At each time step, a sand grain is added randomly to one of the N sites, i.e.,
z i ( t ) z i ( t + 1 ) = z i ( t ) + 1 ,
where z i is the number of sand grains at site i and t is a discrete time variable. When one site reaches the maximum (critical) value z c (typically z c = 2 , 4 , , 2 k ), the sand grains in the site are randomly redistributed to the first neighbors. We underline that z c does not necessarily need to be equal to two, as it is for the original Manna model [24]. For instance, if we consider a linear 1D lattice, the redistribution scheme consists of three different choices, which are assumed to be equiprobable:
  • redistribution of the amount z c / 2 to both nearest neighbors, i.e.,
    z i ( t + 1 ) = z i ( t ) z c z i ± 1 ( t + 1 ) = z i ± 1 ( t ) + z c 2
  • redistribution of the amount z c to one of the two neighbors ( i + 1 or i 1 ), randomly chosen, i.e.,
    z i ( t + 1 ) = z i ( t ) z c z i + ( ) 1 ( t + 1 ) = z i + ( ) 1 ( t ) + z c
In our simulations, the Manna model has been implemented on a Newman–Watts-like small world network [29] with range k = 1 and a probability p 0 to introduce stochastic shortcuts. This choice is motivated as follows. A network is defined as a pair G = ( V , E ) comprising a set of V vertices (nodes) together with a set E of edges (links), which are two-element subsets of V, an edge being related with two vertices. In our work, we consider undirected networks without multiple and self-edges, namely simple networks (see Figure 1). In general, the small world network is generated from a regular lattice cutting and rewiring pairs of links in a stochastic way [18]. Because the cutting and rewiring procedure on the 1D lattice may generate isolated clusters and not ensure long-range connectivity, the Newman–Watts version of the small world network is considered here. An example of such a network with a probability p 0 of extra links and periodic boundary conditions is shown in Figure 2.
Here, to study the effect of the presence of long-range connectivity, we construct small world networks in which all sites are locally linked to nearby sites plus a certain number of extra links to non-adjacent sites with the condition that each site does not have more than three links. This is done by choosing randomly a certain number of pairs of non-adjacent sites and connecting them. Thus, we are doing simulations on a Newman–Watts small world network with quenched randomness (see, e.g., Lahtinen et al. [17]). The term quenched randomness refers to the fact that the addition of extra links is done randomly before the simulation is performed. Moreover, the addition of extra links has the effect of generating a random graph (RG), instead of a regular lattice. This procedure could have the effect of altering the linear size of the chain.
The probability p of having a third link can be used as a measure of the relevance of non-local connectivity. Indeed, if we consider the ratio θ between the number of sites with three links, N 3 , and the total number of sites, N t , θ = N 3 / N t , this quantity converges to the probability p in the case of very large networks or in the case of an ensemble of networks with the same p, i.e., θ = p . Thus, we will make all of the discussion on the relevance of long range links using the probability p as a measure of it.
The redistribution rules of the Manna model are then modified to take into account the sites with three links as follows:
  • for sites with two links
    { ( z c / 2 , z c / 2 ) ; ( z c , 0 ) ; ( 0 , z c ) }
  • for sites with three links
    ( z c / 2 , z c / 2 , 0 ) ; ( z c / 2 , 0 , z c / 2 ) ; ( 0 , z c / 2 , z c / 2 ) ( z c , 0 , 0 ) ; ( 0 , z c , 0 ) ; ( 0 , 0 , z c )
Each of these choices is assumed to be equiprobable, so that on average, we can assume that redistribution among the different links is isotropic. Furthermore, we limit the redistribution rules to Expressions (6) and (7) so as to guarantee that an integer number of grains is redistributed to the connected sites for our choice z c = 4 .
We assume open boundary conditions. This is done by fixing the values at the border of the 1D lattice to be zero, i.e., z 0 = z L = 0   t . Sand grains transferred to these sites are lost, i.e., these sites act as sinks in the structure of the small world network for the sand pile dynamics, making the small world network equivalent to a 1D lattice with open boundary conditions and longer range links.
Simulations are performed for different choices of the total number of sites in the range N t [200, 10,000] with a critical threshold value of z c = 4 . Simulations with different choices of the critical threshold value z c ( z c = 2 , 4 and 6) have been done, and non-significative differences have been observed.
We consider two dynamical variables to monitor the dynamics of the system:
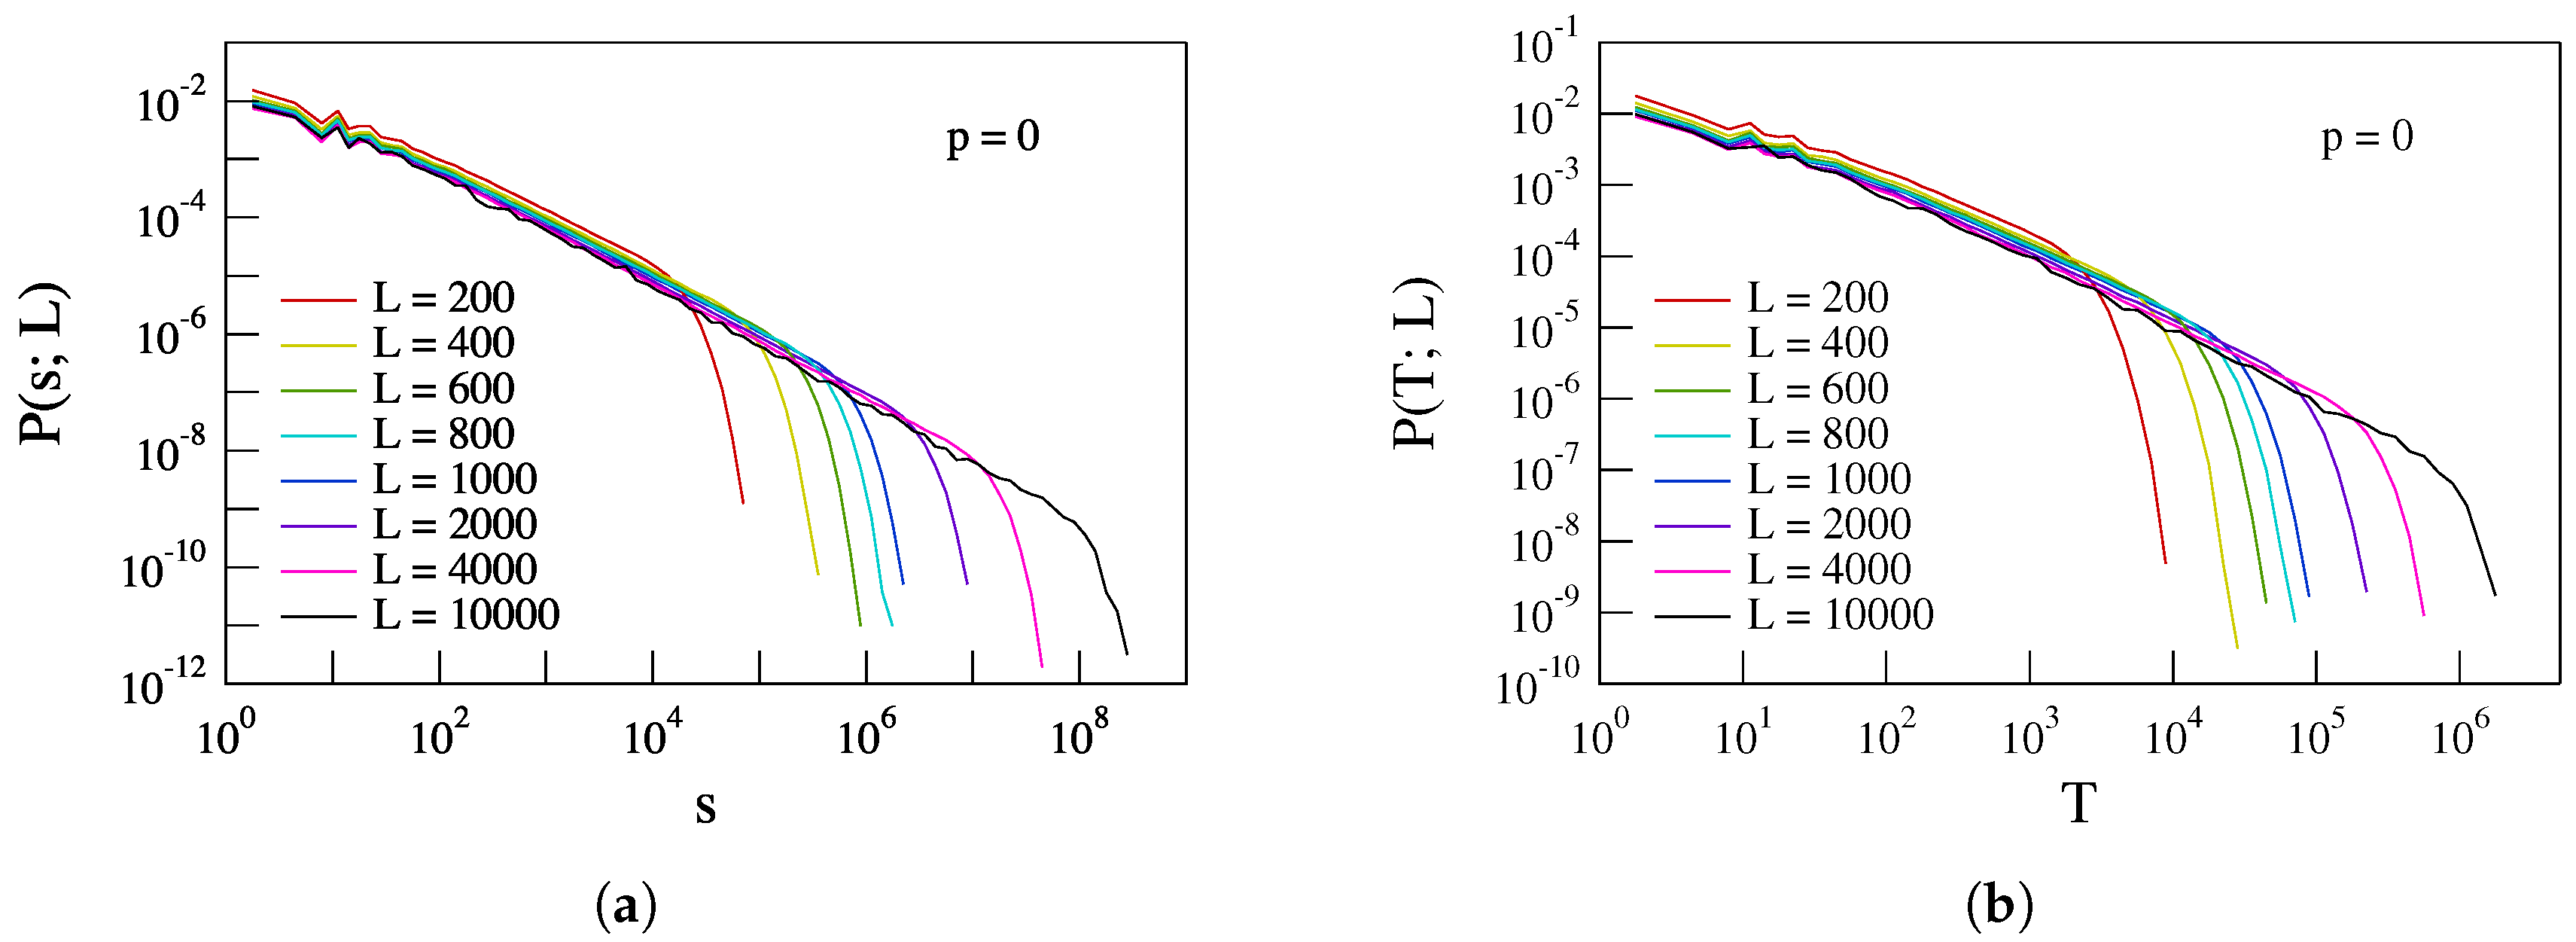
  • the total number s of active sites (sites that have redistributed sand grains), which is taken as a measure of the avalanche dimension;
  • the number of time steps T over which an avalanche takes place, which represents the avalanche lifetime.
To remove the possibility of having spurious effects from a particular configuration of the longer range links, for each choice of the network dimension N t and of the probability p, we perform an ensemble (typically 100) of simulations with different configurations of the longer range links. Furthermore, before collecting data, each of the 100 simulations has been run for enough time steps to be ensure that we have achieved a stationary condition. Figure 3 shows an example of the evolution of the mean number of grains z per site as a function of time during the initialization time interval for different values of the network dimension L in the case of p = 0 . Different initial conditions (zero state, random pre-charged state, etc.) have also been explored to ensure that the results do not depend on them. No differences have been observed in the statistics of the investigated quantities.

3. Results

In this section, we show the results of the simulations of the Manna 1D sand pile model implemented on a small world network. In what follows, we present results from simulations on systems of different sizes in the range N t [200, 10,000] for z c = 4 and for different values of p. The collected statistics for each simulation is of the order of one million events or more for each choice of p and L.

3.1. Avalanche Features Statistics
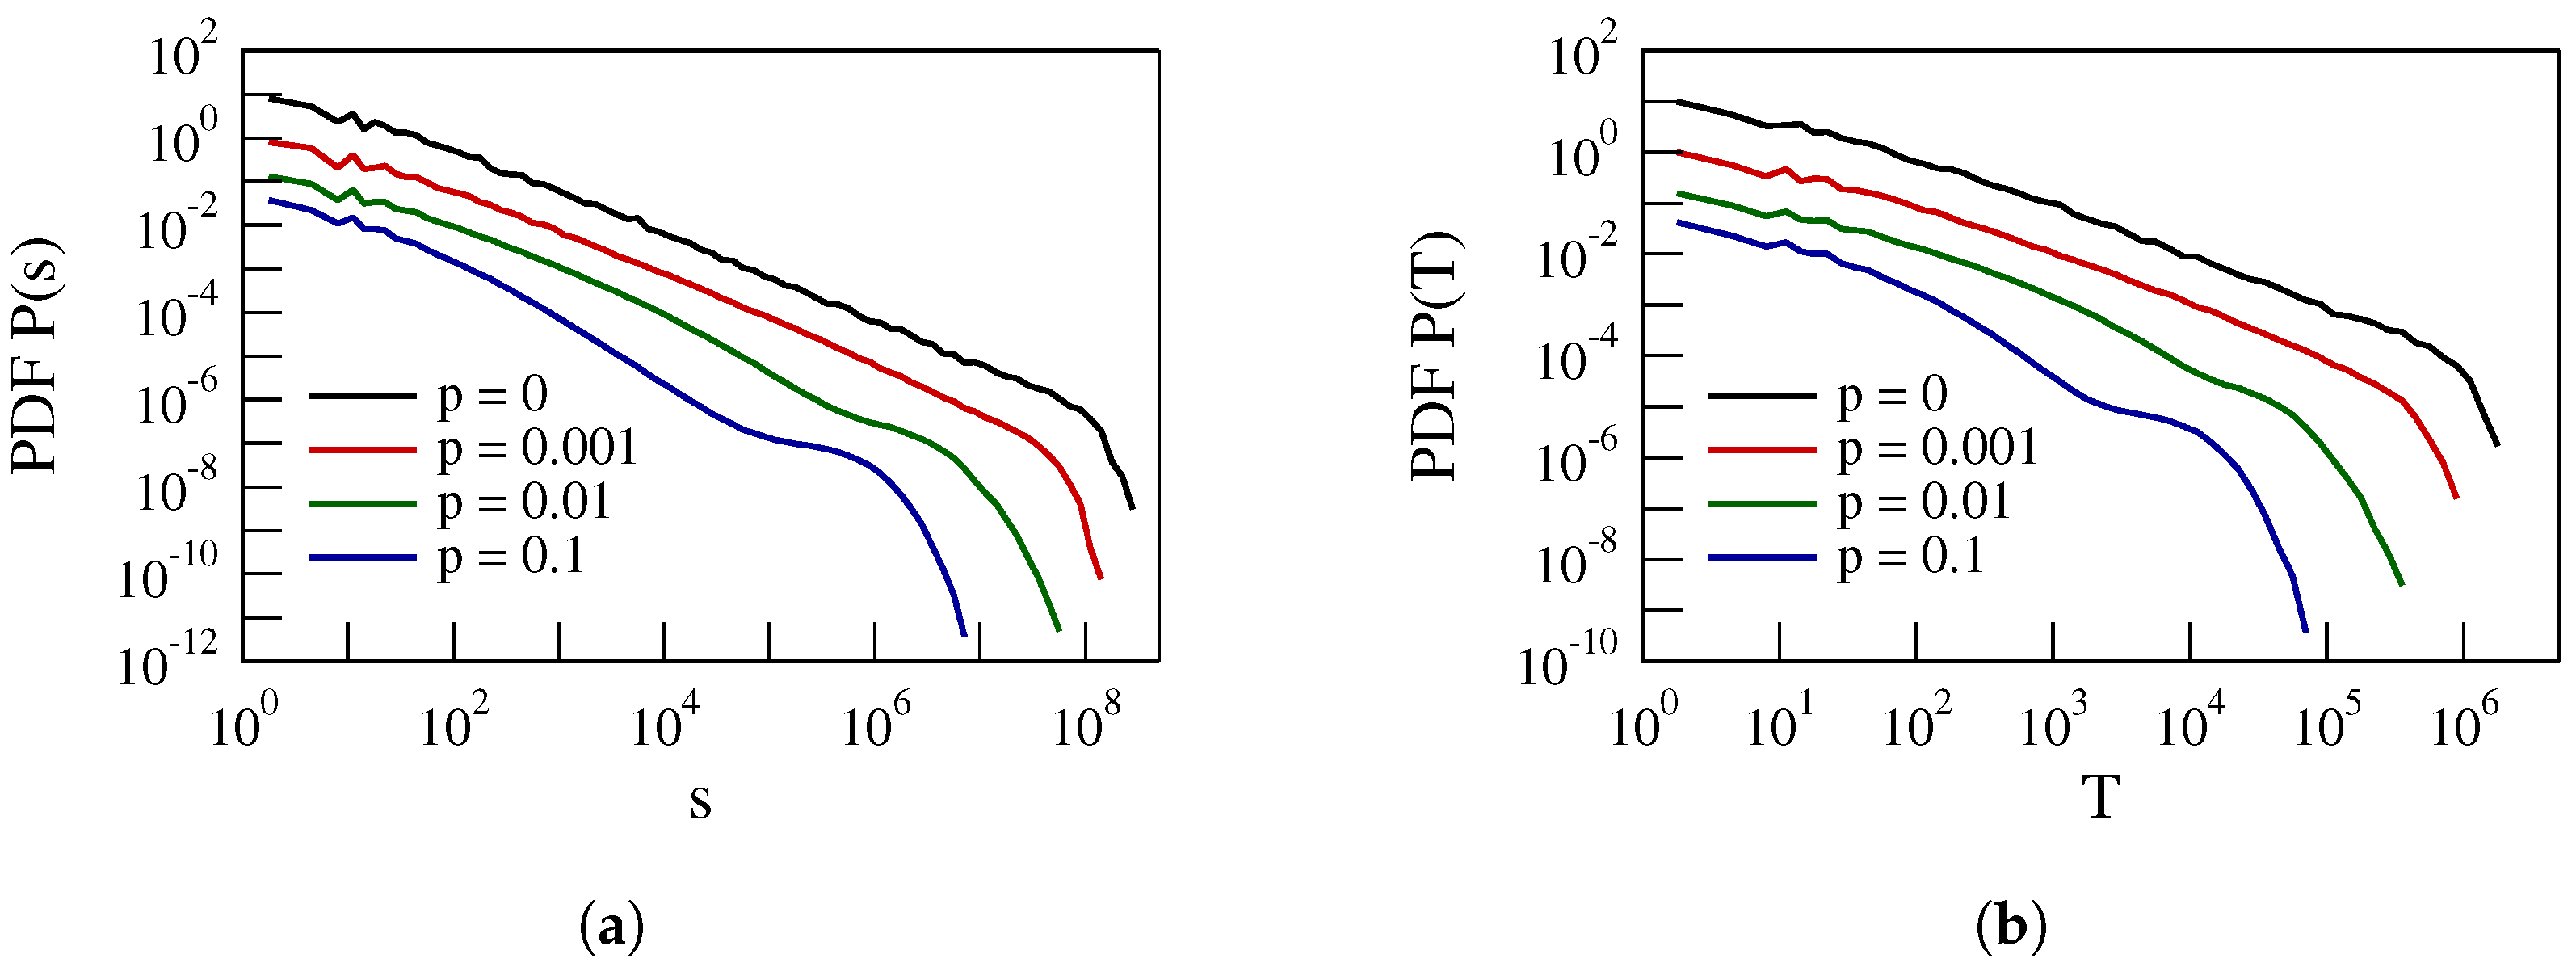
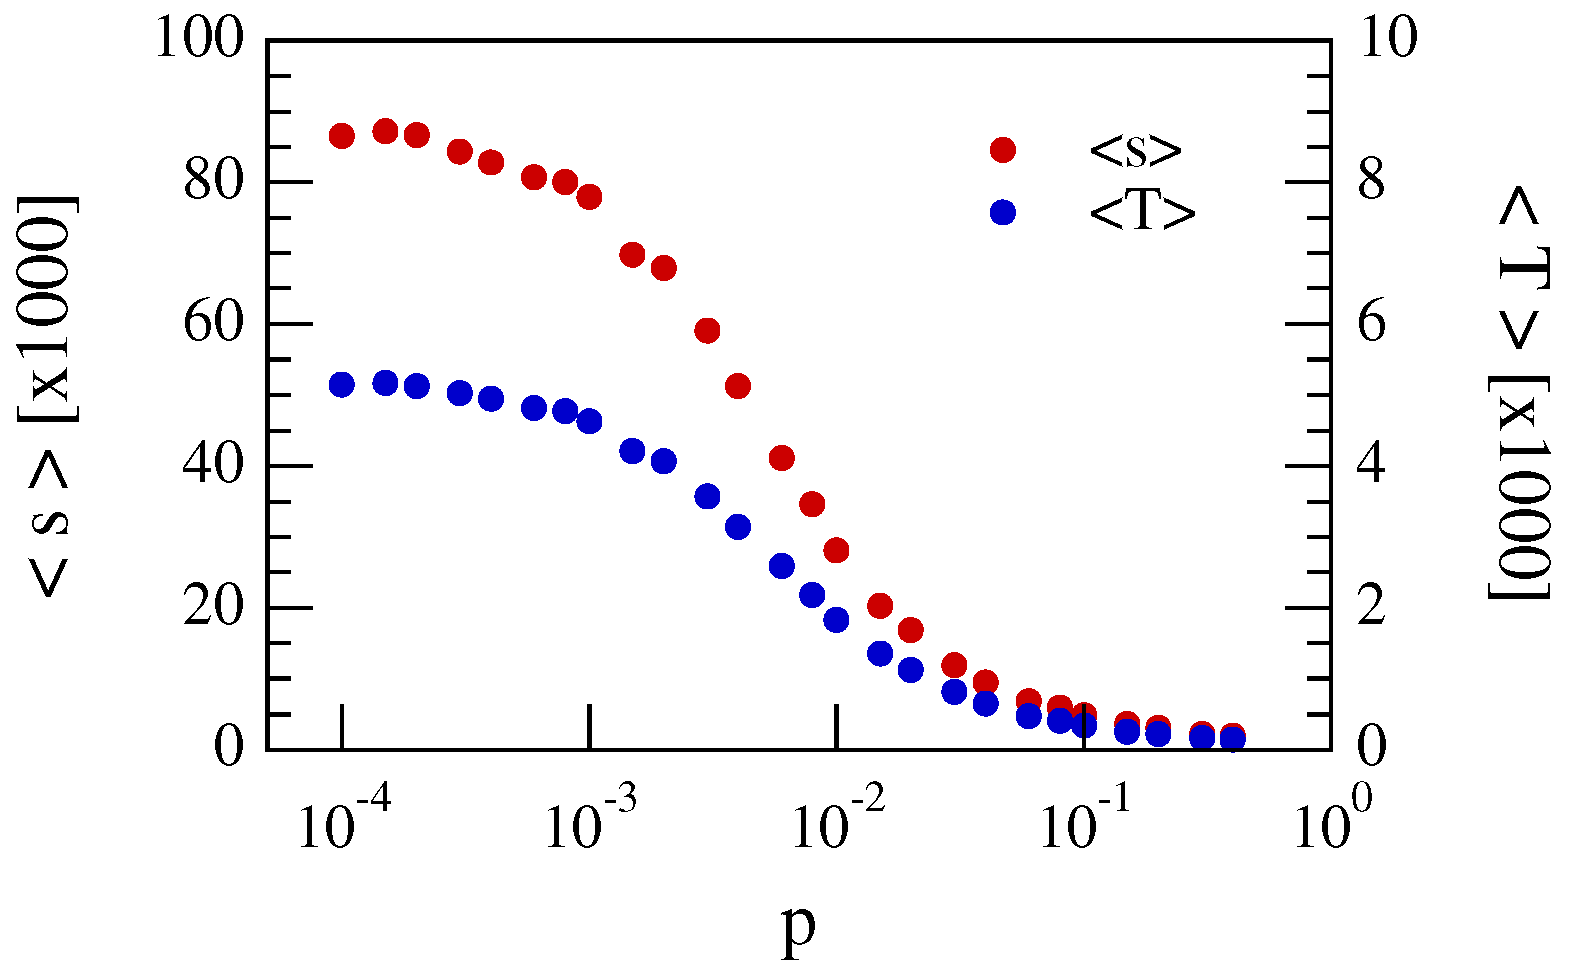
We start the presentation of the results from the statistics of the avalanche size s and duration T in the case of no extra links for different systems sizes. Thus, each site is simply connected to the first nearby sites without any longer range link ( p = 0 ).
Figure 4 shows the PDFs for s and T in the case of no extra links. As expected, the distributions are clearly simple power laws, extending over several orders of magnitude up to a characteristic cut-off, s c and/or T c . The observed cut-offs are manifestations of Finite Size Scaling (FSS) effects, i.e.,
P ( x ) = x τ x F ( x , x c ( L ) )
where L is the system size, x stands for the observable quantity (here, s and T), x c is the cut-off scale and τ x is the corresponding power law exponent. FSS effects are, indeed, very well documented in the case of the Manna model (see, e.g., Chessa et al. [30]). Furthermore, the power law exponents τ x of the distributions of the avalanche size s and duration T are very similar, being τ s = [ 0.933 ± 0.002 ] and τ T = [ 0.89 ± 0.01 ] , respectively.
The existence of power law distributions along with FSS effects in this 1D Manna model supports the critical nature of the dynamics in the simple case of first neighbor interaction.
To study the effect of the presence of longer range links, we introduce in the simple 1D lattice a certain probability p of longer range links as explained in Section 2. We perform several simulations with different values of the longer range link probability p within the interval p [ 0 ,   0.5 ] .
Figure 5 shows the evolution of the PDFs of the avalanche size s and duration T with p in the case of networks with L = 10,000. The most interesting feature in Figure 5 is the emergence of secondary distributions at large s and T for large values of p, p > 0.01 . This effect suggests that the probability p is an active parameter with respect to the emergence of critical dynamics, possibly related to a crossover phenomenon for stationary states in dynamical systems. The effect of p manifests in a bimodal character of the distribution functions.
The above point is supported by the dependence of the avalanche mean size s and duration T on p. Figure 6 shows the trend of s and T on the probability p for the case of a system size N t = 1000 . A clear transition between two different asymptotic values for p = 0 and p = 1 is observed, which suggests how the percentage p of extra links acts as an active critical parameter. This behavior can be due to the alteration of the linear size L of the 1D lattice by the introduction of longer range links.
Furthermore, the mean avalanche size s and duration T scale according to a power law as a function of the network dimension L, and the scaling index tends to decrease with increasing p, as shown in Figure 7. In the next subsection, the scaling features will be investigated in great detail.
Thus, the introduction of longer range connectivity in 1D lattice mainly has three effects:
(i)
to reduce the dimension s and the duration T of the avalanches due to the shortcuts introduced by the longer range connectivity, which has the effect of reducing the effective size of the network;
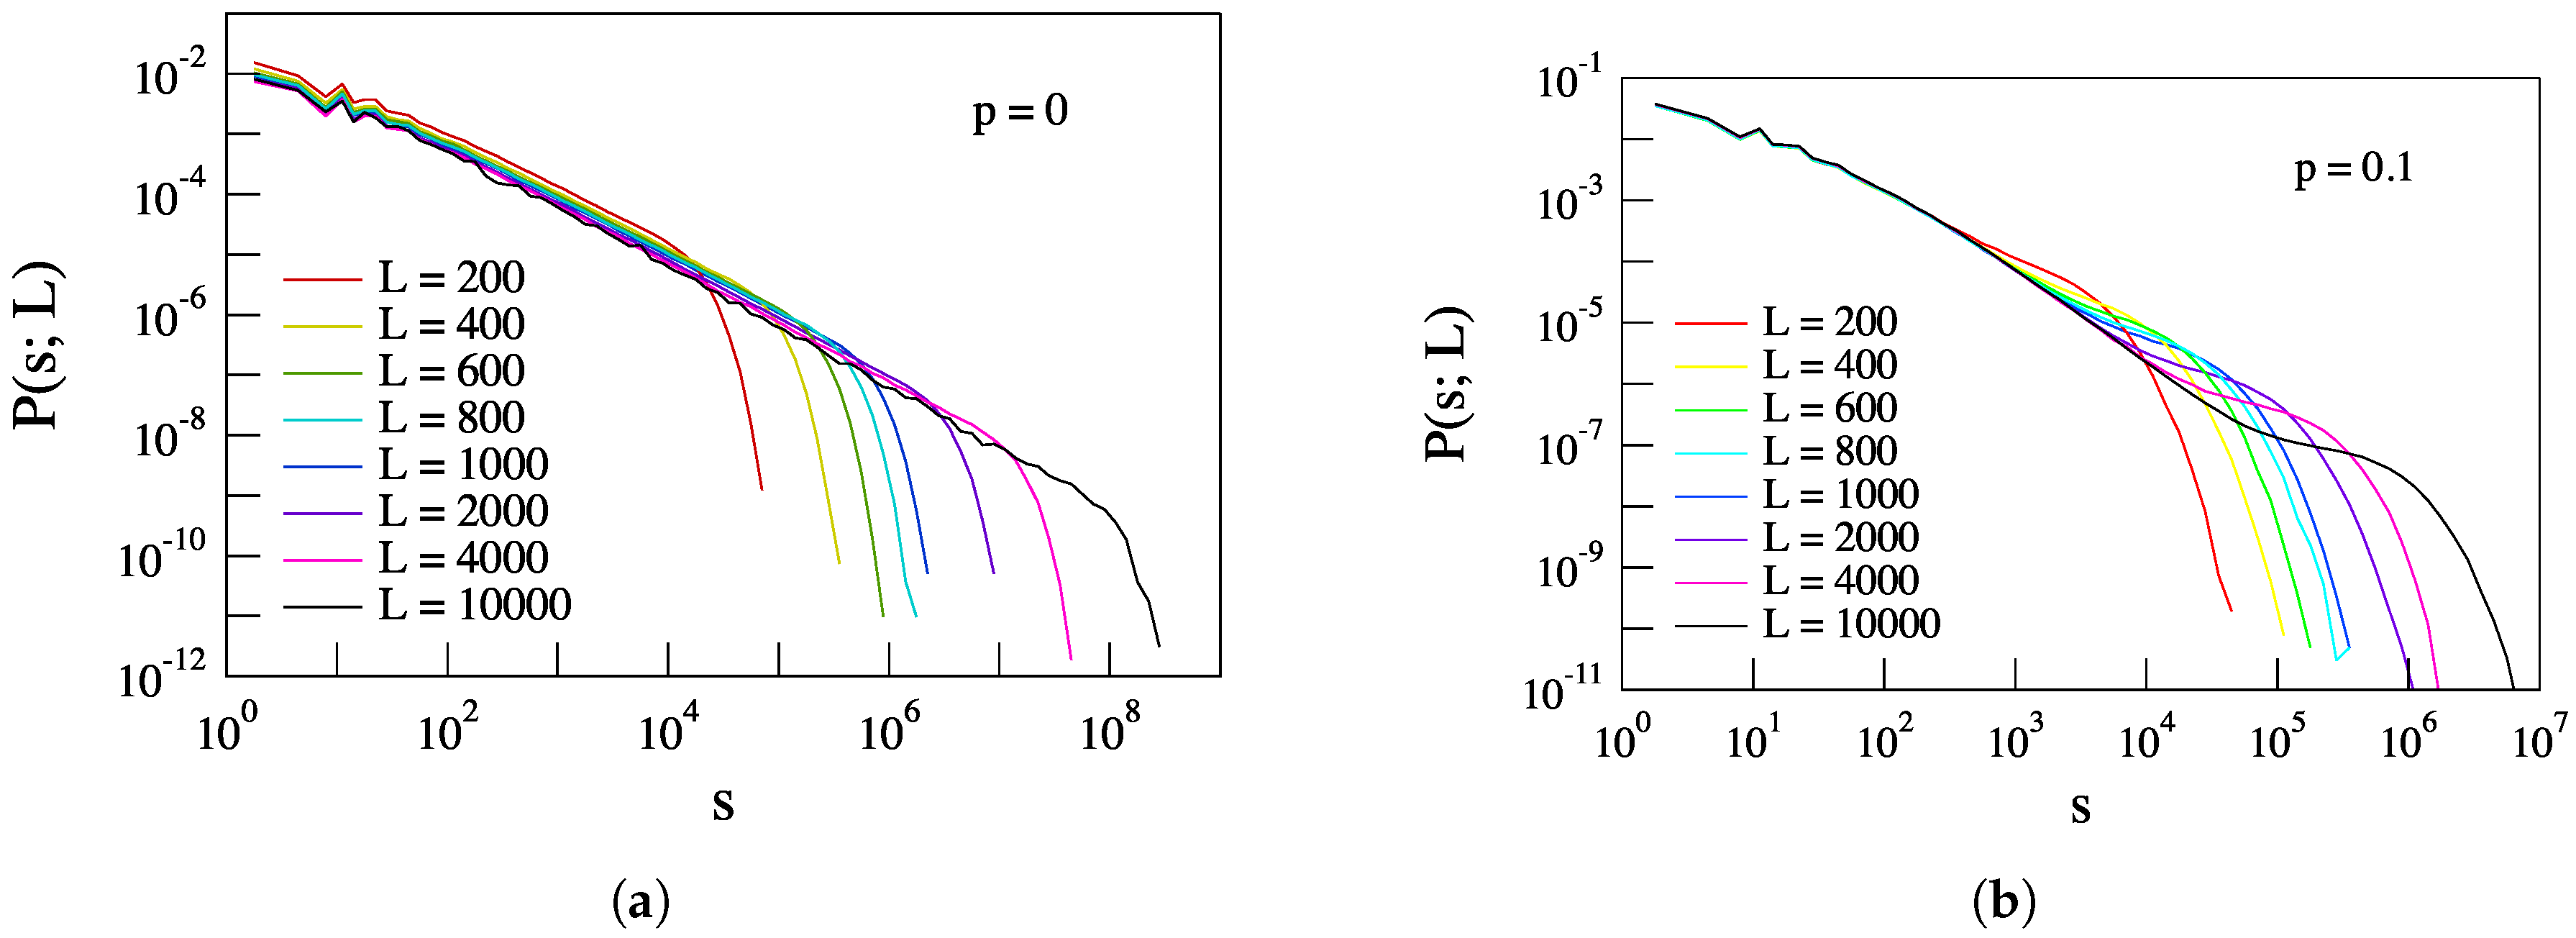
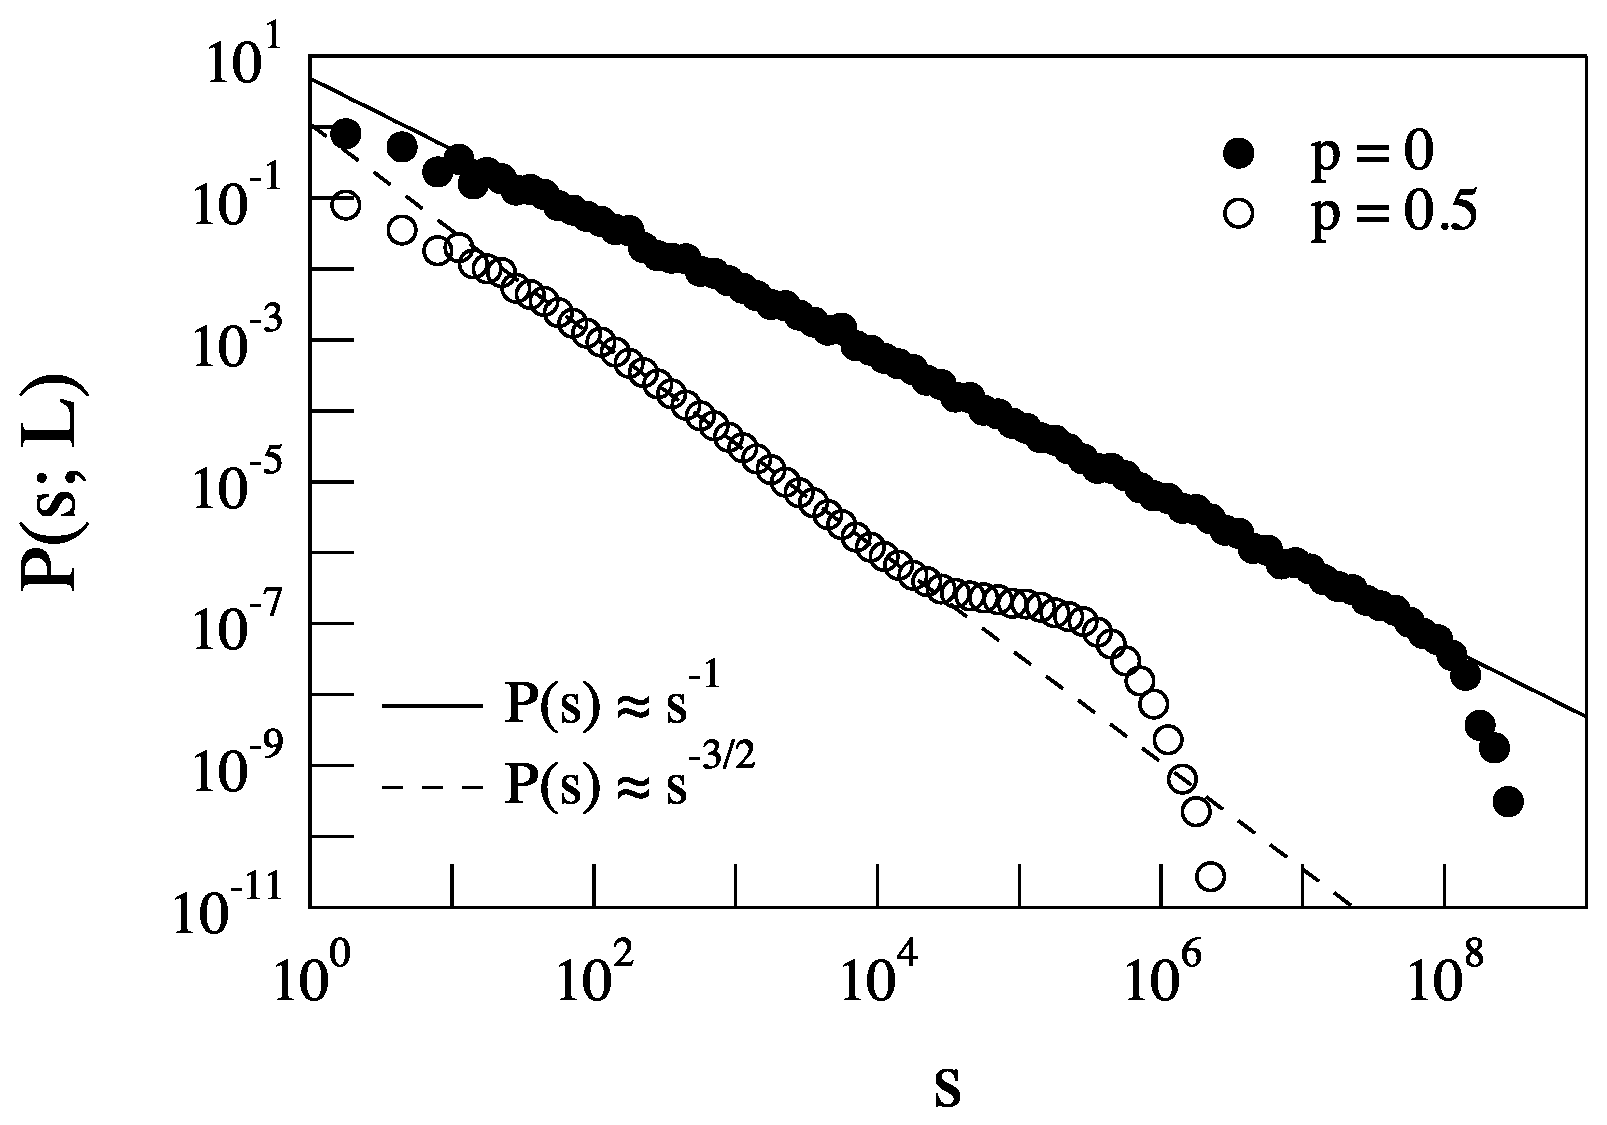
(ii)
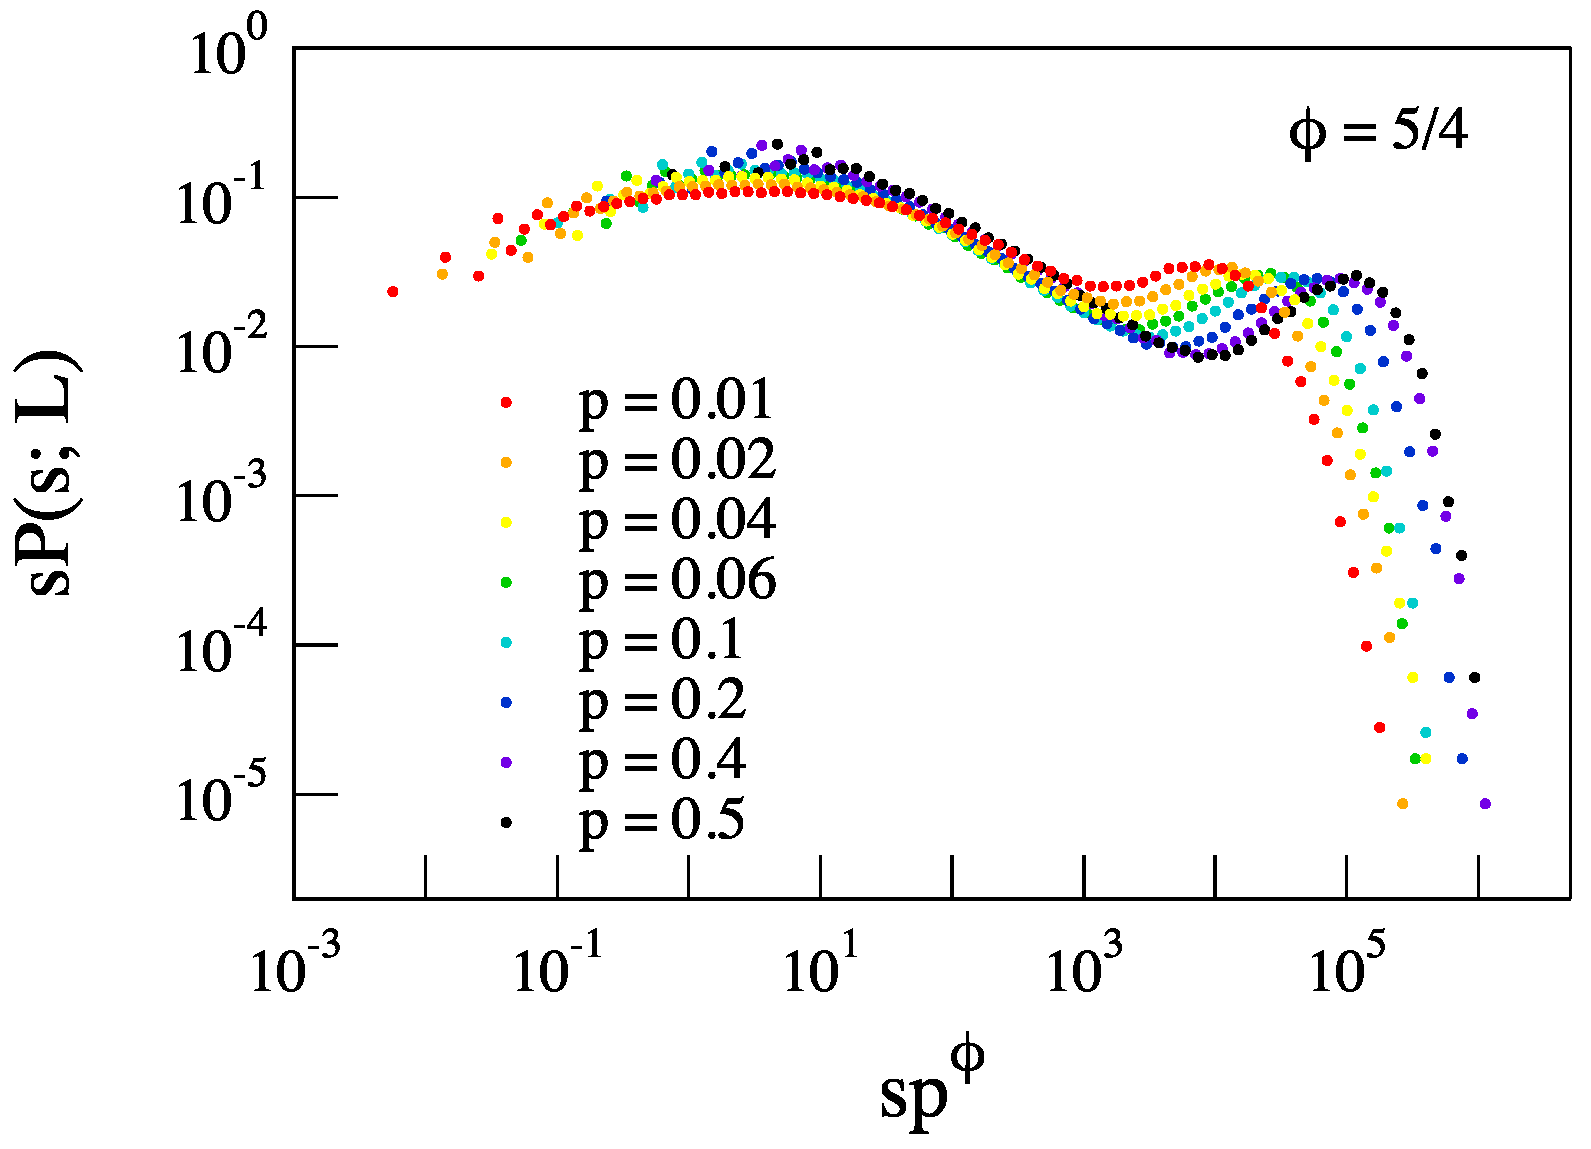
to modify the shape of PDFs of avalanche size and duration along with the emergence of a bump at the largest values of s and T. This may be evidence for the emergence of a characteristic scale for s and T;
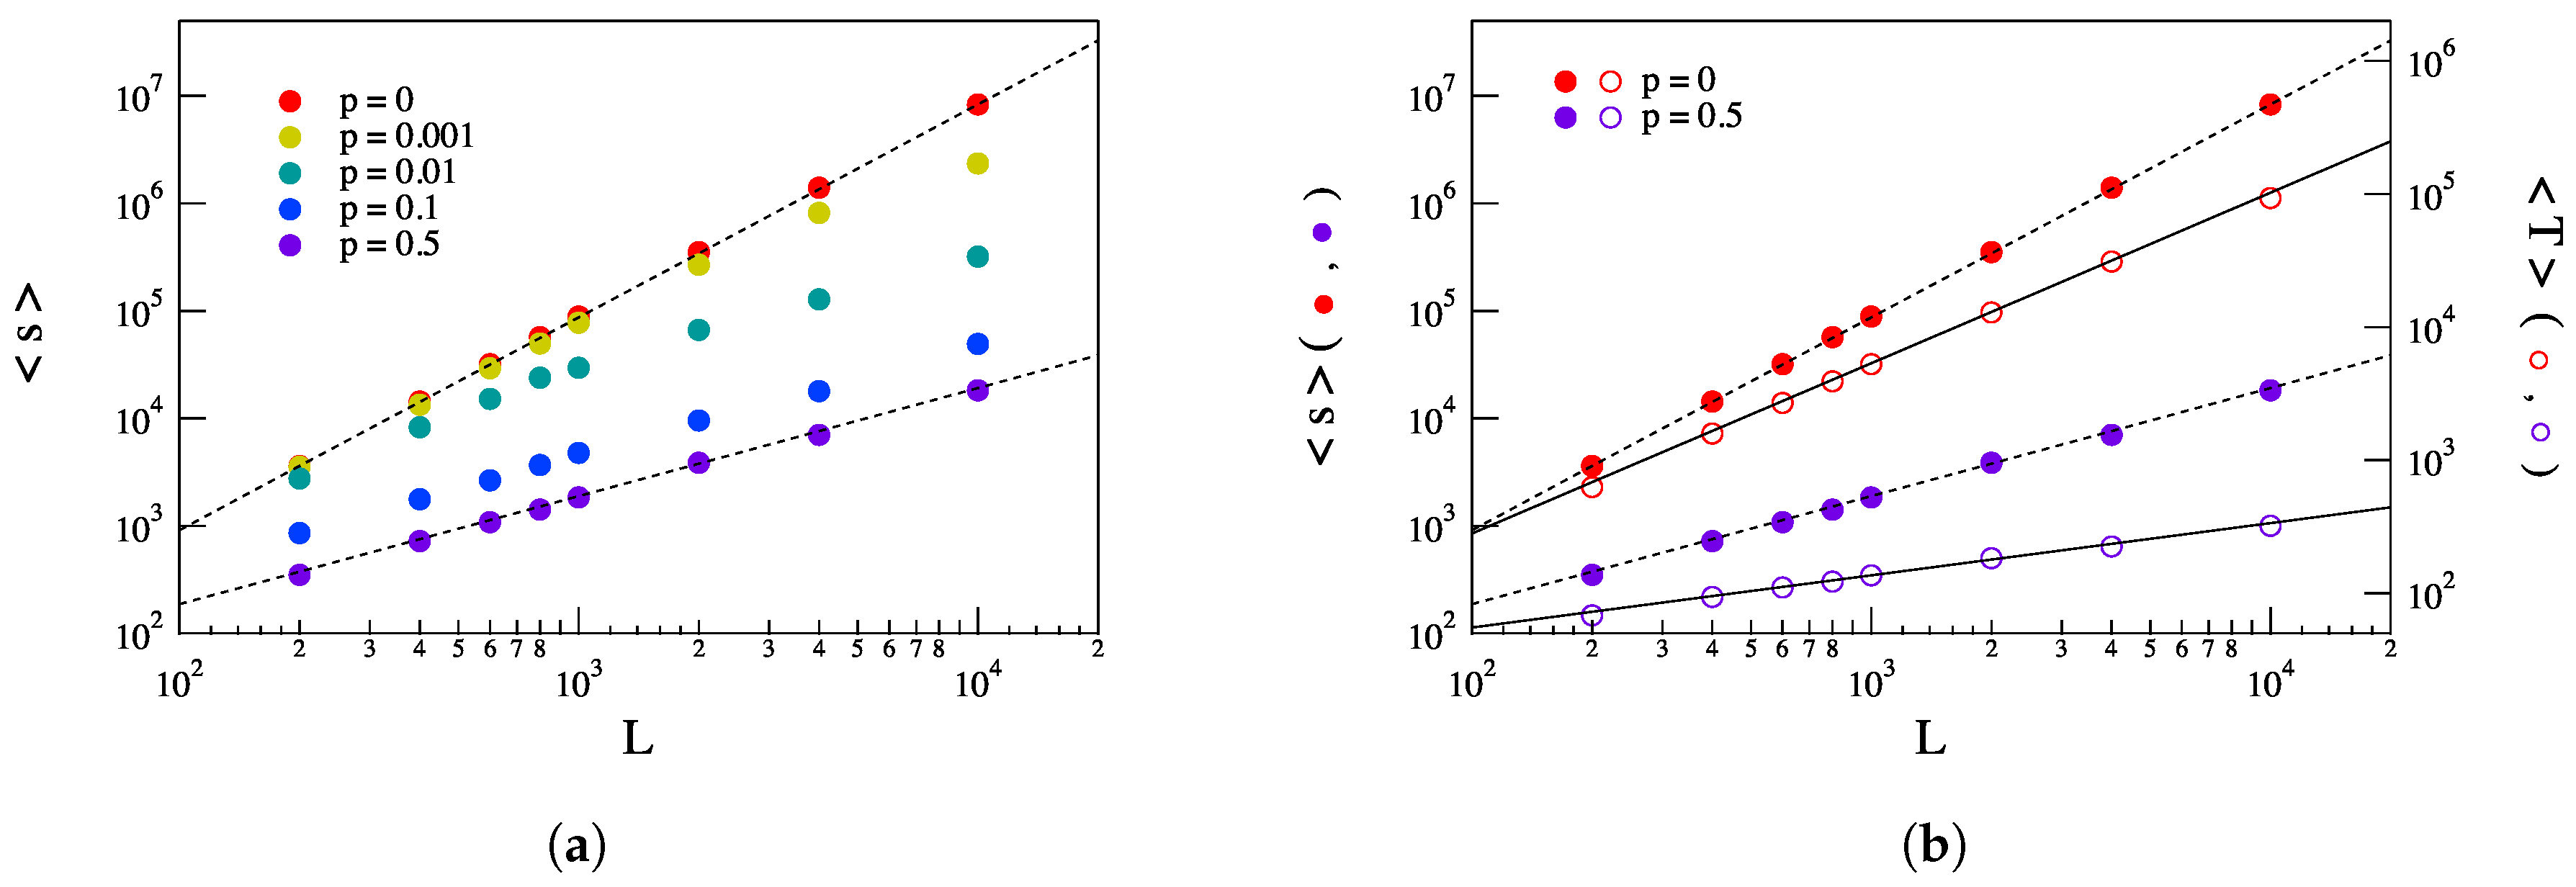
(iii)
to modify the power law scaling of the average s and T as a function of L.

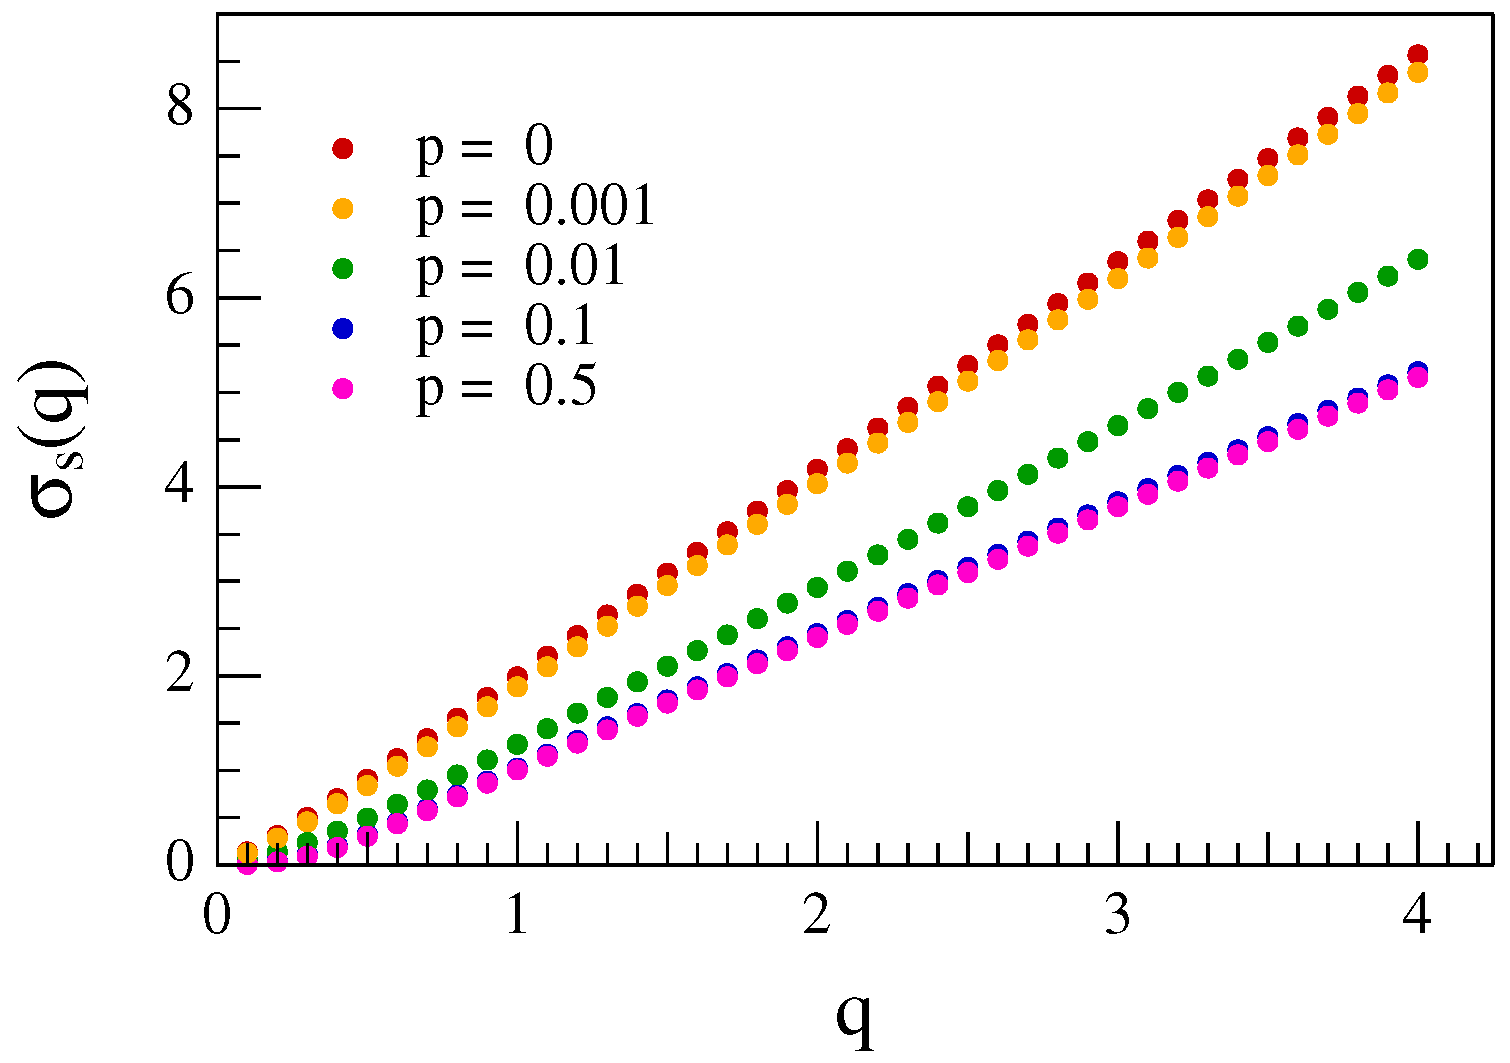
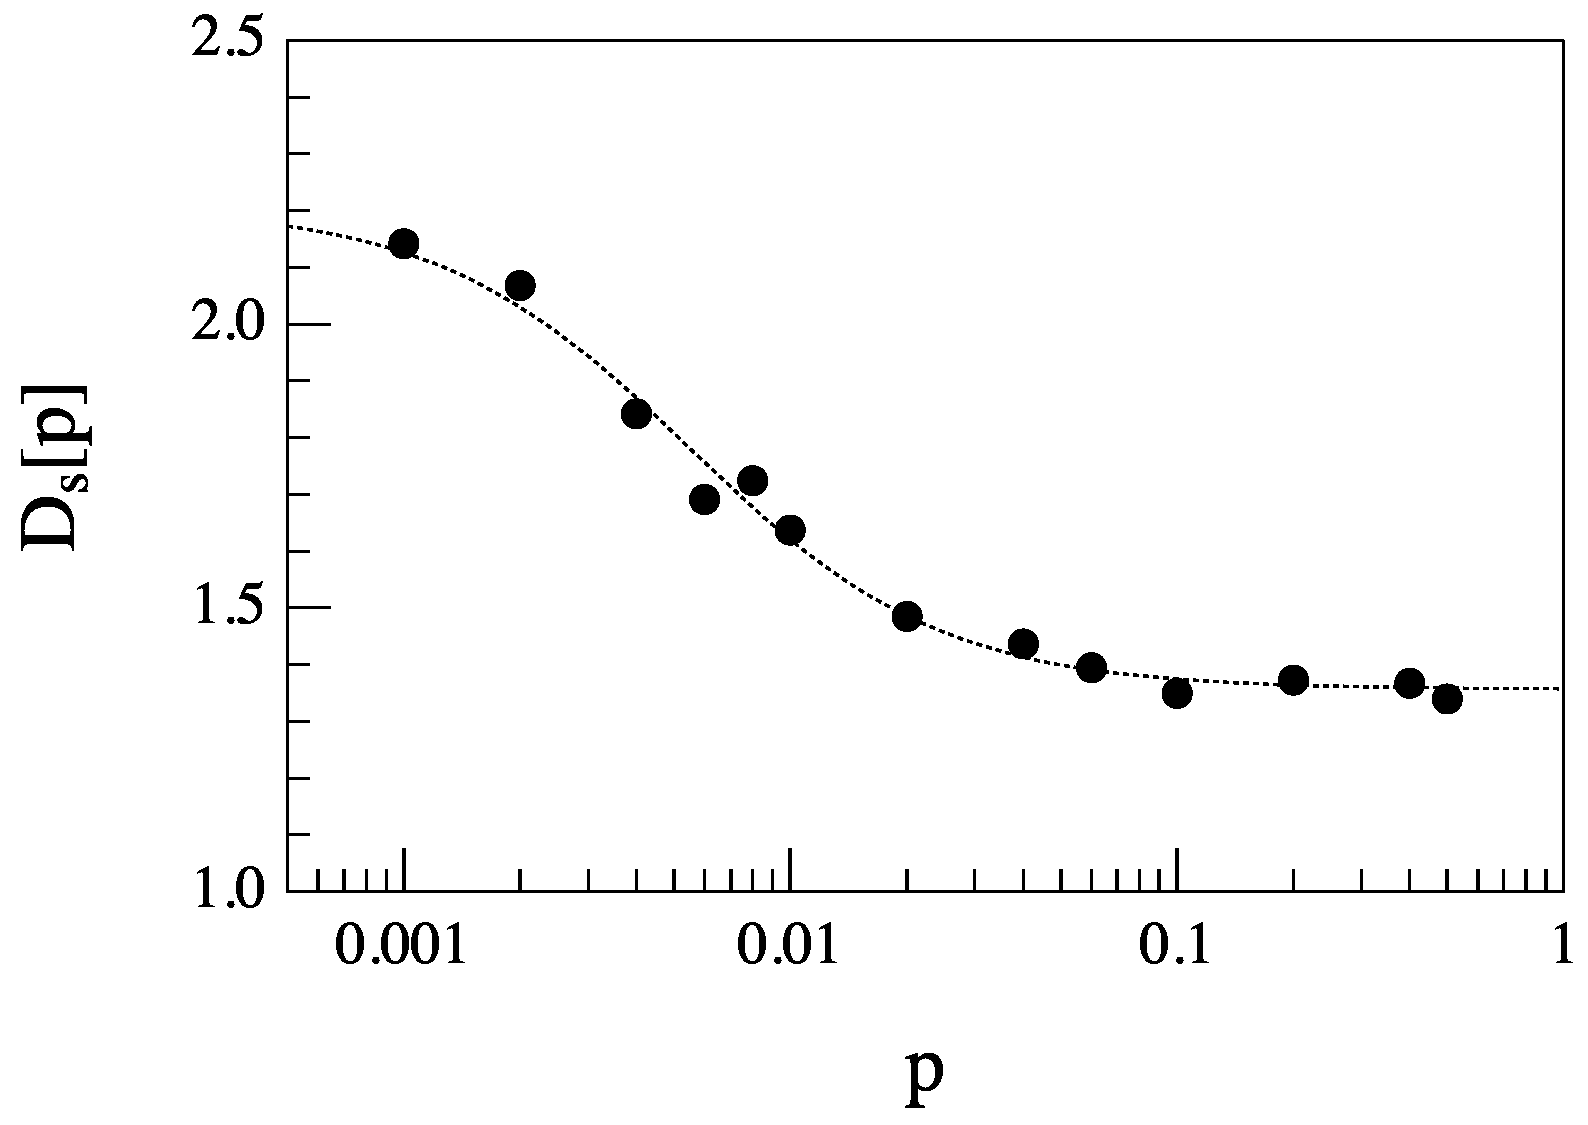
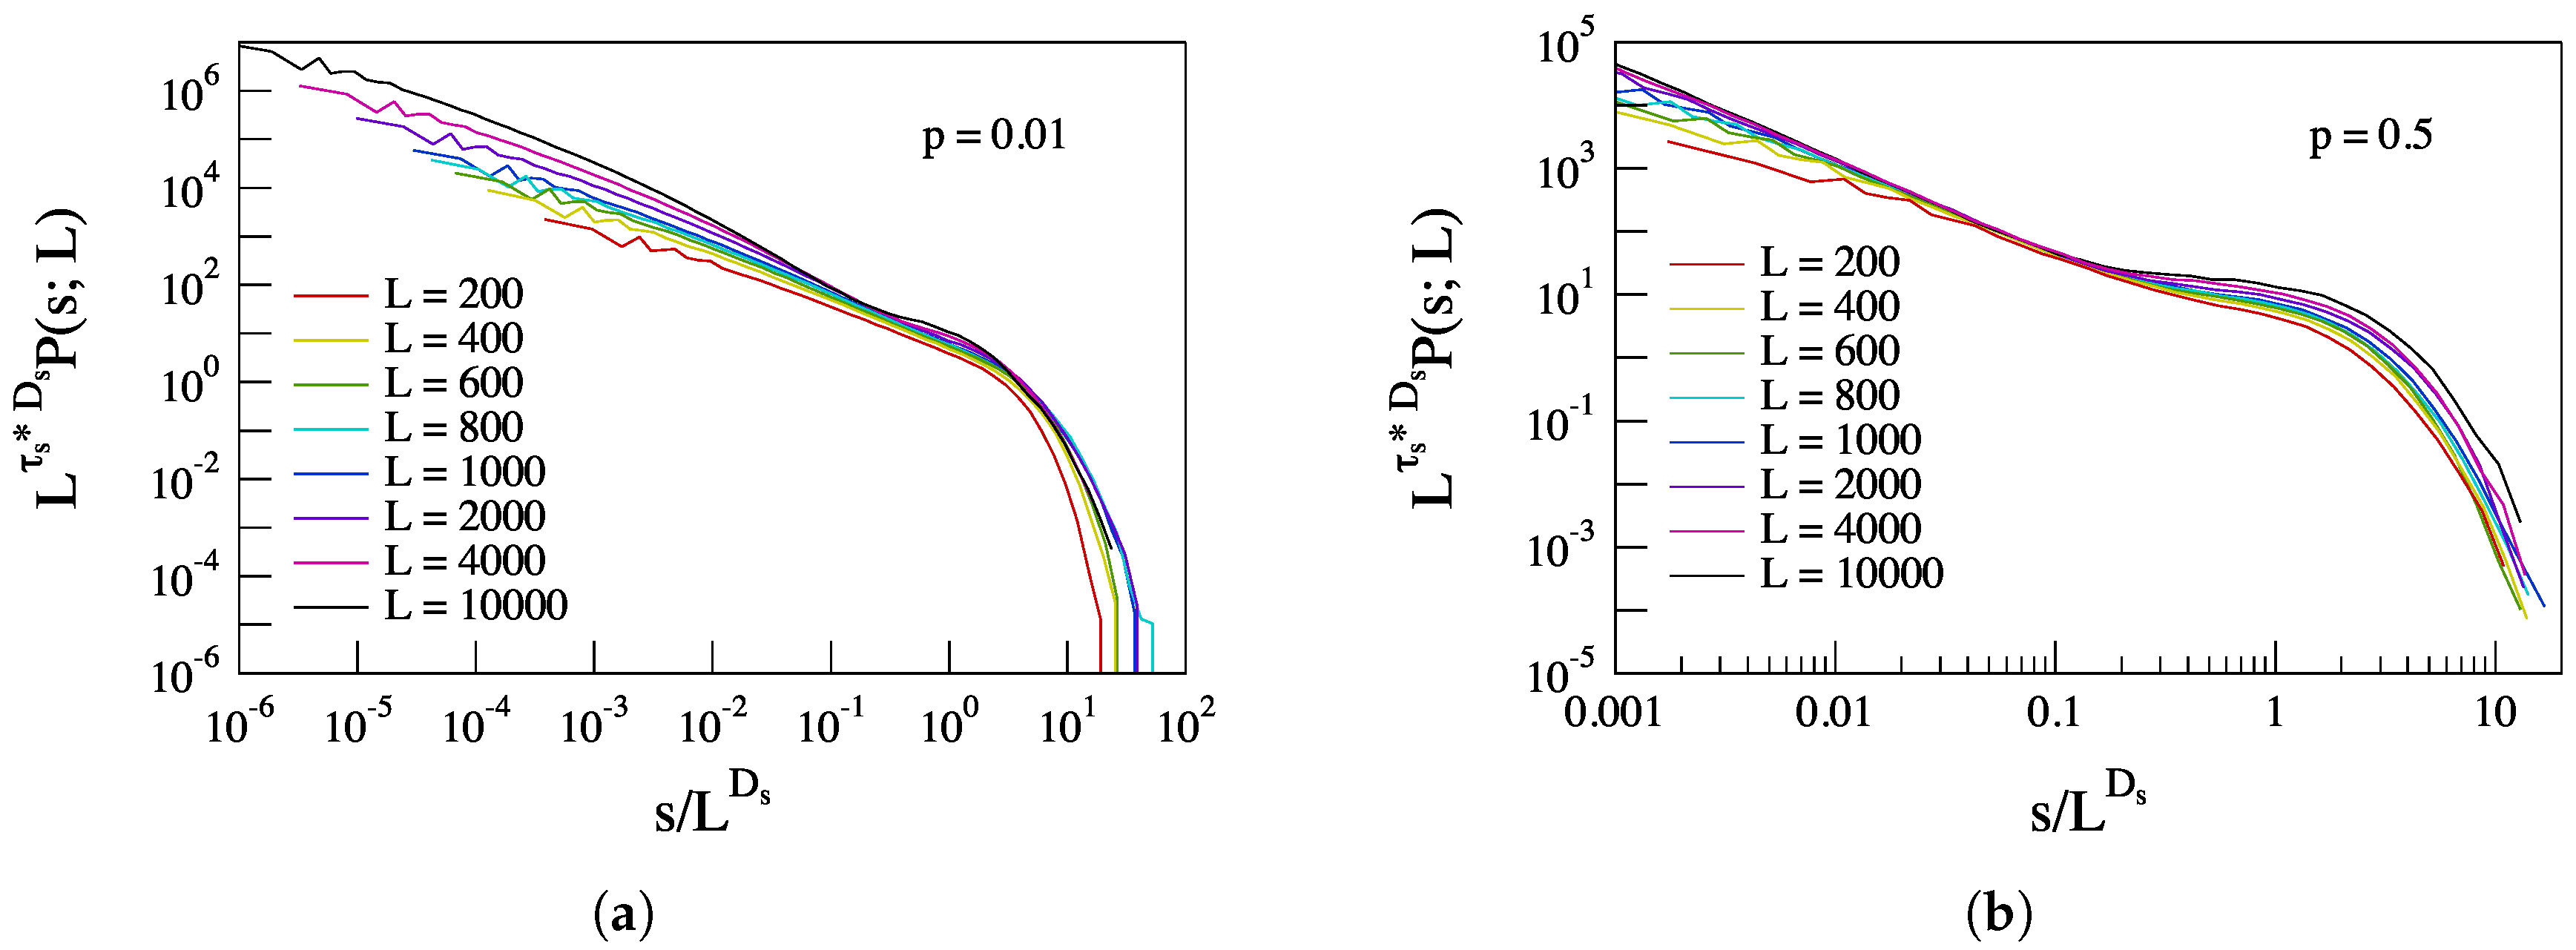
3.2. Finite Size Scaling: Moment Analysis and Scaling Features

Here, we present the analysis of the dependence of Finite Size Scaling (FSS) on the probability p of extra links. This allows us to characterize better the evolution of the avalanche feature statistics with the increasing number of longer range links.
FSS is a peculiar feature of both real and simulated systems near a critical point that, instead of an infinite range of scales in which the system is scale invariant, shows the emergence of a rounding and shifting of critical singularities, which depends on their finite dimension. This property is very well documented in real equilibrium critical systems [13,21,22] and also in SOC and complex systems near criticality [13,23].
In the case of a critical system of finite size L if p ( x ; L ) is the distribution function for the observable x, then the FSS effect predicts that:
P ( x ; L ) = L τ x D x Π x x L D x
where D x is the scaling exponent characterizing the rescaling of the observable x on the size L, τ x is the scaling exponent of the distribution function, P ( x ; L ) x τ x and Π x is the scaling function. The exponent D x represents the capacity dimension and determines the typical cut-off x m a x L D x of the probability distribution function of the quantity x. For real critical systems, the scaling exponent D x is expected to be constant and independent of the size of the local invariant Y = x / L D x . This means that from Equation (9), it is possible to collapse the distributions relative to systems of different sizes into a universal master curve by applying the following scale transformation:
x Y = x / L D x P ( x ; L ) Π ( Y ) = L τ x D x P ( x ; L )
Because the scaling for the construction of the master curve requires one scaling exponent D x , we are in the presence of simple scale invariance features, i.e., a mono-fractal behavior.
To investigate the FSS effect in relationship with the presence of longer range links, we consider a set of simulations for different sizes L of the network ( L = 200 ,   400 ,   600 ,   800 ,   1000 ,   2000 ,   4000 and 10,000) and different values of the p parameter ( 0 p 0.5 ).
Figure 8 shows the evolution of the PDFs of the avalanche size s as a function of the system size L for two different values of the parameter p, i.e., p = 0 and 0.1. In both cases, we observe clear system size effects. Indeed, the cut-off avalanche dimension s c increases with system size L.
To attempt the construction of the master curve by collapsing PDFs of different sizes L, we make use of the moment analysis technique, as described in [30,31]. This method consists of studying the scaling features of the q—order moment, x q , of an observable x as a function of the system size L. In particular, supposing that the PDF of the observable x can be assumed to be:
P ( x ; L ) = x τ x F x x , L ,
where F x x , L is the cut-off function. Then, the q—order moment, x q , is expected to scale as follows,
x q L = x q P x , L L σ x ( q ) ,
where:
σ x ( q ) = D x ( q + 1 τ x ) .
The quantity σ x ( q ) is named the momenta spectrum and facilitates the determination of the two scaling exponent D x and τ x relative to the observable x. Indeed, the asymptotic behavior of σ x ( q ) for large momenta q is:
σ x ( q ) q τ x 1 q D x .
Furthermore, the other scaling exponent τ x can be easily evaluated using, for instance, the value of the momenta spectrum at q = 1 , i.e.,
τ x = 2 σ x ( 1 ) D x .
The above moment analysis has been applied to the case of the avalanche size distributions to get the values of the scaling exponents D s and τ s .
Figure 9 shows the behavior of the momenta spectra for a set of values of the probability p.
To evaluate the capacity dimension D s , we use the procedure described in [32], i.e., plotting σ s ( q ) / q versus 1 / q and looking for the limiting value for 1 / q 0 , indeed:
lim 1 / q 0 σ s ( q ) q = D s .
Furthermore, using the relationship of Equation (15), we get also the other scaling exponent τ s . Table 1 reports the values of the two scaling indices ( D s and τ s ) as a function of p as computed by the moment analysis. For comparison, we also included the scaling index τ s * as computed by looking for the presence of an interval with constant slope in the PDFs of the avalanche size s. A clear dependence on the parameter p is found for both the capacity dimension D s and the scaling exponent τ s . Furthermore, the scaling index τ s * shows a transition between the expected value in the case of 1D Manna model for p = 0 and the mean field value τ s * = 3 / 2 for p 0.1 (see Figure 10). A similar behavior has been observed by De Arcangelis and Herrmann [16] for simulations of the BTW model on small world networks.
Figure 11 shows the dependence of the capacity dimension D s of the avalanche size s on p. We see that for p 0 , we get D s 2 and τ 1 . These values are in good agreement with the classical results on BTW sand pile model. Conversely, for p 1 , values tend respectively to D s 4 / 3 and τ s * 3 / 2 , which are the mean field values. This is very similar to what has been already observed in De Arcangelis and Herrmann [16], so that the point to check is if the continuous change of the scaling exponents is due to an intrinsic continuous line of critical points or of a crossover phenomenon. Following the procedure described in De Arcangelis and Herrmann [16] and Lahtinen et al. [17], we check for a data collapse of the distributions for p 0.01 at the largest value of L = 10,000, following the classical crossover scaling:
P ( s ; L ) = s τ s F s p ϕ
Here, F is the scaling function and ϕ is the corresponding universal crossover exponent. Figure 12 shows the data collapsing using respectively τ s = 1 and ϕ = 5 / 4 for avalanche PDFs relative to L = 10,000 and with p 0.01 . Collapsing seems to work for values of p 0.05 (i.e., for large values of the probability p of extra links) in the range of the scaled variable s p ϕ ( 10 , 10 3 ) . The interval of the scaled variable, where collapse seems to work, corresponds to the interval of avalanche size s where the PDFs behave according to mean field theory as P ( s ) s 3 / 2 (see Figure 10). A similar result was found by Lahtinen et al. [17] for small world networks with quenched randomness. This result suggests that we are in the presence of a crossover phenomenon to mean field behavior, as already observed by De Arcangelis and Herrmann [16] in 2D small world networks. We recall that here, we are doing 1D simulations on Newman–Watts networks with quenched randomness.
Using the scaling exponents reported in Table 1, we attempt the data collapsing of the PDFs relative to systems of different size L applying the transformation of Equation (10). Figure 13 shows data collapsing for three different values of the probability p. A clear dependence of the capacity dimension D s and of the scaling exponent τ s on the long-range connectivity parameter p is recovered.
Data collapsing works quite well in the case of p = 0 for values of the scaled variable s / L D s larger than 10 4 , confirming the existence of FSS effects as expected for simple critical phenomena. Although the data collapsing for p = 0 seems to support that PDFs exhibit FSS, the computed threshold cutoffs do not exactly allow the PDFs in the small s region to lie on one smooth straight line. This point would suggest that for the small s region, FSS could fail, implying the emergence of multifractal/multi-scaling features. We note how in the literature there is evidence for the lack of FSS in some classes of stochastic sand pile CA models (see, e.g., [33,34,35]). We will return to this point in the following subsection, where we apply the ROMA technique [25]. For increasing values of the probability p, i.e., for increasing non-local connectivity, data collapsing appears not very good. In particular, for p p c 0.01 data collapsing seems not to work properly, showing discrepancies for small and high values of the scaled variable s / L D s . No substantial changes are observed using the value computed from fitting the PDFs, i.e., τ s * (see, e.g., Figure 14) instead of τ s from moment analysis.
The failure of data collapsing for increasing values of the probability p of extra links is the signature of a more complex nature of the avalanching processes, as a results of different competing behaviors for small and large values of the avalanche size s. In particular, for p 0.01 , the PDF seems to show both the emergence of a characteristic scale for large s and power law features for small s. This could be the evidence of the coexistence of both pseudo-first order and pseudo-second order dynamic relaxation processes, so that the absence of a master curve has to be read in terms of competing small size critical and large size non-critical dynamics. This implies that the nature of the avalanching process is no-longer characterized by a mono-scaling nature, but instead due to a multi-scaling nature.
Another possible origin of the observed loss of FSS could be that the generation of a RG for an increasing number of longer range links alters the sense of a linear scale, as is the case of a regular lattice, generating an effective inner scale in the avalanching process [36,37].

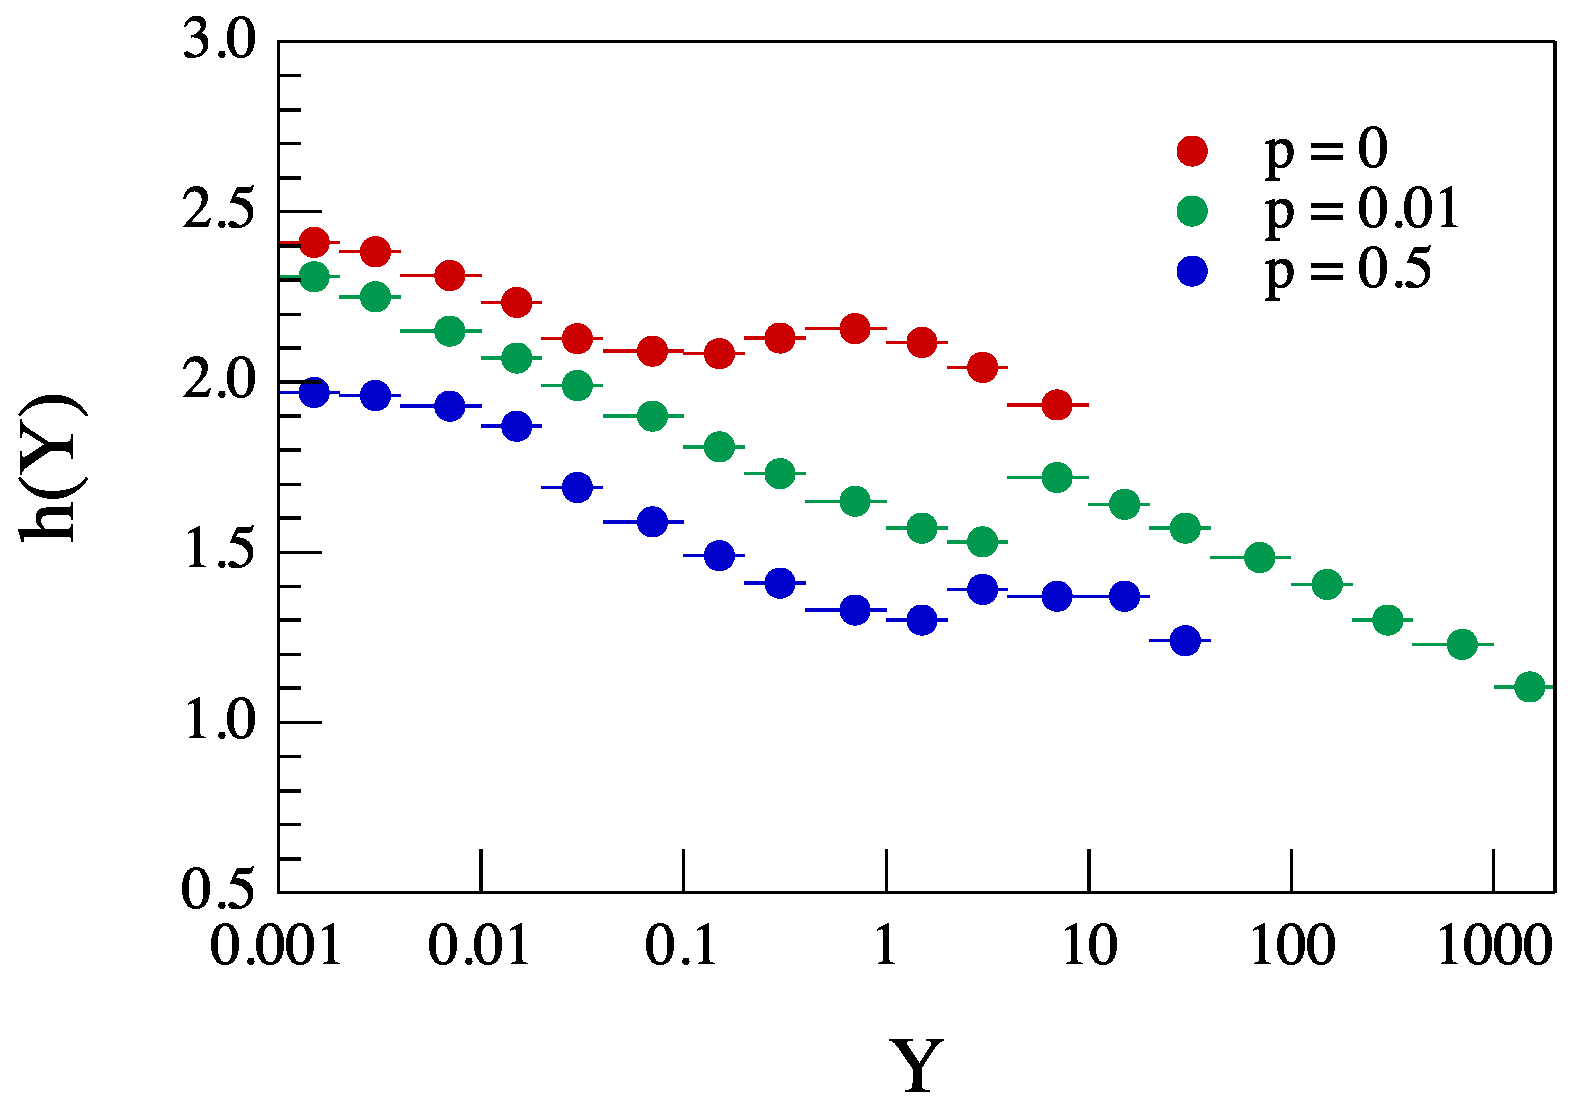
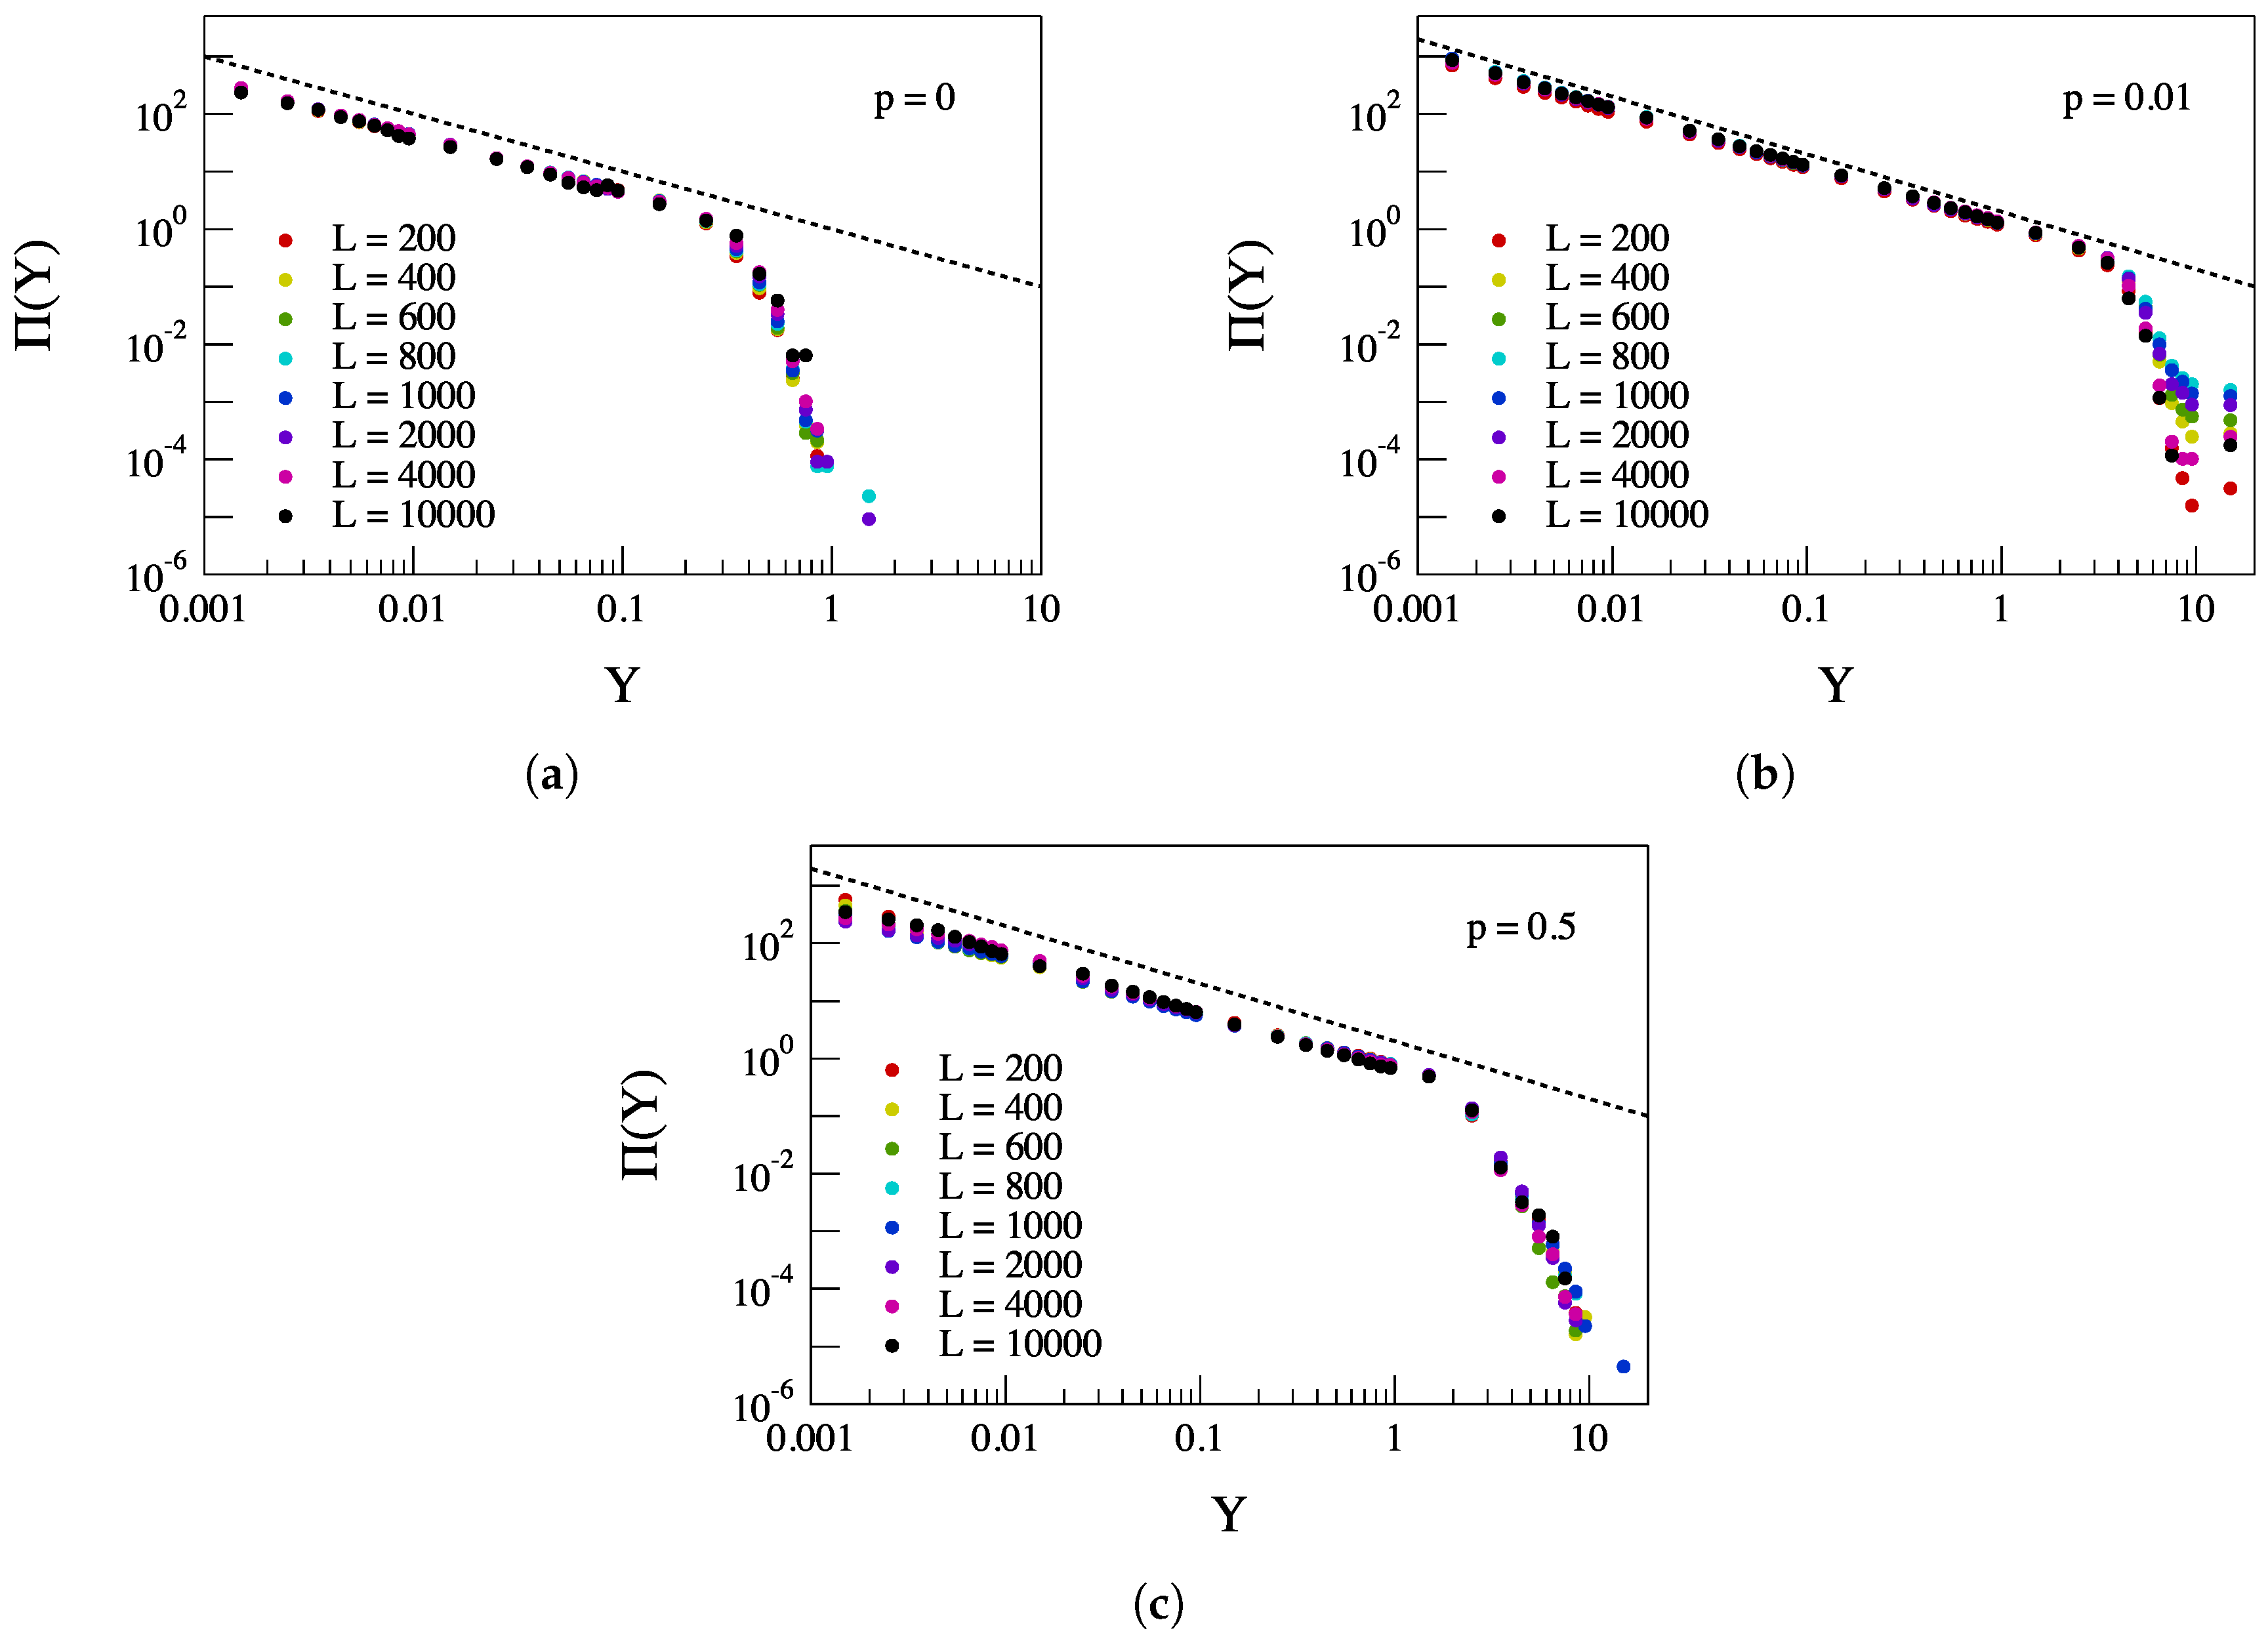
3.3. Rank-Ordered Multifractal Analysis and Finite Size Scaling

Recently, Chang and Wu [25] (see also [13] for a more detailed discussion) introduced a novel technique, named Rank-Ordered Multifractal Analysis (ROMA), to attempt data collapsing and the construction of master PDFs for the fluctuations of intermittent and multifractal signals. ROMA is based on the construction of invariants in systems near critical points displaying multiscaling features due to competing fixed points. The basic idea of this technique is that different amplitude fluctuations are characterized by different scaling exponents, so that the singularity features can be investigated by grouping fluctuations according to their re-scaled sizes. Thus, the single exponent of mono-scaling fluctuations turns into a spectrum (ROMA spectrum) of rank-ordered fluctuations based on the local invariants. The procedure is very simple.
If p ( X , δ ) is the PDF of a variable X (e.g., the fluctuation amplitude) depending on the parameter δ , then one can construct a local invariant Y = X / δ h , corresponding to a certain range of the variable X rank-ordered according to the local invariant Y and where h is the local scaling exponent. In such a way, for multi-scaling variable X, the exponent h is a function of Y, i.e., h = h ( Y ) , which is the ROMA spectrum. Thus, the computation of the ROMA spectrum requires solving the following functional equation for a range limited structure function,
S q ( X ; δ , [ Y i , Y i + 1 ] ) = δ h Y i δ h Y i + i X q p ( X , δ ) d X δ q h .
If a solution of h is found in the given range of Y [ Y i , Y i + 1 ] , then the scaling features of the scaled variable Y in the chosen range are characterized by a mono-fractal behavior with scaling exponent h ( Y ) .
The ROMA spectrum h ( Y ) is the quantity able to characterize the different scaling features of different amplitude fluctuations. The advantage of the ROMA method is that it is not based on the average behavior (as occurs for standard moment analysis/partition-based methods). Thus, the evaluation of the scaling exponent for a certain fluctuation amplitude is not affected by scaling exponents of the most probable fluctuations.
Using the ROMA spectrum h ( Y ) , it is possible to collapse the PDFs to get the invariant FSS function Π ( Y ) according to the following transformation,
X Y = X / δ h ( Y ) P ( X , δ ) Π ( Y ) = δ h ( Y ) P ( X , δ )
By means of ROMA, we can attempt PDFs’ collapsing. Thus, as a first step, we evaluate the ROMA spectrum h ( Y ) by solving the functional Equation (18) for rank-ordered avalanche sizes.
In Figure 15, we show the ROMA spectrum h ( Y ) as obtained by PDFs relative to three cases, p = 0 , 0.01 and p = 0.5 . There is not a wide interval of scaled variable Y where the h ( Y ) is constant. Indeed, also for p = 0 , we find a dependence of the scaling exponent on the scaled variable Y, although the observed variability is small, being Δ h ( Y ) < 0.5 and h ( Y ) = [ 2.17 ± 0.15 ] . This variability is probably due to threshold cutoffs that do not exactly allow the PDFs in the small s region to lie on one smooth straight line. We emphasize that the average scaling exponent h ( Y ) for p = 0 is in good agreement with the index D s = 2.18 . On the other hand, large variations of the scaling exponent h ( Y ) of the scaled variable Y are found for the other two cases, being Δ h ( Y ) 1.2 and Δ h ( Y ) 0.75 , for p = 0.01 and p = 0.5 , respectively. This result suggests that for increasing values of the probability p, multi-scaling features become very relevant. Furthermore, the ROMA spectrum h ( Y ) can be interpreted in terms of a capacity dimension, which depends on the dimension of the scaled avalanche size Y. There is no longer a single capacity dimension D s , but a continuous spectrum of this quantity.
Using the ROMA spectrum, h ( Y ) , we can attempt the data collapsing of the PDFs. We get a very good collapsing in all of the considered cases by applying the following transformation,
Y = s / L h ( Y ) Π ( Y ) = L h ( Y ) + η p ( s , L )
where L η is a normalization factor, with the exponent η τ s 1 . Figure 16 shows the obtained PDFs’ collapsing for the three cases reported in Figure 15.
The obtained data collapsing is good in all three cases and confirms that for increasing p values, the nature of the avalanching process is multi-scaling, indicating a more complex dynamics in comparison with the traditional sand pile model on a regular lattice.
As a result of the ROMA approach, we can say that increasing the probability p, the PDFs of avalanche size s acquire local scaling features, so that the FSS ansatz results in a continuous spectrum h ( Y ) . The situation is analogous to what happens moving from a fractal to multifractal description, which according to Mandelbrot [38] “involves the passage from a finite number of fractal dimensions to an infinite number of dimensions”. In particular, the capacity dimension D s acquires a dependence on the scaled avalanche size s, i.e., D s D s ( Y ) = h ( Y ) .

4. Summary and Conclusions

In this work, we have presented a study of the effect of non-local connectivity, i.e., longer range connectivity, in the avalanching process placed on a simple 1D network instead of 1D regular lattice. In particular, we have presented a detailed study of the changes of the PDFs’ shape as a function of the percentage of longer range links p and the effect that an increasing number of longer range links has on the FSS ansatz.
The main results of this study are the observation of a crossover phenomenon in the statistics of the relaxation events as a function of the percentage of longer range links and the breaking of the simple Finite Size Scaling (FSS). Furthermore, according to De Arcangelis and Herrmann [16], we also found evidence for a crossover phenomenon to mean field behavior ( τ 3 / 2 ), although, different from their results, a characteristic avalanche size s seems to emerge at larger values of p ( p p c 0.01 ). This manifests in a peak in the PDFs of avalanche size s for large s. This secondary behavior could be due to the emergence of a non-critical dynamics, i.e., a pseudo-first order dynamics, so that the overall dynamics at large values of p is the result of pseudo-first order and second order (critical) relaxation phenomena/processes.
The investigation of FSS has clearly shown how a certain amount of longer range connectivity increases the multi-scaling nature of FSS. This point has been investigated using the ROMA approach introduced by Chang and Wu [25], which leads to the determination of a spectrum h ( Y ) of scaling indices as the generalization of the FSS ansatz. The existence of a continuous spectrum of scaling indices for large p is analogous to the transition from fractal to multifractal description of geometrical objects/distributions [38]. The application of the ROMA method to PDFs’ collapsing also demonstrates that the avalanching nature is also multi-scaling for p = 0 at small values of s. The observation of multi-scaling features in the avalanching dynamics of 1D networks with or without a longer range connectivity supports the hypothesis that the critical nature of this dynamical process is more complex when compared to equilibrium critical phenomena. The emergence of multifractal scaling in the avalanching process is something that it is not simple to explain, the dynamics being shown in our simulation in the interface between simple sand pile CA models and network systems. However, multifractal scaling features are also observed in sand pile CA models on regular lattice structures [19,33] when sites can have multiple toppling during the same avalanche. Thus, the addition of longer range links, which might cause a network change from a small world structure to a random graph one, can generate the formation of closed loops shorter than the system size L, which would imply multiple toppling of sites. This is supported by a preliminary analysis of the shortest path density ( L ; p ) [39] as a function of the parameter p (data not shown), which shows a clear departure on the linearity for increasing values of the parameter p. These RG loops could also be responsible for the emergence of the peak in the PDFs for large avalanche size s. Indeed, for large avalanches quoting Hoore and Moghimi-Araghi [19] “the probability of finding a site in the toppled sites that has long-ranged bond approaches 1 and hence the statistics of the avalanche sizes changes”. This point can be substantiated by the fact that the sand pile dynamics can be substantially modified by changing the connectivity structure, which affects the adjacency matrix (describing the locally connected network) and the related toppling operator. Clearly, a better understanding of the emergence of multiscaling features would require a detailed analysis of the link with the formation and features of closed loops in the transition from the SW network to the RG one for increasing number of longer range links. We demand this analysis in a more dedicated future work.
Furthermore, the degree of complexity of this avalanching process seems to increase with the increasing number of longer range links, which manifests in the simultaneous coexistence of competing pseudo-first (see, e.g., the occurrence of a characteristic scale for avalanche sizes) and pseudo-second order (scale-invariant relaxation events) processes. The evidence for this complexity increase can be found in a wider ROMA spectrum h ( Y ) at large p.
A similar situation where out-of-equilibrium dynamics contemporarily shows pseudo-first order behavior and the pseudo-second order one has been observed in the magnetospheric dynamics in response to solar wind changes during geomagnetic substorms [40,41]. Indeed, Sitnov et al. [41] have shown how the magnetospheric dynamics in the course of geomagnetic substorms exhibits a number of features that are typical of non-equilibrium phase transitions with both first order and second order features. Furthermore, the PDFs of the energy released during magnetospheric substorms, as indirectly measured by Auroral Electrojet (AE) geomagnetic indices, resemble the one observed in the limit of large p [9].
We believe that our results can be helpful to explain the evidence of first order- and second order-like behavior and the occurrence of multi-scaling features in non-equilibrium systems characterized by an avalanching dynamics.

Acknowledgments

This research has received funding from the European Community’s Seventh Framework Programme (FP7/2007–2013) under Grant Agreement No. 313038/STORM and the Italian Ministero dell’Istruzione, dell’Università e della Ricerca (MIUR) under Grant Agreement no. PRIN-2012P2HRCR on “The active Sun and its effects on Space and Earth climate”.

Author Contributions

Simone Benella and Giuseppe Consolini conceived of, designed and performed the simulations. Simone Benella, Giuseppe Consolini and Fabio Giannattasio analyzed the data. Simone Benella, Giuseppe Consolini, Fabio Giannattasio, Tom Chang and Marius Echim contributed to the results’ interpretation and theoretical discussions. All of the authors participated in writing the manuscript.

Conflicts of Interest

The authors declare no conflict of interest. The founding sponsors had no role in the design of the study; in the collection, analyses or interpretation of data; in the writing of the manuscript; nor in the decision to publish the results.

Abbreviations

The following abbreviations are used in this manuscript:
1D1-Dimensional
2D2-Dimensional
BTW modelBak–Tang–Weisenfeld model
CACellular Automaton/a
CMECoronal Mass Ejection
EUVExtra Ultra Violet
FSSFinite Size Scaling
HXRHard X-Ray
PDFProbability Distribution Function
RGRandom graph
ROMARank-Ordered Multifractal Analysis
SOCSelf-Organized Criticality
SXRSoft X-Ray
SWSmall World

References

  1. Bak, P.; Tang, C.; Weisenfeld, K. Self-organized criticality: An explanation of 1/f noise. Phys. Rev. Lett. 1987, 59, 381–384. [Google Scholar] [CrossRef] [PubMed]
  2. Sornette, D. Critical Phenomena in Natural Sciences; Springer-Verlag: Berlin/Heidelberg, Germany, 2001. [Google Scholar]
  3. Watkins, N.W.; Pruessner, G.; Chapman, S.C.; Crosby, N.B.; Jensen, H.J. 25 Years of Self-organized Criticality: Concepts and Cotroversies. Space Sci. Rev. 2016, 198, 3–44. [Google Scholar] [CrossRef]
  4. Jensen, H.J. Self-Organized Criticality: Emergent Complex Behavior in Physical and Biological Systems; Cambridge University Press: Cambridge, UK, 1998. [Google Scholar]
  5. Turcotte, D.L. Self-organized criticality. Rep. Prog. Phys. 1999, 62, 1377–1429. [Google Scholar] [CrossRef]
  6. Aschwanden, M.J. Self-Organized Criticality in Astrophysics; Springer-Verlag: Berlin/Heidelberg, Germany, 2011. [Google Scholar]
  7. Lu, E.T.; Hamilton, R.J. Avalanches and the distribution of solar flares. Astrophys. J. 1991, 380, L89–L92. [Google Scholar] [CrossRef]
  8. Consolini, G. Sandpile cellular automata and magnetospheric dynamics. In Proceedings of the 8th GIFCO Conference, Cosmic Physics in the Year 2000: Scientific Perspectives and New Instrumentation, Como, Italy, 8–10 April 1997; Volume 58, pp. 123–126. [Google Scholar]
  9. Consolini, G. Self-Organized Criticality: A new paradigm for the magnetotail dynamics. Fractals 2002, 10, 275–283. [Google Scholar] [CrossRef]
  10. Uritsky, V.M.; Pudovkin, M.I. Low frequency 1/f-like fluctuations of the AE-index as a possible manifestation of self-organized criticality in the magnetosphere. Ann. Geophys. 1998, 16, 1580–1588. [Google Scholar] [CrossRef]
  11. Uritsky, V.M.; Klimas, A.J.; Vassiliadis, D.; Chua, D.; Parks, G. Scale-free statistics of spatiotemporal auroral emissions as depicted by POLAR UVI images: Dynamic magnetosphere is an avalanching system. J. Geophys. Res. 2002, 1078, 1426. [Google Scholar] [CrossRef]
  12. Aschwanden, M.J.; Tarbell, T.D.; Nightingale, R.W.; Schrijver, C.J.; Title, A.; Kankelborg, C.C.; Martens, P.; Warren, H.P. Time Variability of the “Quiet” Sun Observed with TRACE. II. Physical Parameters, Temperature Evolution, and Energetics of Extreme-Ultraviolet Nanoflares. Astrophys. J. 2000, 535, 1047–1065. [Google Scholar] [CrossRef]
  13. Chang, T.T.S. An Introduction to Space Plasma Complexity; Cambridge University Press: Cambridge, UK, 2015. [Google Scholar]
  14. Schrijver, C.J.; Title, A.M. Long-range magnetic couplings between solar flares and coronal mass ejections observed by SDO and STEREO. J. Geophys. Res. 2011, 116, A04108. [Google Scholar] [CrossRef]
  15. Marković, D.; Gros, C. Power laws and self-organized criticality in theory and nature. Phys. Rep. 2014, 536, 41–74. [Google Scholar] [CrossRef]
  16. De Arcangelis, L.; Herrmann, H.J. Self-organized criticality on small world networks. Physica A 2002, 308, 545–549. [Google Scholar] [CrossRef]
  17. Lahtinen, J.; Kertész, J.; Kaski, K. Sandpiles on Watts-Strogatz type small-words. Physica A 2005, 349, 535–547. [Google Scholar] [CrossRef]
  18. Watts, D.J.; Strogatz, S.H. Collective dynamics of “small world” networks. Nature 1998, 393, 440. [Google Scholar] [CrossRef] [PubMed]
  19. Hoore, M.; Moghimi-Araghi, S. Critical behavior of a small world sand pile model. J. Phys. A Math. Theor. 2013, 46, 195001. [Google Scholar] [CrossRef]
  20. Ferdinand, A.E.; Fisher, M.E. Bounded and Inhomogeneous Ising Models. I. Specific-Heat Anomaly of a Finite Lattice. Phys. Rev. 1969, 185, 832–846. [Google Scholar] [CrossRef]
  21. Fisher, M.E. Critical Phenomena. In Proc. 51st Enrico Fermi Summer School; Green, M.S., Ed.; Academic Press: Cambridge, MA, USA, 1971. [Google Scholar]
  22. Cardy, J.L. (Ed.) Finite-size Scaling. Current Physics Sources and Comments; Elsevier: North Holland, The Netherlands, 1988; Volume 2. [Google Scholar]
  23. Christensen, K.; Moloney, N.R. Complexity and Criticality; Imperial College Press: London, UK, 2005. [Google Scholar]
  24. Manna, S.S. Two-state model of self-organized criticality. J. Phys. A 1991, 24, L363–L369. [Google Scholar] [CrossRef]
  25. Chang, T.T.S.; Wu, C.-C. Rank-ordered multifractal spectrum for intermittent fluctuations. Phys. Rev. E 2008, 77, 045401(R). [Google Scholar] [CrossRef] [PubMed]
  26. Chang, T.T.S. Self-organized criticality, multi-fractal spectra, sporadic localized reconnections and multiscale intermittent turbulence in the magnetotail. Phys. Plasmas 1999, 6, 4137. [Google Scholar] [CrossRef]
  27. Consolini, G.; Chang, T.T.S. Magnetotail filed topology and criticality in geotail dynamics: Relevance to substorm phenomena. Space Sci. Rev. 2001, 95, 309–321. [Google Scholar] [CrossRef]
  28. Bak, P.; Tang, C.; Wiesenfeld, K. Self-organized criticality. Phys. Rev. A 1988, 38, 364–375. [Google Scholar] [CrossRef]
  29. Newman, M.E.J.; Watts, D.J. Renormalization group analysis of the small world network model. Phys. Lett. A 1999, 263, 341–346. [Google Scholar] [CrossRef]
  30. Chessa, A.; Vespignani, A.; Zapperi, S. Critical exponents in stochastic sand pile models. Comput. Phys. Commun. 1999, 121–122, 299–302. [Google Scholar] [CrossRef]
  31. De Menech, M.; Stella, A.L.; Tebaldi, C. Rare events and breakdown of simple scaling in the Abelian sand pile model. Phys. Rev. E 1998, 58, R2677–R2680. [Google Scholar] [CrossRef]
  32. Ahmed, J.A.; Santra, S.B. Finite size scaling in BTW like sand pile models. Eur. Phys. J. B 2010, 76, 13–20. [Google Scholar] [CrossRef]
  33. Tadić, B. Temporally disordered granular flow: A model of ladslides. Phys. Rev. E 1998, 57, 4375–4381. [Google Scholar] [CrossRef]
  34. Tebaldi, C.; De Menech, M.; Stella, A.L. Multifractal Scaling in the Bak-Tang-Wiesenfeld Sandpile and Edge Events. Phys. Rev. Lett. 1999, 83, 3952–3955. [Google Scholar] [CrossRef]
  35. Lübeck, S. Moment analysis of the probability distribution of different sand pile models. Phys. Rev. E 2000, 61, 204–209. [Google Scholar] [CrossRef]
  36. Dorogovtsev, S.N.; Goltsev, A.V.; Mendes, J.F.F. Critical phenomena in complex networks. Rev. Mod. Phys. 2008, 80, 1275–1335. [Google Scholar] [CrossRef]
  37. Tadić, B.; Thurner, S. Information super-diffusion on structured networks. Physica A 2004, 332, 566–584. [Google Scholar] [CrossRef]
  38. Mandelbrot, B.B. Multifractal measures, especially for geophysicist. Pure Appl. Geophys. 1989, 131, 5–42. [Google Scholar] [CrossRef]
  39. Barrat, A.; Wight, M. On the properties of small world network models. Eur. Phys. J. 2000, 263, 341. [Google Scholar] [CrossRef]
  40. Sharma, A.S.; Sitnov, M.I.; Papadopoulos, K. Substorms as nonequilibrium transitions of the magnetosphere. J. Atmos. Sol. Terr. Phys. 2001, 63, 1399–1406. [Google Scholar] [CrossRef]
  41. Sitnov, M.I.; Sharma, A.S.; Papadopoulos, K.; Vassiliadis, D. Modeling substorm dynamics of the magnetosphere: From self-organization and self-organized criticality to nonequilibrium phase transitions. Phys. Rev. E 2001, 65, 16116. [Google Scholar] [CrossRef] [PubMed]
Figure 1. A sample of a simple network.
Entropy 19 00383 g001
Figure 2. A sample of a Newman–Watts small world network. Each site is connected to the nearby sites plus some additional longer range links.
Entropy 19 00383 g002
Figure 3. Evolution of the mean number of grains z per site as a function of time during the initialization time interval for different network dimension L in the case of p = 0 . The inset is an expansion of the main plot.
Entropy 19 00383 g003
Figure 4. The distributions (probability density functions—PDFs) of the avalanche size s (panel a) and duration T (panel b) for the case of no longer range links ( p = 0 ).
Entropy 19 00383 g004
Figure 5. The evolution of the PDFs of the avalanche size s (panel a) and duration T (panel b) with p for L = 10,000. PDFs are scaled by a constant factor for convenience ( p = 0 , 0.001 and 0.01 scaled by a factor 10 3 , 10 2 and 10, respectively).
Entropy 19 00383 g005
Figure 6. Trend of the avalanche mean size s and duration T on the p probability in the case of N t = 1000 .
Entropy 19 00383 g006
Figure 7. Dependence of the mean avalanche size s (panel a) and duration T (panel b) as a function of the network/system size L for different values of p. In particular, the left panel shows the scaling of the mean avalanche size as a function of L for a set of five values of p, while the right panel displays a comparison of the scaling feature with the network/system size L of the mean avalanche size s and duration T for p = 0 and p = 0.5 , respectively.
Entropy 19 00383 g007
Figure 8. The evolution of the PDFs of the avalanche size s with different system sizes L for two values of p: panel (a) for p = 0 and panel (b) for p = 0.1 , respectively. The panel (a) reports the same distributions for the avalanche size s shown in Figure 4.
Entropy 19 00383 g008
Figure 9. The momenta spectra σ s ( q ) relative to the avalanche size s for five different values of p.
Entropy 19 00383 g009
Figure 10. Avalanche size PDFs for p = 0 and 0.5 . The two lines refer to the expected power law behavior in the critical 1D Manna model τ s 1 and according to the mean field theory, τ s = 3 / 2 .
Entropy 19 00383 g010
Figure 11. Dependence of the capacity dimension D s relative to the avalanche size s as a function of the probability p. The dashed curve is an eye-guide.
Entropy 19 00383 g011
Figure 12. Data collapse of the PDFs of the avalanche size s for values of p 0.01 for simulations with L = 10,000. Here, we have assumed τ s = 1 . The best value for data collapsing is found in correspondence with ϕ = 5 / 4 .
Entropy 19 00383 g012
Figure 13. Collapsing of the PDFs of the avalanche size s for three different values of p (panels (a), (b) and (c) for p = 0 , 0.01 and 0.5 , respectively) using the scaling indices from moment analysis ( D s and τ s ).
Entropy 19 00383 g013
Figure 14. Collapsing of the PDFs of the avalanche size s for two different values of p, p = 0.01 and 0.5 —panel (a) and (b) respectively, using the scaling indices D s and τ s * .
Entropy 19 00383 g014
Figure 15. The ROMA spectra, h ( Y ) , relative to three cases p = 0 , 0.01 and 0.5 .
Entropy 19 00383 g015
Figure 16. Collapsing of the PDFs relative to the p = 0 , 0.01 (a,b) and p = 0.5 (c) simulations using the ROMA spectra h ( Y ) reported in Figure 15. The dashed line refers to a power law Y 1 .
Entropy 19 00383 g016
Table 1. D s , τ s and τ s * scaling indices versus the probability p of extra links.
p D s τ s τ s *
02.1801.090 0.99 ± 0.06
0.0012.1291.143 1.05 ± 0.07
0.0022.0671.247 1.19 ± 0.06
0.0041.8211.237 1.28 ± 0.02
0.0061.6691.210 1.35 ± 0.03
0.0081.6971.277 1.36 ± 0.02
0.011.5941.254 1.39 ± 0.02
0.021.4531.263 1.46 ± 0.03
0.041.4001.249 1.48 ± 0.03
0.061.3651.234 1.48 ± 0.04
0.11.3281.226 1.50 ± 0.03
0.21.3371.236 1.52 ± 0.03
0.41.3291.238 1.53 ± 0.03
0.51.3091.231 1.52 ± 0.04

