Investigation of the Pressure Gain Characteristics and Cycle Performance in Gas Turbines Based on Interstage Bleeding Rotating Detonation Combustion

Abstract
:1. Introduction
2. Methodology
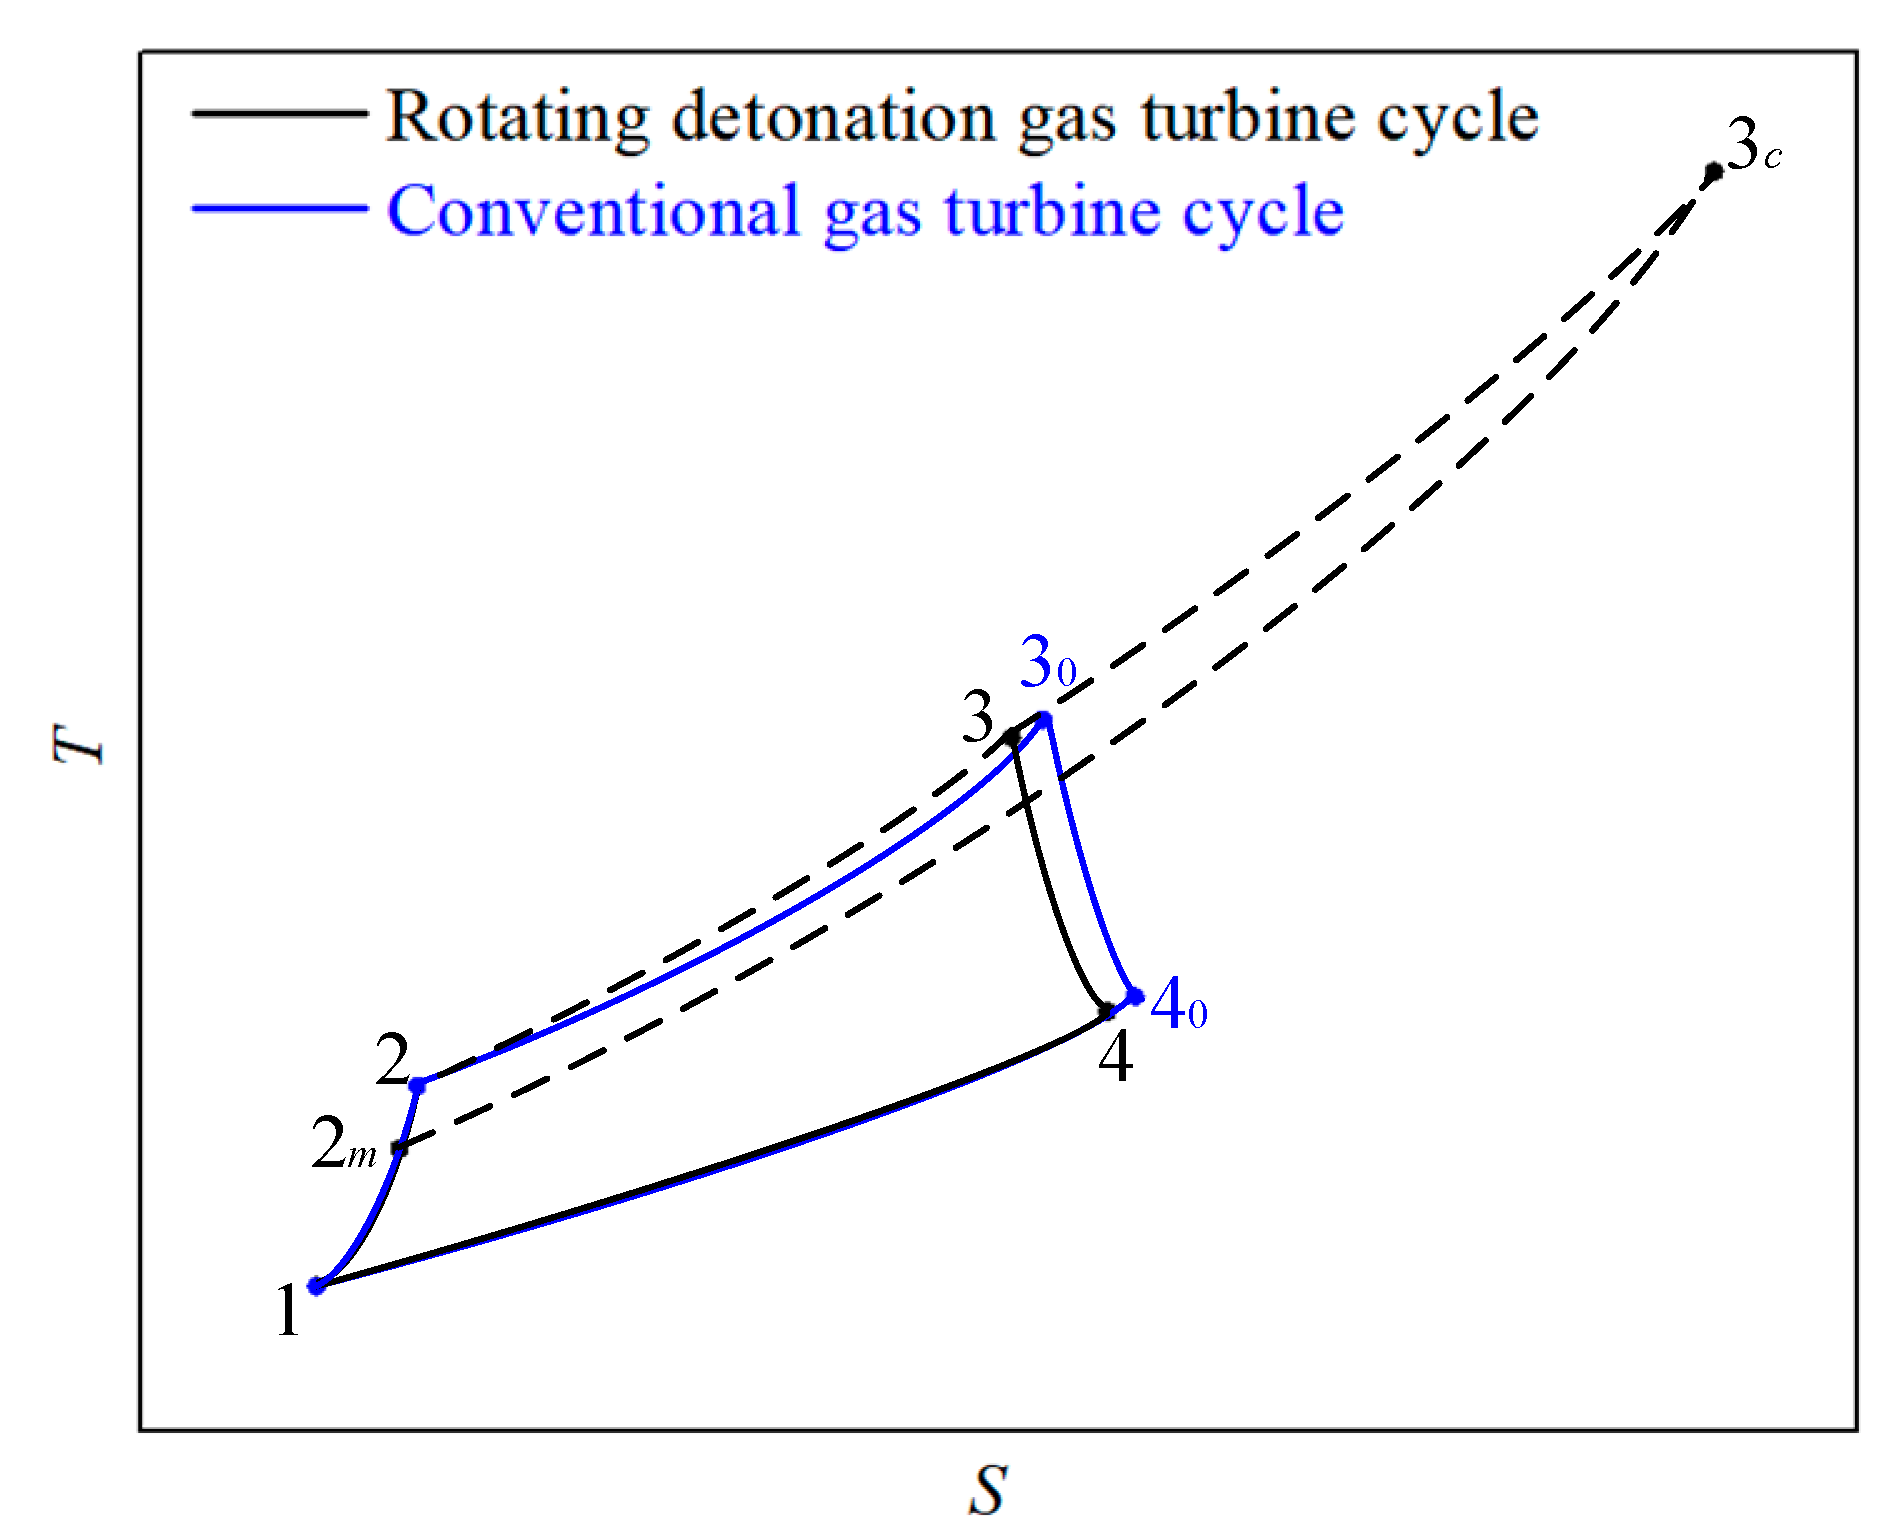
2.1. Cycle Scheme
2.2. Physical Model and Computing Method
- Compressor model (1→2)
- Combustion model (2m→3c/2→30)
- Mixer model (3c→3)
- Turbine model (3→4/30→40)
3. Results and Discussion
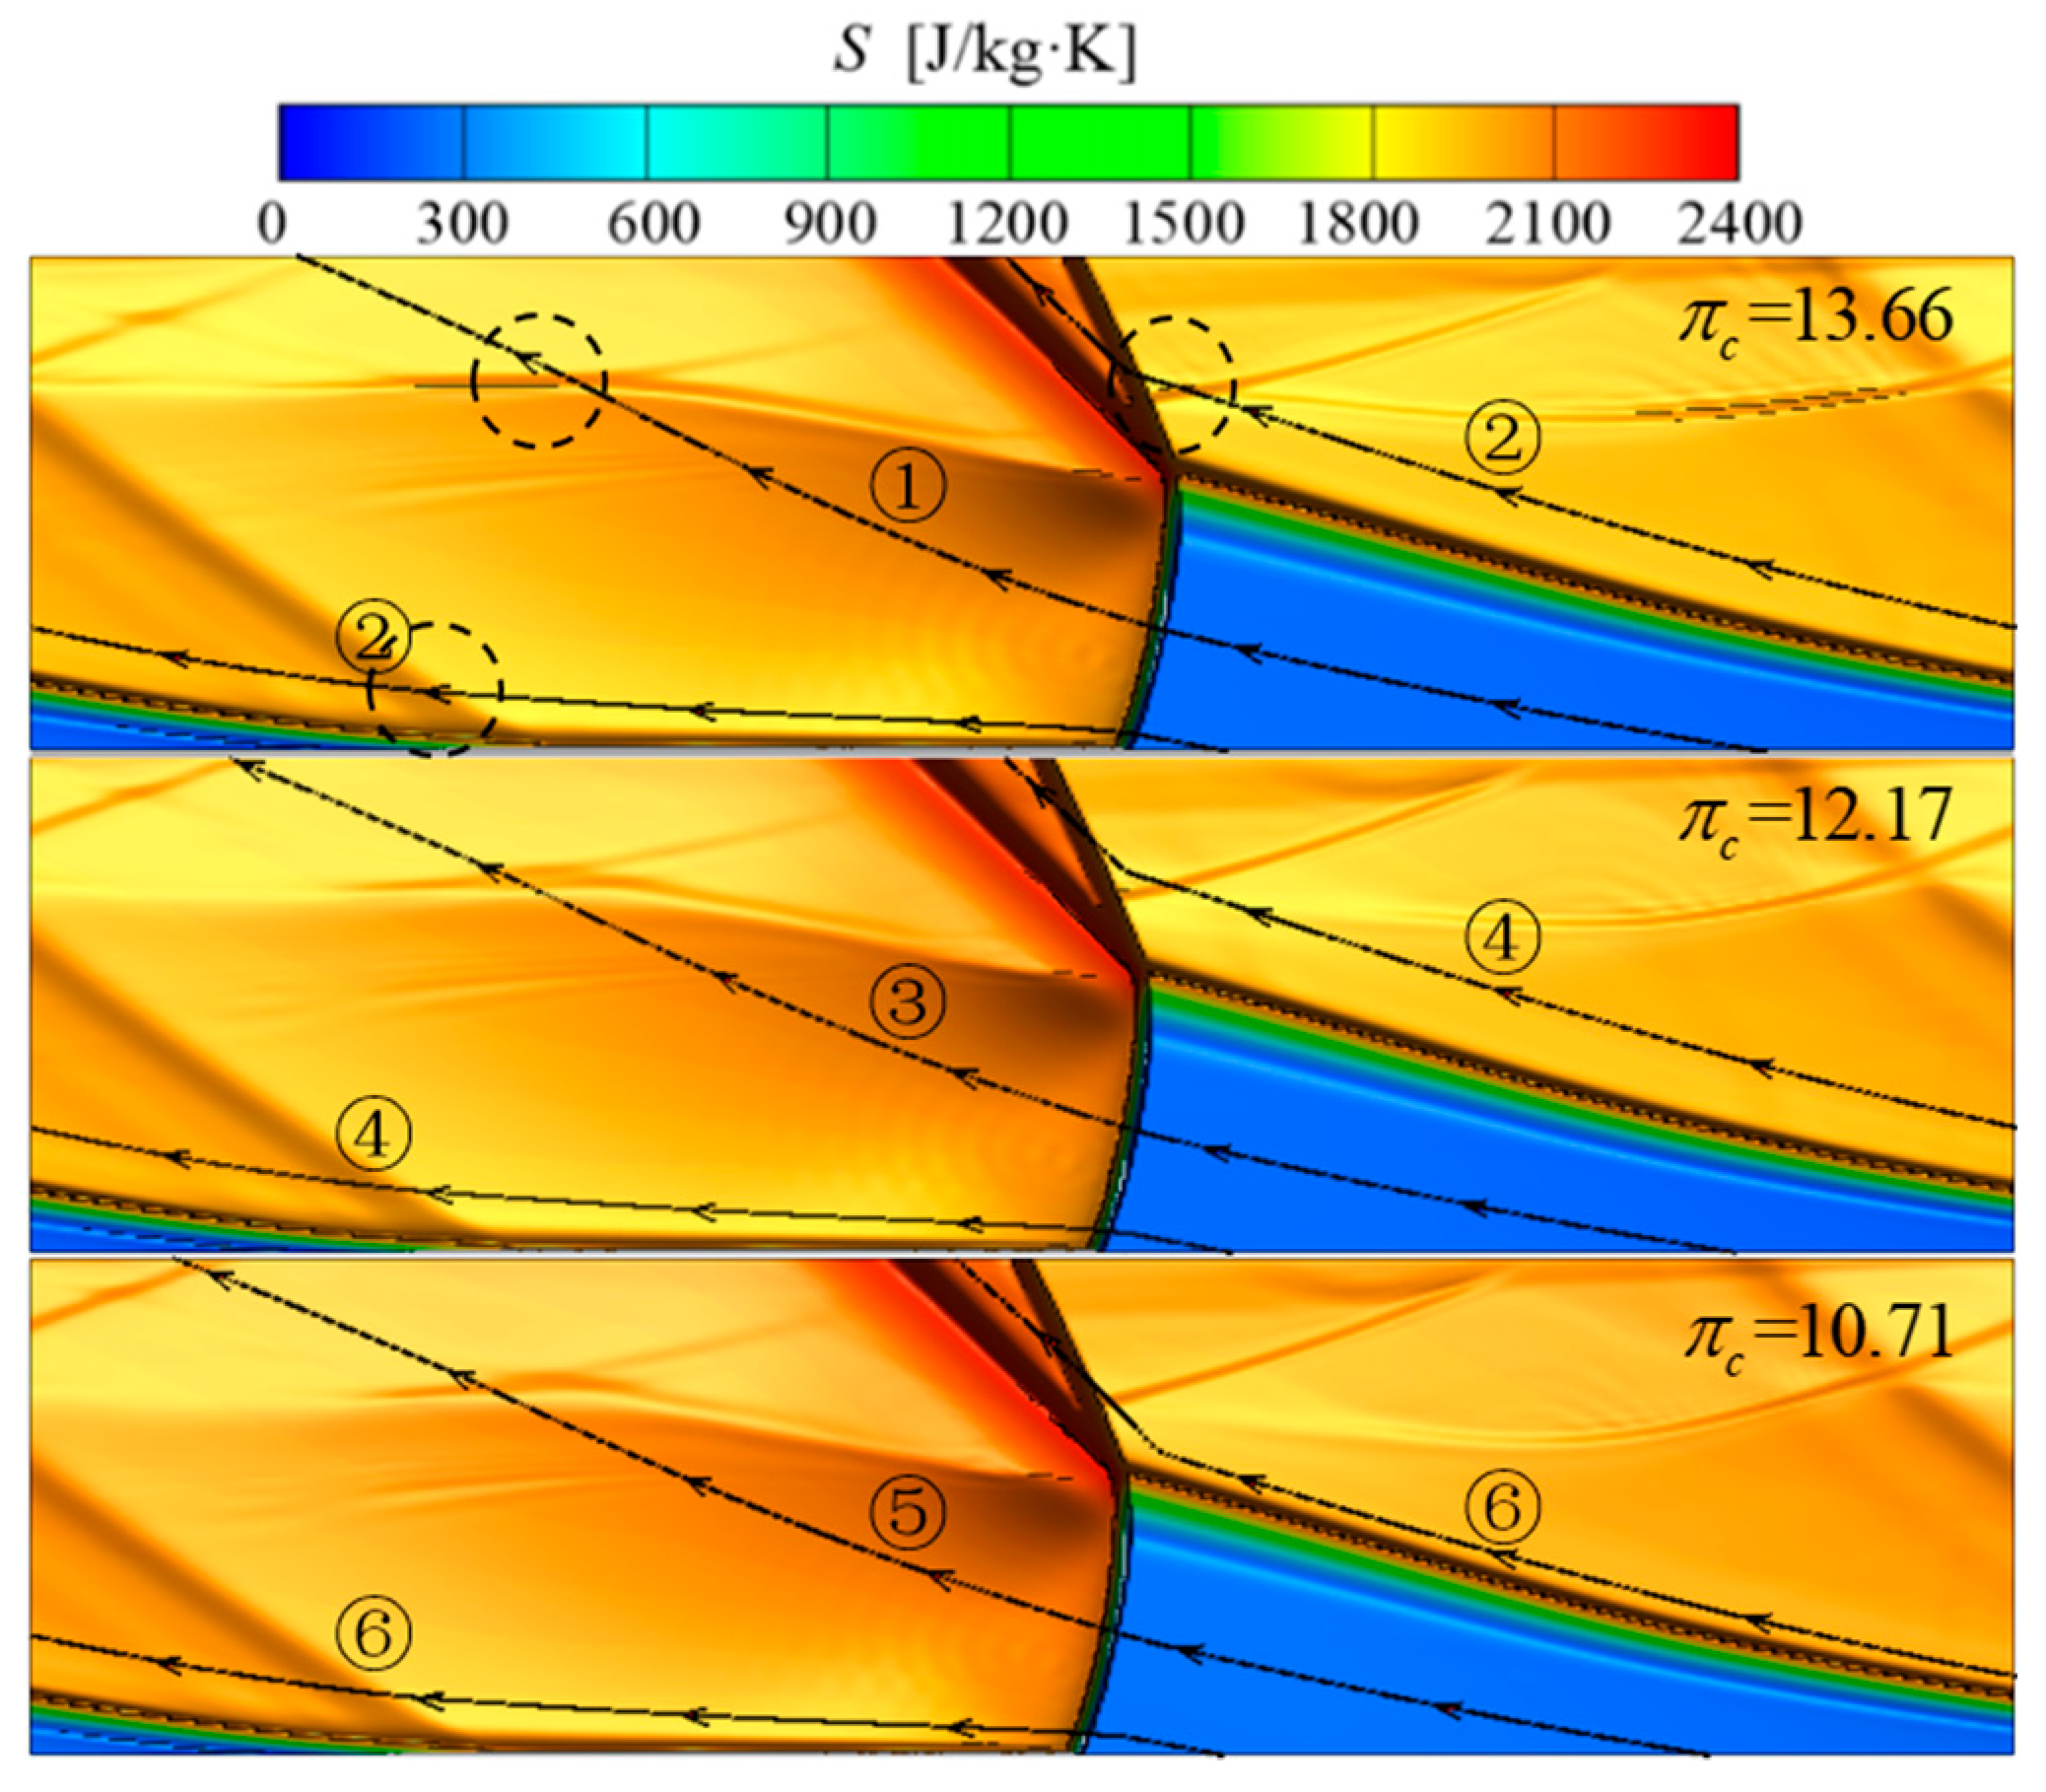
3.1. Flow Field Characteristic Research of RDC
3.2. Variations of RDC Characteristic Parameters at Different Compressor Pressure Ratios
3.3. Investigation of Cycle Performance in Gas Turbine Based on Interstage Bleeding Rotating Detonation Combustion
4. Conclusions
- (1)
- There were significant differences of pressure variation along different types of path lines, but the pressurization characteristics of the RDC were obvious in general.
- (2)
- Compared with the conventional gas turbine cycle, the non-negligible pressure gain characteristics acquired in the interstage bleeding rotating detonation combustor contributed to an obvious performance improvement in the rotating detonation gas turbine cycle. The power generation enhancements were all beyond 400 kW and the cycle efficiency enhancement rates were all greater than 6.72%. Additionally, the turbine inlet total temperature showed a decrease of over 19 K.
- (3)
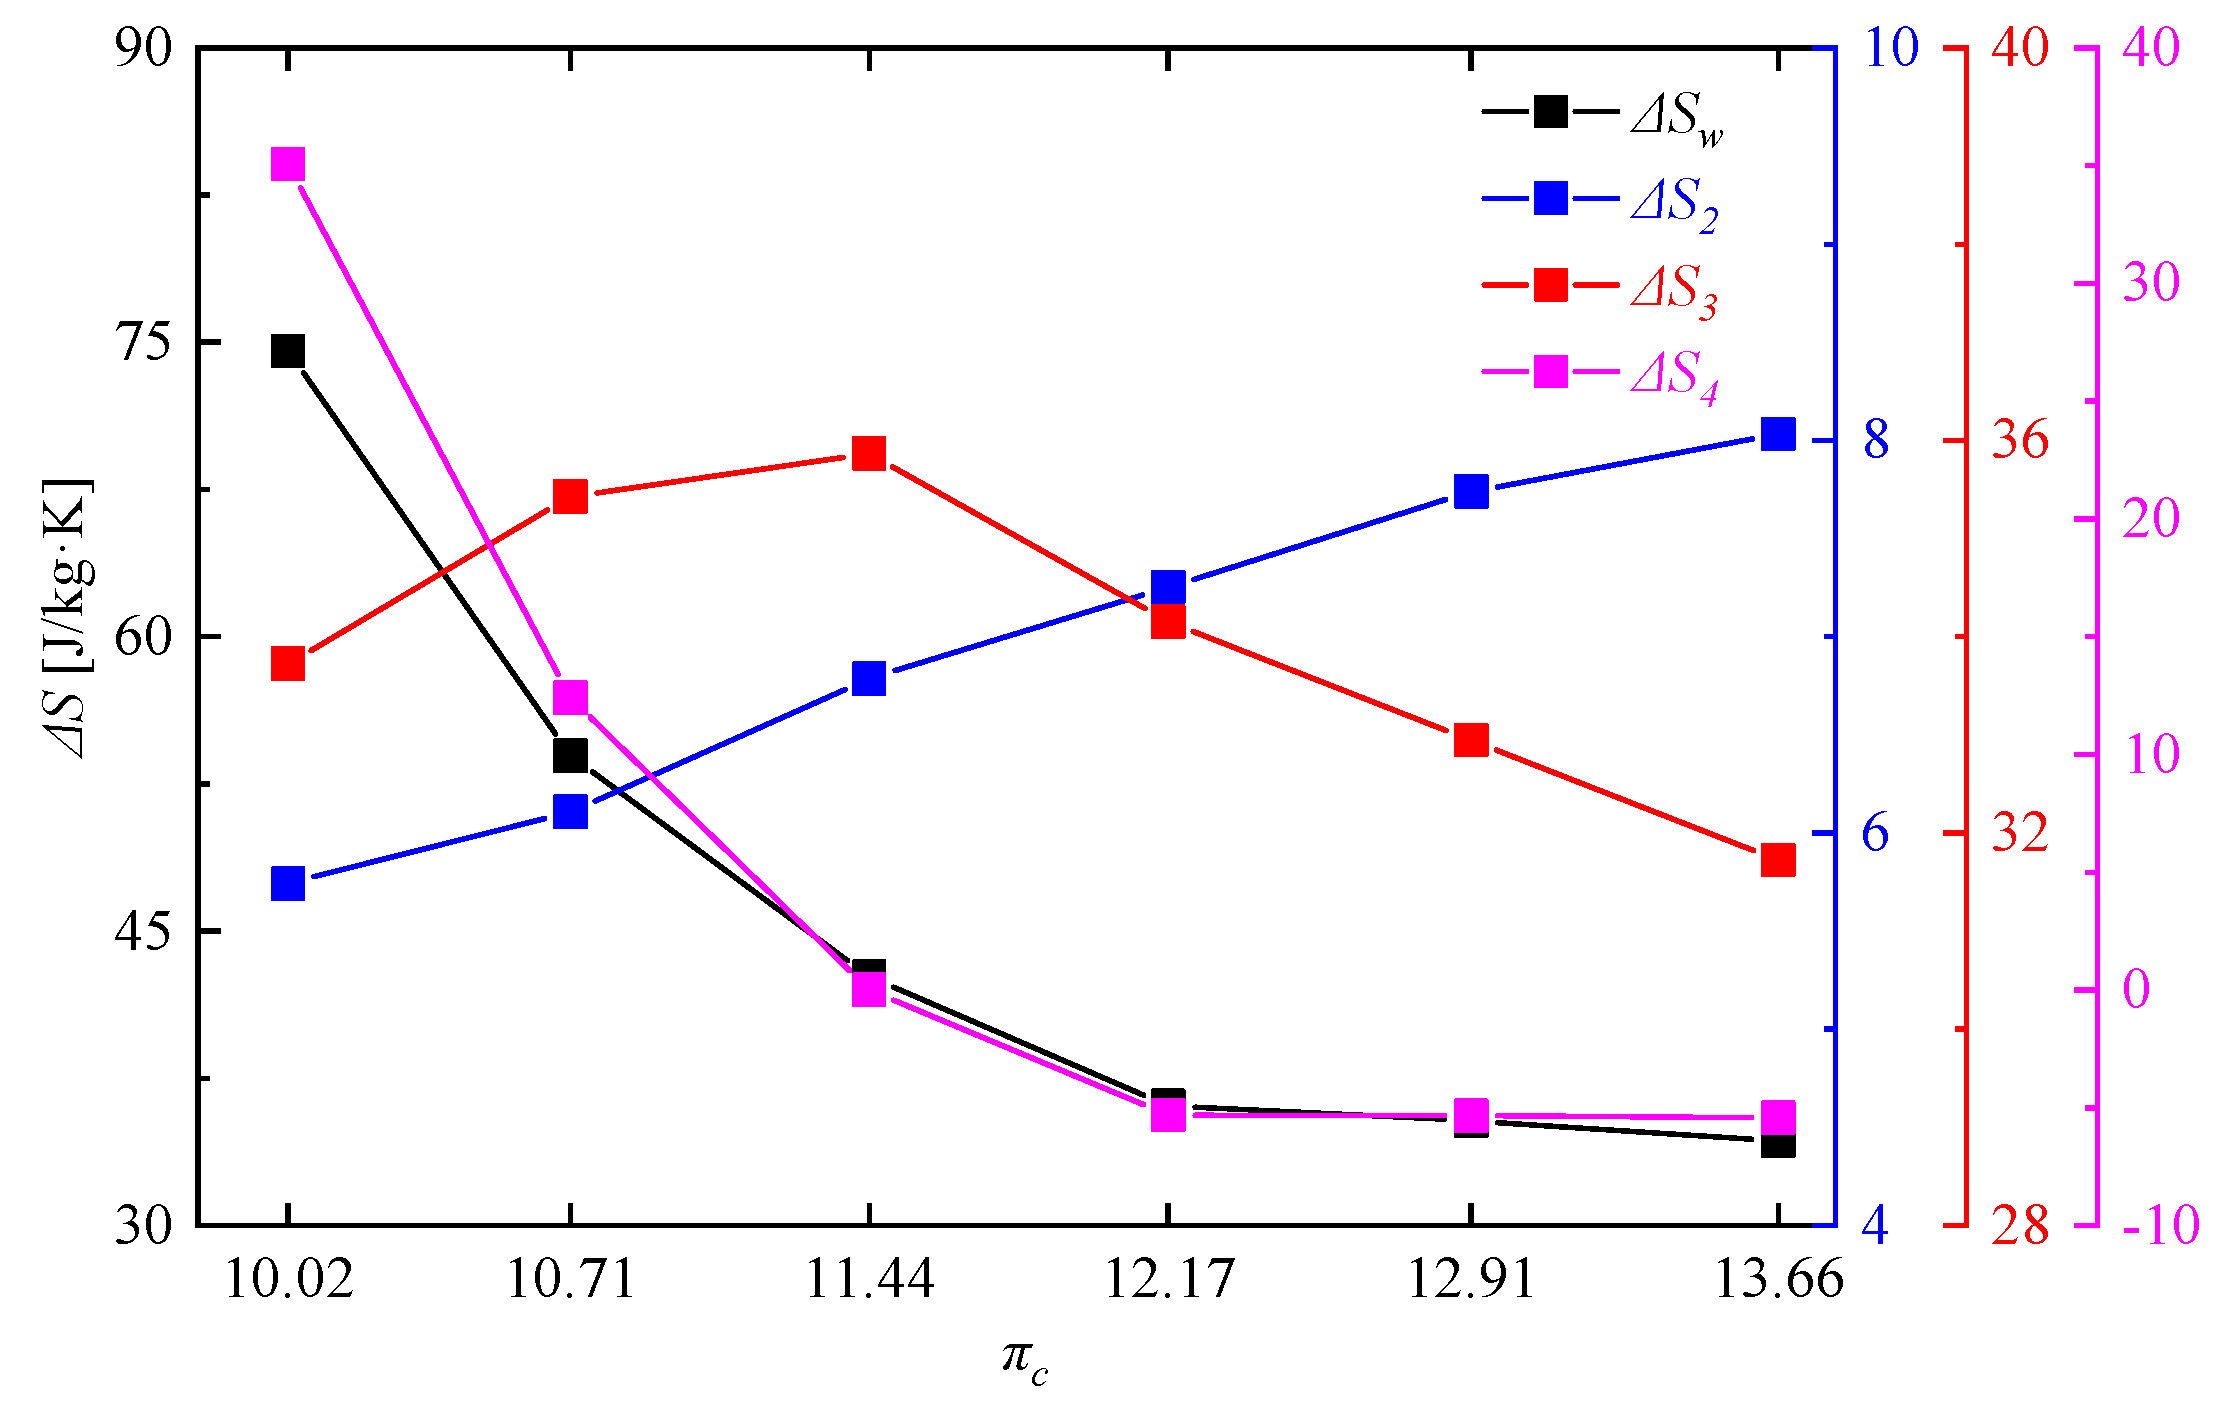
- Due to the differences of entropy change between iso-pressure combustion and rotating detonation combustion, the pressurization ratio of the RDC increased with the decrease of compressor ratio, which would have a leading influence on the performance improvement in the rotating detonation gas turbine cycle. When the compressor pressure ratio decreased from 13.66 to 10.02, the pressurization ratio of the RDC increased from 1.7791 to 1.8545, then the power generation enhancement rate and cycle efficiency enhancement rate increased from 6.72% to 11.89%.
- (4)
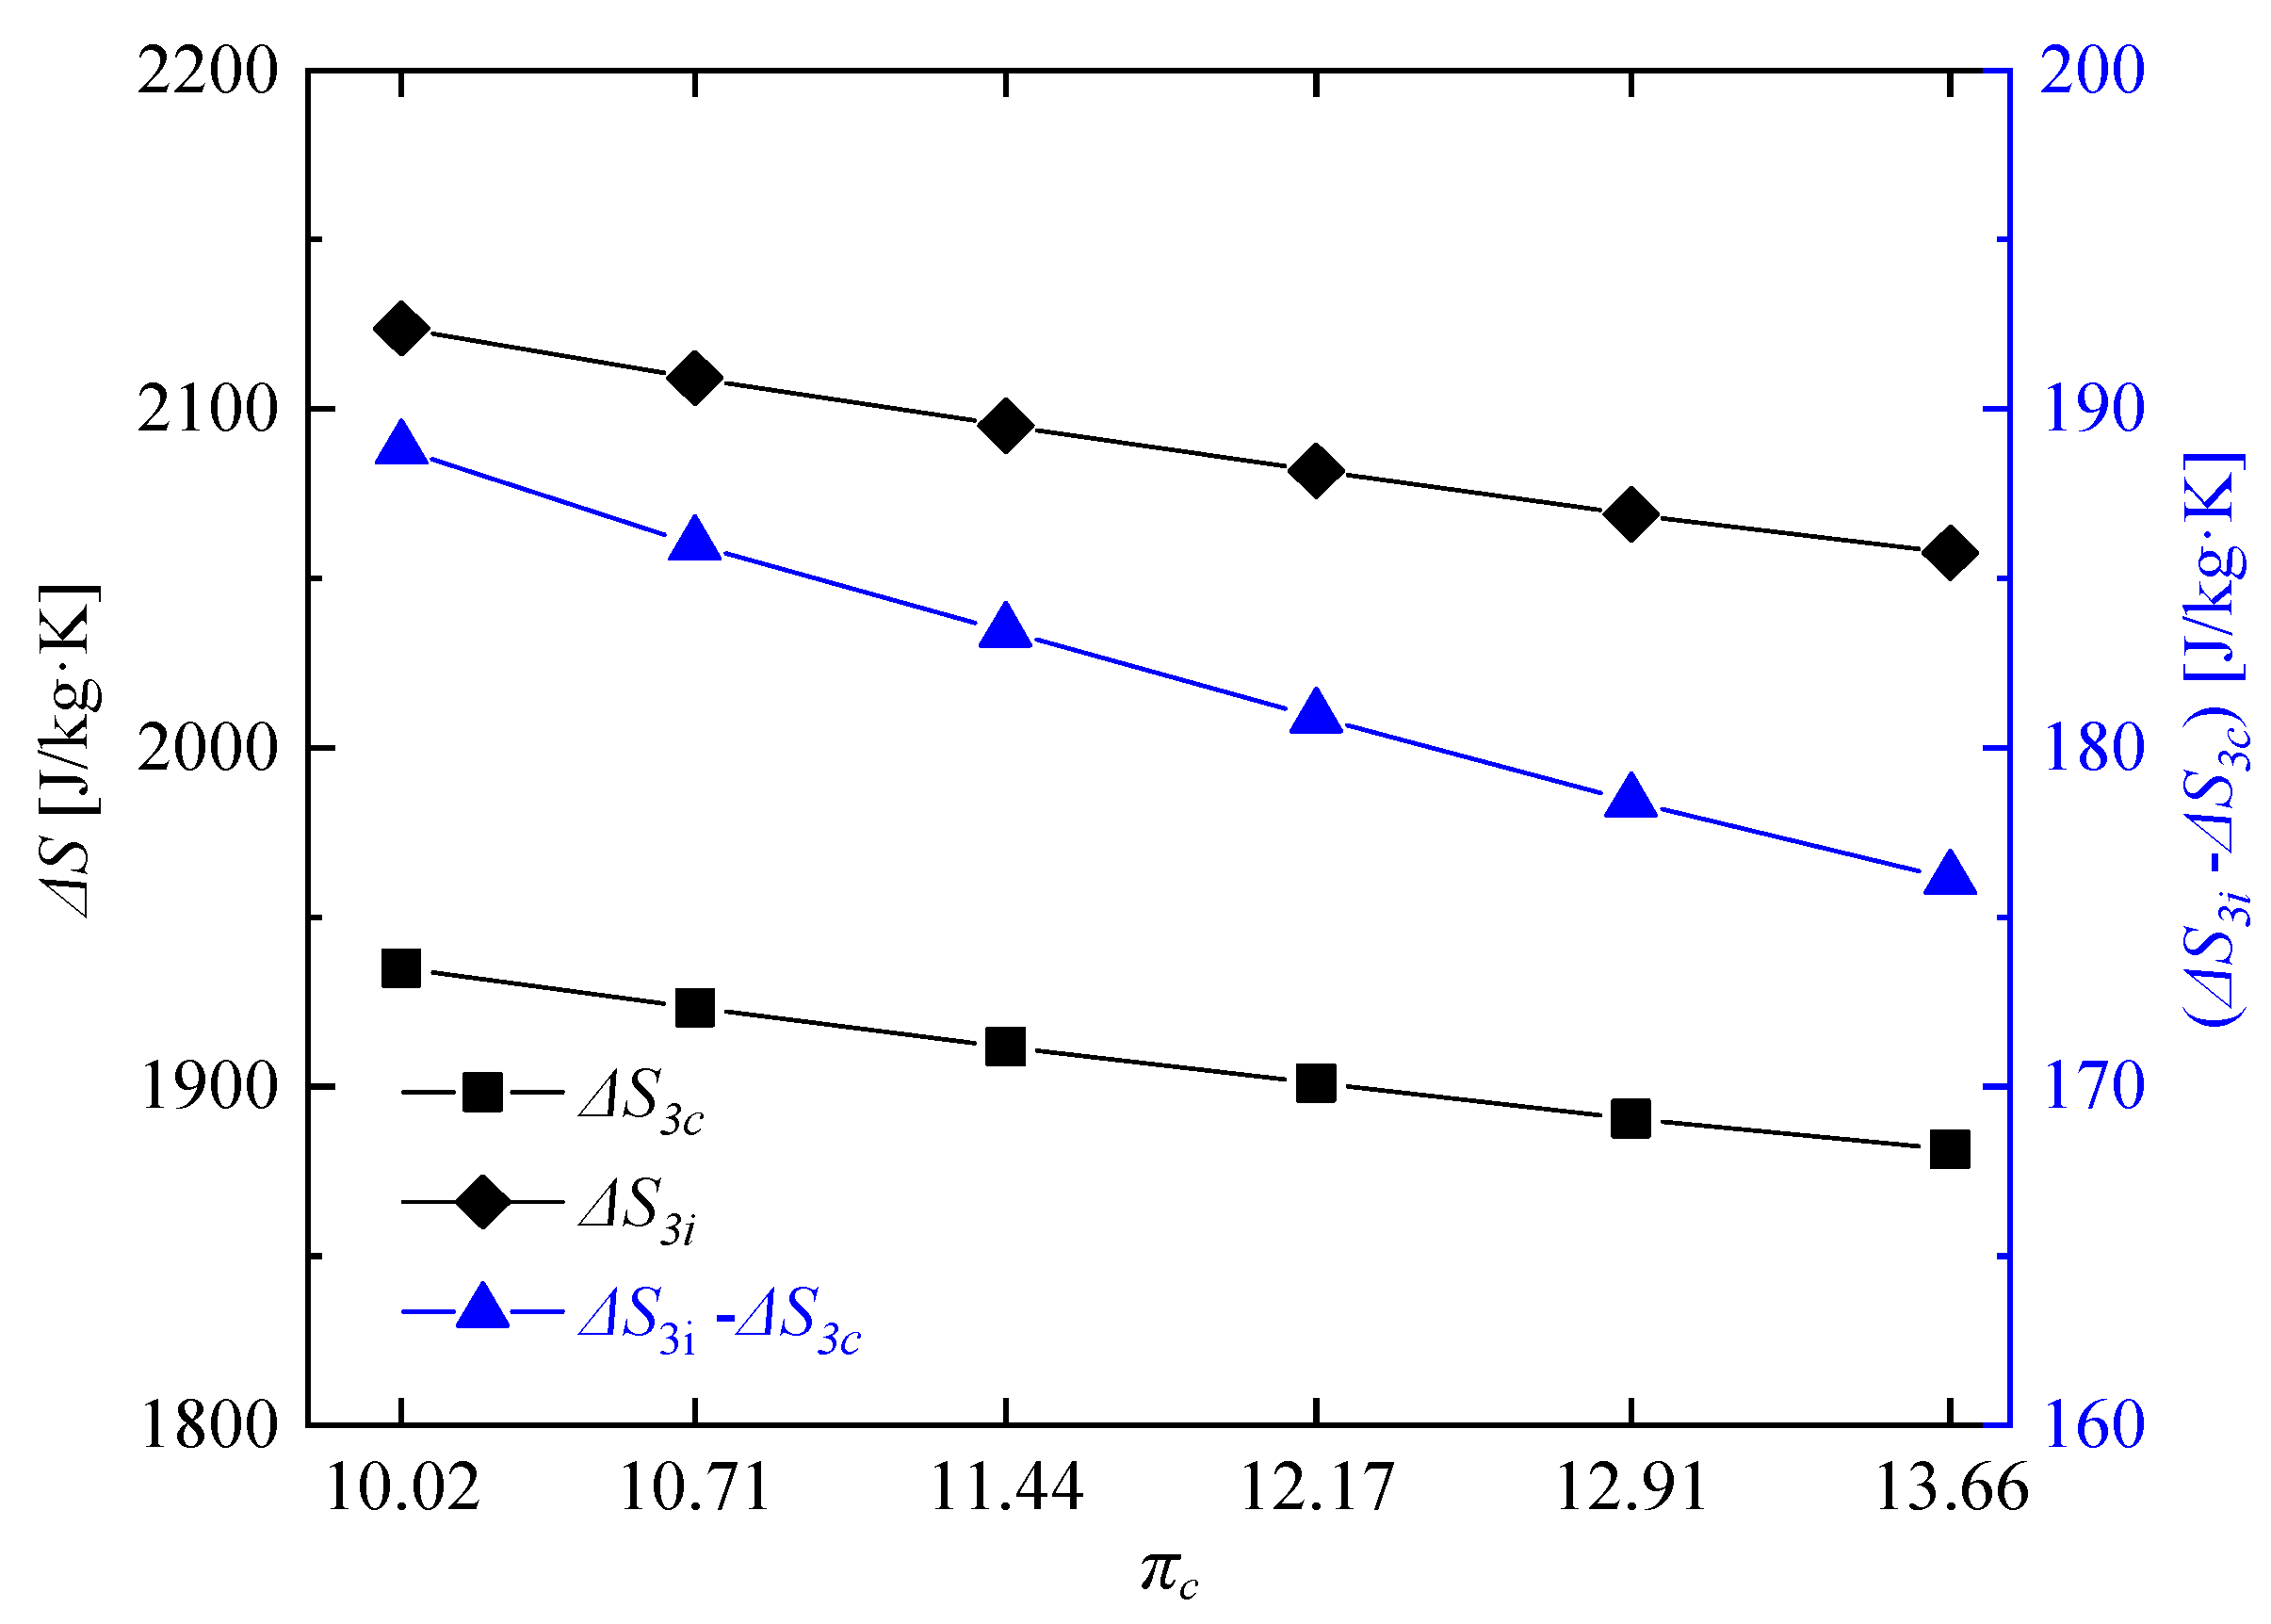
- Compared with the reference gas turbine cycle, the difference of turbine entropy change in the rotating detonation gas turbine cycle played a decisive role in the entropy change of whole working process.
Author Contributions
Funding
Conflicts of Interest
References
- Durmusoglu, Y.; Ust, Y. Thermodynamic optimization of an irreversible regenerative closed Brayton cycle based on thermoeconomic performance criterion. Appl. Math. Model. 2014, 38, 5174–5186. [Google Scholar] [CrossRef]
- Liu, Y.Z.; Sun, X.X.; Sethi, V.; Nalianda, D.; Li, Y.G.; Wang, L. Review of modern low emissions combustion technologies for aero gas turbine engines. Prog. Aerosp. Sci. 2017, 94, 12–45. [Google Scholar] [CrossRef]
- Lu, F.K.; Braun, E.M. Rotating detonation wave propulsion: Experimental challenges, modeling, and engine concepts. J. Propuls. Power 2014, 30, 1125–1142. [Google Scholar] [CrossRef]
- Paxson, D.E.; Perkins, H.D. Thermal load considerations for detonative combustion-based gas turbine engines. In Proceedings of the 40th AIAA Aerospace Sciences Meeting, AIAA 2014-3396, Fort Lauderdale, FL, USA, 11–14 July 2004. [Google Scholar]
- Kailasanath, K. Recent developments in the research on rotating-detonation wave engines. In Proceedings of the 55th AIAA Aerospace Sciences Meeting, AIAA 2017-0784, Grapevine, TX, USA, 9–13 January 2017. [Google Scholar]
- Chan, S.; Liu, H. Mass-based design and optimization of wave rotors for gas turbine engine enhancement. Shock Waves 2016, 2, 1–12. [Google Scholar] [CrossRef]
- Bobusch, B.C.; Berndt, P.; Paschereit, C.O.; Klein, R. Shockless explosion combustion: An innovative way of efficient constant volume combustion in gas turbines. Combust. Sci. Technol. 2014, 186, 1680–1689. [Google Scholar] [CrossRef]
- Berndt, P.; Klein, R. Modeling the kinetics of the shockless explosion combustion. Combust. Flame 2017, 175, 16–26. [Google Scholar] [CrossRef]
- Wintenberger, E.; Sheperd, J.E. Thermodynamic cycle of analysis for propagating detonations. Thermodynamic Cycle Analysis for Propagating Detonations. J. Propuls. Power 2006, 22, 694–698. [Google Scholar] [CrossRef]
- Wintenberger, E.; Sheperd, J.E. A model for the performance of air-breathing pulse detonation engines. In Proceedings of the 39th AIAA Aerospace Sciences Meeting, AIAA 2003-4511, Huntsville, AL, USA, 20–23 July 2003. [Google Scholar]
- Wolański, P. Detonative propulsion. Proc. Combust. Inst. 2013, 34, 125–158. [Google Scholar] [CrossRef]
- Yao, S.B.; Ma, Z.; Zhang, S.J.; Luan, M.Y. Reinitiation phenomenon in hydrogen-air rotating detonation engine. Int. J. Hydrog. Energy 2017, 42, 28588–28598. [Google Scholar] [CrossRef]
- Meng, Q.Y.; Zhao, N.B.; Zheng, H.T.; Yang, J.L.; Qi, L. Numerical investigation of the effect of inlet mass flow rates on H2/air non-premixed rotating detonation wave. Int. J. Hydrog. Energy 2018, 43, 13618–13631. [Google Scholar] [CrossRef]
- Lin, W.; Zhou, J.; Liu, S.J.; Lin, Z.Y. An experimental study on CH4/O2 continuously rotating detonation wave in a hollow combustion chamber. Exp. Therm. Fluid Sci. 2015, 62, 122–130. [Google Scholar] [CrossRef]
- Bluemner, R.; Bohon, M.D.; Paschereit, C.O. Dynamics of counter-rotating wave modes in an RDC. In Proceedings of the 56th AIAA Aerospace Sciences Meeting, AIAA 2018-4572, Cincinnati, OH, USA, 9–11 July 2018. [Google Scholar]
- Zhou, R.; Wang, J.P. Numerical investigation of flow particle paths and thermodynamic performance of continuously rotating detonation engines. Combust. Flame 2012, 159, 3632–3645. [Google Scholar] [CrossRef]
- Paxson, D.E.; Fotia, M.; Hoke, J.; Schauer, F. Comparison of numerically simulated and experimentally measured performance of a rotating detonation engine. In Proceedings of the 53rd AIAA Aerospace Sciences Meeting, AIAA 2015-1101, Kissimmee, FL, USA, 5–9 January 2015. [Google Scholar]
- Paxson, D.E. Impact of an exhaust throat on semi-idealized rotating detonation engine performance. In Proceedings of the 54th AIAA Aerospace Sciences Meeting, AIAA 2016-1647, San Diego, CA, USA, 4–8 January 2016. [Google Scholar]
- Zheng, H.T.; Qi, L.; Zhao, N.B.; Li, Z.M.; Liu, X. A thermodynamic analysis of the pressure gain of continuously rotating detonation combustor for gas turbine. Appl. Sci. Basel 2018, 8, 535. [Google Scholar] [CrossRef]
- Keisuke, G.; Kato, Y.; Ishihara, K.; Matsuoka, K.; Kasahara, J.; Matsuo, A.; Funaki, I. Experimental study of effects of injector configurations on rotating detonation engine performance. In Proceedings of the 54th AIAA Aerospace Sciences Meeting, AIAA 2016-5100, San Diego, CA, USA, 4–8 January 2016. [Google Scholar]
- Braun, J.; Saracoglu, B.H.; Paniagua, G. Unsteady performance of rotating detonation engines with different exhaust nozzles. J. Propuls. Power 2016, 33, 1–10. [Google Scholar] [CrossRef]
- Fotia, M.L.; Schauer, F.; Kaemming, T.; Hoke, J. Experimental study of the performance of a rotating detonation engine with nozzle. J. Propuls. Power 2015, 31, 674–681. [Google Scholar] [CrossRef]
- Wolański, P. Application of the continuous rotating detonation to gas turbine. Appl. Mech. Mater. 2015, 782, 3–12. [Google Scholar] [CrossRef]
- Li, J.M.; Teo, C.J.; Khoo, B.C.; Wang, J.P.; Wang, C. Detonation Control for Propulsion: Pulse Detonation and Rotating Detonation Engines (Shock Wave and High Pressure Phenomena), 1st ed.; Springer International Publishing AG: Cham, Switzerland, 2018; pp. 30–35. ISBN 978-3-319-68905-0. [Google Scholar]
- Frolov, S.M.; Aksenov, V.S.; Ivanov, V.S.; Shamshin, I.O. Large-scale hydrogen–air continuous detonation combustor. Int. J. Hydrog. Energy 2015, 40, 1616–1623. [Google Scholar] [CrossRef]
- Frolov, S.M.; Aksenov, V.S.; Ivanov, V.S. Three-dimensional numerical simulation of the operation of a rotating-detonation chamber with separate supply of fuel and oxidizer. Russ. J. Phys. Chem. B 2013, 7, 35–43. [Google Scholar] [CrossRef]
- Frolov, S.M.; Aksenov, V.S.; Ivanov, V.S. Experimental proof of Zel'dovich cycle efficiency gain over cycle with constant pressure combustion for hydrogen–oxygen fuel mixture. Int. J. Hydrog. Energy 2015, 40, 6970–6975. [Google Scholar] [CrossRef]
- Frolov, S.M.; Dubrovskii, A.V.; Ivanov, V.S. Three-dimensional numerical simulation of a continuously rotating detonation in the annular combustion chamber with a wide gap and separate delivery of fuel and oxidizer. Prog. Propuls. Phys. 2016, 8, 375–388. [Google Scholar] [CrossRef]
- Naples, A.; Hoke, J.; Schauer, F.R. Rotating detonation engine interaction with an annular ejector. In Proceedings of the 52nd AIAA Aerospace Sciences Meeting, AIAA 2014-0287, National Harbor, MD, USA, 13–17 January 2014. [Google Scholar]
- Naples, A.; Hoke, J.; Battelle, R.T.; Wagner, M.; Schauer, F.R. RDE Implementation into an Open-Loop T63 Gas Turbine Engine. In Proceedings of the 55th AIAA Aerospace Sciences Meeting, AIAA 2017-1747, Grapevine, TX, USA, 9–13 January 2017. [Google Scholar]
- Sousa, J.; Paniagua, G.; Morata, E.C. Thermodynamic analysis of a gas turbine engine with a rotating detonation combustor. Appl. Energy 2017, 195, 247–256. [Google Scholar] [CrossRef]
- Qi, L.; Zhao, N.B.; Wang, Z.T.; Yang, J.L.; Zheng, H.T. Pressure gain characteristic of continuously rotating detonation combustion and its influence on gas turbine cycle performance. IEEE Access 2018, 6, 70236–70247. [Google Scholar] [CrossRef]
- Zhou, S.B.; Ma, H.; Li, S.; Liu, D.K.; Yan, Y.; Zhou, C.S. Effects of a turbine guide vane on hydrogen-air rotating detonation wave propagation characteristics. Int. J. Hydrog. Energy 2017, 42, 20297–20305. [Google Scholar] [CrossRef]
- Zhou, S.B.; Ma, H.; Ma, Y.; Zhou, C.S.; Liu, D.K.; Li, S. Experimental study on a rotating detonation combustor with an axial-flow turbine. Acta Astronaut. 2018, 151, 7–14. [Google Scholar] [CrossRef]
- Liu, Q. Research on Fuel Reforming and Rotating Detonation Pressurized Combustion Technique of Combustor. Ph.D. Thesis, Harbin Engineering University, Harbin, China, 2013. [Google Scholar]
- Gavrikov, A.I.; Efimenko, A.A.; Dorofeev, S.B. A model for detonation cell size prediction from chemical kinetics. Combust. Flame 2000, 120, 19–33. [Google Scholar] [CrossRef]
- Bykovskii, F.A.; Zhdan, S.A.; Vedernikov, E.F. Continuous spin detonations. J. Propuls. Power 2006, 22, 1204–1216. [Google Scholar] [CrossRef]
- Zhe, L.; James, B.; Guillermo, P. Characterization of a supersonic turbine downstream of a rotating detonation combustor. J. Eng. Gas Turbines Power 2018, 141, 1–13. [Google Scholar] [CrossRef]
- Wu, D.; Liu, Y.; Liu, Y.S.; Wang, J.P. Numerical investigations of the restabilization of hydrogen-air rotating detonation engines. Int. J. Hydrog. Energy 2014, 39, 15803–15809. [Google Scholar] [CrossRef]
- Tsuboi, N.; Watanabe, Y.; Kojima, T.; Hayashi, A.K. Numerical estimation of the thrust performance on a rotating detonation engine for a hydrogen–oxygen mixture. Proc. Combust. Inst. 2015, 35, 2005–2013. [Google Scholar] [CrossRef]
- Kaemming, T.; Fotia, M.L.; Hoke, J.; Schauer, F. Thermodynamic modeling of a rotating detonation engine through a reduced-order approach. J. Propuls. Power 2017, 33, 1–9. [Google Scholar] [CrossRef]
- Yao, S.B.; Tang, X.M.; Wang, J.P.; Shao, Y.T.; Zhou, R. Three-dimensional numerical study of flow particle paths in rotating detonation engine with a hollow combustor. Combust. Sci. Technol. 2017, 189, 965–979. [Google Scholar] [CrossRef]
- Oran, E.S.; Weber, J.W., Jr.; Stefaniw, E.I. A numerical study of a two-dimensional H2-O2-Ar detonation using a detailed chemical reaction model. Combust. Flame 1998, 113, 147–163. [Google Scholar] [CrossRef]
- Nordeen, C.; Schwer, D.; Schauer, F.; Hoke, J.; Cetegen, B.; Barber, T. Thermodynamic modeling of a rotating detonation engine. In Proceedings of the 49th AIAA Aerospace Sciences Meeting including the New Horizons Forum and Aerospace Exposition, AIAA 2011-803, Orlando, FL, USA, 4–7 January 2011. [Google Scholar]
- Uemura, Y.; Hayashi, A.K.; Asahara, M.; Tsuboi, N.; Yamada, E. Transverse wave generation mechanism in rotating detonation. Proc. Combust. Inst. 2013, 34, 1981–1989. [Google Scholar] [CrossRef]
- Graf, A.P.; Riedel, U. Numerical simulation of supersonic reactive flows using explicit Runge–Kutta methods. In Proceedings of the 38th AIAA Aerospace Sciences Meeting, AIAA 2000-438, Reno, NV, USA, 10–13 January 2000. [Google Scholar]
- Bykovskii, F.A.; Vedernikov, E.F. Continuous detonation of a subsonic flow of a propellant. Combust. Explos. Shock Waves 2003, 39, 323–334. [Google Scholar] [CrossRef]
- Schwer, D.; Kailasanath, K. Numerical study of the effects of engine size on rotating detonation engines. In Proceedings of the 49th AIAA Aerospace Sciences Meeting including the New Horizons Forum and Aerospace Exposition, AIAA 2011-581, Orlando, FL, USA, 4–7 January 2011. [Google Scholar]
- Schwer, D.; Kailasanath, K. Numerical investigation of the physics of rotating-detonation-engines. Proc. Combust. Inst. 2011, 33, 2195–2202. [Google Scholar] [CrossRef]
- Yao, Q.; Li, S.Q.; Wang, Y. An Introduction to Combustion: Concepts and Applications, 2nd ed.; Tsinghua University Press: Beijing, China, 2009; pp. 490–516. ISBN 978-7-302-18762-2. [Google Scholar]
- Wang, Z.T.; Li, J.; Fan, K.; Ma, W.Q.; Lei, H.D. Prediction method for low speed characteristics of compressor based on modified similarity theory with genetic algorithm. IEEE Access 2018, 6, 36834–36839. [Google Scholar] [CrossRef]
- Wang, Z.T.; Li, J.; Fan, K.; Li, S.Y. The off-design performance simulation of marine gas turbine based on optimum scheduling of variable stator vanes. Math. Probl. Eng. 2017, 2017, 2671251. [Google Scholar] [CrossRef]
- Sousa, J.; Braun, J.; Paniagua, G. Development of a fast evaluation tool for rotating detonation combustor. Appl. Math. Model. 2017, 52, 42–52. [Google Scholar] [CrossRef]


| Load | 100% | 90% | 80% | 70% | 60% | 50% |
| [kW] | 7416.25 | 6674.63 | 5933.00 | 5191.38 | 4449.75 | 3708.13 |
| 13.66 | 12.90 | 12.17 | 11.44 | 10.71 | 10.02 | |
| [Mpa] | 1.3573 | 1.2818 | 1.2091 | 1.1365 | 1.0641 | 0.9962 |
| [K] | 688.32 | 677.44 | 665.22 | 652.89 | 639.65 | 627.18 |
| [Mpa] | 0.7060 | 0.6763 | 0.6474 | 0.6180 | 0.5882 | 0.5598 |
| [K] | 562.64 | 555.61 | 547.71 | 539.71 | 531.39 | 522.96 |
| [kg/s] | 26.8185 | 25.6773 | 24.6146 | 23.6218 | 22.6886 | 21.8212 |
| 13.66 | 12.90 | 12.17 | 11.44 | 10.71 | 10.03 | |
| [kg/s] | 0.4863 | 0.4456 | 0.4055 | 0.3664 | 0.3284 | 0.2914 |
| [kg/s] | 8.3483 | 7.6492 | 6.9598 | 6.2897 | 5.6371 | 5.0013 |
| [kg/s] | 18.4702 | 18.0281 | 17.6549 | 17.3321 | 17.0515 | 16.8199 |
| 2.2124 | 2.2368 | 2.5367 | 2.7556 | 3.0249 | 3.3631 |
© 2019 by the authors. Licensee MDPI, Basel, Switzerland. This article is an open access article distributed under the terms and conditions of the Creative Commons Attribution (CC BY) license (http://creativecommons.org/licenses/by/4.0/).
Share and Cite
Qi, L.; Wang, Z.; Zhao, N.; Dai, Y.; Zheng, H.; Meng, Q. Investigation of the Pressure Gain Characteristics and Cycle Performance in Gas Turbines Based on Interstage Bleeding Rotating Detonation Combustion. Entropy 2019, 21, 265. https://doi.org/10.3390/e21030265
Qi L, Wang Z, Zhao N, Dai Y, Zheng H, Meng Q. Investigation of the Pressure Gain Characteristics and Cycle Performance in Gas Turbines Based on Interstage Bleeding Rotating Detonation Combustion. Entropy. 2019; 21(3):265. https://doi.org/10.3390/e21030265
Chicago/Turabian StyleQi, Lei, Zhitao Wang, Ningbo Zhao, Yongqiang Dai, Hongtao Zheng, and Qingyang Meng. 2019. "Investigation of the Pressure Gain Characteristics and Cycle Performance in Gas Turbines Based on Interstage Bleeding Rotating Detonation Combustion" Entropy 21, no. 3: 265. https://doi.org/10.3390/e21030265