Binding of Bezafibrate to Human Serum Albumin: Insight into the Non-Covalent Interaction of an Emerging Contaminant with Biomacromolecules

Abstract
:1. Introduction
2. Results and Discussion
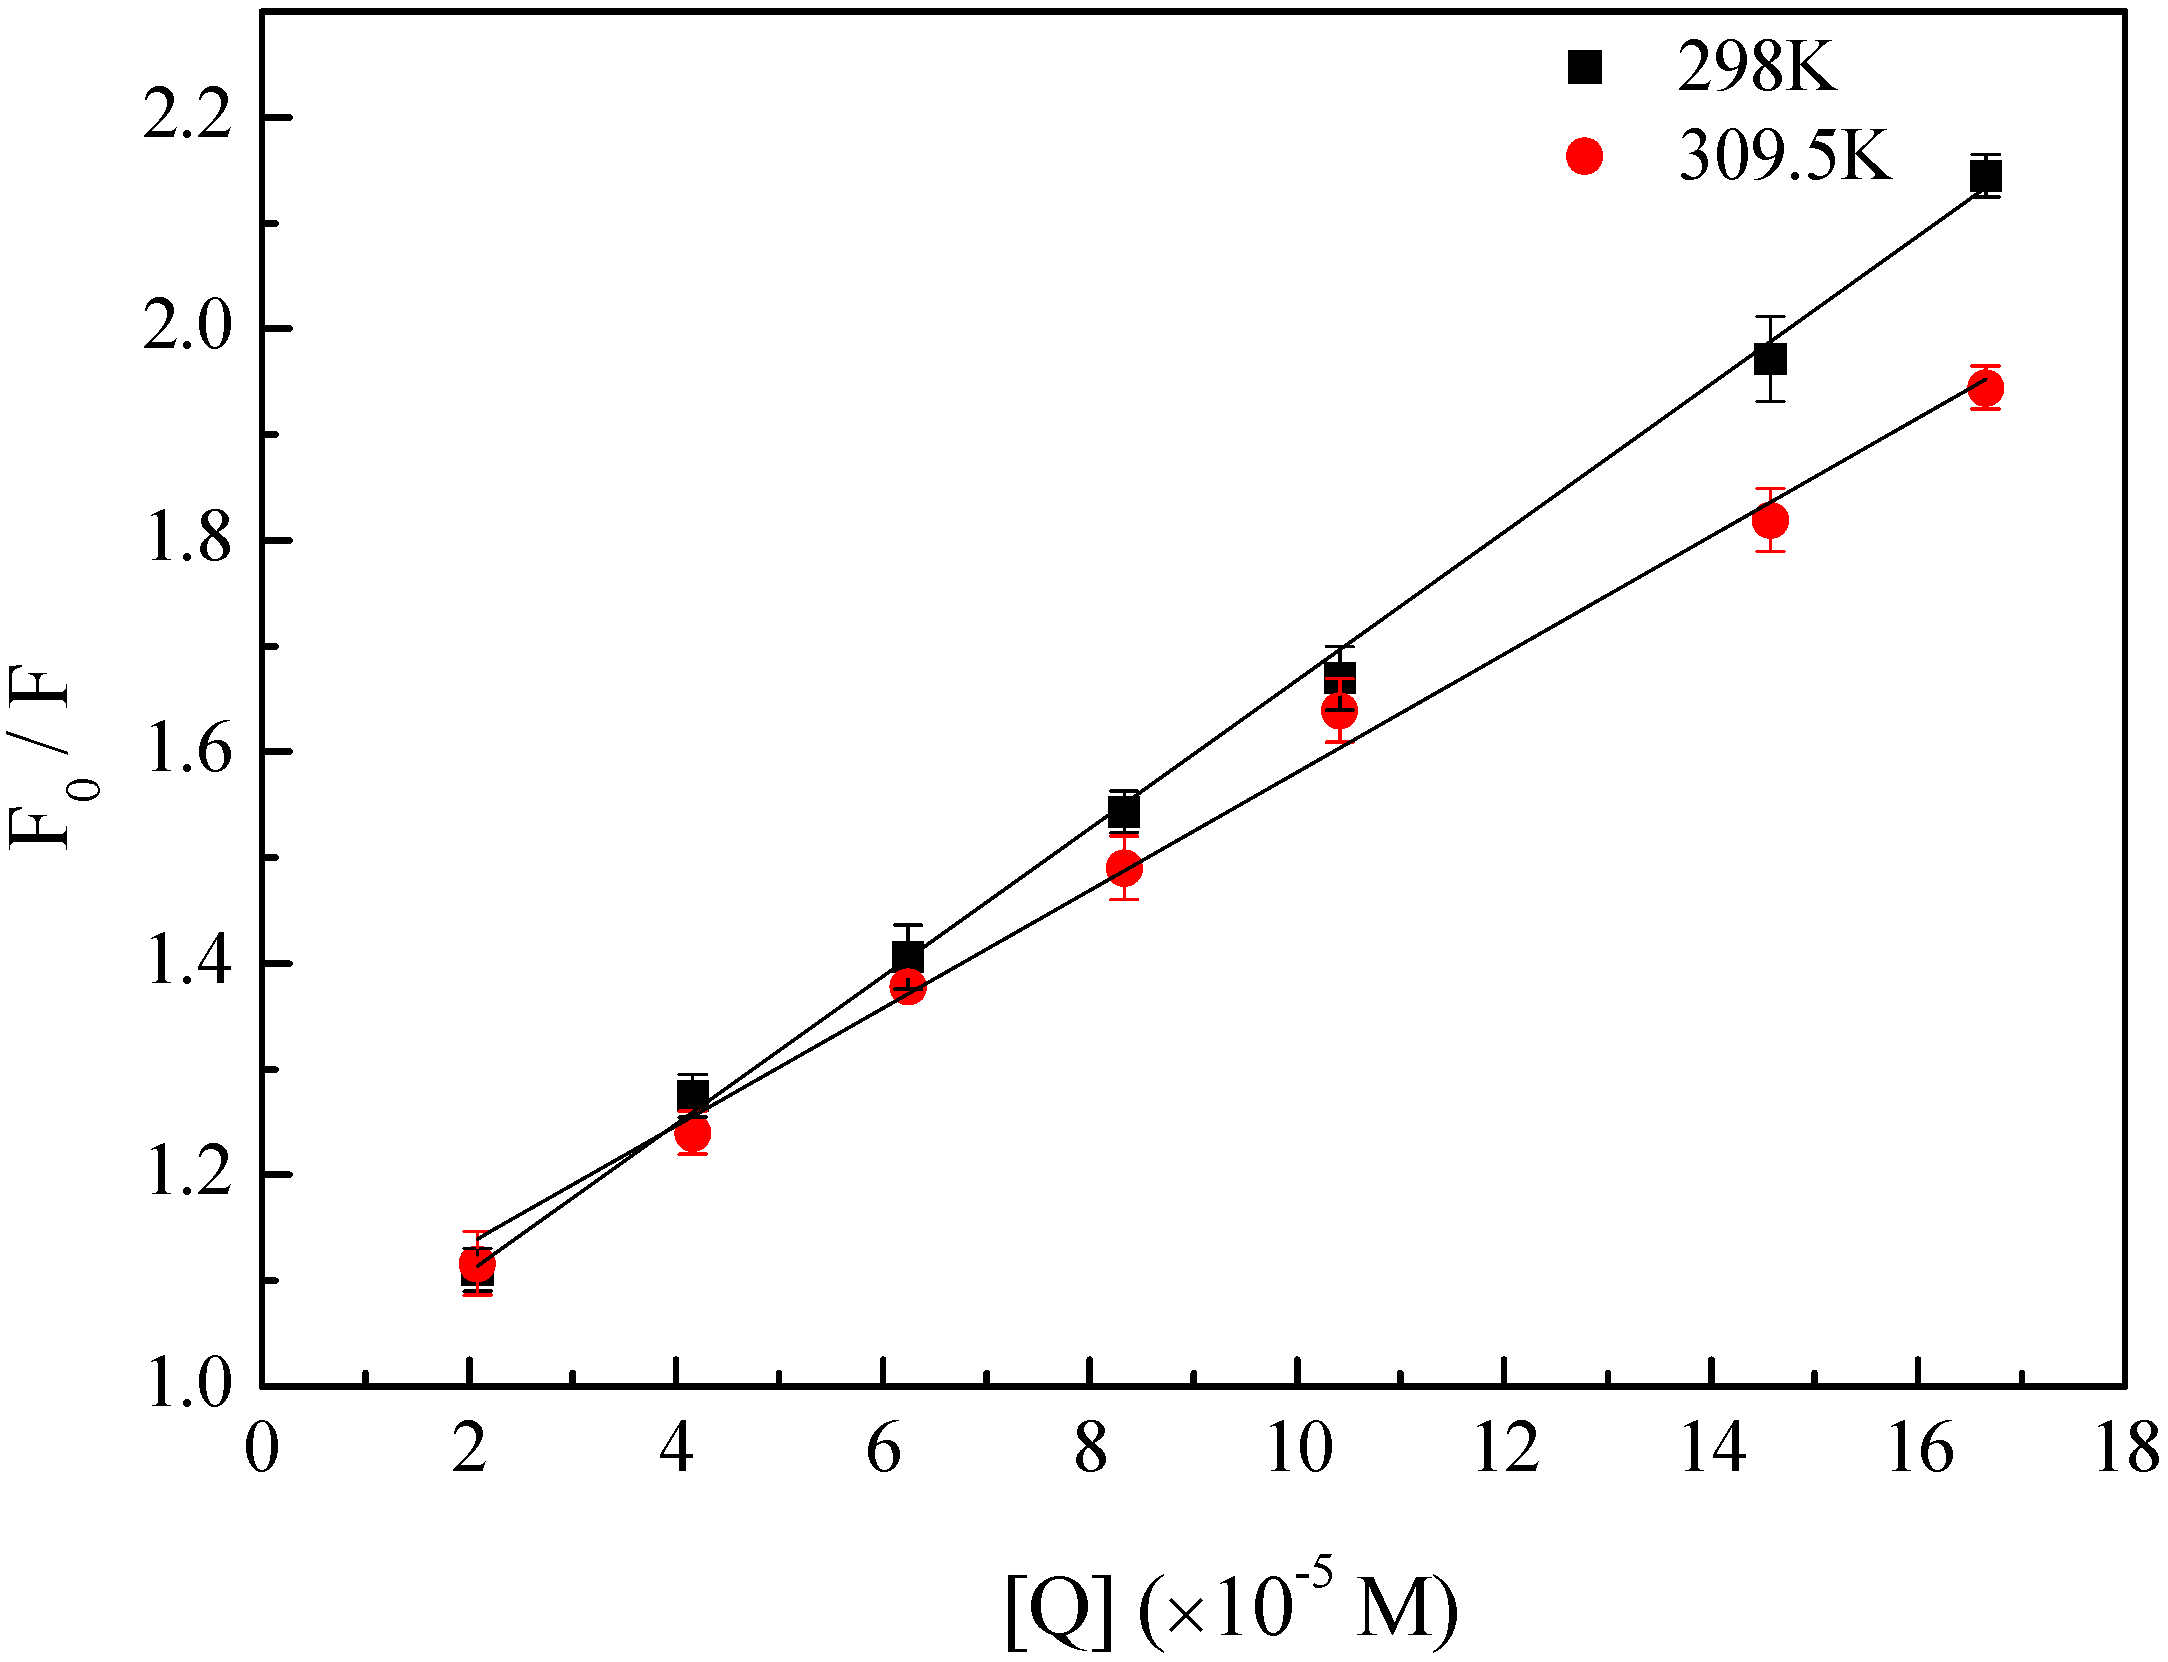
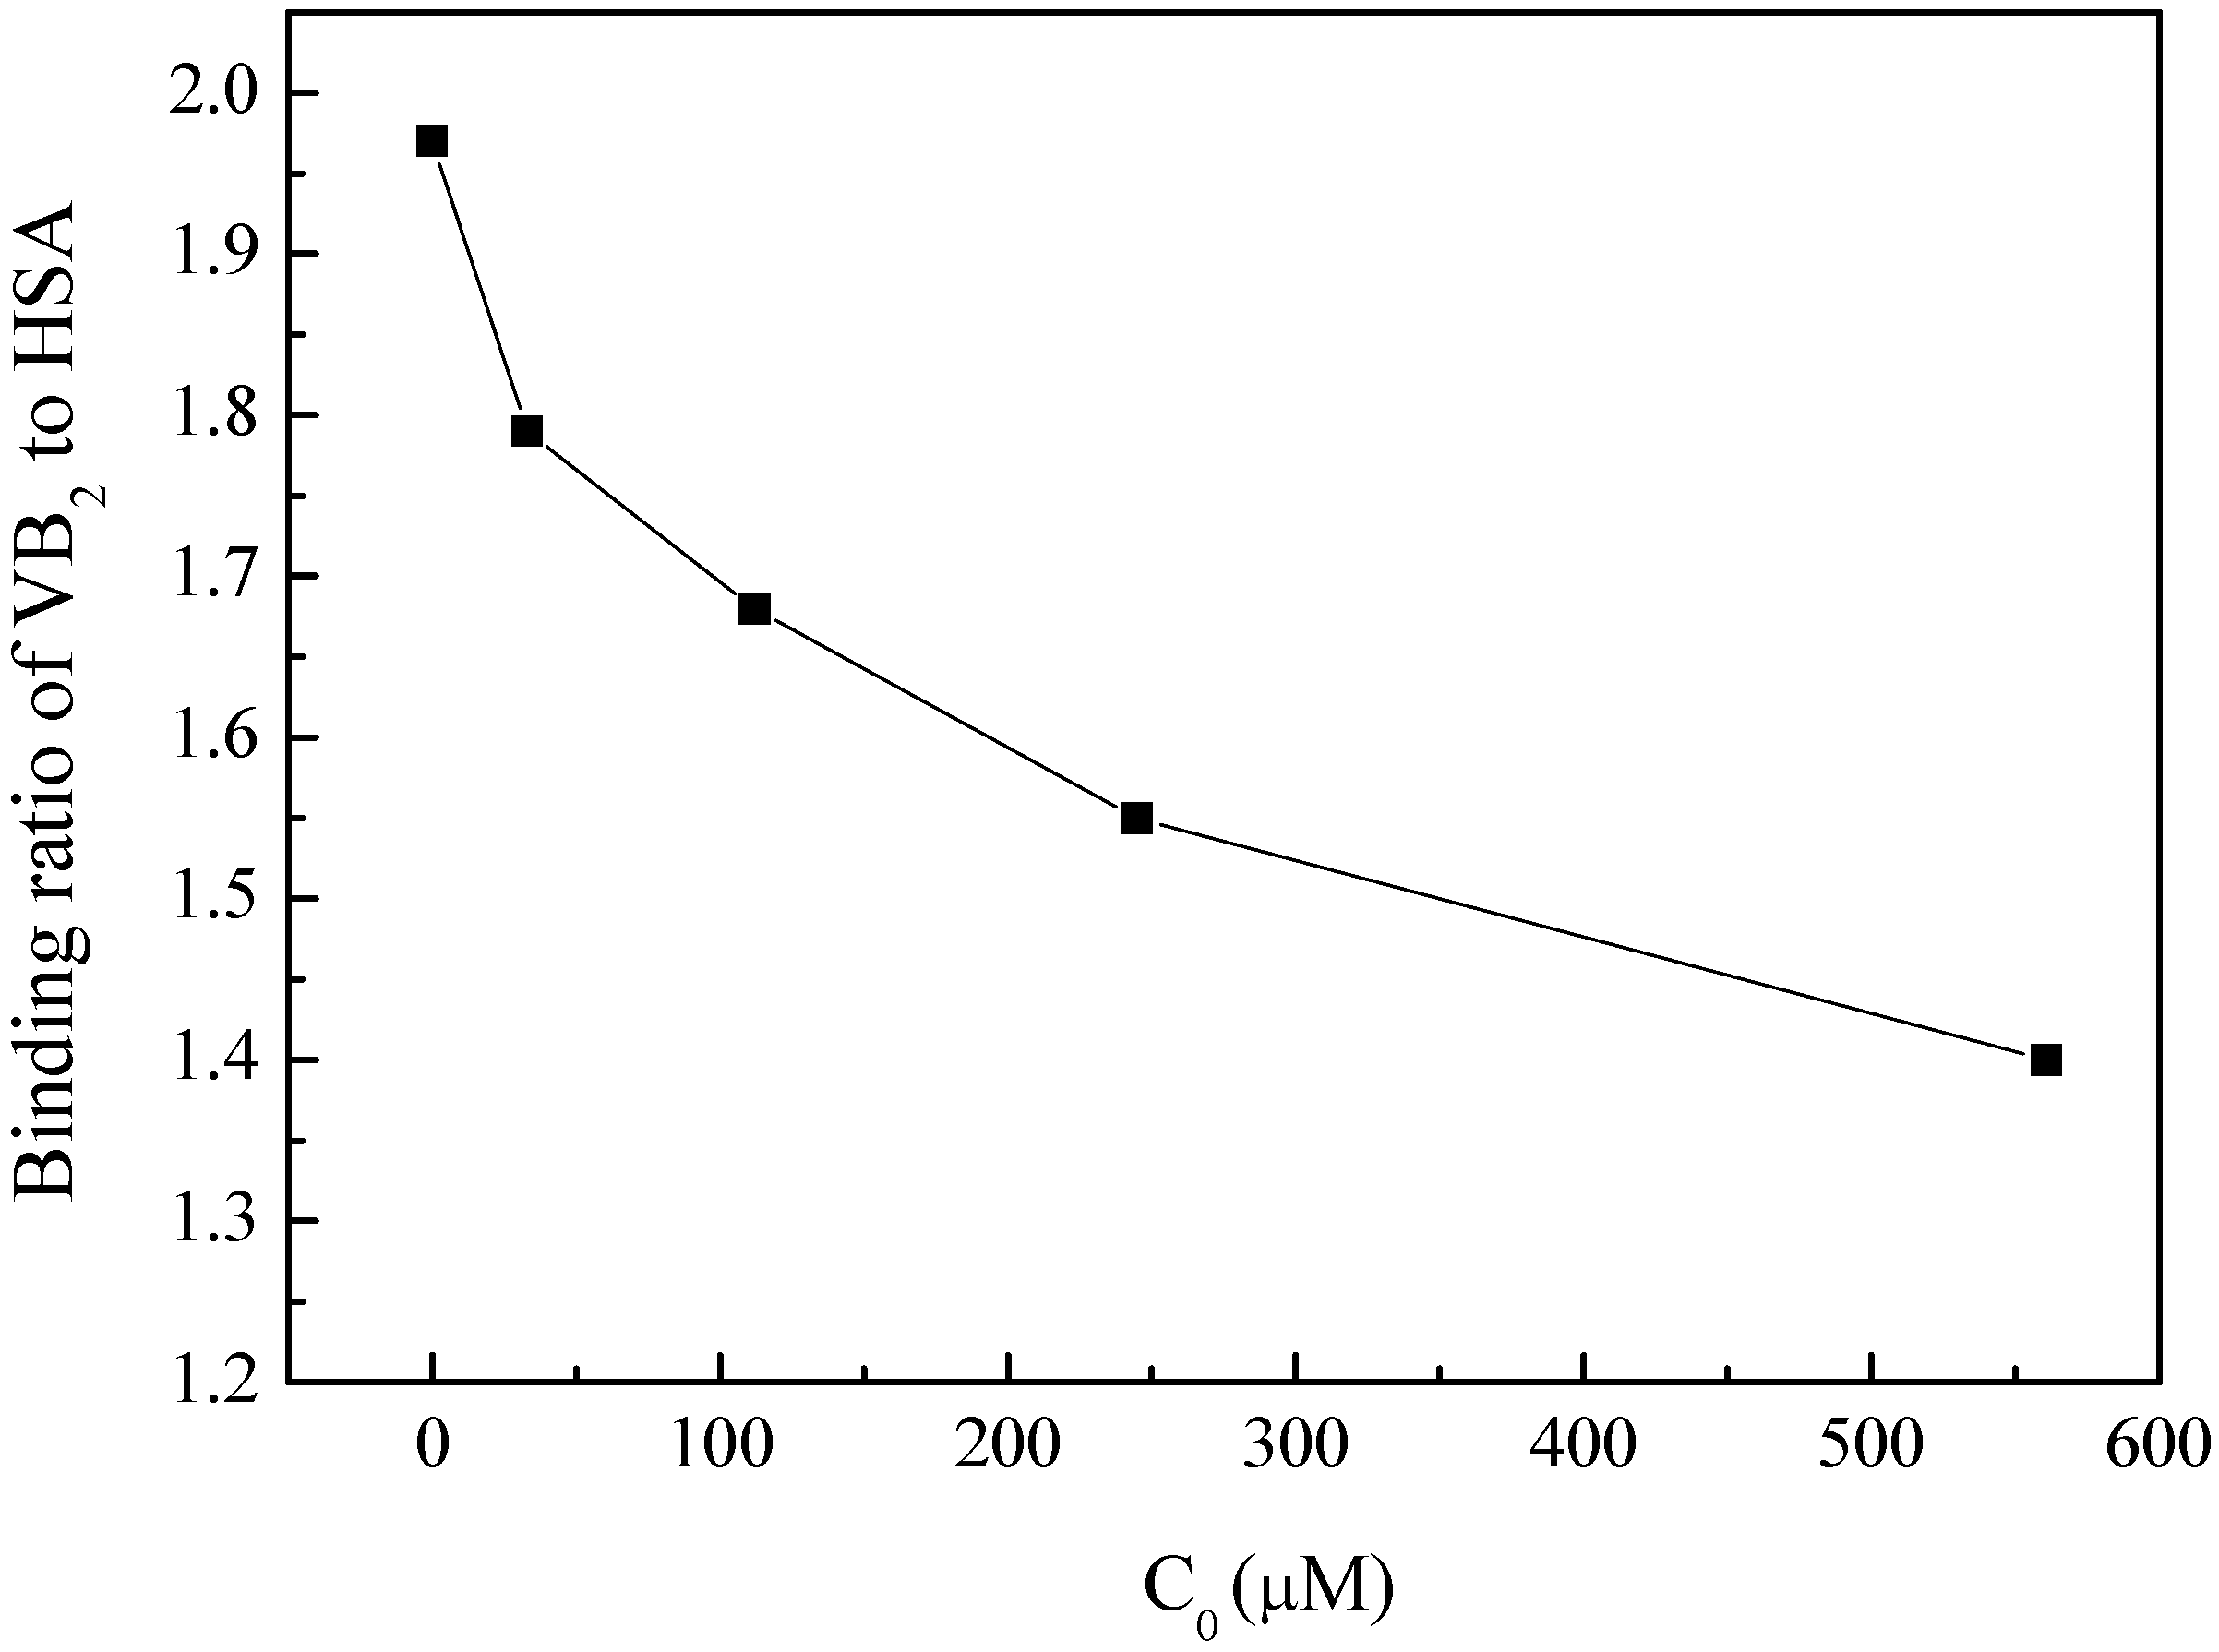
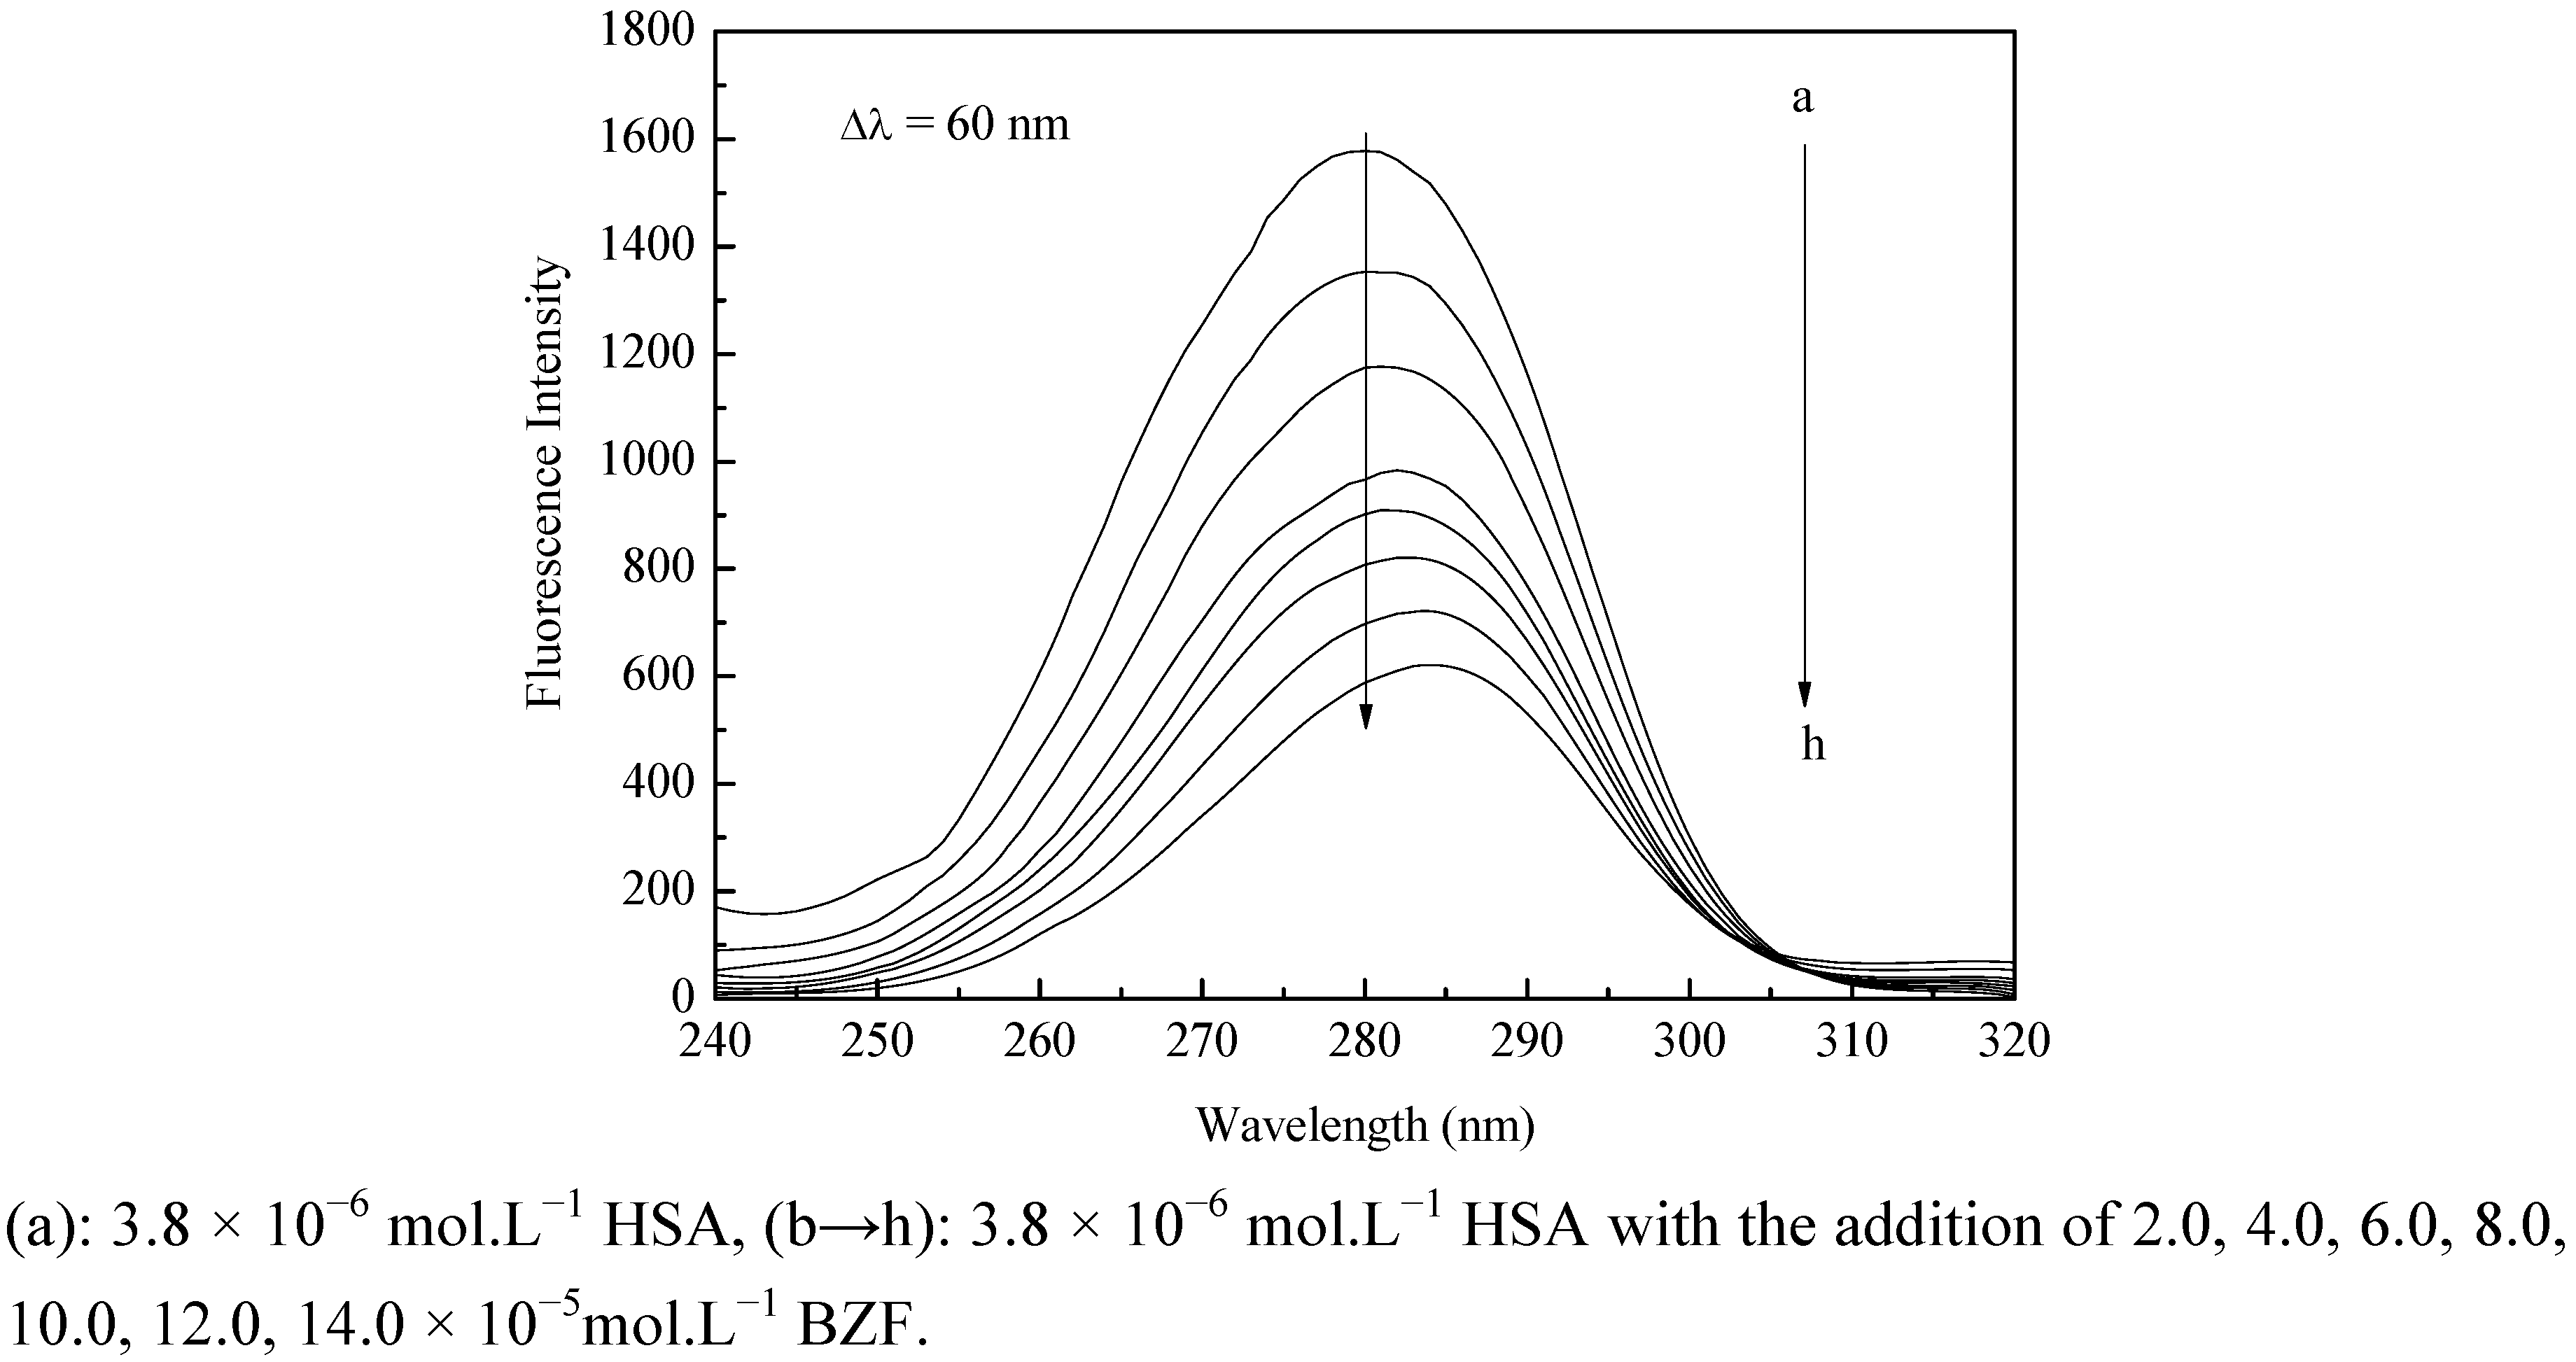
2.1. Fluorescence Quenching of HSA by BZF


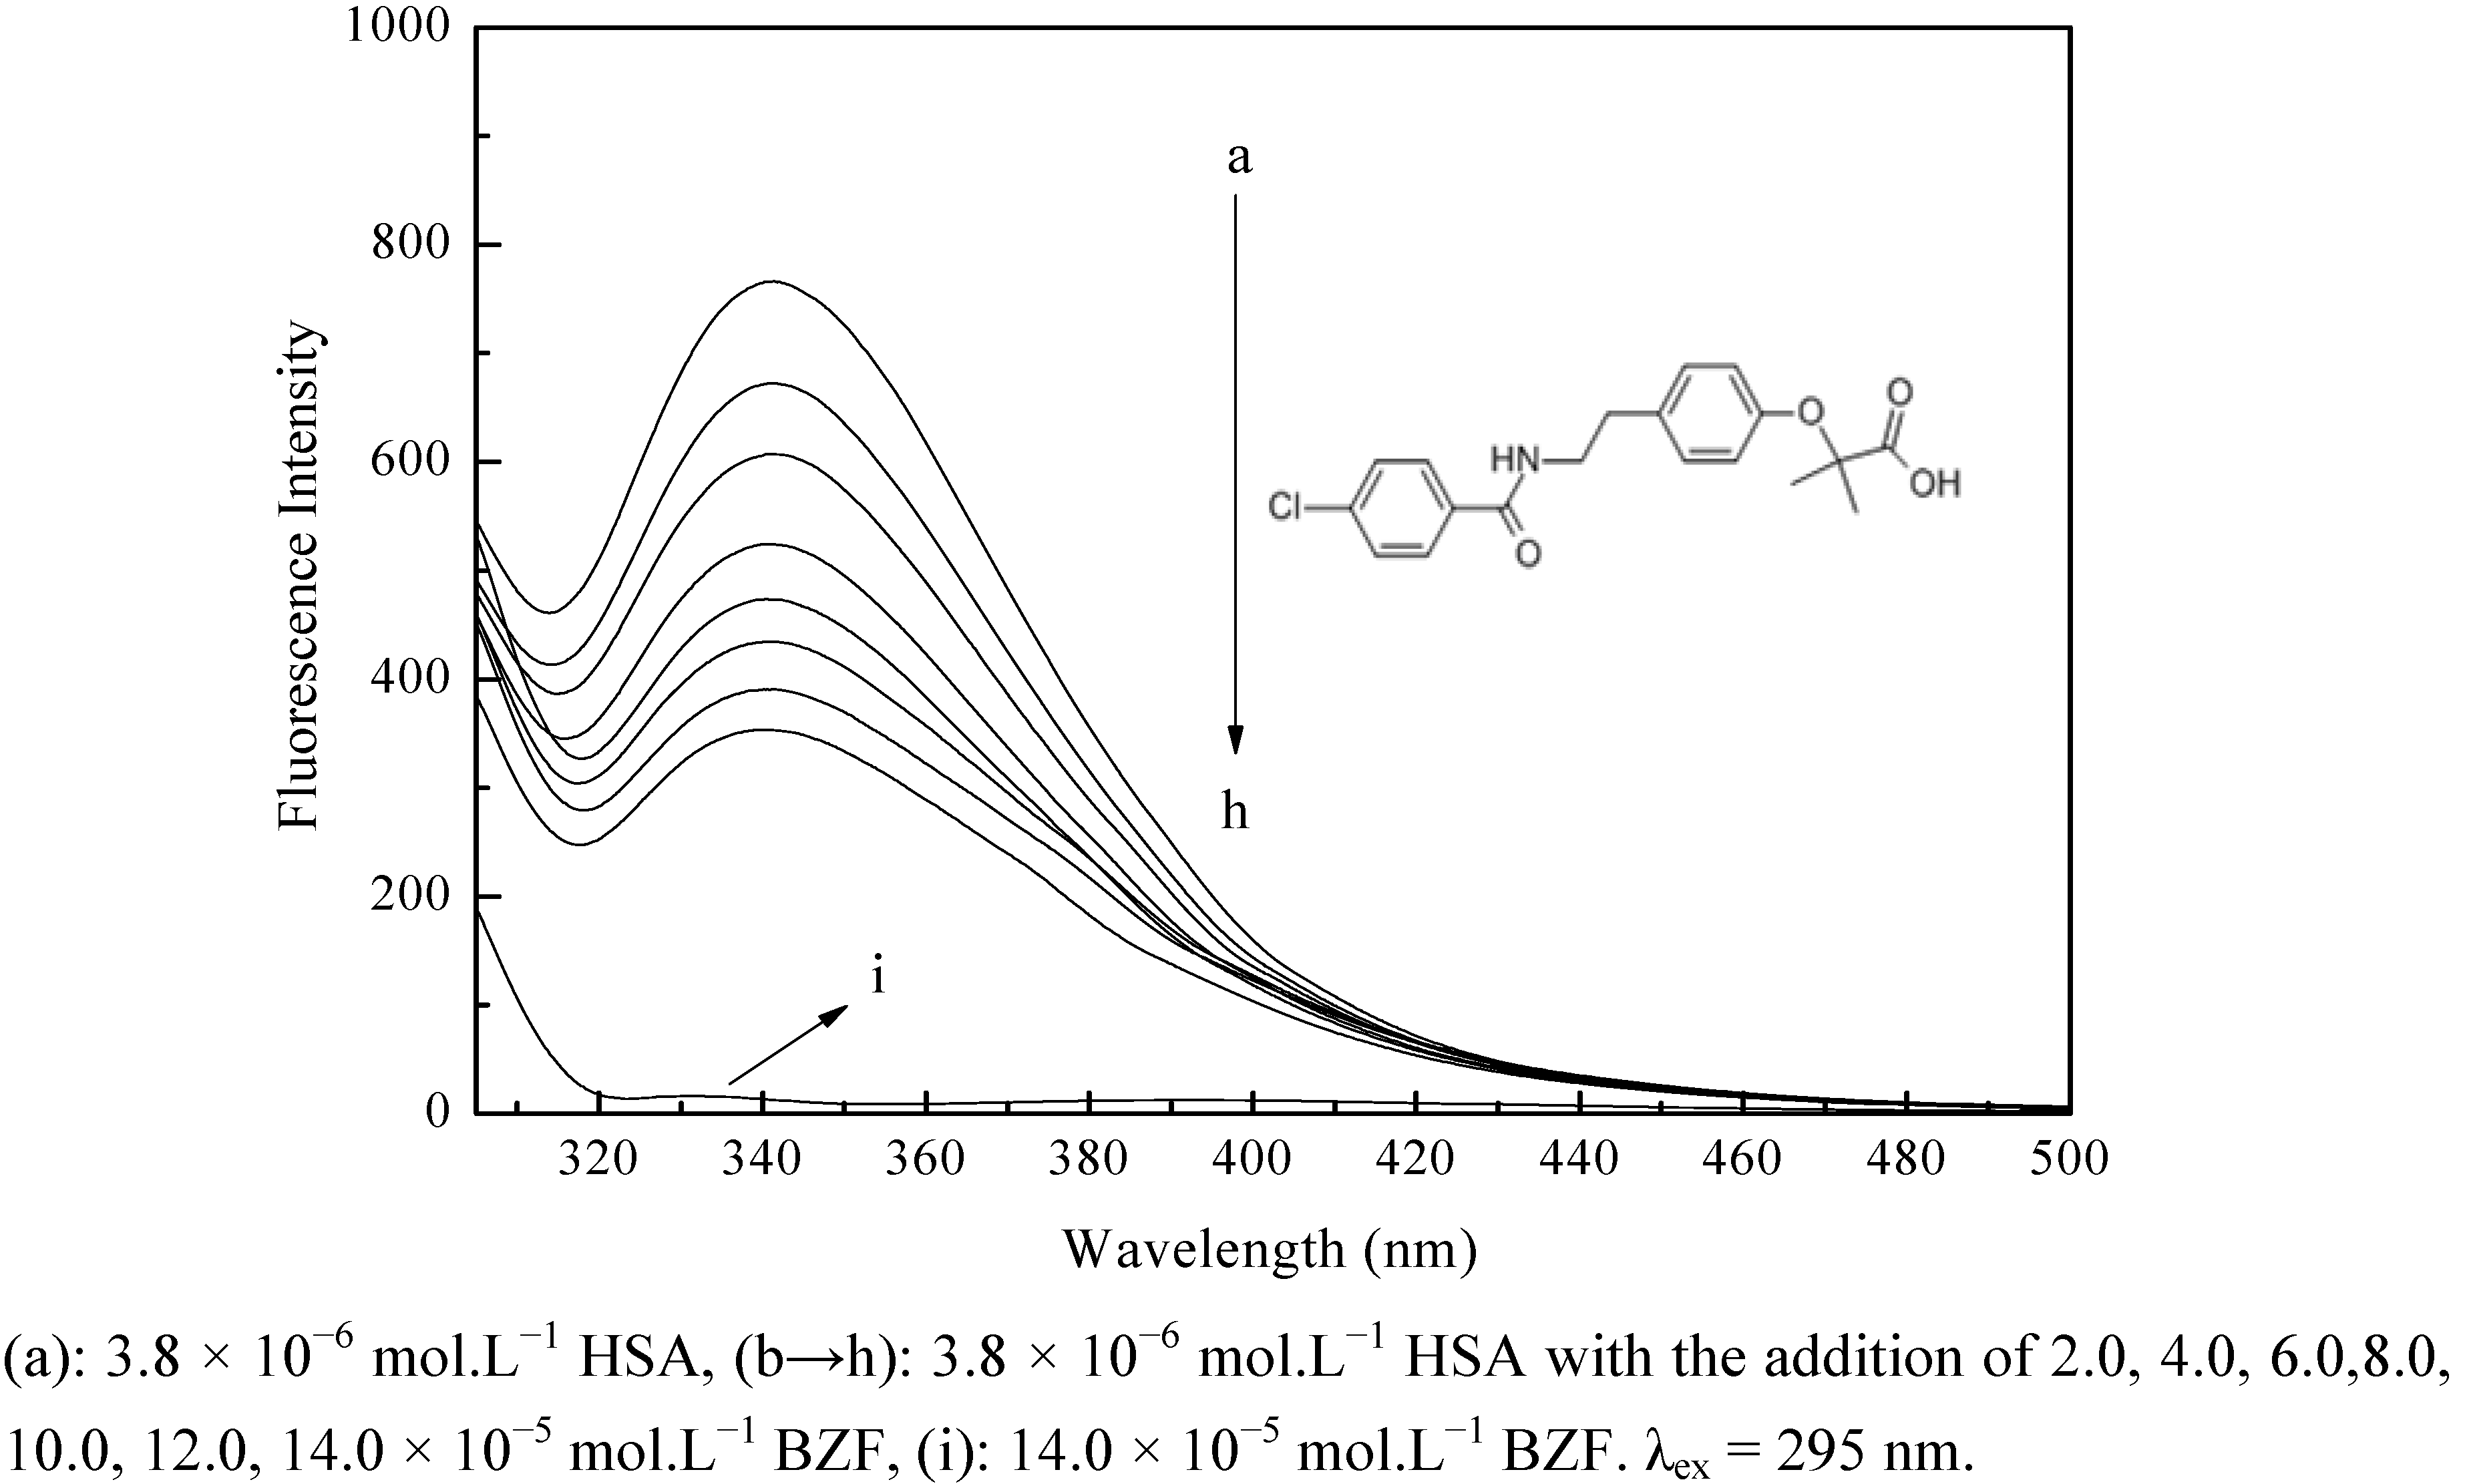
| T (K) | Ksv (×103 M−1) | kq (×1011 M−1 S−1) | R2 |
|---|---|---|---|
| 298 | 6.99 | 6.99 | 0.9985 |
| 309.5 | 5.58 | 5.58 | 0.9962 |
| T (K) | Ka (×103 M−1) | n | R2 | ΔH (kJ.mol−1) | ΔG (kJ.mol−1) | ΔS (J.mol−1.K) |
|---|---|---|---|---|---|---|
| 298 | 3.33 | 0.9 | 0.9922 | −10.54 | −20.11 | 32.07 |
| 309.5 | 2.84 | 0.91 | 0.9959 | −20.47 |
2.2. Determination of the Binding Force


2.3. Conformational Change of HSA
2.3.1. Synchronous Fluorescence
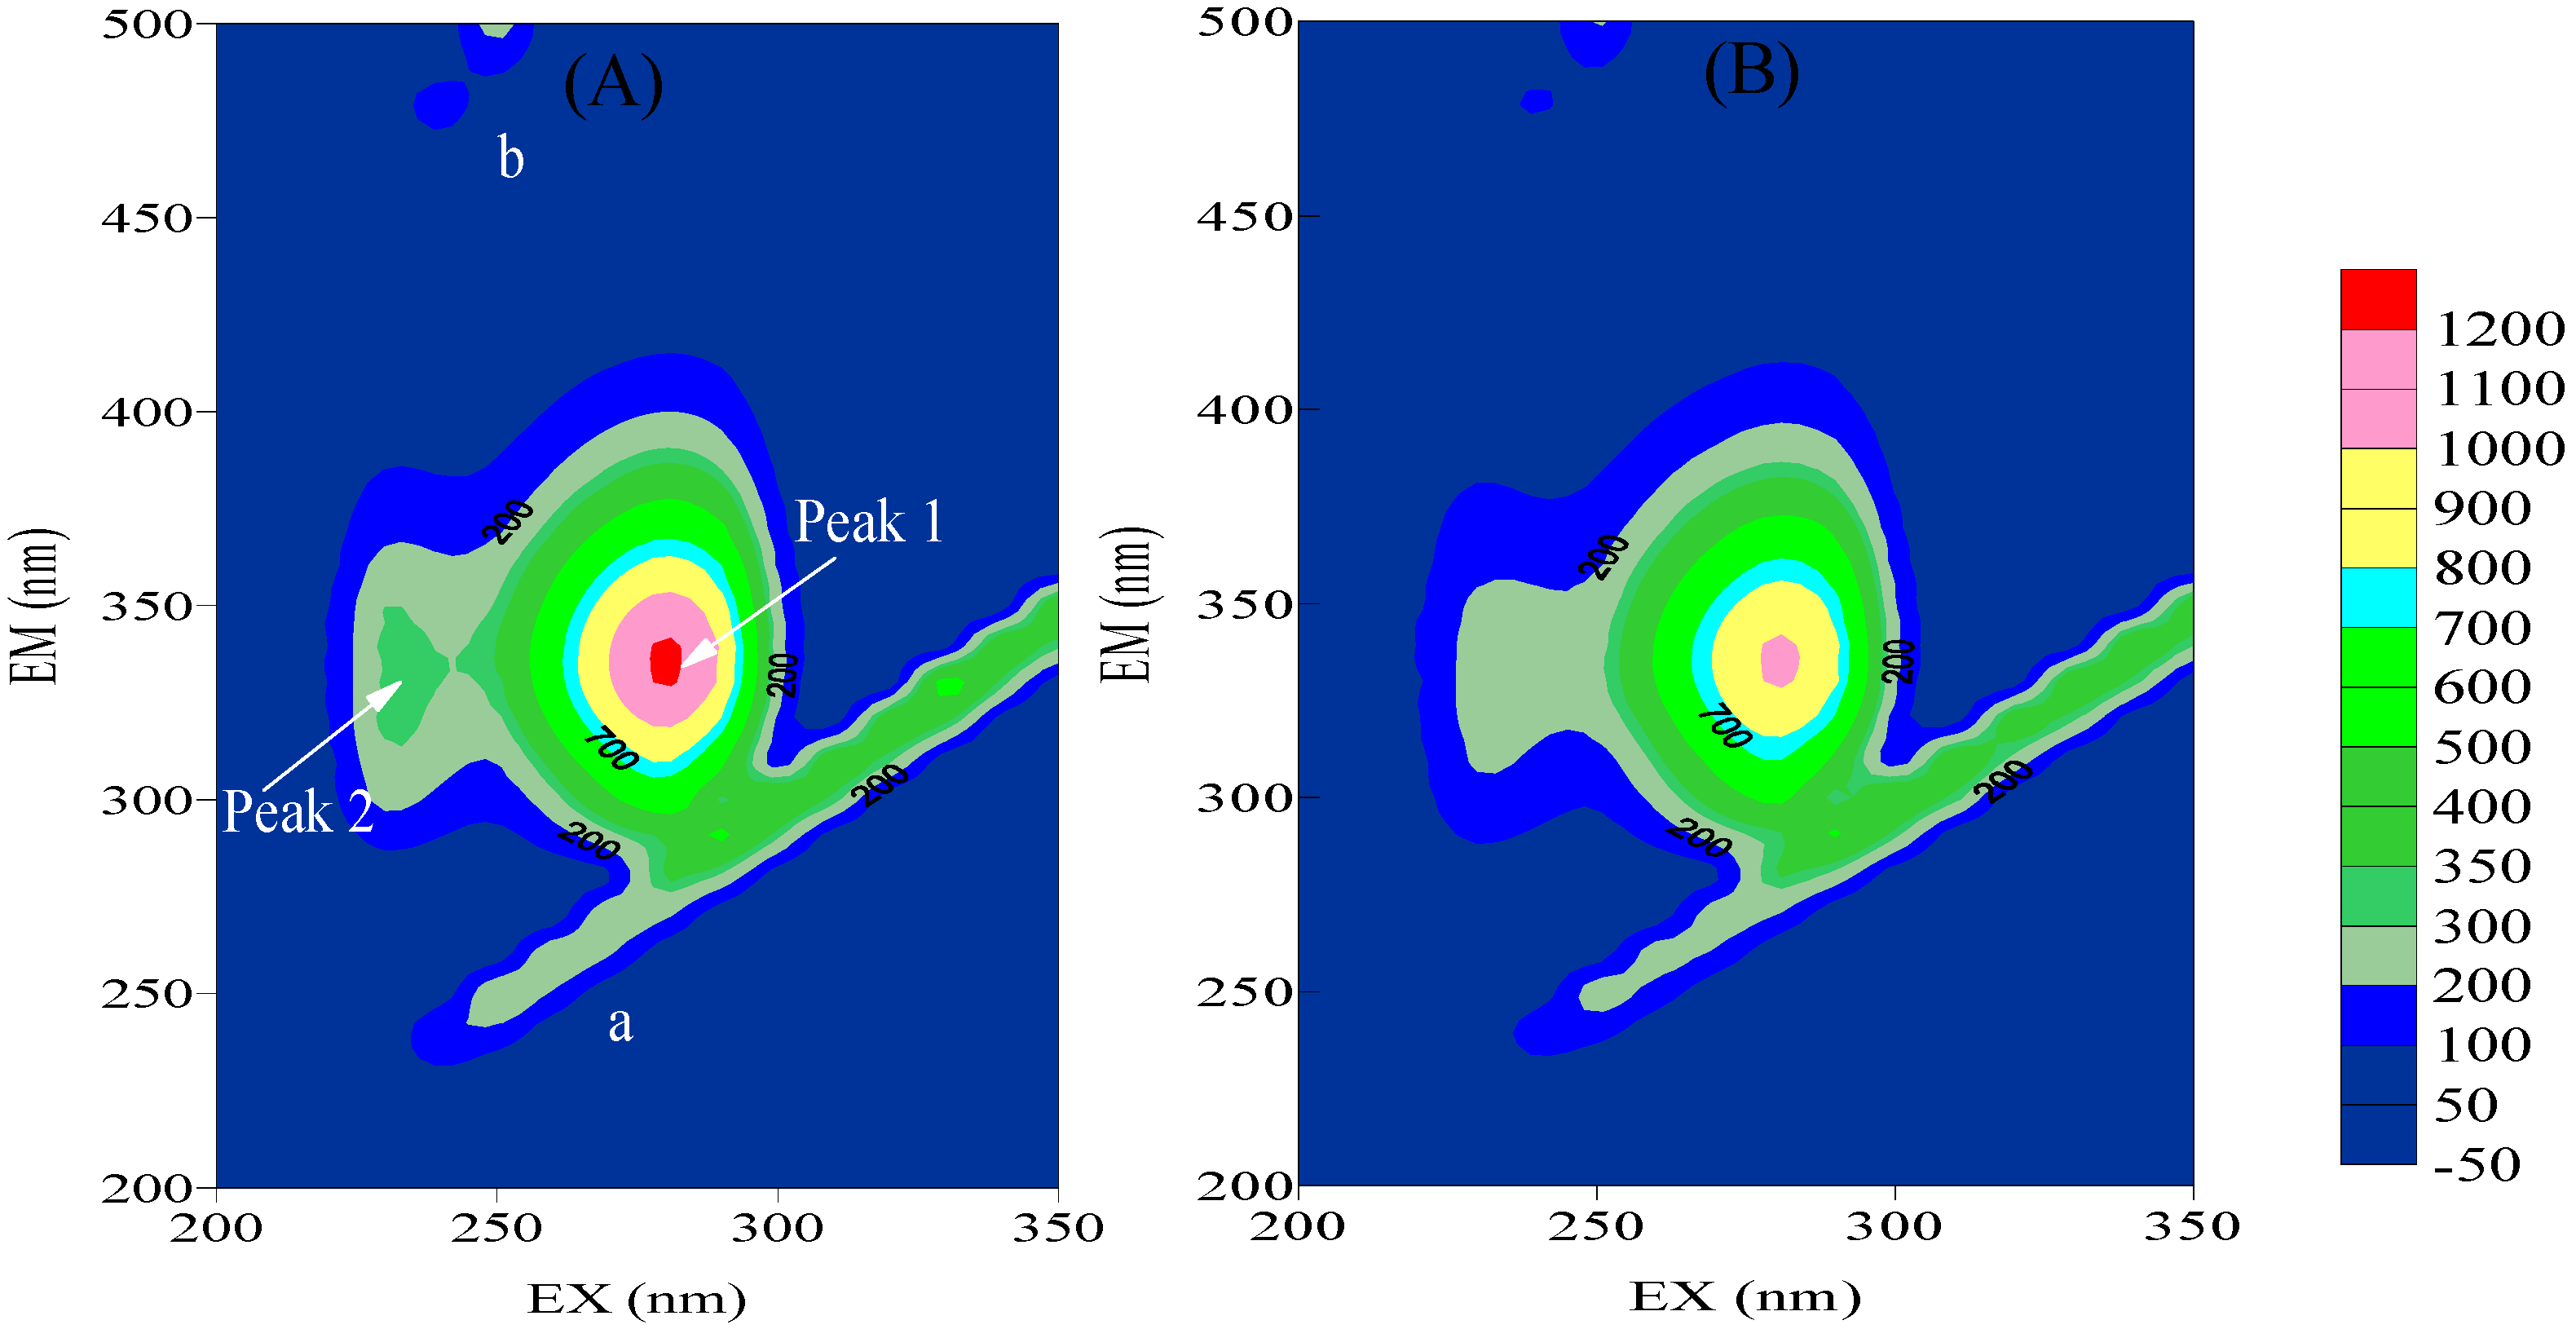
2.3.2. Three-Dimensional Fluorescence

| HSA | HSA+BZF | ||||||
|---|---|---|---|---|---|---|---|
| Peak position λex/λem | Stokes | Intensity F | Peak position λex/λem | Stokes | Intensity F | ||
| (nm/nm) | (Δλ) | (nm/nm) | (Δλ) | ||||
| Peak 1 | 280/330 | 50 | 1110 | 280/334 | 54 | 1028 | |
| Peak 2 | 230/320 | 110 | 344 | 230/330 | 100 | 264 |
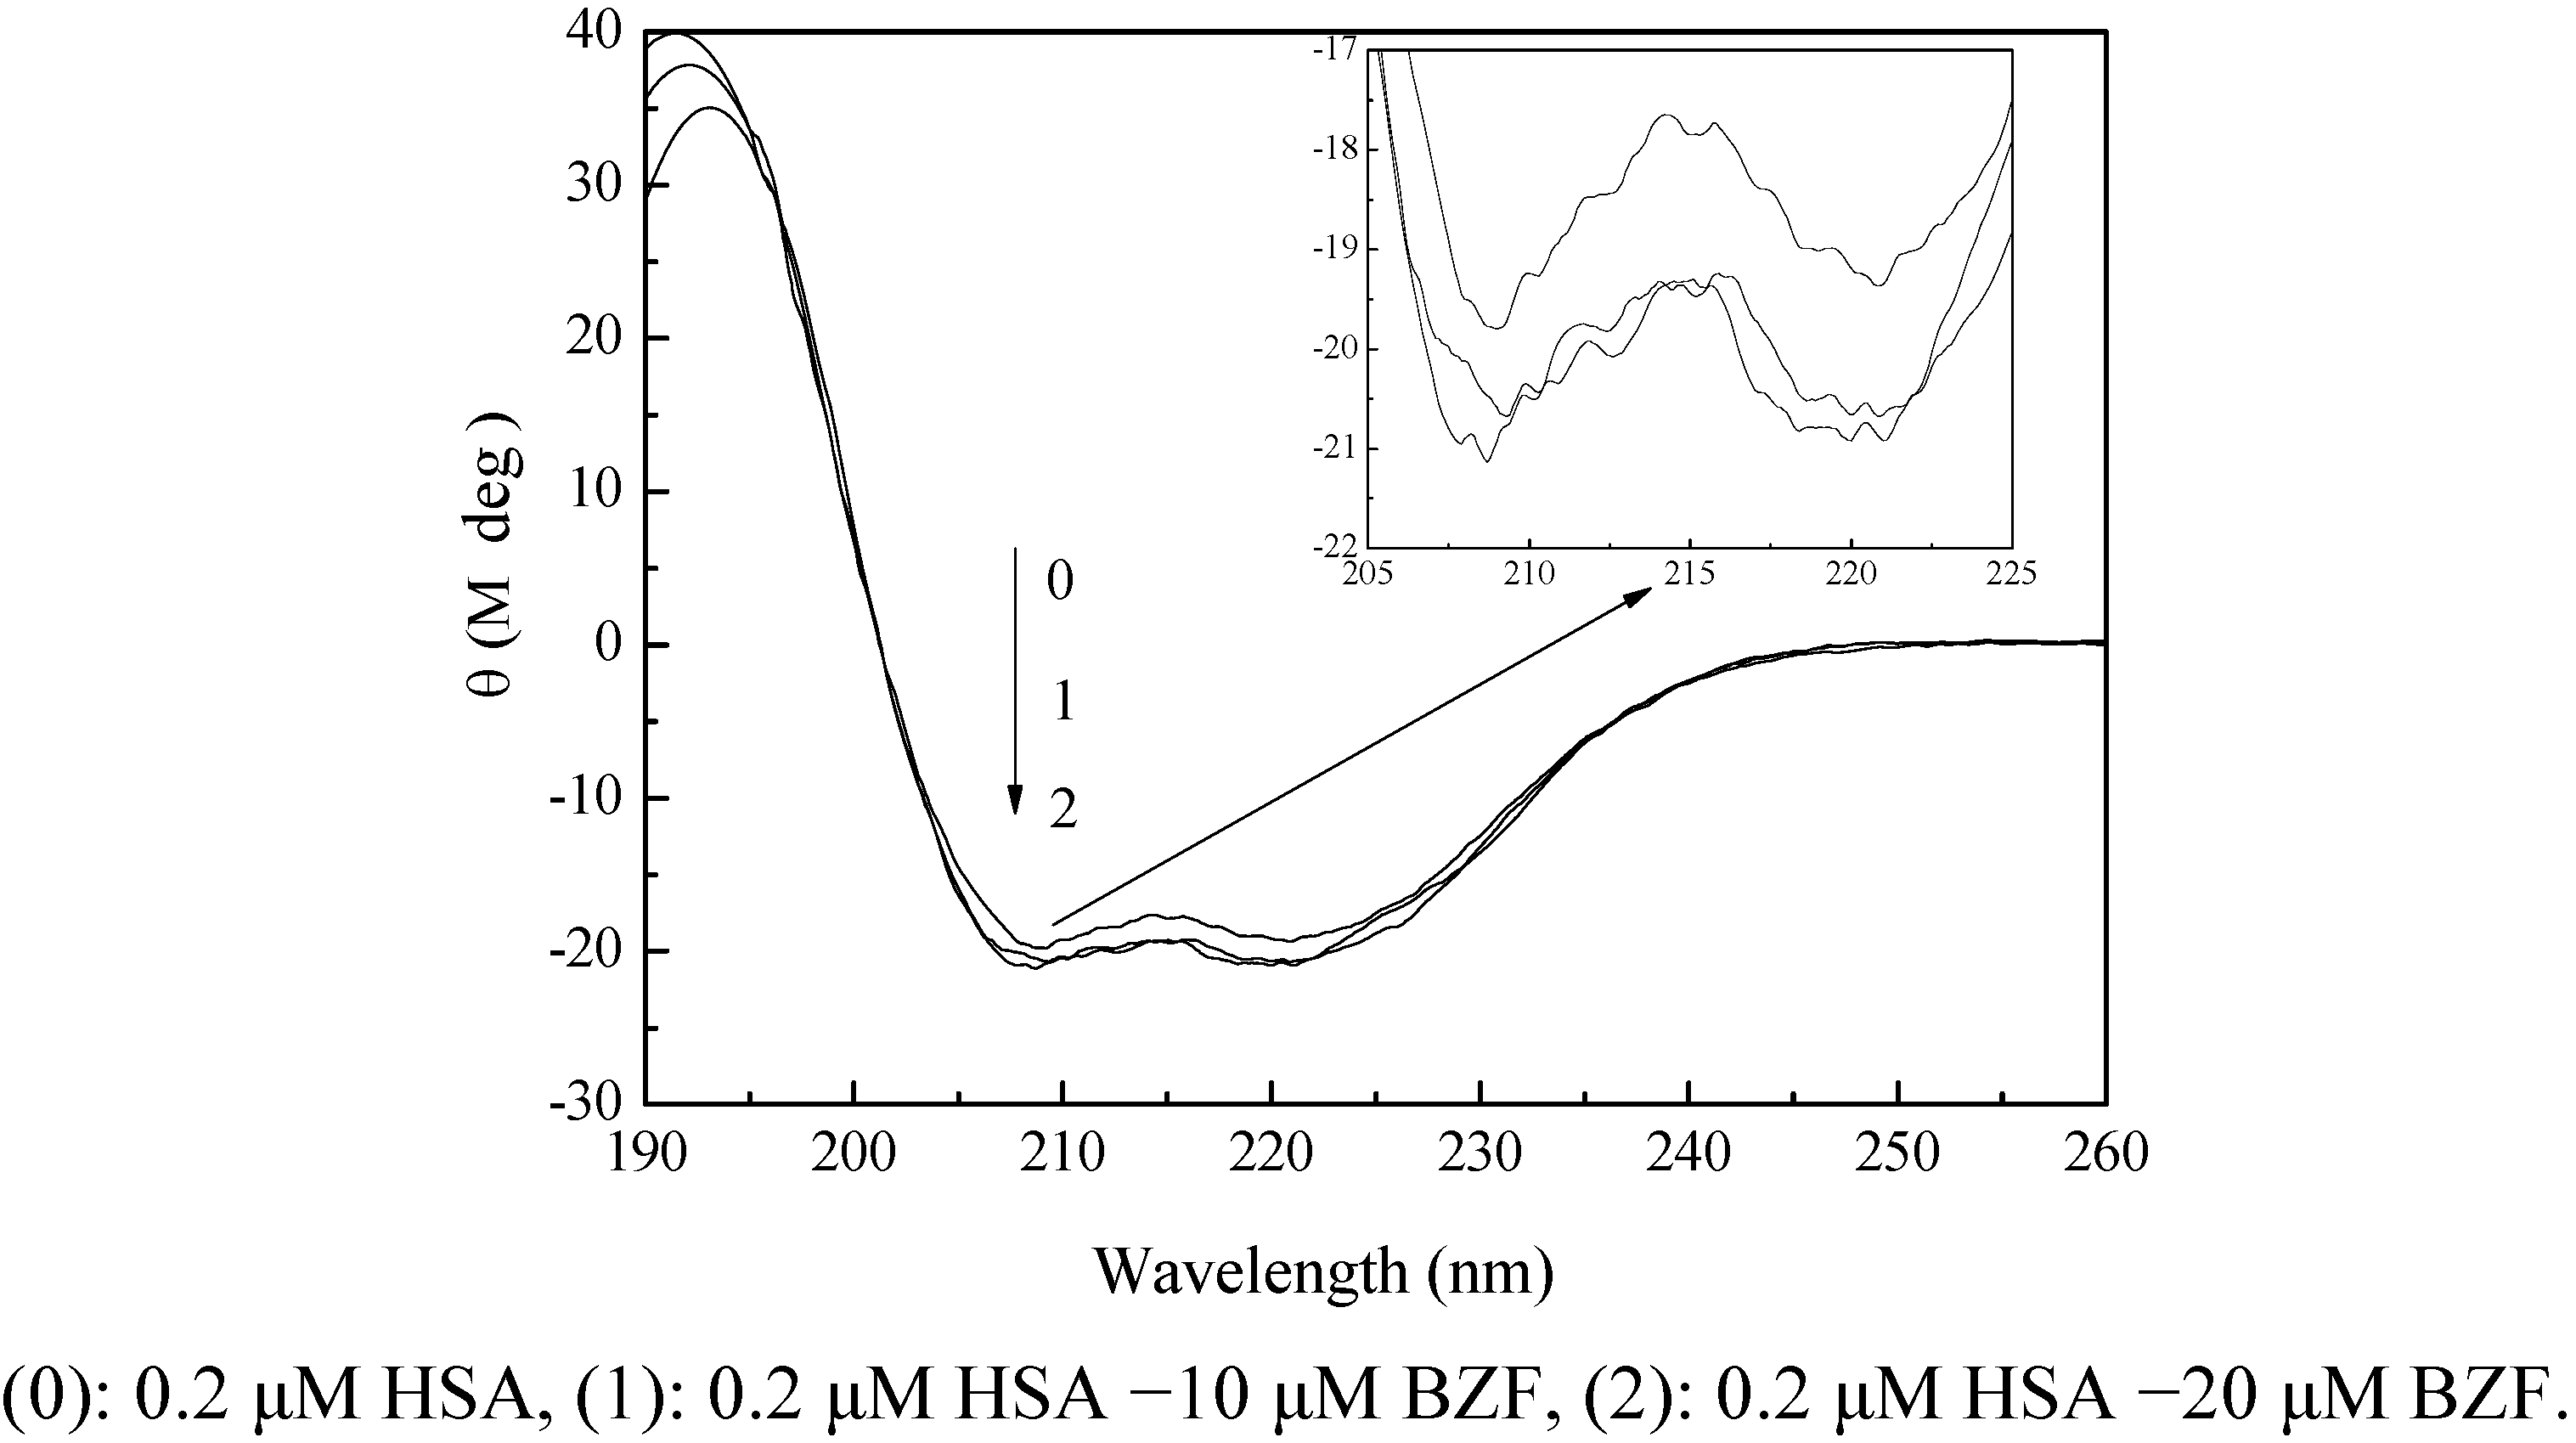
2.3.3. CD Spectra

2.3.4. Effect of BZF on the HSA Physiological Function

3. Experimental
3.1. Instruments and Chemicals
3.2. Spectral Measurement of HSA–BZF Interaction
3.3. Effect of BZF on the Physiological Function of HSA
4. Conclusions
Acknowledgments
- Sample Availability: Not available.
References and Notes
- Daughton, C.G.; Ternes, T.A. Pharmaceuticals and personal care products in the environment: Agents of subtle change? Environ. Health Perspect. 1999, 107, 907–938. [Google Scholar] [CrossRef]
- Halling-Sorensen, B.; Nielsen, S.N.; Lanzky, P.F.; Ingerslev, F.; Lutzhoft, H.C.H.; Jorgensen, S.E. Occurrence, fate and effects of pharmaceutical substances in the environment - a review. Chemosphere 1998, 36, 357–394. [Google Scholar] [CrossRef]
- Heberer, T. Occurrence, fate, and removal of pharmaceutical residues in the aquatic environment: a review of recent research data. Toxicol. Lett. 2002, 131, 5–17. [Google Scholar] [CrossRef]
- Rosal, R.; Rodea-Palomares, I.; Boltes, K.; Fernández-Piñas, F.; Leganés, F.; Gonzalo, S.; Petre, A. Ecotoxicity assessment of lipid regulators in water and biologically treated wastewater using three aquatic organisms. Environ. Sci. Pollut. Res Int. 2010, 17, 135–144. [Google Scholar] [CrossRef]
- Cermola, M.; DellaGreca, M.; Iesce, M.R.; Previtera, L.; Rubino, M.; Temussi, F.; Brigante, M. Phototransformation of fibrate drugs in aqueous media. Environ. Chem. Lett. 2005, 3, 43–47. [Google Scholar] [CrossRef]
- Calamari, D.; Zuccato, E.; Castiglioni, S.; Bagnati, R.; Fanelli, R. Strategic survey of therapeutic drugs in the rivers Po and Lambro in northern Italy. Environ. Sci. Technol. 2003, 37, 1241–1248. [Google Scholar] [CrossRef]
- Bueno, M.J.M.; Agüera, A.; Hernando, M.D.; Gómez, M.J.; Fernández-Alba, A.R. Evaluation of various liquid chromatography-quadrupole-linear ion trap-mass spectrometry operation modes applied to the analysis of organic pollutants in wastewaters. J. Chromatogr. A 2009, 1216, 5995–6002. [Google Scholar] [CrossRef]
- Castiglioni, S.; Bagnati, R.; Calamari, D.; Fanelli, R.; Zuccato, E. A multiresidue analytical method using solid-phase extraction and high-pressure liquid chromatography tandem mass spectrometry to measure pharmaceuticals of different therapeutic classes in urban wastewaters. J. Chromatogr. A 2005, 1092, 206–215. [Google Scholar]
- Kolpin, D.W.; Furlong, E.T.; Meyer, M.T.; Thurman, E.M.; Zaugg, S.D.; Barber, L.B.; Buxton, H.T. Pharmaceuticals, hormones, and other organic wastewater contaminants in US streams, 1999–2000: A national reconnaissance. Environ. Sci. Technol. 2002, 36, 1202–1211. [Google Scholar] [CrossRef]
- Lin, A.Y.C.; Yu, T.H.; Lin, C.F. Pharmaceutical contamination in residential, industrial, and agricultural waste streams: Risk to aqueous environments in Taiwan. Chemosphere 2008, 74, 131–141. [Google Scholar] [CrossRef]
- Quinn, B.; Gagné, F.; Blaise, C. An investigation into the acute and chronic toxicity of eleven pharmaceuticals (and their solvents) found in wastewater effluent on the cnidarian, Hydra attenuata. Sci. Total Environ. 2008, 389, 306–314. [Google Scholar] [CrossRef]
- Isidori, M.; Nardelli, A.; Pascarella, L.; Rubino, M.; Parrella, A. Toxic and genotoxic impact of fibrates and their photoproducts on non-target organisms. Environ. Int. 2007, 33, 635–641. [Google Scholar] [CrossRef]
- Polanco, N.; Hernandez, E.; Gonzalez, E.; Martinez, E.G.; Bello, I.; Gutierrez-Millet, V.; Garcia, F.; Morales, E.; Praga, M. Fibrate-induced deterioration of renal function. Nefrologia 2009, 29, 208–213. [Google Scholar]
- Wu, L.L.; Gao, H.W.; Gao, N.Y.; Chen, F.F.; Chen, L. Interaction of perfluorooctanoic acid with human serum albumin. BMC Struct. Biol. 2009, 9, 1–7. [Google Scholar] [CrossRef]
- Trnková, L.; Boušová, I.; Staňková, V.; Dršata, J. Study on the interaction of catechins with human serum albumin using spectroscopic and electrophoretic techniques. J. Mol. Struct. 2010, 985, 243–250. [Google Scholar]
- Tian, J.; Liu, J.; He, W.; Hu, Z.; Yao, X.; Chen, X. Probing the binding of scutellarin to human serum albumin by circular dichroism, fluorescence spectroscopy, FTIR, and molecular modeling method. Biomacromolecules 2004, 5, 1956–1961. [Google Scholar] [CrossRef]
- Vlasova, I.M.; Vlasov, A.A.; Saletsky, A.M. Interaction of ionic detergent cethyltrimethylammonium bromide with human serum albumin at various values of pH: Spectroscopic study. J. Mol. Struct. 2010, 984, 332–338. [Google Scholar] [CrossRef]
- Gao, H.W.; Xu, Q.; Chen, L.; Wang, S.L.; Wang, Y.; Wu, L.L.; Yuan, Y. Potential protein toxicity of synthetic pigments: Binding of poncean S to human serum albumin. Biophy. J. 2008, 94, 906–917. [Google Scholar] [CrossRef]
- Zhang, Y.L.; Zhang, X.; Fei, X.C.; Wang, S.L.; Gao, H.W. Binding of bisphenol A and acrylamide to BSA and DNA: Insights into the comparative interactions of harmful chemicals with functional biomacromolecules. J. Hazard. Mater. 2010, 182, 877–885. [Google Scholar] [CrossRef]
- Zhang, X.; Chen, L.; Fei, X.C.; Ma, Y.S.; Gao, H.W. Binding of PFOS to serum albumin and DNA: Insight into the molecular toxicity of perfluorochemicals. BMC Mol. Biol. 2009, 10, 1–12. [Google Scholar] [CrossRef]
- Tanaka, Y.; Terabe, S. Estimation of binding constants by capillary electrophoresis. J. Chromatogr. B 2002, 768, 81–92. [Google Scholar] [CrossRef]
- Ge, F.; Jiang, L.; Liu, D.; Chen, C. Interaction between alizarin and human serum albumin by fluorescence spectroscopy. Anal. Sci. 2011, 27, 79–84. [Google Scholar] [CrossRef]
- Kathiravan, A.; Chandramohan, M.; Renganathan, R.; Sekar, S. Spectroscopic studies on the interaction between phycocyanin and bovine serum albumin. J. Mol. Struct. 2009, 919, 210–214. [Google Scholar] [CrossRef]
- Eftink, M.R.; Ghiron, C.A. Fluorescence quenching studies with proteins. Anal. Biochem. 1981, 114, 199–227. [Google Scholar]
- Ahmad, B.; Parveen, S.; Khan, R.H. Effect of albumin conformation on the binding of ciprofloxacin to human serum albumin: A novel approach directly assigning binding site. Biomacromolecules 2006, 7, 1350–1356. [Google Scholar]
- Punith, R.; Katrahalli, U.; Kalanur, S.S.; Jaldappagari, S. Mechanistic and conformational studies on the interaction of anti-inflammatory drugs, isoxicam and tenoxicam with bovine serum albumin. J. Lumin. 2010, 130, 2052–2058. [Google Scholar] [CrossRef]
- Ross, P.D.; Subramanian, S. Thermodynamics of protein association reactions: forces contributing to stability. Biochemistry 1981, 20, 3096–3102. [Google Scholar]
- Ding, F.; Liu, W.; Li, Y.; Zhang, L.; Sun, Y. Determining the binding affinity and binding site of bensulfuron-methyl to human serum albumin by quenching of the intrinsic tryptophan fluorescence. J. Lumin. 2010, 130, 2013–2021. [Google Scholar] [CrossRef]
- Zhang, Y.Z.; Zhou, B.; Liu, Y.X.; Zhou, C.X.; Ding, X.L.; Liu, Y. Fluorescence study on the interaction of bovine serum albumin with P-Aminoazobenzene. J. Fluoresc. 2008, 18, 109–118. [Google Scholar] [CrossRef]
- Zhang, Y.Z.; Zhou, B.; Zhang, X.P.; Huang, P.; Li, C.H.; Liu, Y. Interaction of malachite green with bovine serum albumin: Determination of the binding mechanism and binding site by spectroscopic methods. J. Hazard. Mater. 2009, 163, 1345–1352. [Google Scholar] [CrossRef]
- Ding, F.; Zhao, G.Y.; Chen, S.C.; Liu, F.; Sun, Y.; Zhang, L. Chloramphenicol binding to human serum albumin: Determination of binding constants and binding sites by steady-state fluorescence. J. Mol. Struct. 2009, 929, 159–166. [Google Scholar] [CrossRef]
- Xie, M.X.; Xu, X.Y.; Wang, Y.D. Interaction between hesperetin and human serum albumin revealed by spectroscopic methods. BBA - Gen. Subj. 2005, 1724, 215–224. [Google Scholar]
© 2012 by the authors; licensee MDPI, Basel, Switzerland. This article is an open-access article distributed under the terms and conditions of the Creative Commons Attribution license (http://creativecommons.org/licenses/by/3.0/).
Share and Cite
Qian, Y.; Zhou, X.; Chen, J.; Zhang, Y. Binding of Bezafibrate to Human Serum Albumin: Insight into the Non-Covalent Interaction of an Emerging Contaminant with Biomacromolecules. Molecules 2012, 17, 6821-6831. https://doi.org/10.3390/molecules17066821
Qian Y, Zhou X, Chen J, Zhang Y. Binding of Bezafibrate to Human Serum Albumin: Insight into the Non-Covalent Interaction of an Emerging Contaminant with Biomacromolecules. Molecules. 2012; 17(6):6821-6831. https://doi.org/10.3390/molecules17066821
Chicago/Turabian StyleQian, Yajie, Xuefei Zhou, Jiabin Chen, and Yalei Zhang. 2012. "Binding of Bezafibrate to Human Serum Albumin: Insight into the Non-Covalent Interaction of an Emerging Contaminant with Biomacromolecules" Molecules 17, no. 6: 6821-6831. https://doi.org/10.3390/molecules17066821
APA StyleQian, Y., Zhou, X., Chen, J., & Zhang, Y. (2012). Binding of Bezafibrate to Human Serum Albumin: Insight into the Non-Covalent Interaction of an Emerging Contaminant with Biomacromolecules. Molecules, 17(6), 6821-6831. https://doi.org/10.3390/molecules17066821