BCL::EMAS — Enantioselective Molecular Asymmetry Descriptor for 3D-QSAR

Abstract
:1. Introduction
2. Results and Discussion
2.1. Enatiomorphism is Determined by Asymmetry in Shape or Property Distribution
2.2. Radial Distribution Functions Separate Shape Information and Property Distribution

 is a smoothing parameter, often called the ‘temperature’ while
  is the distance between atoms
  and
and  ,
,  is the total number of atoms in the molecule, and
  is the running variable for the function
  . Often, such equations are ‘weighted’ with a property coefficient for both atoms
  . The function plots shape (i.e., distance between two atoms) on the x-axis, the respective property coefficient on the y-axis thereby separating geometry from property distribution. With
  this function is a representation of the overall shape of the molecule based on the frequencies of all atom pair distances within each radial distance step. As distances are invariant to mirroring, enantiomers share identical RDF functions. Note that diastereomers have distinct RDFs as not all atom pair distances are identical.
 2.3. Expanding RDFs to ‘Signed’ Volumes that Are Sensitive to Shape Enantiomorphy
 and the center of the molecule. Other approaches use all permutations of four atoms. The present approach reduces the computational demand. The geometric property plotted for the tetrahedron is volume.
  , molecules-17-09971-i013, and molecules-17-09971-i014are the coordinates of the three atoms. The center of the molecule is defined by point molecules-17-09971-i015. Then, we compute the signed volume as:
 ,
,  , and
, and  includes
  . This property is beneficial as a planar arrangement of atoms cannot be enantiomorphic. However, for a tetrahedron to contribute to enantiomorphy, its edges
  ,
,  , and
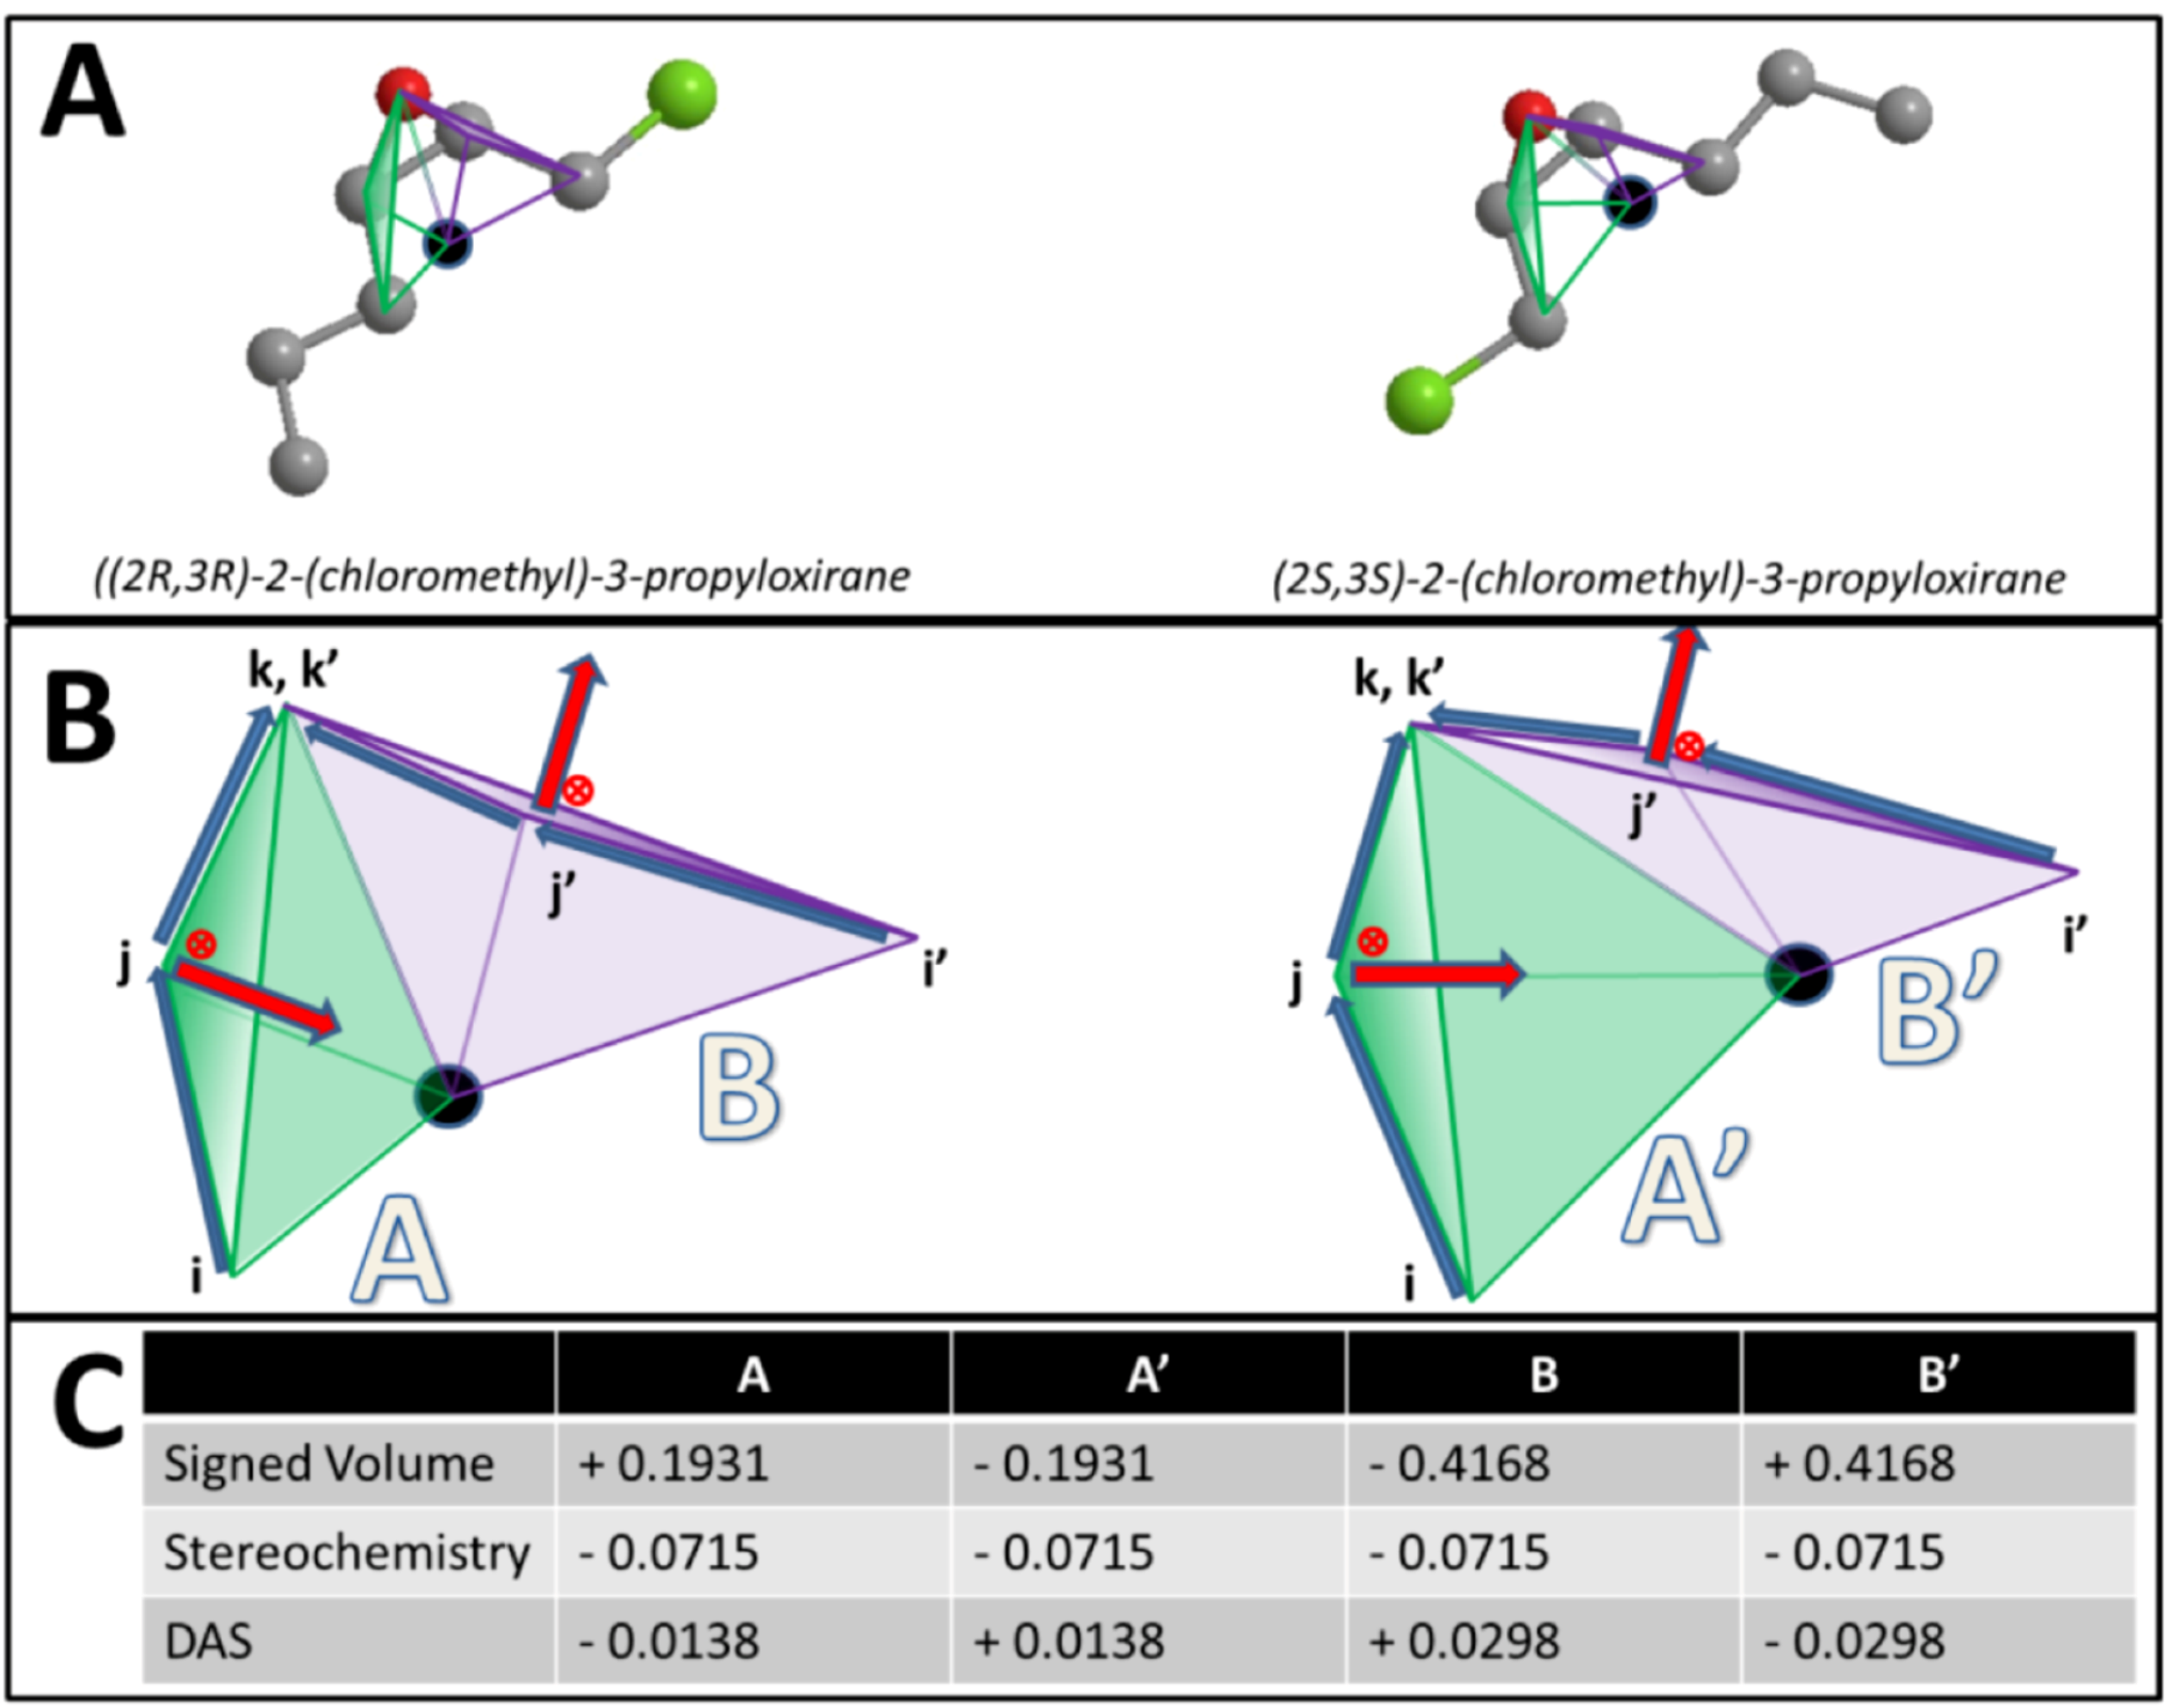
, and  must be of different length. This property is captured by a stereochemistry score:
 > > , then this product will have a negative sign
  . However, if, from the vantage point of the molecular center, the order of distances has been shuffled (as would be seen in an enantiomer > > ), the sign changes as well
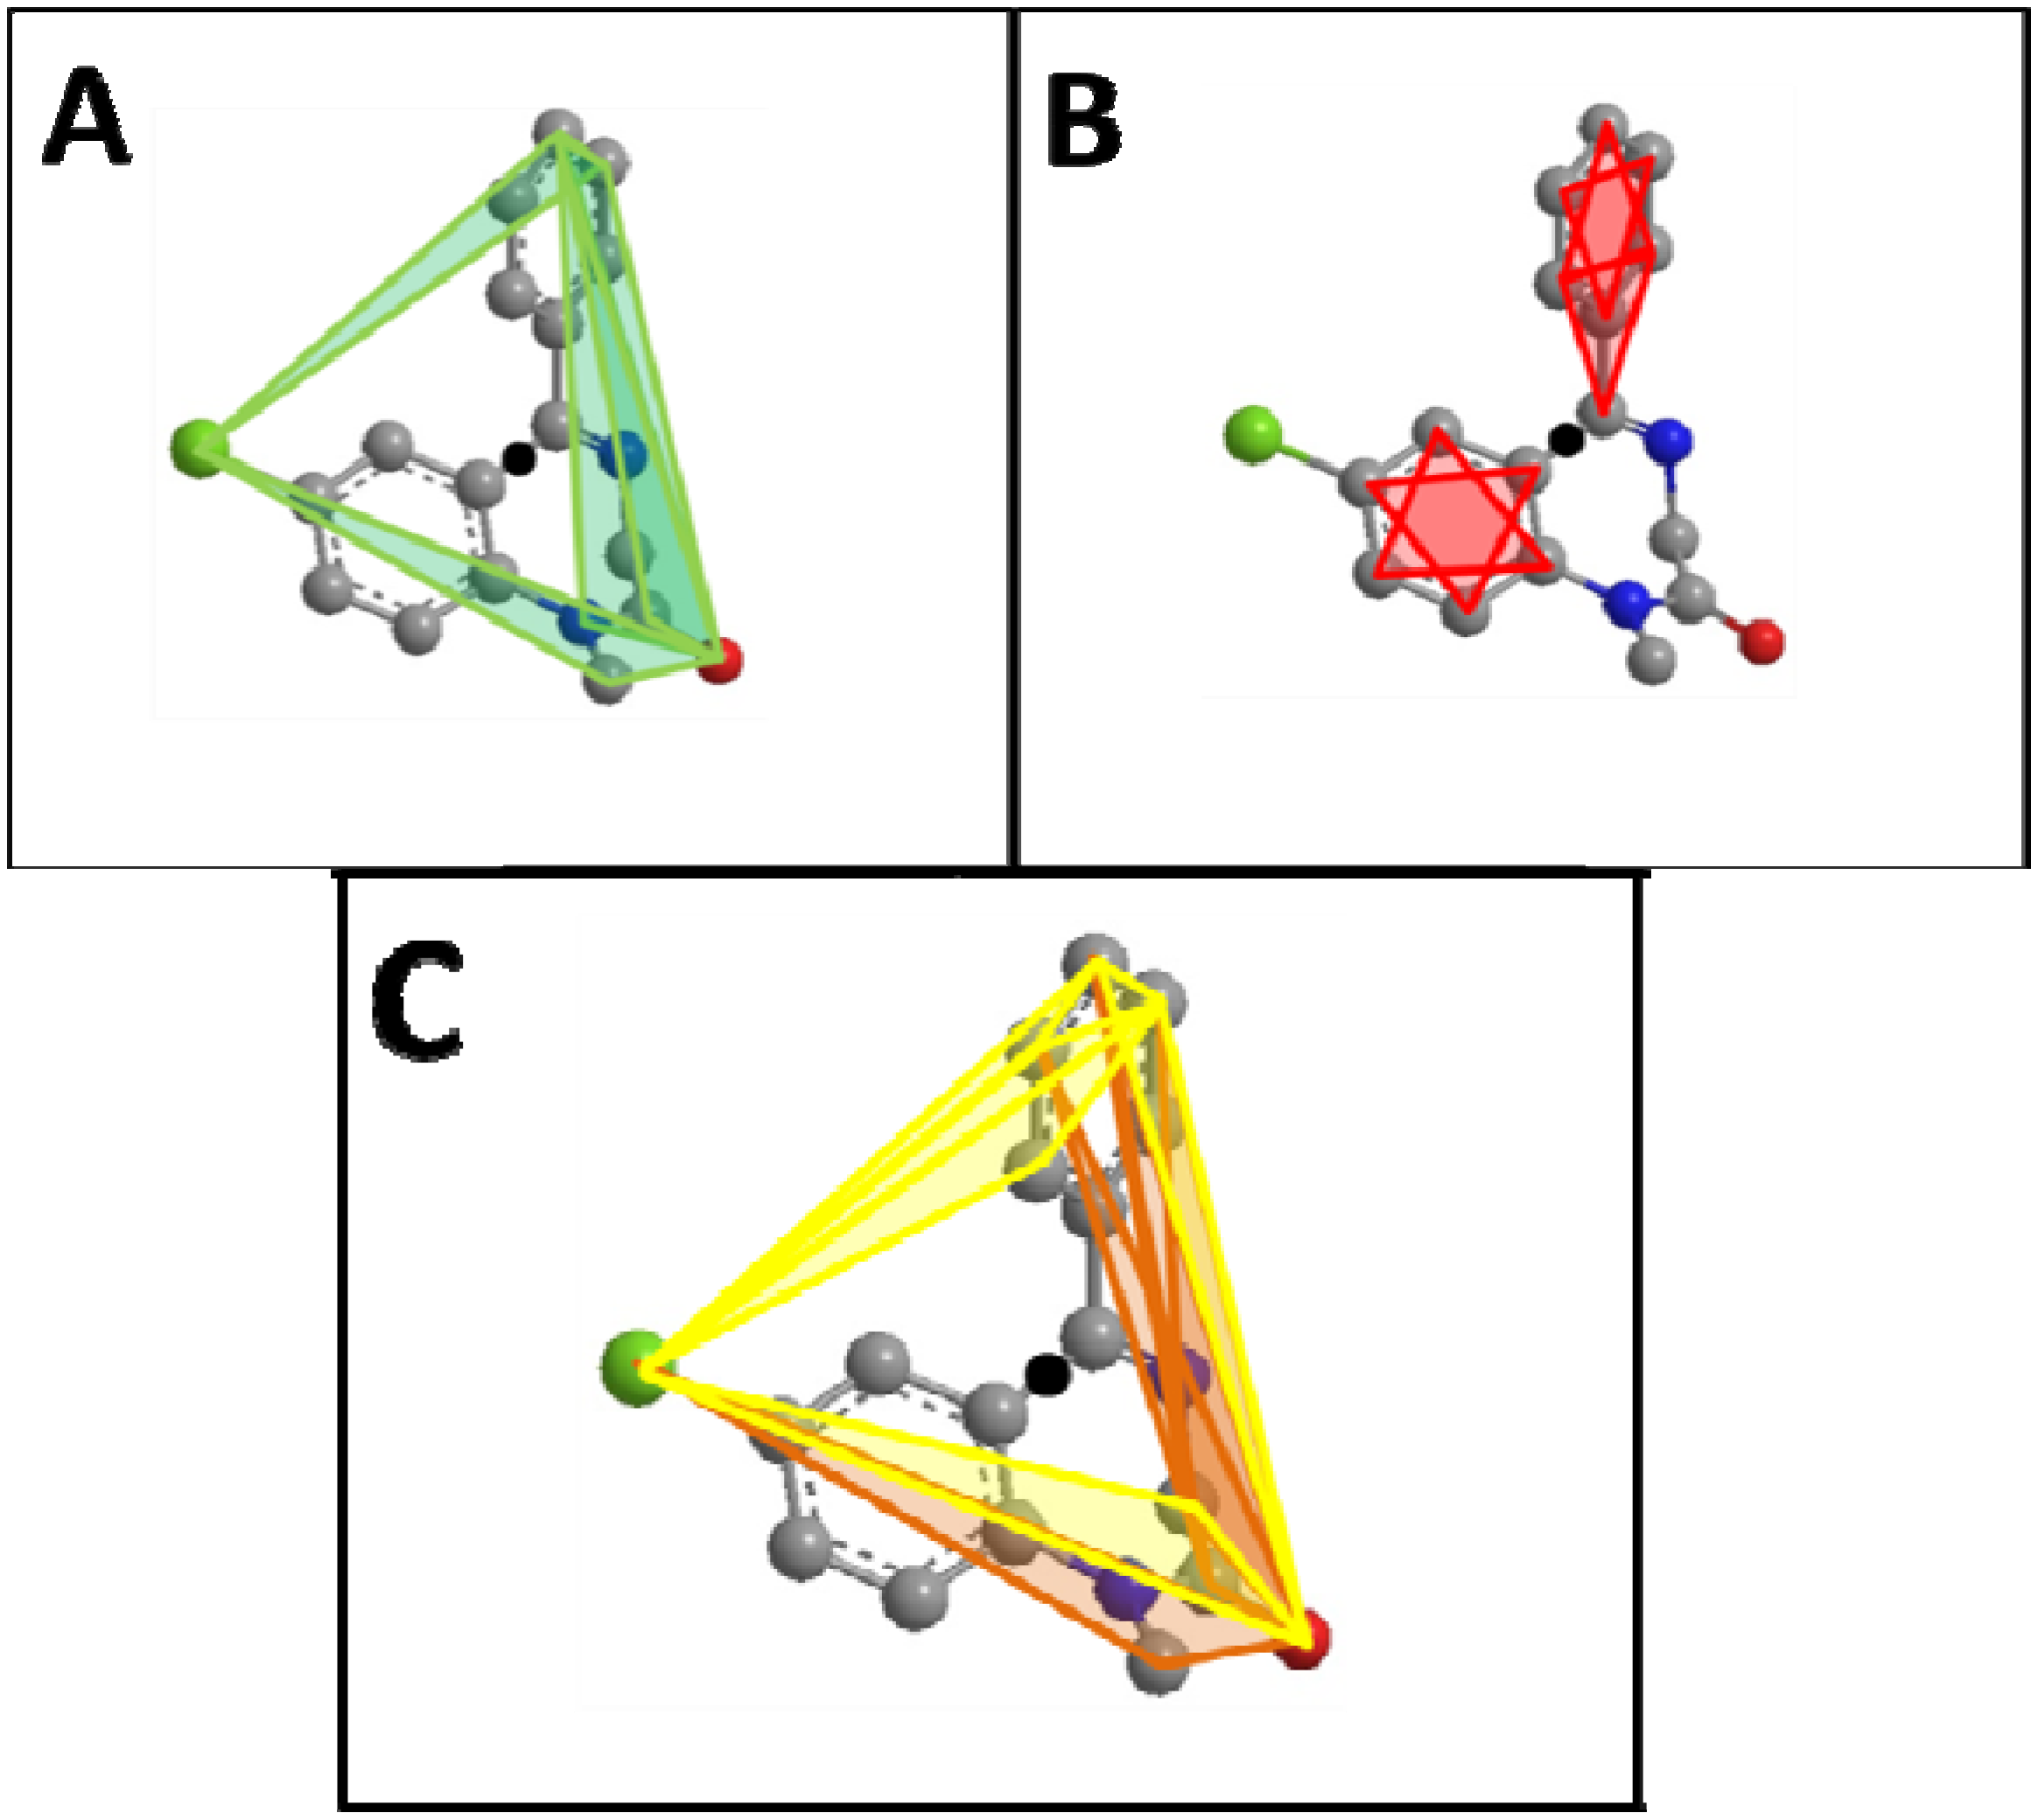
  . Figure 1 demonstrates how opposite directions emerge depending on the ordering of instances. Recall that by allowing a signed volume, we ensure that the order of distances does not rely on the order of atoms coordinates encountered, but rather as the order of distances seen from the molecular center in terms of the cross product’s direction. The score is normalized by a constant factor of 0.0962243 which is calculated as the maximum possible score when the largest of the three distances is 1. Details can be found in the supplemental information. Figure 2 compares atom triplets that give rise to high versus low scores as well as scores with opposite directions.
 is the smoothing parameter, is the total number of non-hydrogen atoms, and is the running variable of the function
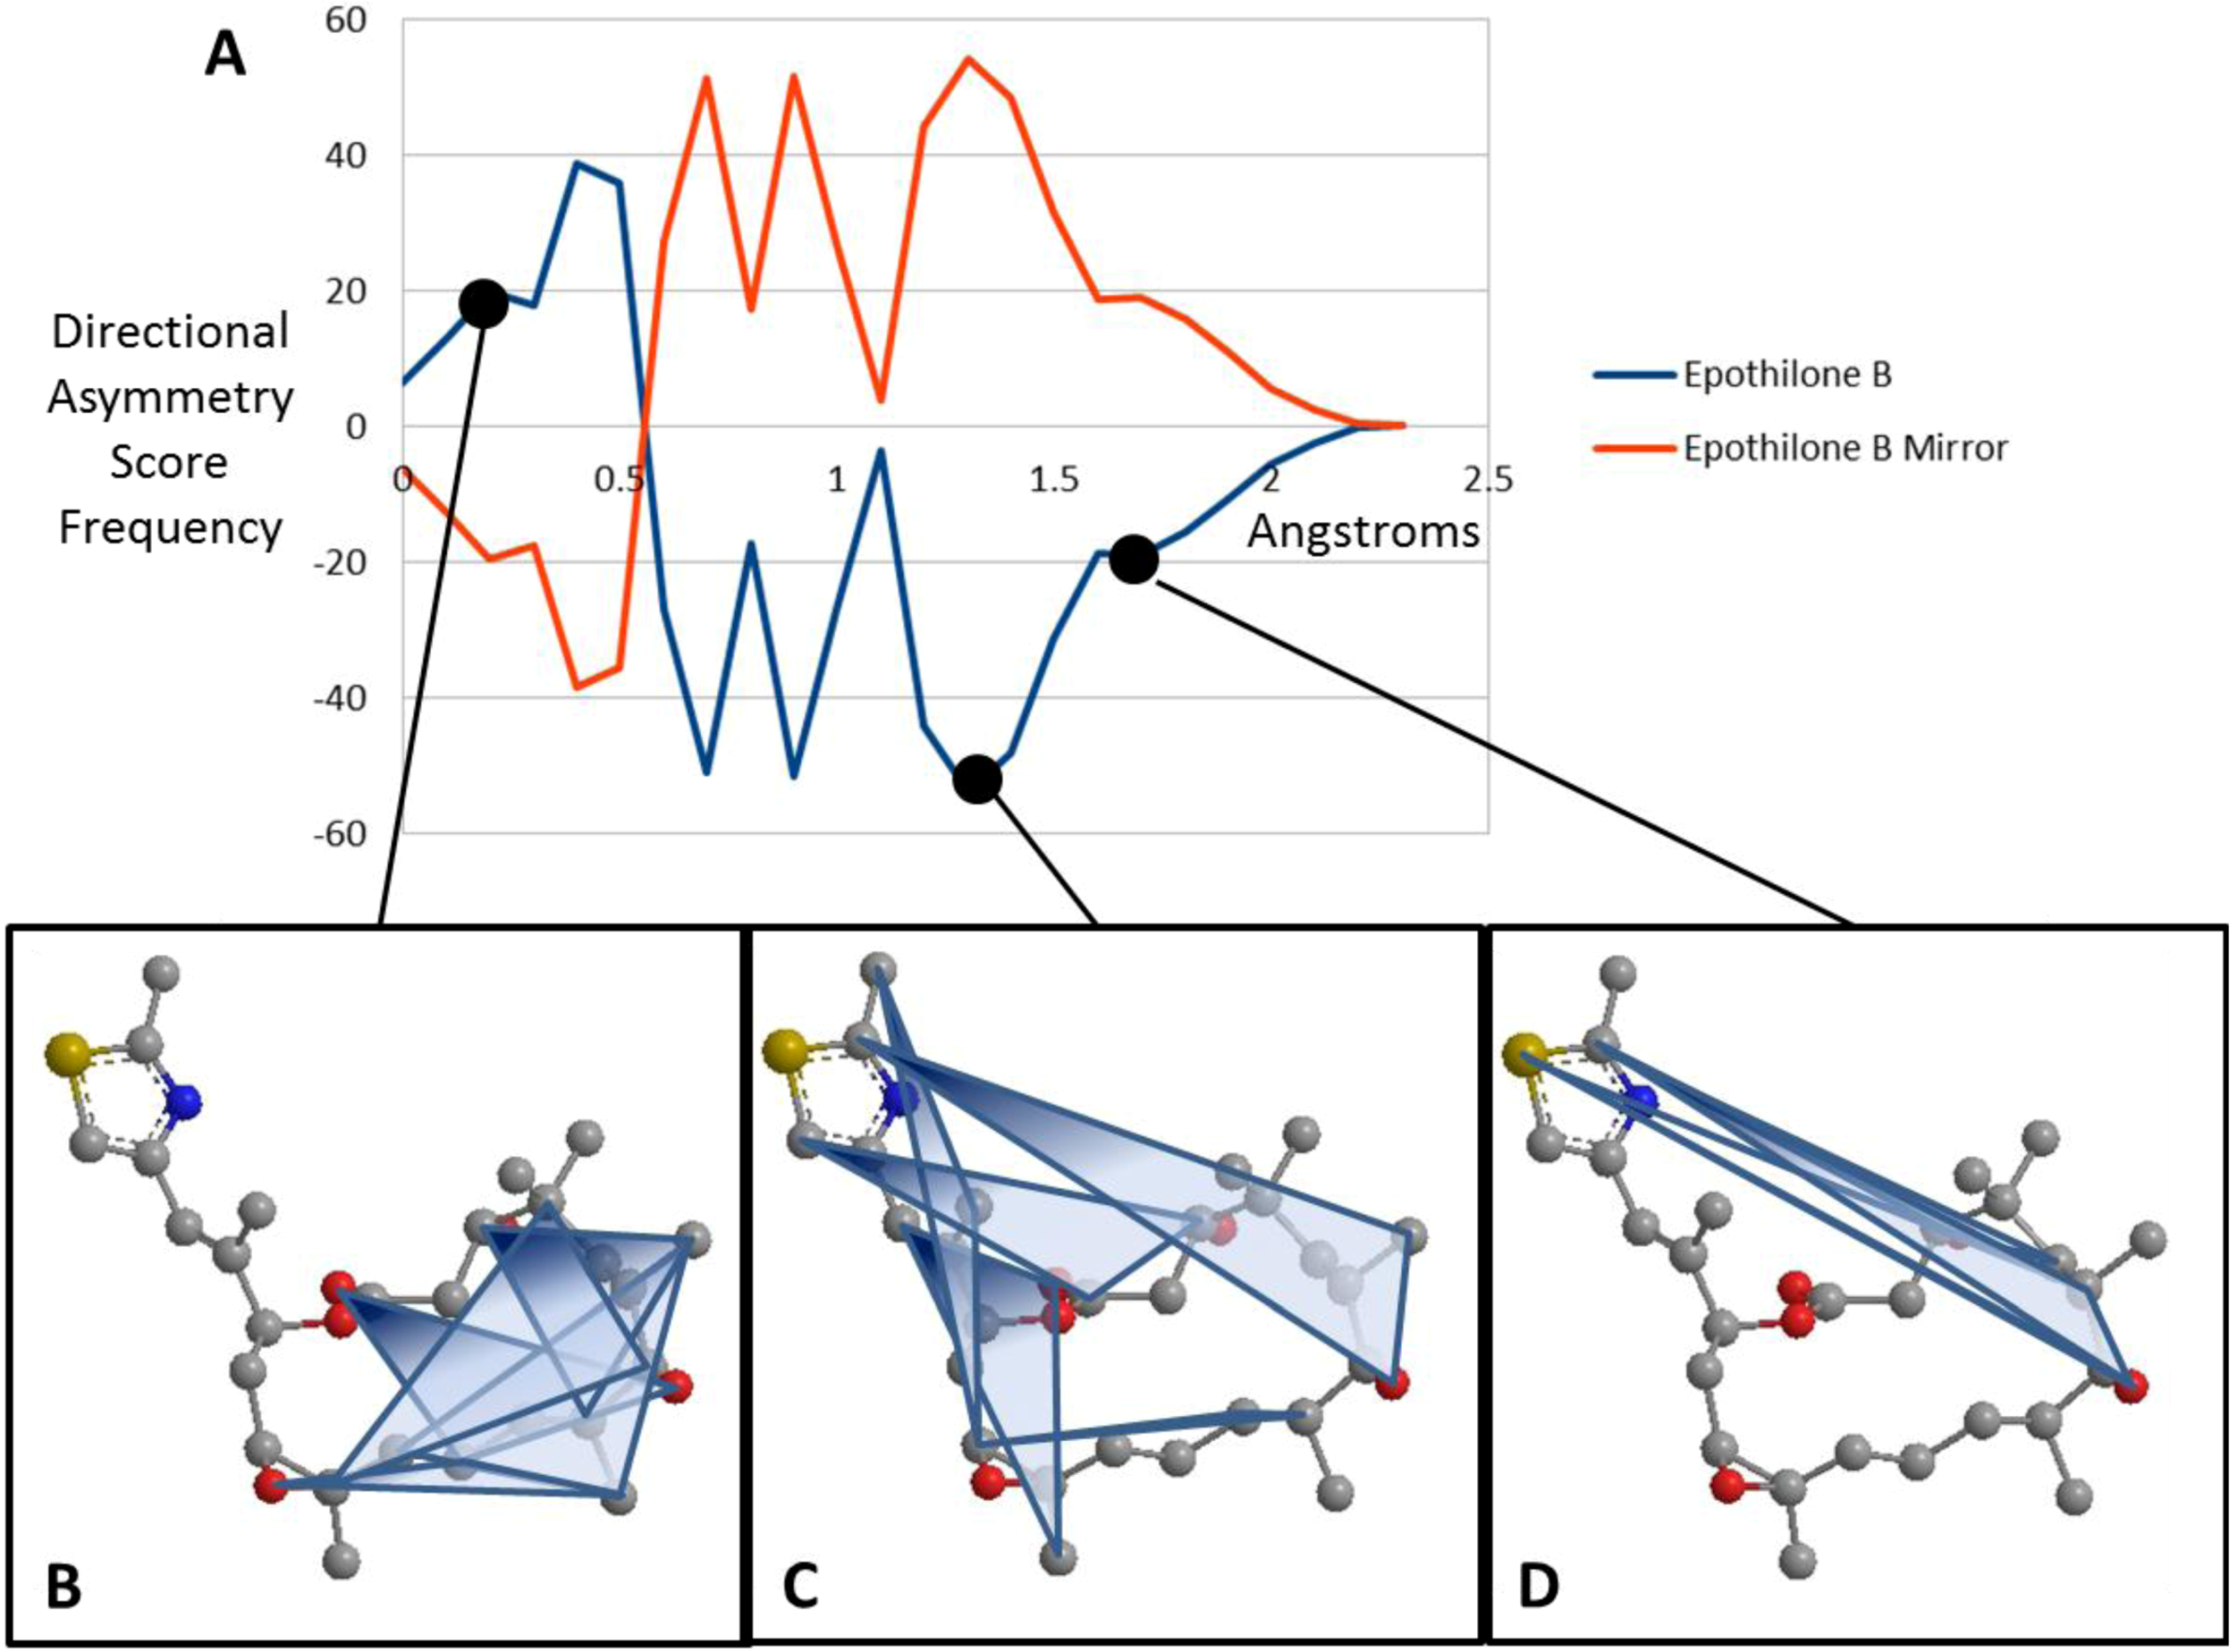
  . The alternate sign preceding the exponential function transfers the “directionality” of the score to the overall function so that at any given score, the intensity reflects the subtraction of negative (one direction) from positive (opposite direction). Figure 3 maps the EMAS plot for epothilone B and its mirror image.


2.4. Evaluation of EMAS as a Novel Descriptor
2.4.1. Predictability Benchmarking: Cramer’s Steroids
 of predicted versus experimental affinities and the “cross-validated ”
  . of 0.78 and a of 0.60. By weighting with a multiplicative property coefficient, the performance increased considerably, resulting in a of 0.86 and a of 0.74. Weighting with the property summation coefficient yielded the best predictions with a of 0.89 and a of 0.78. of 0.65 and a of 0.41, reinforcing our original design to capture stereochemistry. We also compared the model employing EMAS with one created with a traditional RDF. This model performed worse than any of our three methods giving a of 0.75 and a of 0.56. Weighting the RDF’s with the same properties used to weight EMAS did not produce any significant improvement in the model (data not shown). Cross-validated predictions for all variations of EMAS as well as the experimental affinities can be found in Table 1.
| Molecule | Observed CBG affinity (pKa) | Predicted [spatial] | Predicted [multiply properties] | Predicted [sum properties] | Predicted [no stereochemistry] |
|---|---|---|---|---|---|
| aldosterone | −6.28 | −7.47 | −7.31 | −7.25 | −7.22 |
| androstanediol | −5.00 | −5.47 | −5.46 | −5.33 | −5.56 |
| 5-androstenediol | −5.00 | −5.47 | −5.43 | −5.36 | −5.75 |
| 4-androstenedione | −5.76 | −5.64 | −5.60 | −5.79 | −6.36 |
| androsterone | −5.61 | −5.78 | −5.81 | −5.55 | −5.42 |
| corticosterone | −7.88 | −7.30 | −7.37 | −7.32 | −7.34 |
| cortisol | −7.88 | −7.63 | −7.58 | −7.64 | −7.33 |
| cortisone | −6.89 | −7.22 | −6.83 | −7.39 | −7.07 |
| dehydroepiandrosterone | −5.00 | −5.39 | −5.13 | −5.46 | −5.80 |
| 11-deoxycorticosterone | −7.65 | −7.48 | −7.47 | −7.50 | −6.85 |
| 11-deoxycortisol | −7.88 | −7.66 | −7.53 | −7.59 | −7.52 |
| dihydrotestosterone | −5.92 | −5.38 | −5.70 | −5.43 | −5.96 |
| estradiol | −5.00 | −5.40 | −5.36 | −5.32 | −5.21 |
| estriol | −5.00 | −5.25 | −5.26 | −5.43 | −6.10 |
| estrone | −5.00 | −5.30 | −5.21 | −5.54 | −5.42 |
| etiocholanolone | −5.23 | −6.42 | −6.44 | −6.22 | −6.27 |
| pregnenolone | −5.23 | −5.30 | −5.25 | −5.37 | −6.37 |
| 17a-hydroxypregnenolone | −5.00 | −5.20 | −5.28 | −5.29 | −6.65 |
| progesterone | −7.38 | −7.17 | −7.27 | −7.13 | −6.46 |
| 17a-hydroxyprogesterone | −7.74 | −7.42 | −7.39 | −6.97 | −6.70 |
| testosterone | −6.72 | −6.08 | −6.36 | −6.19 | −5.94 |
| prednisolone | −7.51 | −7.61 | −7.36 | −7.65 | −7.03 |
| cortisolacetat | −7.55 | −6.74 | −6.90 | −7.63 | −6.00 |
| 4-pregnene-3,11,20-trione | −6.78 | −6.40 | −6.83 | −6.09 | −6.46 |
| epicorticosterone | −7.20 | −5.98 | −6.00 | −7.03 | −7.15 |
| 19-nortestosterone | −6.14 | −5.58 | −5.86 | −5.54 | −5.45 |
| 16a,17a-dihydroxy-progesterone | −6.25 | −7.25 | −7.04 | −7.46 | −7.36 |
| 16a-methylprogesterone | −7.12 | −6.69 | −6.39 | −6.78 | −6.60 |
| 19-norprogesterone | −6.82 | −6.01 | −6.30 | −7.25 | −6.19 |
| 2a-methylcortisol | −7.69 | −6.62 | −7.22 | −7.68 | −6.57 |
| 2a-methyl-9a-fluorocortisol | −5.80 | −7.56 | −6.97 | −6.22 | −6.74 |
 | 0.78 | 0.86 | 0.89 | 0.65 | |
 | 0.60 | 0.74 | 0.78 | 0.42 |
fell at the average of all of these methods (0.63 < < 0.94). This result is somewhat difficult to interpret for several reasons: (a) different statistical models are utilized; (b) different degrees of cross validation were employed, and (c) our descriptor solely describes stereochemistry and is meant to be complemented by other descriptors (read below). Most of the competing descriptors include more information on molecule size, shape, and property distribution. However, it is important to note that while EMAS does not require any molecular alignment or pre-annotated stereocenters, it is capable of performing well with a dataset that contains a great deal of stereochemistry. Additionally, the inclusion of directional information outperforms a similar implementation lacking directional information as well as the similar RDF descriptor weighted with or without atom properties. For a comparison of our with other documented tests against Cramer’s steroids, see Table 2. can be found in the methods section. Statistical model generation method is indicated as well as QSAR method employed are indicated for each reference.
| QSAR Method | Model Creation | q2 | Reference |
|---|---|---|---|
| Purely Spatial RDF-like stereochemistry | Artificial Neural Network | 0.56 | |
| Property weight RDF-like stereochemistry (product) | Artificial Neural Network | 0.74 | |
| Property weight RDF-like stereochemistry (sum) | Artificial Neural Network | 0.78 | |
| Stochastic 3D-chiral linear indices | Multiple Linear Regression | 0.87 | [13] |
| Chiral Topological Indices | Stepwise Regression Analysis | 0.85 | [10] |
| Chiral Graph Kernels | Support Vector Machine | 0.78 | [11] |
| Chirality Correction and Topological Descriptors | K-nearest neighbor | 0.83 | [9] |
| Molecular Quantum Similarity Measures | Multilinear Regression | 0.84 | [24] |
| Shape and Electrostatic Similarity Matrixes | Non-linear Neural Network | 0.94 | [25] |
| Comparative Molecular Moment Analysis | Partial Least Squares (PLS) | 0.83 | [25] |
| Comparative Molecular Similarity Indices Analysis | PLS | 0.67 | [26] |
| Comparative Molecular Field Analysis | PLS | 0.65 | [20] |
| E-state Descriptors | PLS | 0.62 | [27] |
| Molecular Electronegativity Distance Vector | Genetic Algorithm PLS | 0.78 | [28] |
| Molecular Quantum Similarity Measures | Multilinear Regression and PLS | 0.80 | [29] |
2.4.2. vHTS Utility and Enrichment Benchmarking: PUBMED AID891

3. Experimental
3.1. Generation of Numerical Descriptors for QSAR Model Creation
3.2. Training, Monitoring, and Independent Dataset Generation
3.2.1. Cramer’s Steroids
3.2.2. PUBMED AID891
3.3. Artifical Neural Network (ANN) Architecture and Training
3.4. Forward-Feature Selection for Optimal Descriptor Set Selection
3.5. Model Evaluation
of the predicted activities against actual activities and cross validated , also known as were calculated for each descriptor set. All predicted values used in these analyses were the average predicted activities from each of the leave-one-out models with the different monitoring datasets. The is calculated from the equation: 
 is the sum of squared deviations of each biological property from their mean and
  (predictive residual sum of squares) is the sum of the squared differences between the actual biological property and the cross-validated predicted property.
3.6. Implementation
4. Conclusions
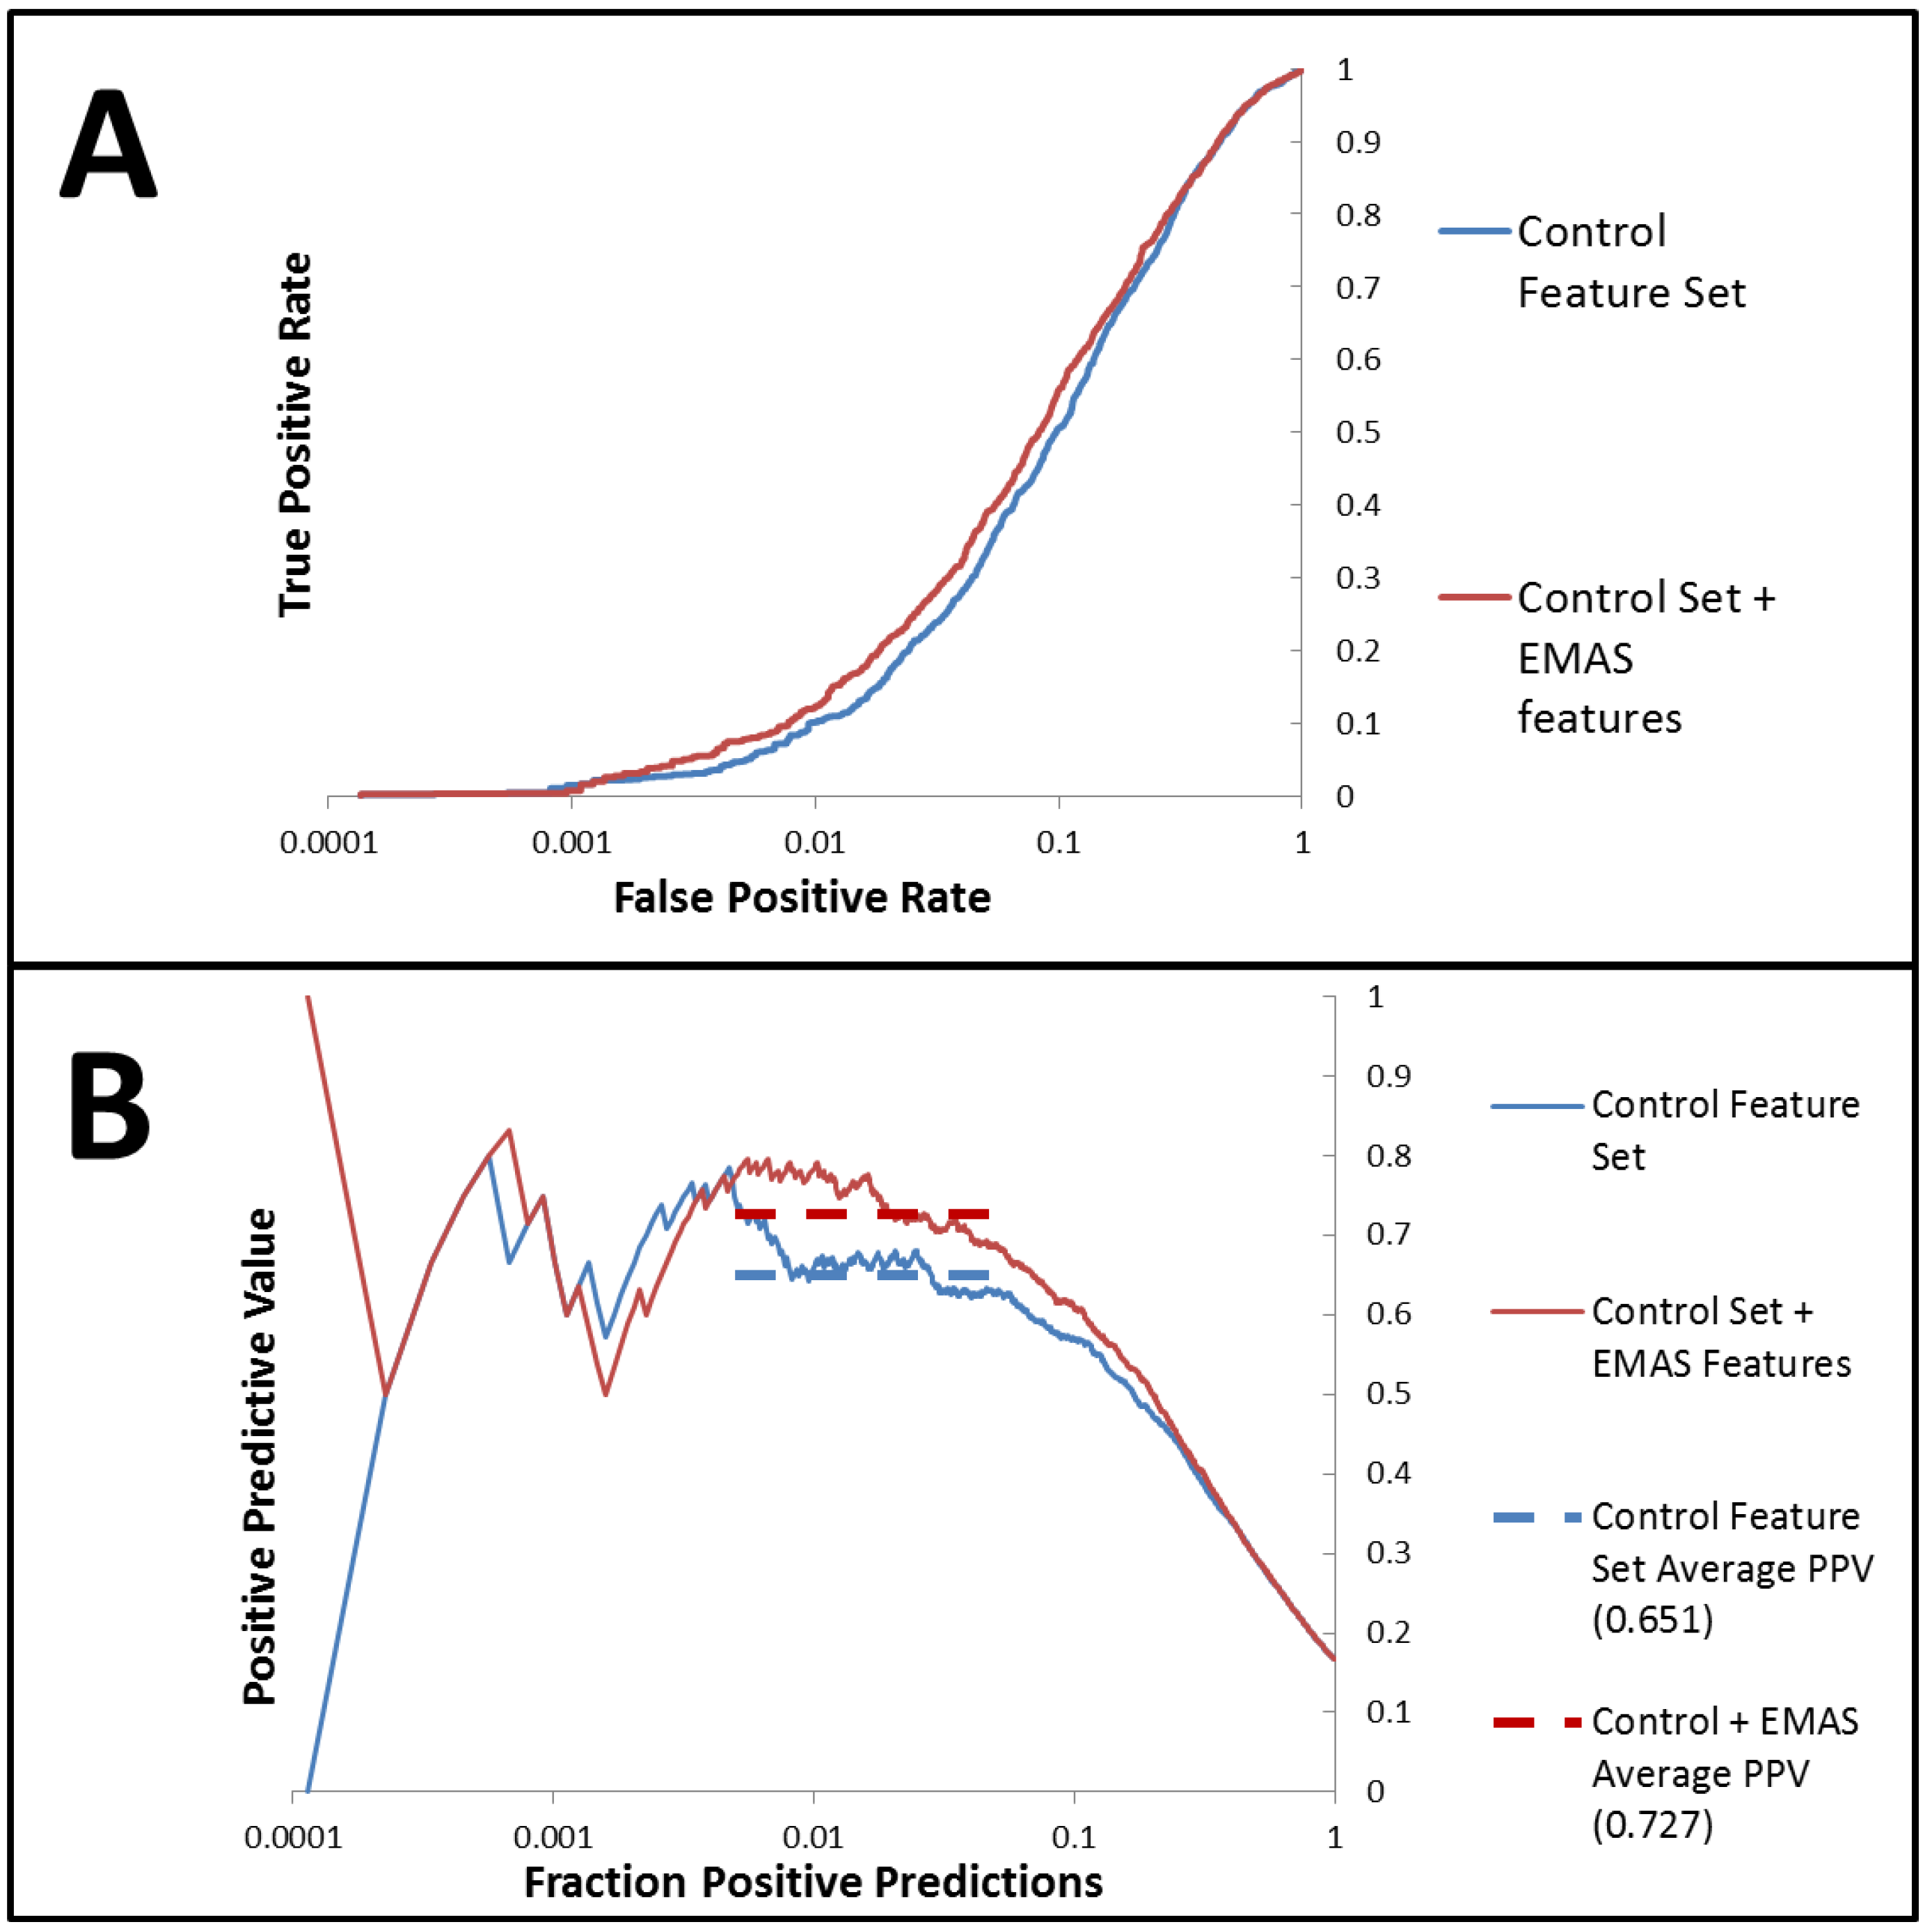
= 0.89, = 0.78). Additionally, we assessed the utility of the EMAS descriptor by running vHTS experiment on a publically available dataset (PUBCHEM AID 891). A forward-feature selection analysis that determines the most effective set of descriptors for this dataset was employed and the best set of features included several EMAS functions (seven EMAS of 20 total features). This set of features improved the performance of our models over those that were tested without EMAS functions (enrichment of 4.38 when including EMAS versus enrichment of 3.94 without EMAS). Supplementary Materials
Acknowledgments
- Sample Availability: Datasets used for model evaluation are available from the authors.
References
- Prelog, V.; Helmchen, G. Basic Principles of the Cip-System and Proposals for a Revision. Angew. Chem. Int. Ed. 1982, 21, 567–583. [Google Scholar] [CrossRef]
- Schiffman, S.S.; Clark, T.B., 3rd; Gagnon, J. Influence of chirality of amino acids on the growth of perceived taste intensity with concentration. Physiol. Behav. 1982, 28, 457–465. [Google Scholar] [CrossRef]
- Pai, V.; Pai, N. Recent advances in chirally pure proton pump inhibitors. J. Indian Med. Assoc. 2007, 105, 469-470, 472, 474. [Google Scholar]
- Mehvar, R.; Brocks, D.R. Stereospecific pharmacokinetics and pharmacodynamics of beta-adrenergic blockers in humans. J. Pharm. Pharm. Sci. 2001, 4, 185–200. [Google Scholar]
- Gurjar, M.K. The future lies in chiral purity: A perspective. J. Indian Med. Assoc. 2007, 105, 177–178. [Google Scholar]
- FDA’s Policy Statement for the Development of New Stereoisomeric Drugs. Chirality 1992, 4, 338–340. [CrossRef]
- Beroza, P.; Suto, M.J. Designing chiral libraries for drug discovery. Drug Discov. Today 2000, 5, 364–372. [Google Scholar] [CrossRef]
- Murakami, H. From racemates to single enantiomers-Chiral synthetic drugs over the last 20 years. Top. Curr. Chem. 2007, 269, 273–299. [Google Scholar] [CrossRef]
- Golbraikh, A.; Bonchev, D.; Tropsha, A. Novel chirality descriptors derived from molecular topology. J. Chem. Inf. Comp. Sci. 2001, 41, 147–158. [Google Scholar] [CrossRef]
- Yang, C.S.; Zhong, C.L. Chirality factors and their application to QSAR studies of chiral molecules. QSAR Comb. Sci. 2005, 24, 1047–1055. [Google Scholar] [CrossRef]
- Brown, J.B.; Urata, T.; Tamura, T.; Arai, M.A.; Kawabata, T.; Akutsu, T. Compound Analysis Via Graph Kernels Incorporating Chirality. J. Bioinform. Comput. B 2010, 8, 63–81. [Google Scholar] [CrossRef]
- Lukovits, I.; Linert, W. A topological account of chirality. J. Chem. Inf. Comp. Sci. 2001, 41, 1517–1520. [Google Scholar] [CrossRef]
- Marrero-Ponce, Y.; Castillo-Garit, J.A. 3D-chiral atom, atom-type, and total non-stochastic and stochastic molecular linear indices and their applications to central chirality codification. J. Comput. Aid. Mol. Des. 2005, 19, 369–383. [Google Scholar] [CrossRef]
- Del Rio, A. Exploring enantioselective molecular recognition mechanisms with chemoinformatic techniques. J. Sep. Sci. 2009, 32, 1566–1584. [Google Scholar] [CrossRef]
- Benigni, R.; Cotta-Ramusino, M.; Gallo, G.; Giorgi, F.; Giuliani, A.; Vari, M.R. Deriving a quantitative chirality measure from molecular similarity indices. J. Med. Chem. 2000, 43, 3699–3703. [Google Scholar] [CrossRef]
- Zabrodsky, H.; Peleg, S.; Avnir, D. Continuous Symmetry Measures. J. Am. Chem. Soc. 1992, 114, 7843–7851. [Google Scholar]
- Aires-de-Sousa, J.; Gasteiger, J. New description of molecular chirality and its application to the prediction of the preferred enantiomer in stereoselective reactions. J. Chem. Inf. Comp. Sci. 2001, 41, 369–375. [Google Scholar] [CrossRef]
- Aires-de-Sousa, J.; Gasteiger, J. Prediction of enantiomeric selectivity in chromatography—Application of conformation-dependent and conformation-independent descriptors of molecular chirality. J. Mol. Graph. Model. 2002, 20, 373–388. [Google Scholar] [CrossRef]
- Aires-De-Sousa, J.; Gasteiger, J.; Gutman, I.; Vidovic, D.I. Chirality codes and molecular structure. J. Chem. Inf. Comp. Sci. 2004, 44, 831–836. [Google Scholar] [CrossRef]
- Cramer, R.D.; Patterson, D.E.; Bunce, J.D. Comparative molecular field analysis (CoMFA). 1. Effect of shape on binding of steroids to carrier proteins. J. Am. Chem. Soc. 1988, 110, 5959–5967. [Google Scholar] [CrossRef]
- Verma, J.; Khedkar, V.M.; Coutinho, E.C. 3D-QSAR in Drug Design—A Review. Curr. Top. Med. Chem. 2010, 10, 95–115. [Google Scholar] [CrossRef]
- Hemmer, M.C.; Steinhauer, V.; Gasteiger, J. Deriving the 3D structure of organic molecules from their infrared spectra. Vib. Spectrosc. 1999, 19, 151–164. [Google Scholar] [CrossRef]
- Silverman, D.B. The thirty-one benchmark steroids revisited: Comparative molecular moment analysis (CoMMA) with principal component regression. Quant. Struct.-Act. Rel. 2000, 19, 237–246. [Google Scholar] [CrossRef]
- Robert, D.; Amat, L.; Carbo-Dorca, R. Three-dimensional quantitative structure-activity relationships from tuned molecular quantum similarity measures: Prediction of the corticosteroid-binding globulin binding affinity for a steroid family. J. Chem. Inf. Comp. Sci. 1999, 39, 333–344. [Google Scholar] [CrossRef]
- So, S.S.; Karplus, M. Three-dimensional quantitative structure-activity relationships from molecular similarity matrices and genetic neural networks. 1. Method and validations. J. Med. Chem. 1997, 40, 4347–4359. [Google Scholar] [CrossRef]
- Klebe, G.; Abraham, U.; Mietzner, T. Molecular Similarity Indexes in a Comparative-Analysis (Comsia) of Drug Molecules to Correlate and Predict Their Biological-Activity. J. Med. Chem. 1994, 37, 4130–4146. [Google Scholar] [CrossRef]
- Maw, H.H.; Hall, L.H. E-state modeling of corticosteroids binding affinity validation of model for small data set. J. Chem. Inf. Comp. Sci. 2001, 41, 1248–1254. [Google Scholar] [CrossRef]
- Liu, S.S.; Yin, C.S.; Wang, L.S. Combined MEDV-GA-MLR method for QSAR of three panels of steroids, dipeptides, and COX-2 inhibitors. J. Chem. Inf. Comp. Sci. 2002, 42, 749–756. [Google Scholar] [CrossRef]
- Besalu, E.; Girones, X.; Amat, L.; Carbo-Dorca, R. Molecular quantum similarity and the fundamentals of QSAR. Accounts Chem. Res. 2002, 35, 289–295. [Google Scholar] [CrossRef]
- Gasteiger, J.; Marsili, M. New Model for Calculating Atomic Charges in Molecules. Tetrahedron Lett. 1978, 3181–3184. [Google Scholar] [CrossRef]
- Gasteiger, J.; Marsili, M. Iterative Partial Equalization of Orbital Electronegativity—A Rapid Access to Atomic Charges. Tetrahedron 1980, 36, 3219–3228. [Google Scholar] [CrossRef]
- Guillen, M.D.; Gasteiger, J. Extension of the Method of Iterative Partial Equalization of Orbital Electronegativity to Small Ring-Systems. Tetrahedron 1983, 39, 1331–1335. [Google Scholar] [CrossRef]
- Bauerschmidt, S.; Gasteiger, J. Overcoming the limitations of a connection table description: A universal representation of chemical species. J. Chem. Inf. Comp. Sci. 1997, 37, 705–714. [Google Scholar] [CrossRef]
- Streitwieser, A. Molecular Orbital Theory for Organic Chemists; Wiley: New York, NY, USA, 1961. [Google Scholar]
- Gasteiger, J.; Saller, H. Calculation of the Charge-Distribution in Conjugated Systems by a Quantification of the Resonance Concept. Angew. Chem. Int. Ed. 1985, 24, 687–689. [Google Scholar] [CrossRef]
- Gilson, M.K.; Gilson, H.S.R.; Potter, M.J. Fast assignment of accurate partial atomic charges: An electronegativity equalization method that accounts for alternate resonance forms. J. Chem. Inf. Comp. Sci. 2003, 43, 1982–1997. [Google Scholar] [CrossRef]
- Gasteiger, J.; Hutchings, M.G. New Empirical-Models of Substituent Polarizability and Their Application to Stabilization Effects in Positively Charged Species. Tetrahedron Lett. 1983, 24, 2537–2540. [Google Scholar] [CrossRef]
- Gasteiger, J.; Hutchings, M.G. Quantitative Models of Gas-Phase Proton-Transfer Reactions Involving Alcohols, Ethers, and Their Thio Analogs—Correlation Analyses Based on Residual Electronegativity and Effective Polarizability. J. Am. Chem. Soc. 1984, 106, 6489–6495. [Google Scholar] [CrossRef]
- Miller, K.J. Additivity Methods in Molecular Polarizability. J. Am. Chem. Soc. 1990, 112, 8533–8542. [Google Scholar] [CrossRef]
- Mueller, R.; Rodriguez, A.L.; Dawson, E.S.; Butkiewicz, M.; Nguyen, T.T.; Oleszkiewicz, S.; Bleckmann, A.; Weaver, C.D.; Lindsley, C.W.; Conn, P.J.; et al. Identification of Metabotropic Glutamate Receptor Subtype 5 Potentiators Using Virtual High-Throughput Screening. ACS Chem. Neurosci. 2010, 1, 288–305. [Google Scholar] [CrossRef]
© 2012 by the authors; licensee MDPI, Basel, Switzerland. This article is an open-access article distributed under the terms and conditions of the Creative Commons Attribution license (http://creativecommons.org/licenses/by/3.0/).
Share and Cite
Sliwoski, G.; Lowe, E.W., Jr.; Butkiewicz, M.; Meiler, J. BCL::EMAS — Enantioselective Molecular Asymmetry Descriptor for 3D-QSAR. Molecules 2012, 17, 9971-9989. https://doi.org/10.3390/molecules17089971
Sliwoski G, Lowe EW Jr., Butkiewicz M, Meiler J. BCL::EMAS — Enantioselective Molecular Asymmetry Descriptor for 3D-QSAR. Molecules. 2012; 17(8):9971-9989. https://doi.org/10.3390/molecules17089971
Chicago/Turabian StyleSliwoski, Gregory, Edward W. Lowe, Jr., Mariusz Butkiewicz, and Jens Meiler. 2012. "BCL::EMAS — Enantioselective Molecular Asymmetry Descriptor for 3D-QSAR" Molecules 17, no. 8: 9971-9989. https://doi.org/10.3390/molecules17089971
APA StyleSliwoski, G., Lowe, E. W., Jr., Butkiewicz, M., & Meiler, J. (2012). BCL::EMAS — Enantioselective Molecular Asymmetry Descriptor for 3D-QSAR. Molecules, 17(8), 9971-9989. https://doi.org/10.3390/molecules17089971