1. Introduction
Fungi of the
Chaetomium species are the largest genus of saprophytic ascomycetes, which belongs to the
Chaetomiaceae family. Since Kunze first established this genus in 1817, more than 350
Chaetomium species have been described [
1]. This fungal spp. is widely distributed in different biotopes, such as soils, marine, animal dung, hair, textiles, plant seeds and some other substrates rich in cellulose.
Chaetomium spp. are often used to produce cellulose in industry, and are also used as biocontrol agents in agriculture. Due to the diversity of species and of inhabiting-environments,
Chaetomium spp. might conceive diverse biosynthetic gene clusters, which transform into various secondary metabolites (the fungi languages) to adapt to different ecological environments [
2]. Until now more than 200 compounds with a wide range of bioactive effects have been isolated from
Chaetomium spp., but compared with its richness of species, more bioactive secondary metabolites might be found in this member of fungi [
3]. In our ongoing systematic chemical investigation of
Chaetomium spp. [
4,
5], two new polyketides, chaetochromones A (
1) and B (
2), were isolated from the crude extract of fungus
Chaetomium indicum (CBS.860.68) together with three known analogues PI-3 (
3) [
6], PI-4 (
4) [
6] and SB236050 (
5) [
7] (
Figure 1). These secondary metabolites displayed different degrees of inhibitory activity against eight plant pathogens. In this paper, we will present the structure elucidation and bioactive evaluation, and also postulate their plausible biosynthesis.
Figure 1.
Structures of compounds 1–7.
Figure 1.
Structures of compounds 1–7.
2. Results and Discussion
The HRESIMS revealed the molecular formula of chaetochromone A (
1) as C
13H
12O
6Na (
m/z 287.0528 [M+Na]
+; Δ +0.4 mmu) with eight degrees of unsaturation. Analysis of the
1H-,
13C- and HMQC NMR data for
1 revealed the presence of one methyl, one methylene, two oxygenated methines, eight olefinic carbons (two of which were protonated), one carbonyl group with a chemical shift value of
δC 176.6, which implied that this group might be an acetyl group or a ketone one conjugated with two double bonds. Analysis of the NMR data (
Table 1), especially HMBC correlations (
Figure 2), suggested that a 6,7-dihydroxy-4
H-chromen-4-one moiety might be present in compound
1.
Table 1.
NMR data for Compounds 1 and 2 in CD3OD.
Table 1.
NMR data for Compounds 1 and 2 in CD3OD.
| Position | Chaetocromone A (1) | Chaetocromone B (2) |
|---|
| δH a (J in Hz) | δC b, mult. | δH c (J in Hz) | δC b, mult. |
|---|
| 2 | | 165.0 | 8.15 (s) | 153.3 |
| 3 | | 117.6 | | 120.9 |
| 4 | | 176.6 | | 177.8 |
| 4a | | 117.5 | | 117.9 |
| 5 | 7.39 (s) | 108.6 | 7.37 (s) | 108.0 |
| 6 | | 146.0 | | 146.3 |
| 7 | | 153.2 | | 154.3 |
| 8 | 6.86 (s) | 103.7 | 6.81 (s) | 103.6 |
| 8a | | 154.3 | | 155.0 |
| 9 | 5.96 (s) | 88.6 | 6.40 (d, 15.2) | 123.4 |
| 10a | 2.60 (dd, 18.0, 3.6) | 35.3 | 6.41 (overlapped) | 134.9 |
| 10b | 2.68 (dd, 18.0,10.8) | | | |
| 11 | 4.50 (m) | 63.2 | 3.82 (m) | 79.9 |
| 12 | 1.37 (d, 6.6) | 21.2 | 1.23 (d, 6.6) | 21.6 |
| -OMe | | | | 56.3 |
Figure 2.
Key HMBC correlations of compound 1 and 2.
Figure 2.
Key HMBC correlations of compound 1 and 2.
The HMBC correlations from CH
3-12 to C-10 and C-11 confirmed that C-12 and C-10 were connected with C-11. The C-2/C-3 double bond connection with C-10 was confirmed by the correlation of H-11 with C-2, and H-10 with C-2 and C-3. The correlations from H-9 to C-2, C-3, C-4 and C-11 established one 2-methyl-3,6-dihydro-2
H-pyran fragment with one keto group anchored at C-3. In the HMBC spectra, the aromatic protons H-5 had correlations with C-4, C-6, C-7 and C-8a, and H-8 had correlations with C-4a, C-6 and C-7, together accounting for the above-mentioned fragments, and comparison with its analogues SB236050 (
5) [
7] and
6 [
8], confirmed that
1 contained a 6,7-dihydroxy-4
H-chromen-4-one moiety. According to the chemical shift values and molecular formula, C-6, C-7 and C-9 each must be connected with one free hydroxyl group, respectively, which finally established the structure of
1 as shown in
Figure 1.
The relative configuration was established by analysis of coupling constant and NOESY correlations. The J value of H-10b/H-11 (10.8 Hz) implied those two protons H-10b and H-11 to be puseudo-axially. The correlations between CH3-12 or H-11 with H-9 did not be observed in the NOESY spectra, which could not determined the relative configuration. We tried to use a modified Mosher’s reaction to determine the absolute configuration of secondary hydroxyl group (9-OH), while the (R)-MTPACl/ (S)-MTPACl did not react with the 9-OH in 1, implying that the hydroxyl group (9-OH) might form an intra-molecular hydrogen bond with C-4 to preclude the reaction from happening.
In theory, there exist two relative configurations and four absolute configurations for compound
1, as depicted in
Figure 3. Conformational analysis combined with NMR data revealed that compound
1 should possess the absolute configuration indicated as
1a or
1b. Then the absolute configurations at C-9 and C-11 of
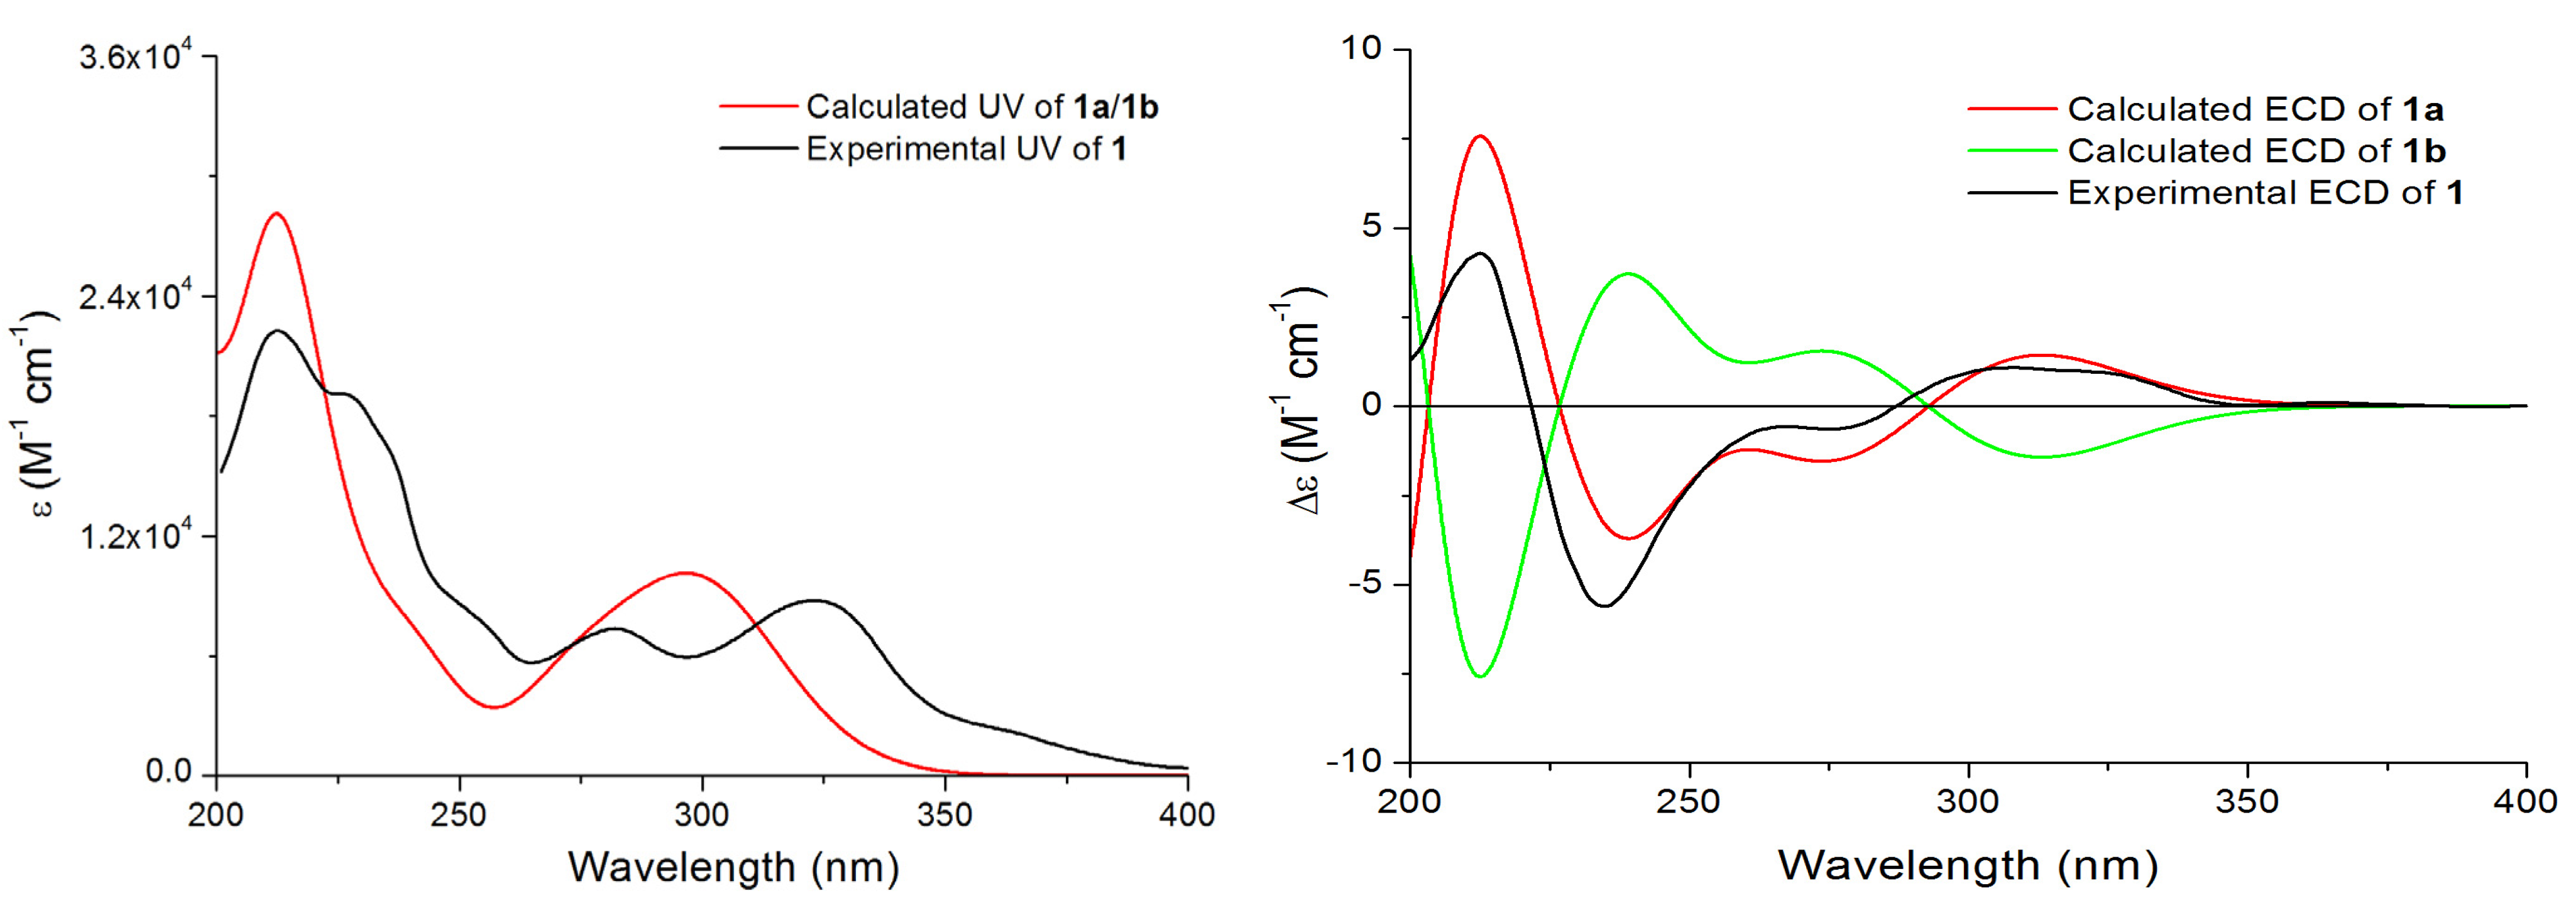
1 were assigned by comparison of the experimental ECD data and the theoretical ECD spectra predicted using time-dependent density functional theory (TDDFT). Since the relative configuration of
1 was established by a NMR method, a pair of enantiomers (
1a and
1b,
Figure 4) was proposed as the model compounds. The predicted ECD spectrum of
1a was in good agreement of the experimental ECD spectrum of compound
1. Thus, the absolute configurations of 9 and 12 were determined as 9
R, and 11
S.
Figure 3.
Two possible relative and four absolute configurations of 1.
Figure 3.
Two possible relative and four absolute configurations of 1.
Figure 4.
Experimental UV and ECD spectra of 1, and calculated and ECD spectra 1a and 1b.
Figure 4.
Experimental UV and ECD spectra of 1, and calculated and ECD spectra 1a and 1b.
The molecular formula of 2 was determined as C14H14O5Na (m/z 285.0735 [M+Na]+; Δ +0.4 mmu) by HRESIMS data with eight degrees of unsaturation. Compared with NMR data with those of 1, it revealed that compound 2 had one more double bond, suggesting that 2 possessed one less ring system than 1.
The NMR data (
Table 1), especially the HMBC spectra revealed that compound
2 also possessed the same 6,7-dihydroxy-4
H-chromen-4-one moiety as that of
1 (
Figure 2). The HMBC correlations from H-9 to C-2, C-3 and C-4, H-10 to C-3, CH
3-12 to C-10 and C-11, and also from OCH
3-11 to C-11 confirmed that one 4-methoxypent-1-ene fragment was connected with C-3. Thus the structure for compound
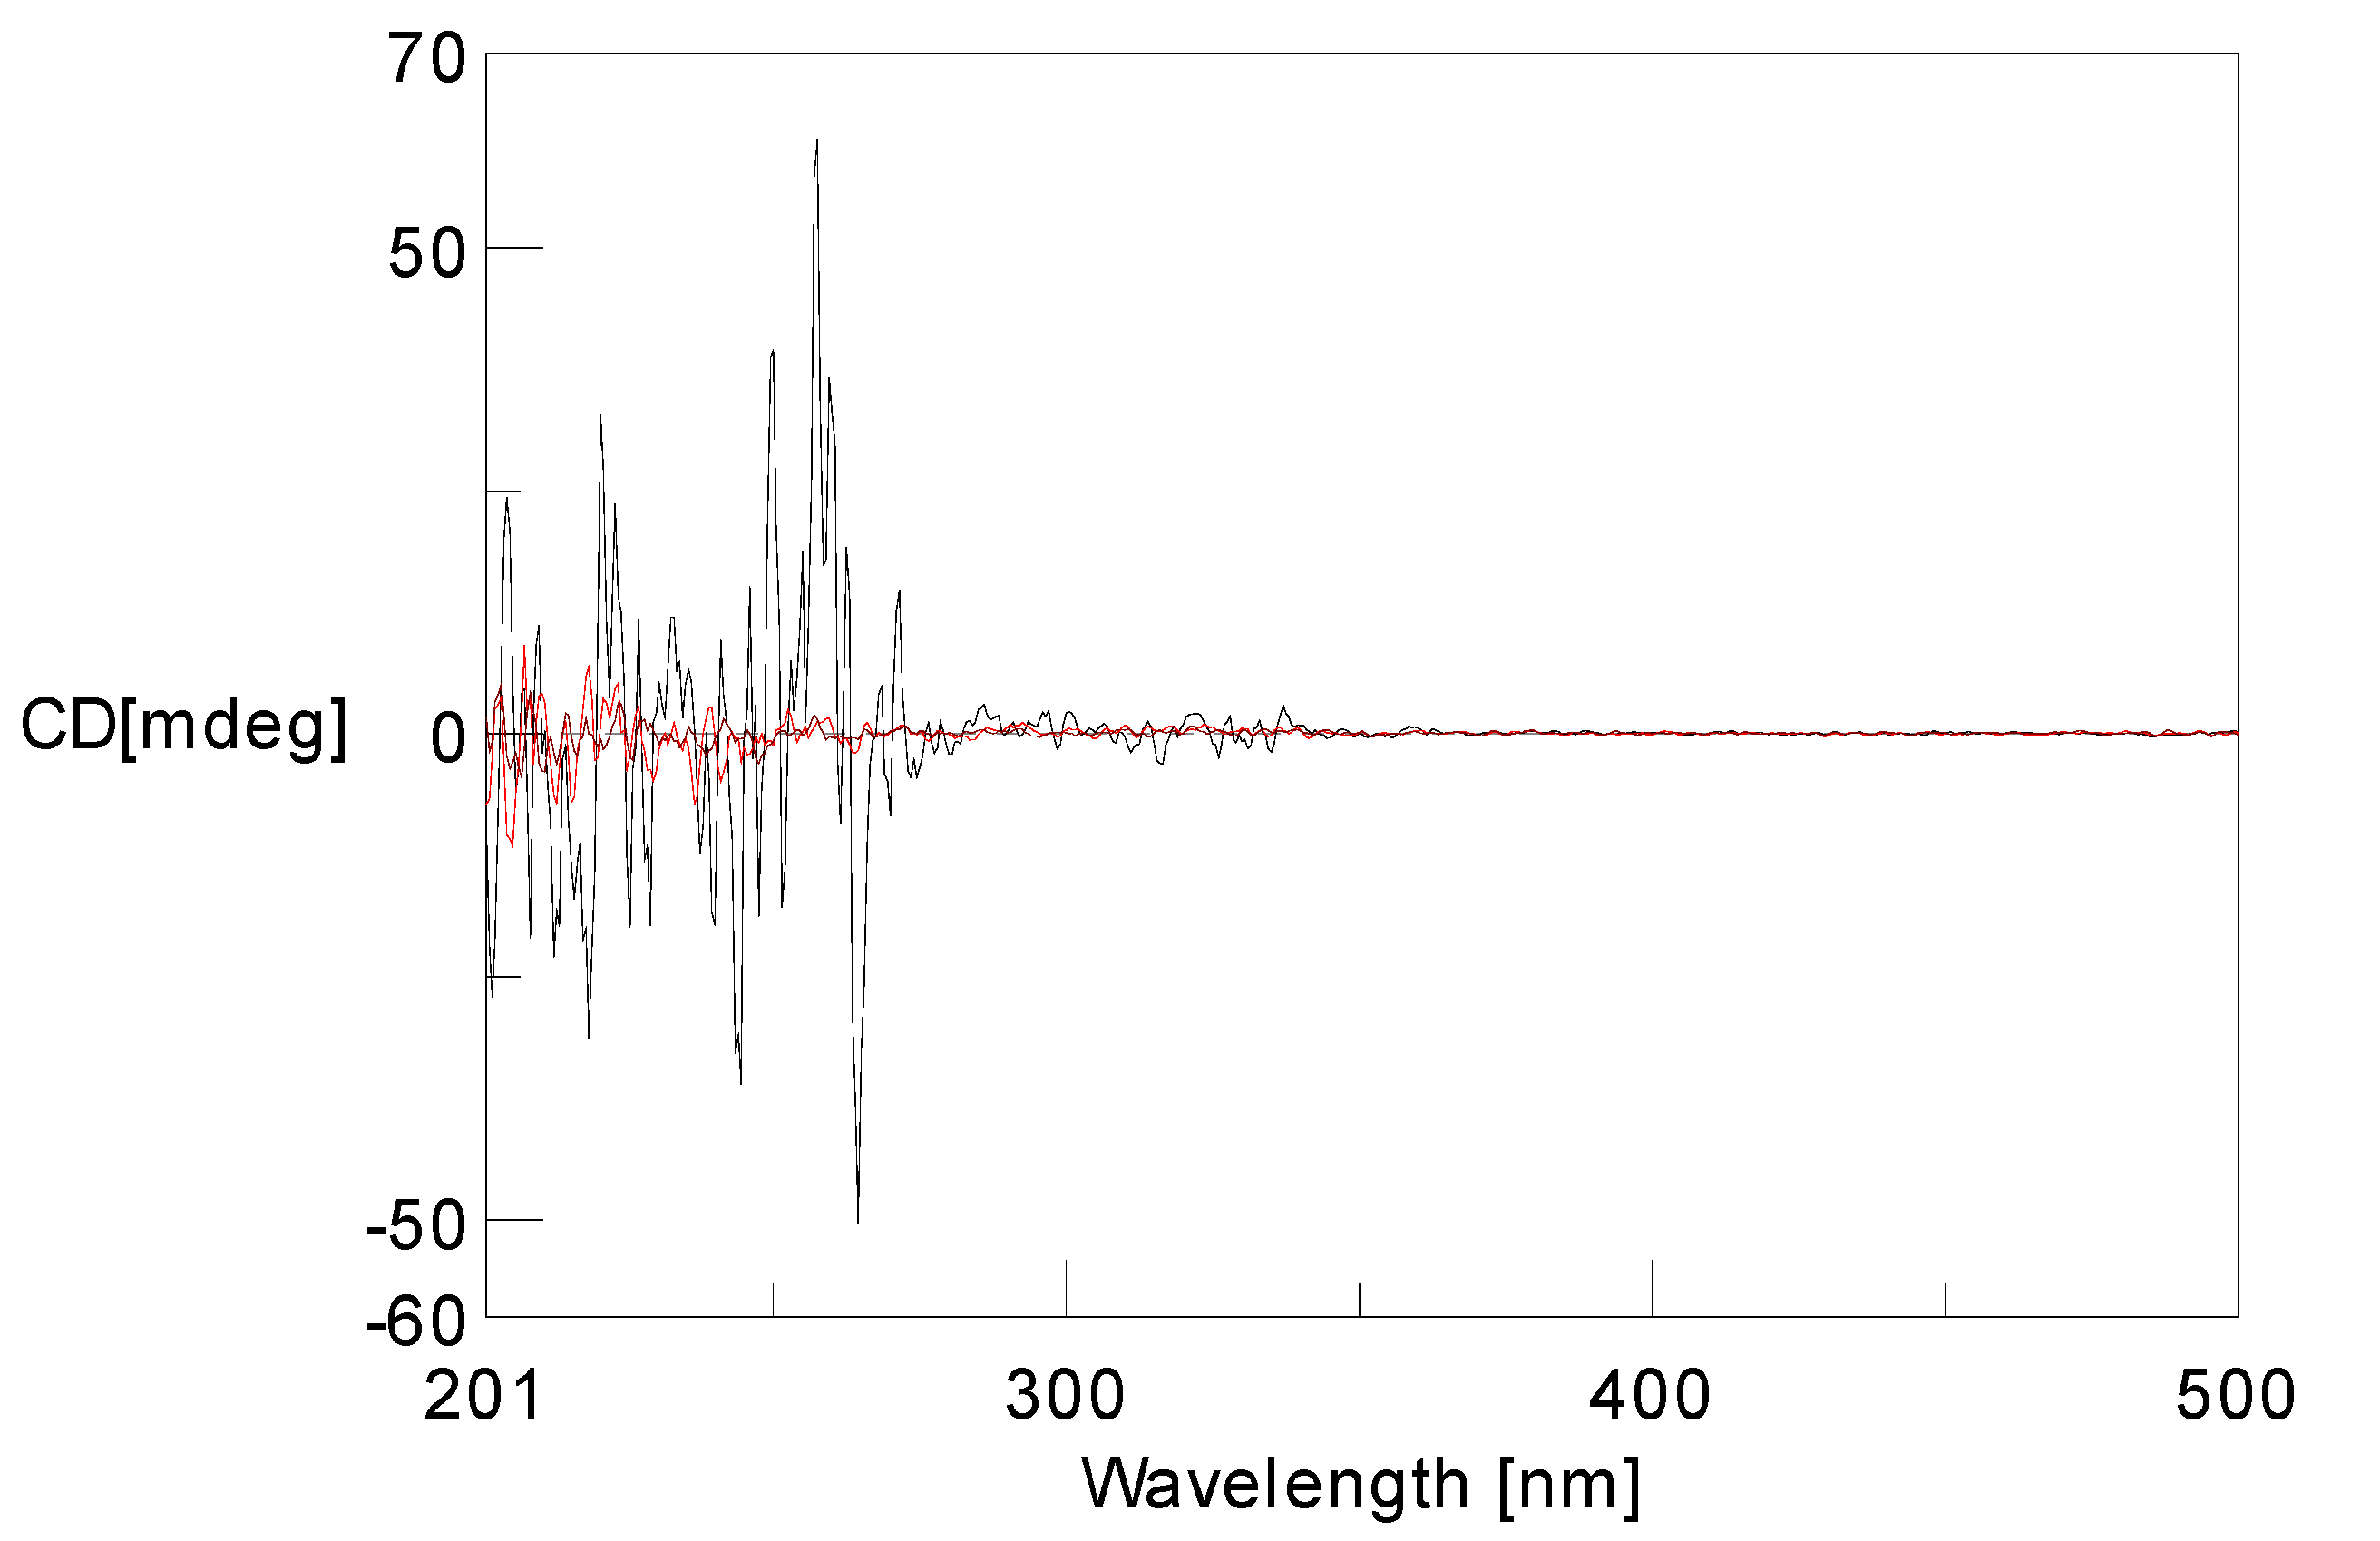
2 was characterized. The low specific optical rotation and the lack of significant Cotton effects in the ECD spectrum indicated that
2 comprised a racemic mixture (
Figure 5).
Figure 5.
Experimental ECD spectra of 2.
Figure 5.
Experimental ECD spectra of 2.
The known compounds were determined to be PI-3 (
3) [
6], PI-4 (
4) [
6] and SB236050 (
5), respectively [
7], by comparison of MS and NMR with those reported in the literature.
Chaetochromone A (
1) possesses the same 7,8-dihydroxy-3,4-dihydropyrano [4,3-
b] chromen-10 (1
H)-one core skeleton as SB236050 (
5) and chaetocyclinone A (
6), whereas
1 does not have the carboxyl group at C-7 present in its analogues (compounds
5 and
6), which is the first report of such an arrangement in its congeners. Chaetochromone B (
2) contains a similar carbon skeleton as PI-3 (
3) and PI-4 (
4) except for the absence of the 7-carboxy group. In addition, the aliphatic chain at C-3 between these compounds is also different. Zeek
et al. investigated the biosynthesis of chaetocyclinone A (
6) by feeding
13C-labelled acetate [
8]. The biosynthetic experiment revealed that chaetocyclinone A (
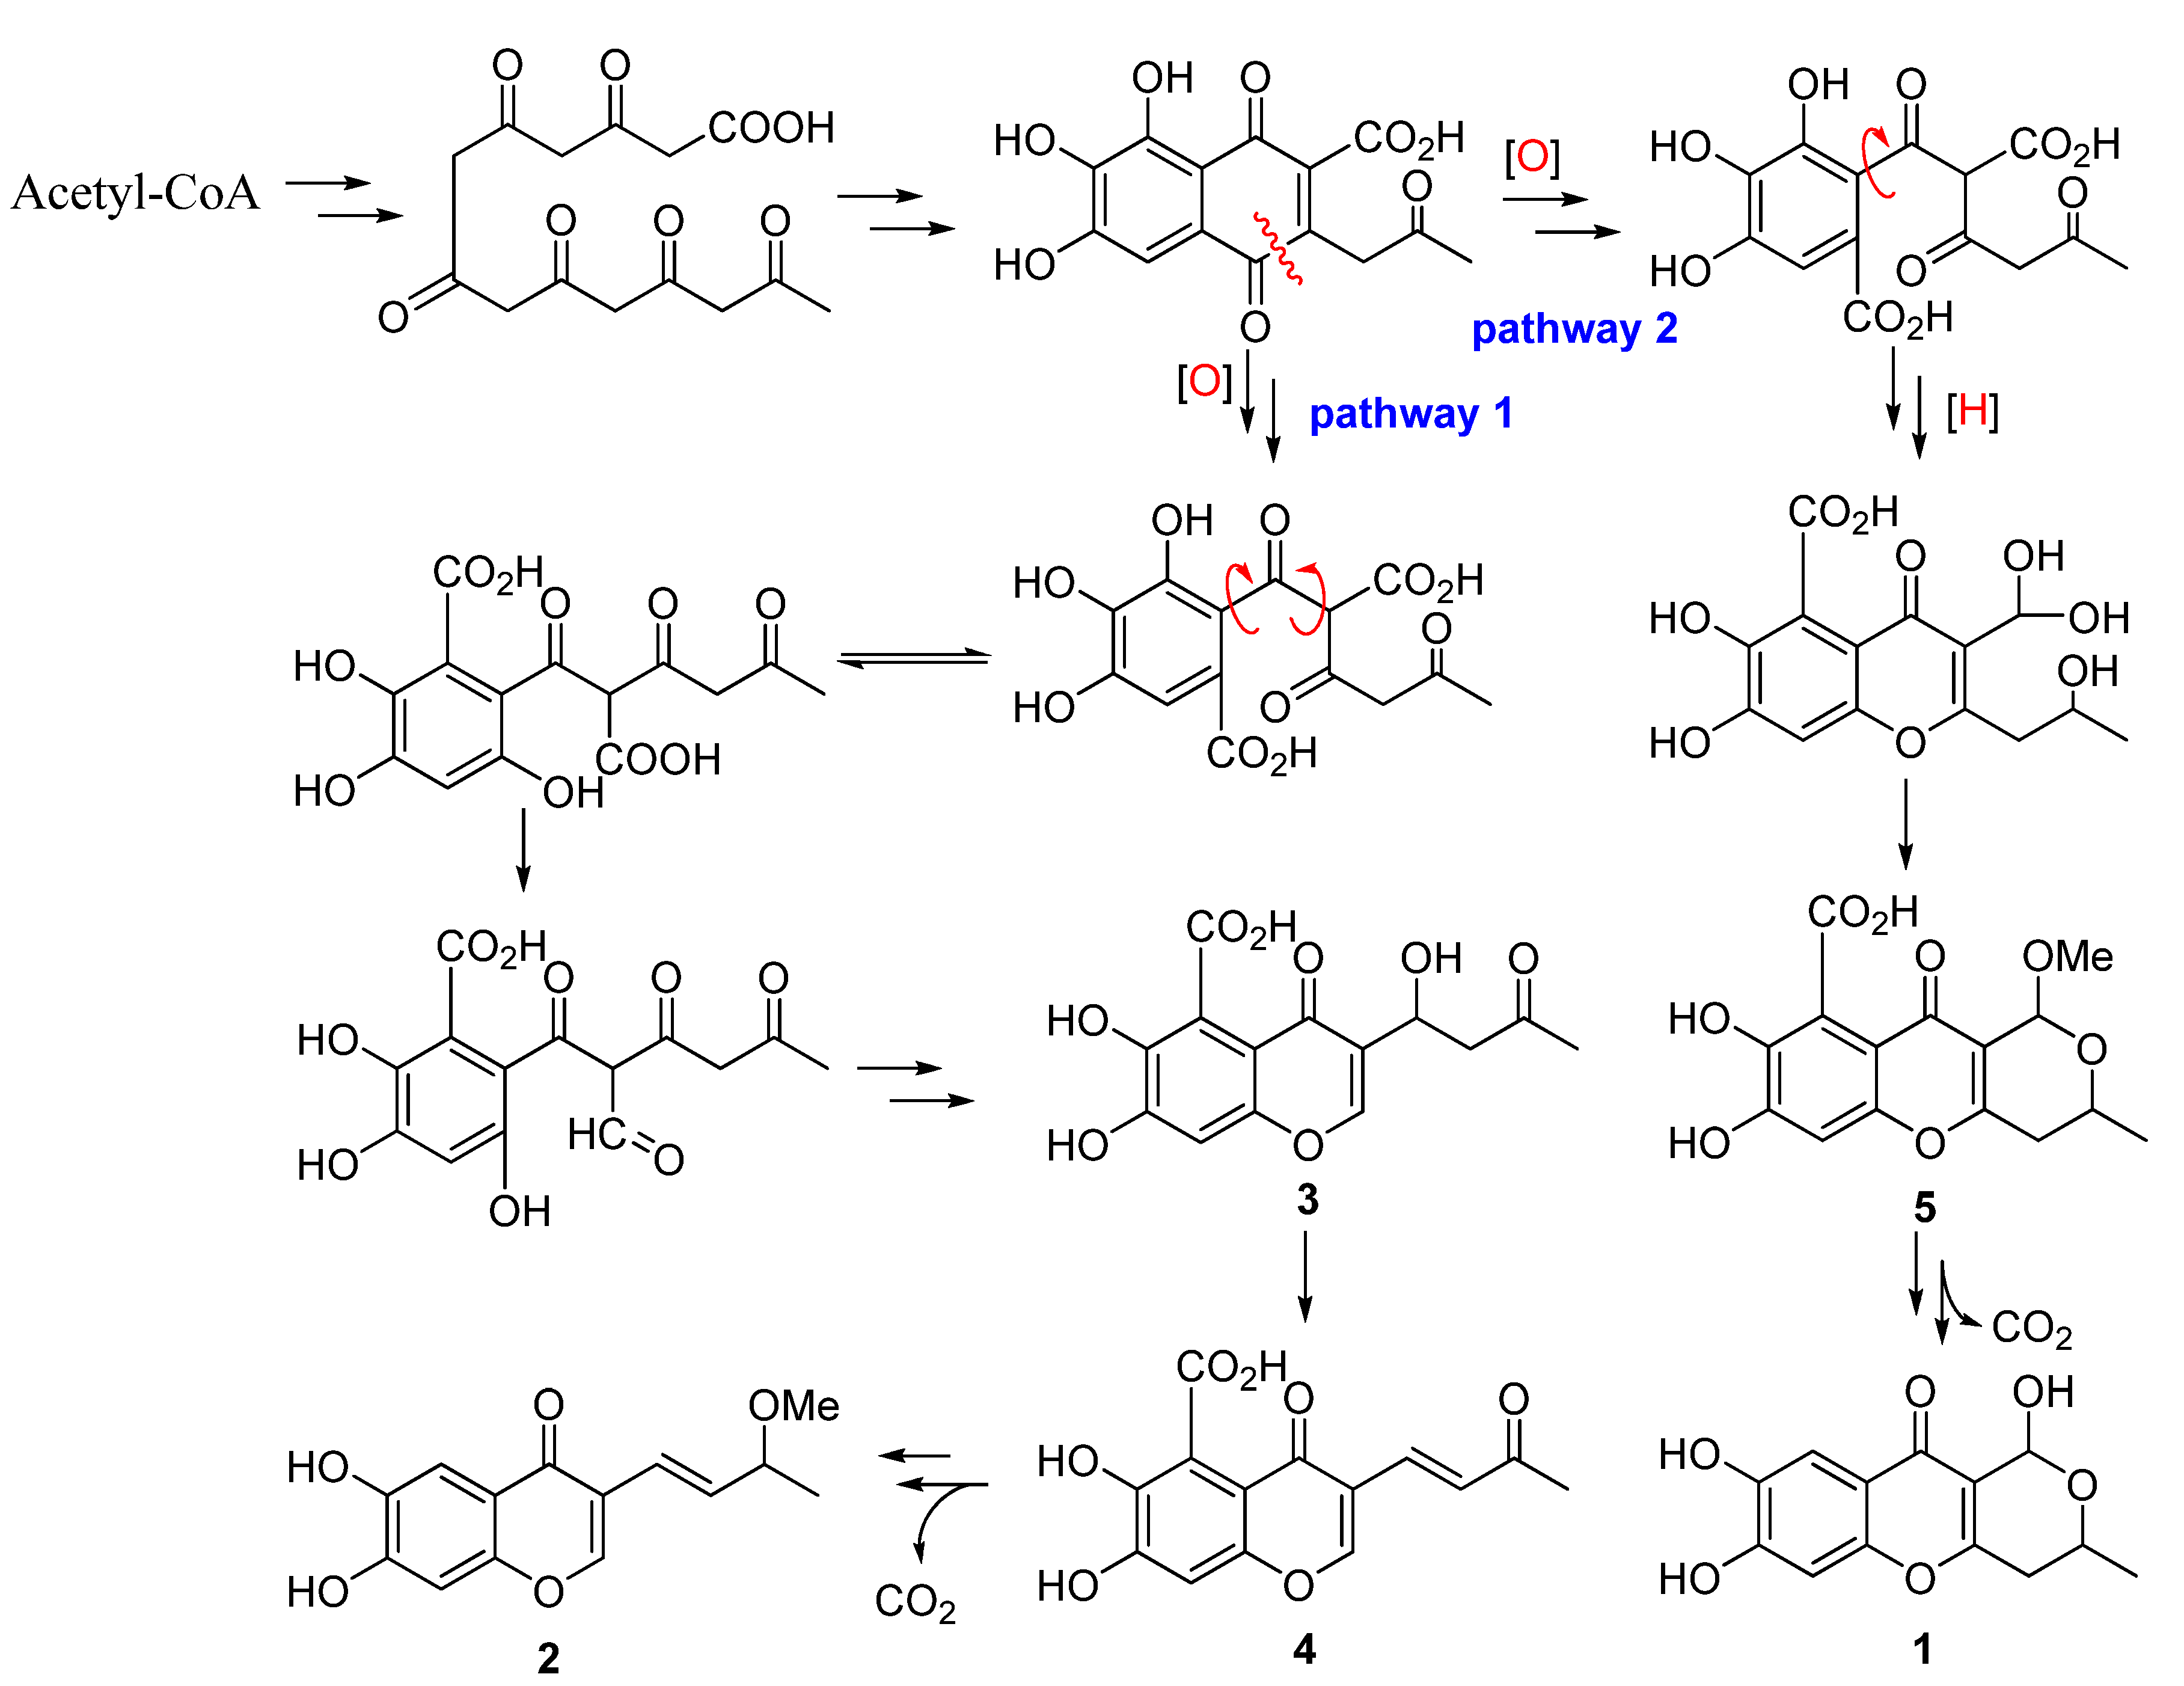
6) originated from seven labeled acetate units via condensation, reduction, oxidative ring cleavage and other reactions to form the final polyketide product. From the structural features of
2 and
5, it implies that these two compounds might have the same polyketide origin as that of chaetocyclinone A (
6) via possible biogenetic pathway 2, while compounds
1,
3, and
4 might be biosynthesized from pathway 1 to form the aliphatic chain (
Scheme 1).
Scheme 1.
Putative Biosynthetic Pathway for Compounds 1–7.
Scheme 1.
Putative Biosynthetic Pathway for Compounds 1–7.
SB238569 (
7) exhibited strong bioactivities against
Bacillus cereus II,
Pseudomonas aeruginosa IMP-1, and
Bacteroides fragilis CfiA metallo-β-lactamses, with K
i values of 79, 17, and 3.4 μM, whereas compound
5 did not display any bioactivities [
7]. The only difference between
5 and
7 is the additional double bond at C-11 and C-12, suggesting that the double bond might be the bioactive group. In addition, the presence of a double bond in
7 could change the planar structure of ring C, which might influence the orientation of the C-9 and C-11 substituents leading to the different observed bioactivities between compounds
5 and
7.
There is not report of bioactivity about compounds
3 and
4. Compounds
1–
5 were evaluated the biological activities against eight pathogens including
Alternaria alternata,
Ilyonectria radicicola,
Trichoderma viride pers,
Aspergillus niger,
Fusarium verticillioide,
Irpex lacteus (Fr.),
Poria placenta (Fr.) Cooke, and
Coriolus versicolor (L.) Quél (
Table 2). Compound
1 displayed moderate inhibitory activity (>60%) against
Poria placenta (Fr.) Cooke.
Poria placenta (Fr.)
Cooke, as one of the important brown rot fungi, rapidly depolymerizes the cellulose in wood without significant lignin removal, which will lead to the destructive decay of wood in buildings and other structures [
9]. Our results implied that this fungus might be a potential bio-control agent in wood protection against the brown rot fungi
Poria placenta (Fr.)
Cooke. In addition, compounds
1–
5 was evaluated for cytotoxic activities against three cancer cell lines, including A549, MDA-MB-231, PANC-1 with no strong bioactivities (>40 μm).
Table 2.
Cell growth inhibitory rate (%) of several plant pathogenic fungi evaluated by compounds 1–5 at 200 μg/mL.
Table 2.
Cell growth inhibitory rate (%) of several plant pathogenic fungi evaluated by compounds 1–5 at 200 μg/mL.
| Pathogens | 1 | 2 | 3 | 4 | 5 |
|---|
| A. alternata | 41.40 | 45.60 | 47.54 | 51.07 | 20.61 |
| I.radicicola | 31.38 | 33.92 | 57.31 | 5.75 | 45.32 |
| T. viride pers | 38.27 | 36.87 | 55.41 | 49.70 | 48.28 |
| A. niger | – | – | 59.95 | – | – |
| F. verticillioide | 23.31 | 7.10 | 19.44 | 33.77 | 31.98 |
| I. lacteus (Fr.) | – | 11.76 | 19.61 | 22.29 | 42.17 |
| P. placenta (Fr.) Cooke | 63.70 | 20.94 | 49.48 | 23.97 | 20.52 |
| C. versicolor (L.) Quél | 14.23 | 8.32 | 22.88 | 15.72 | 21.80 |


