Response Surface Optimized Extraction of 1-Deoxynojirimycin from Mulberry Leaves (Morus alba L.) and Preparative Separation with Resins

Abstract
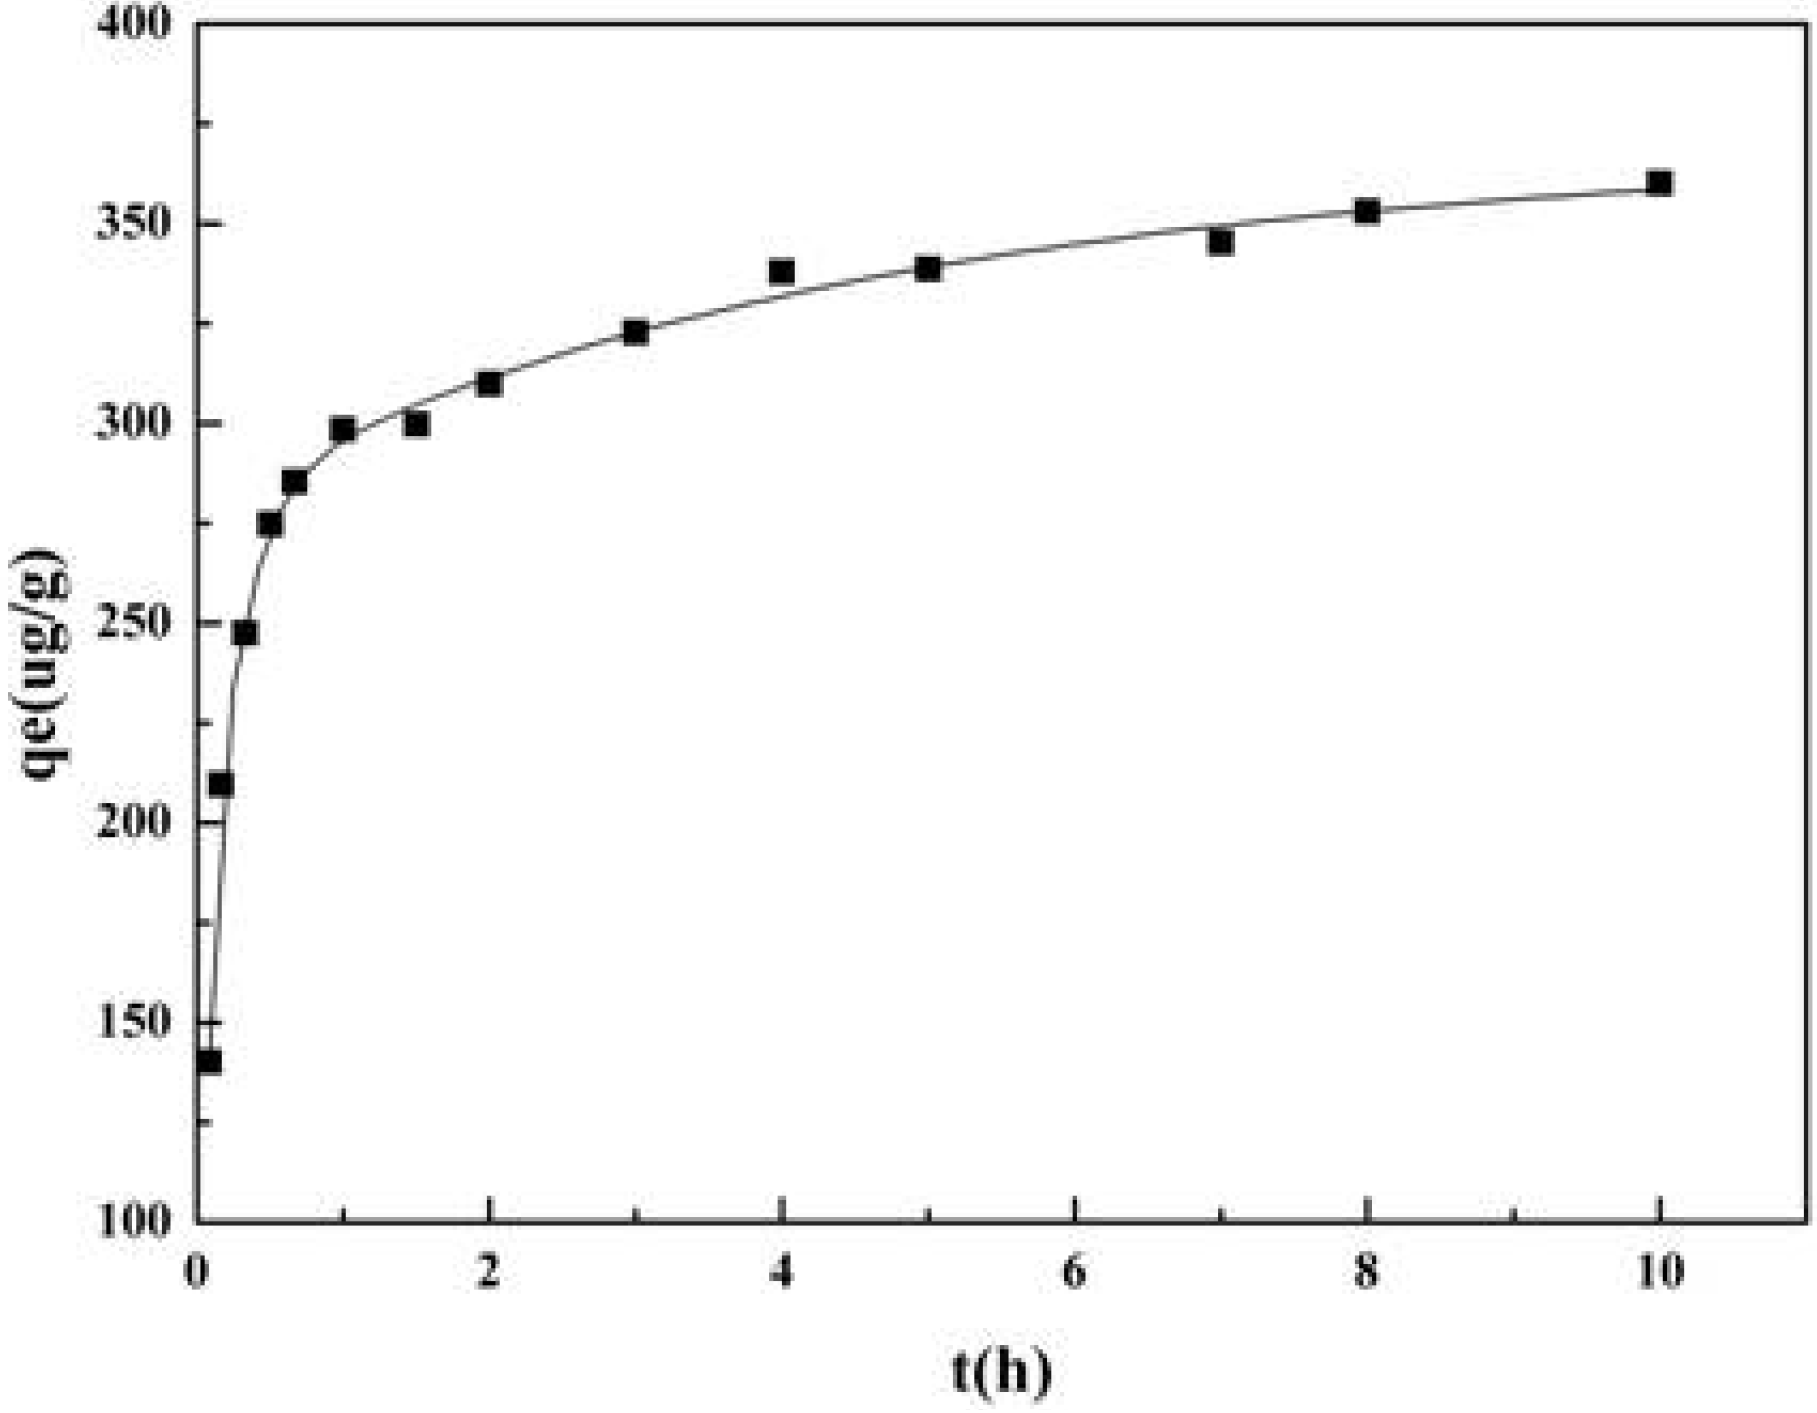
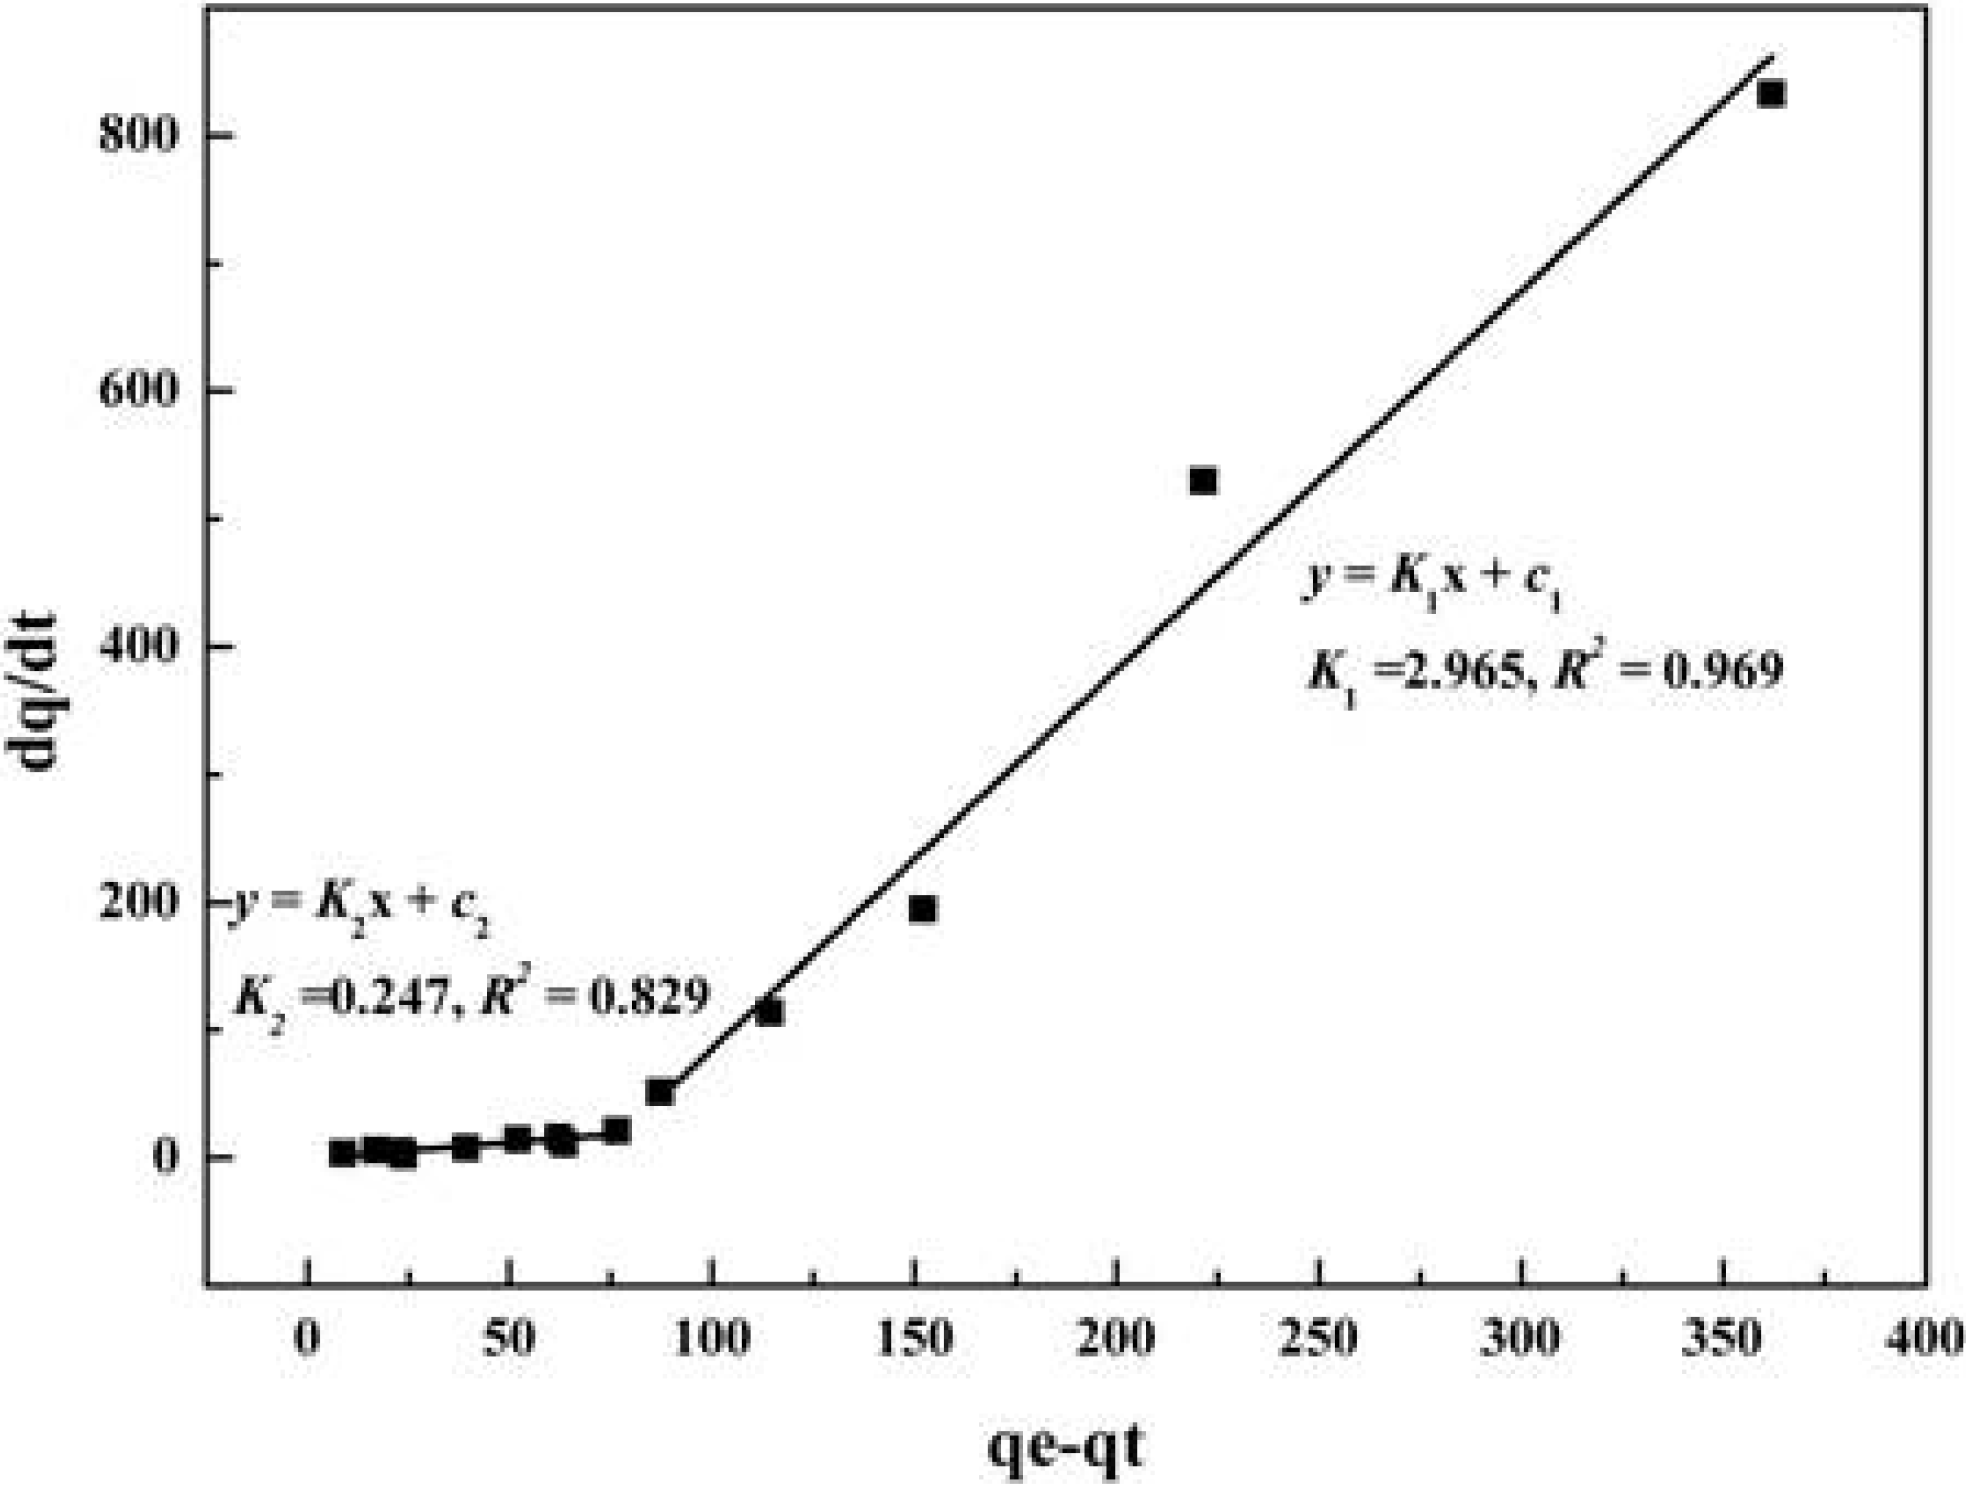
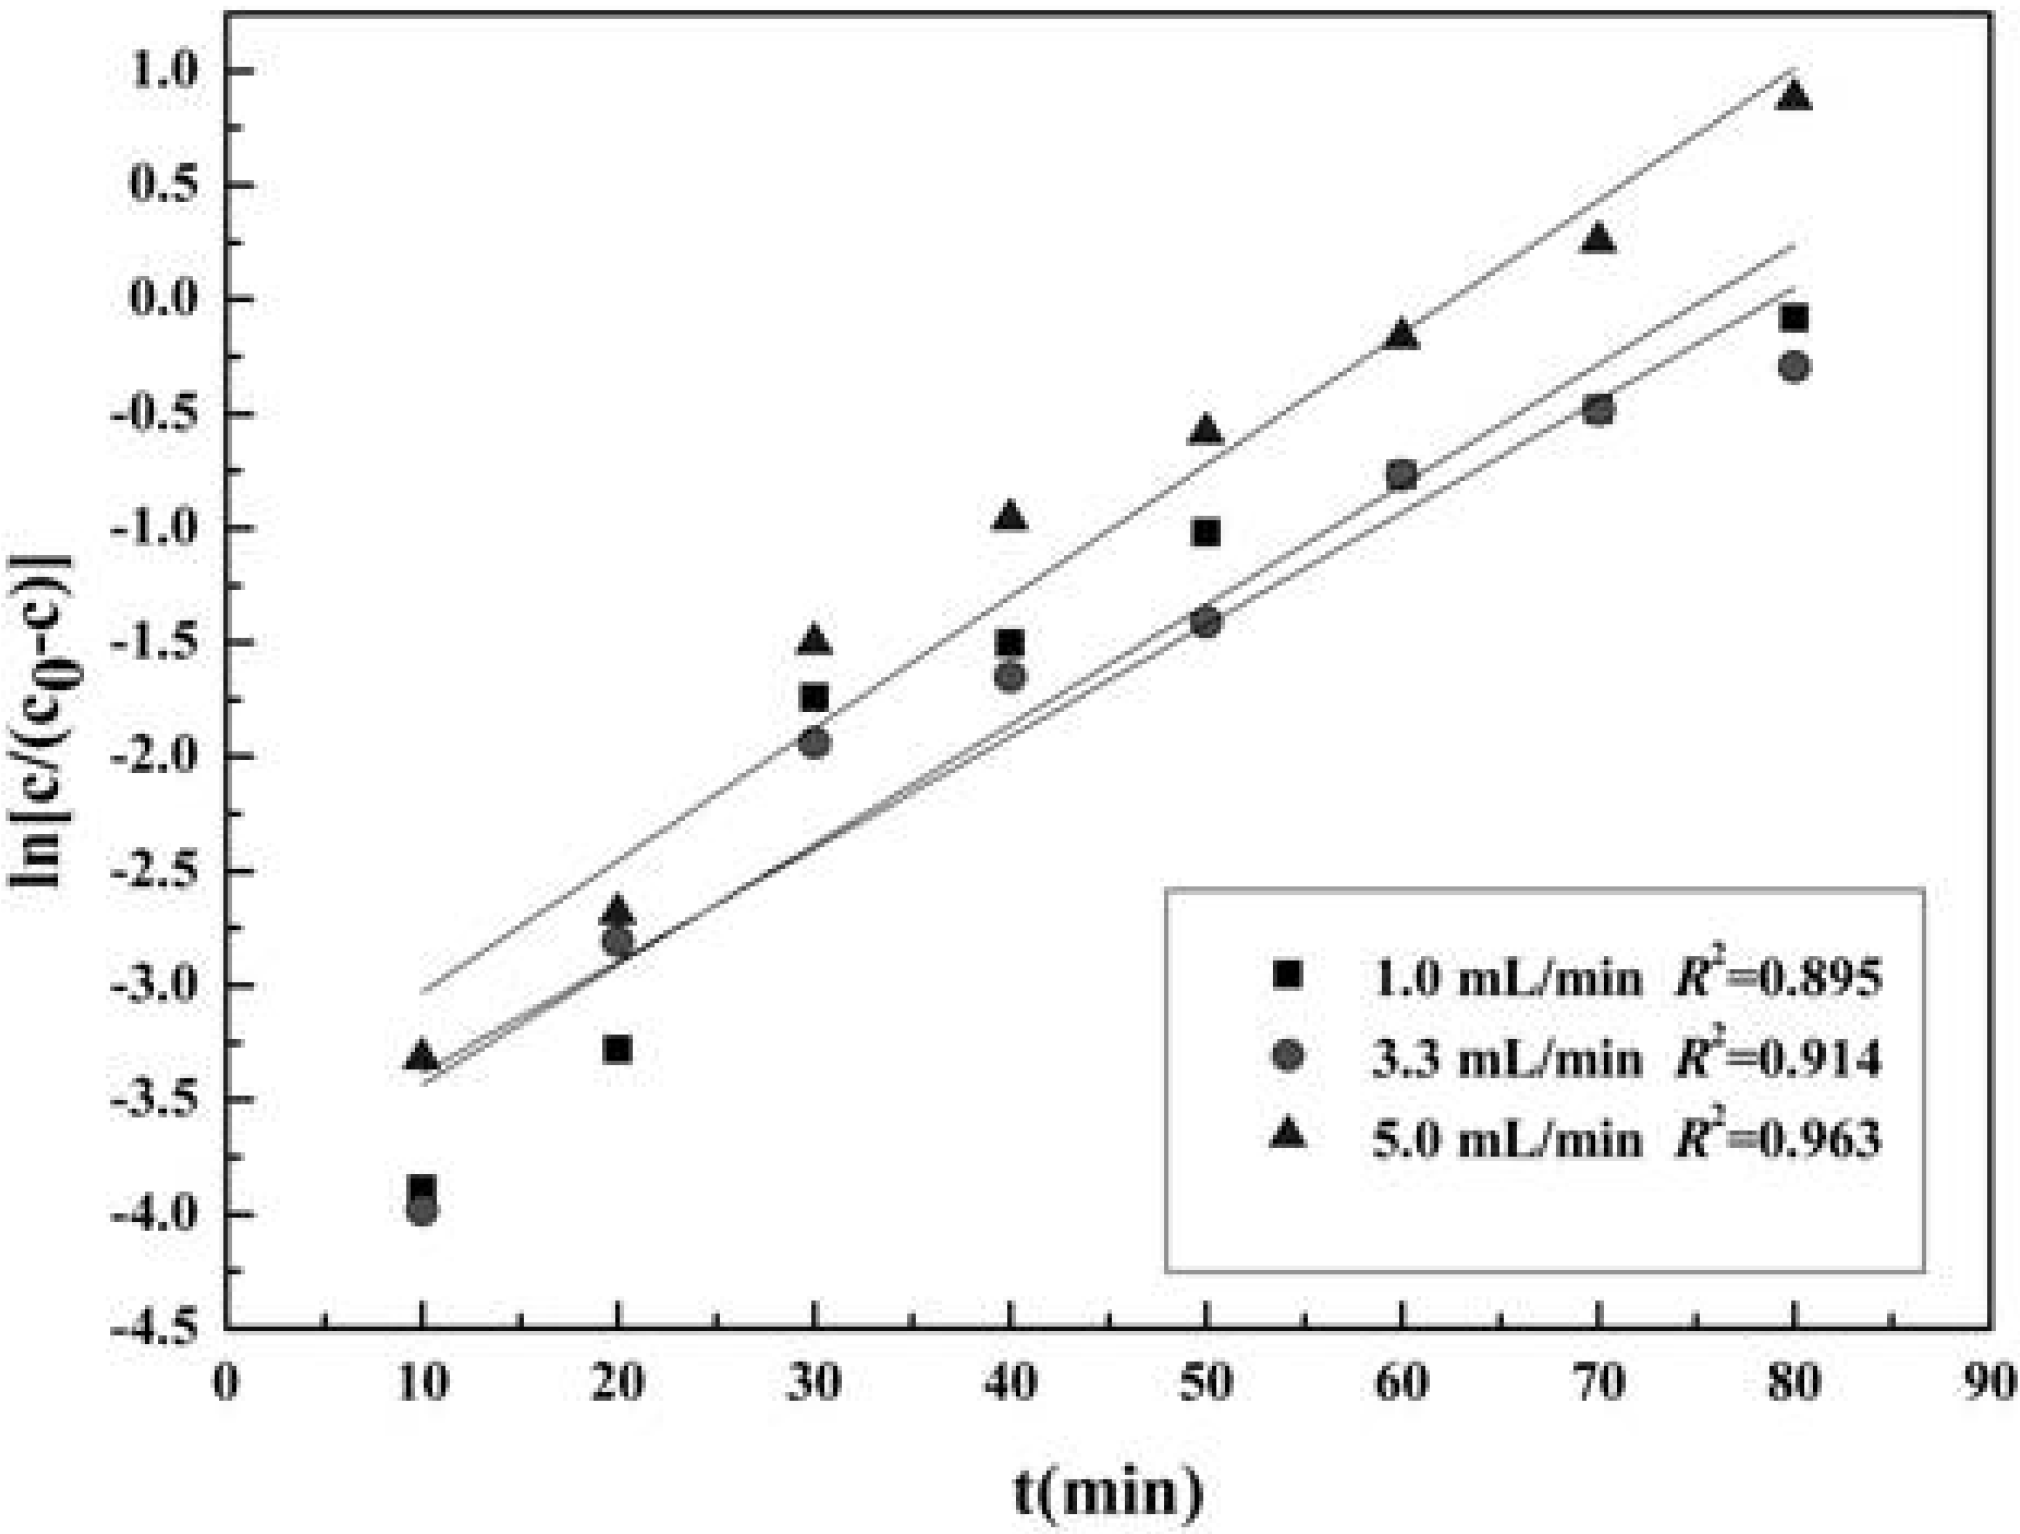
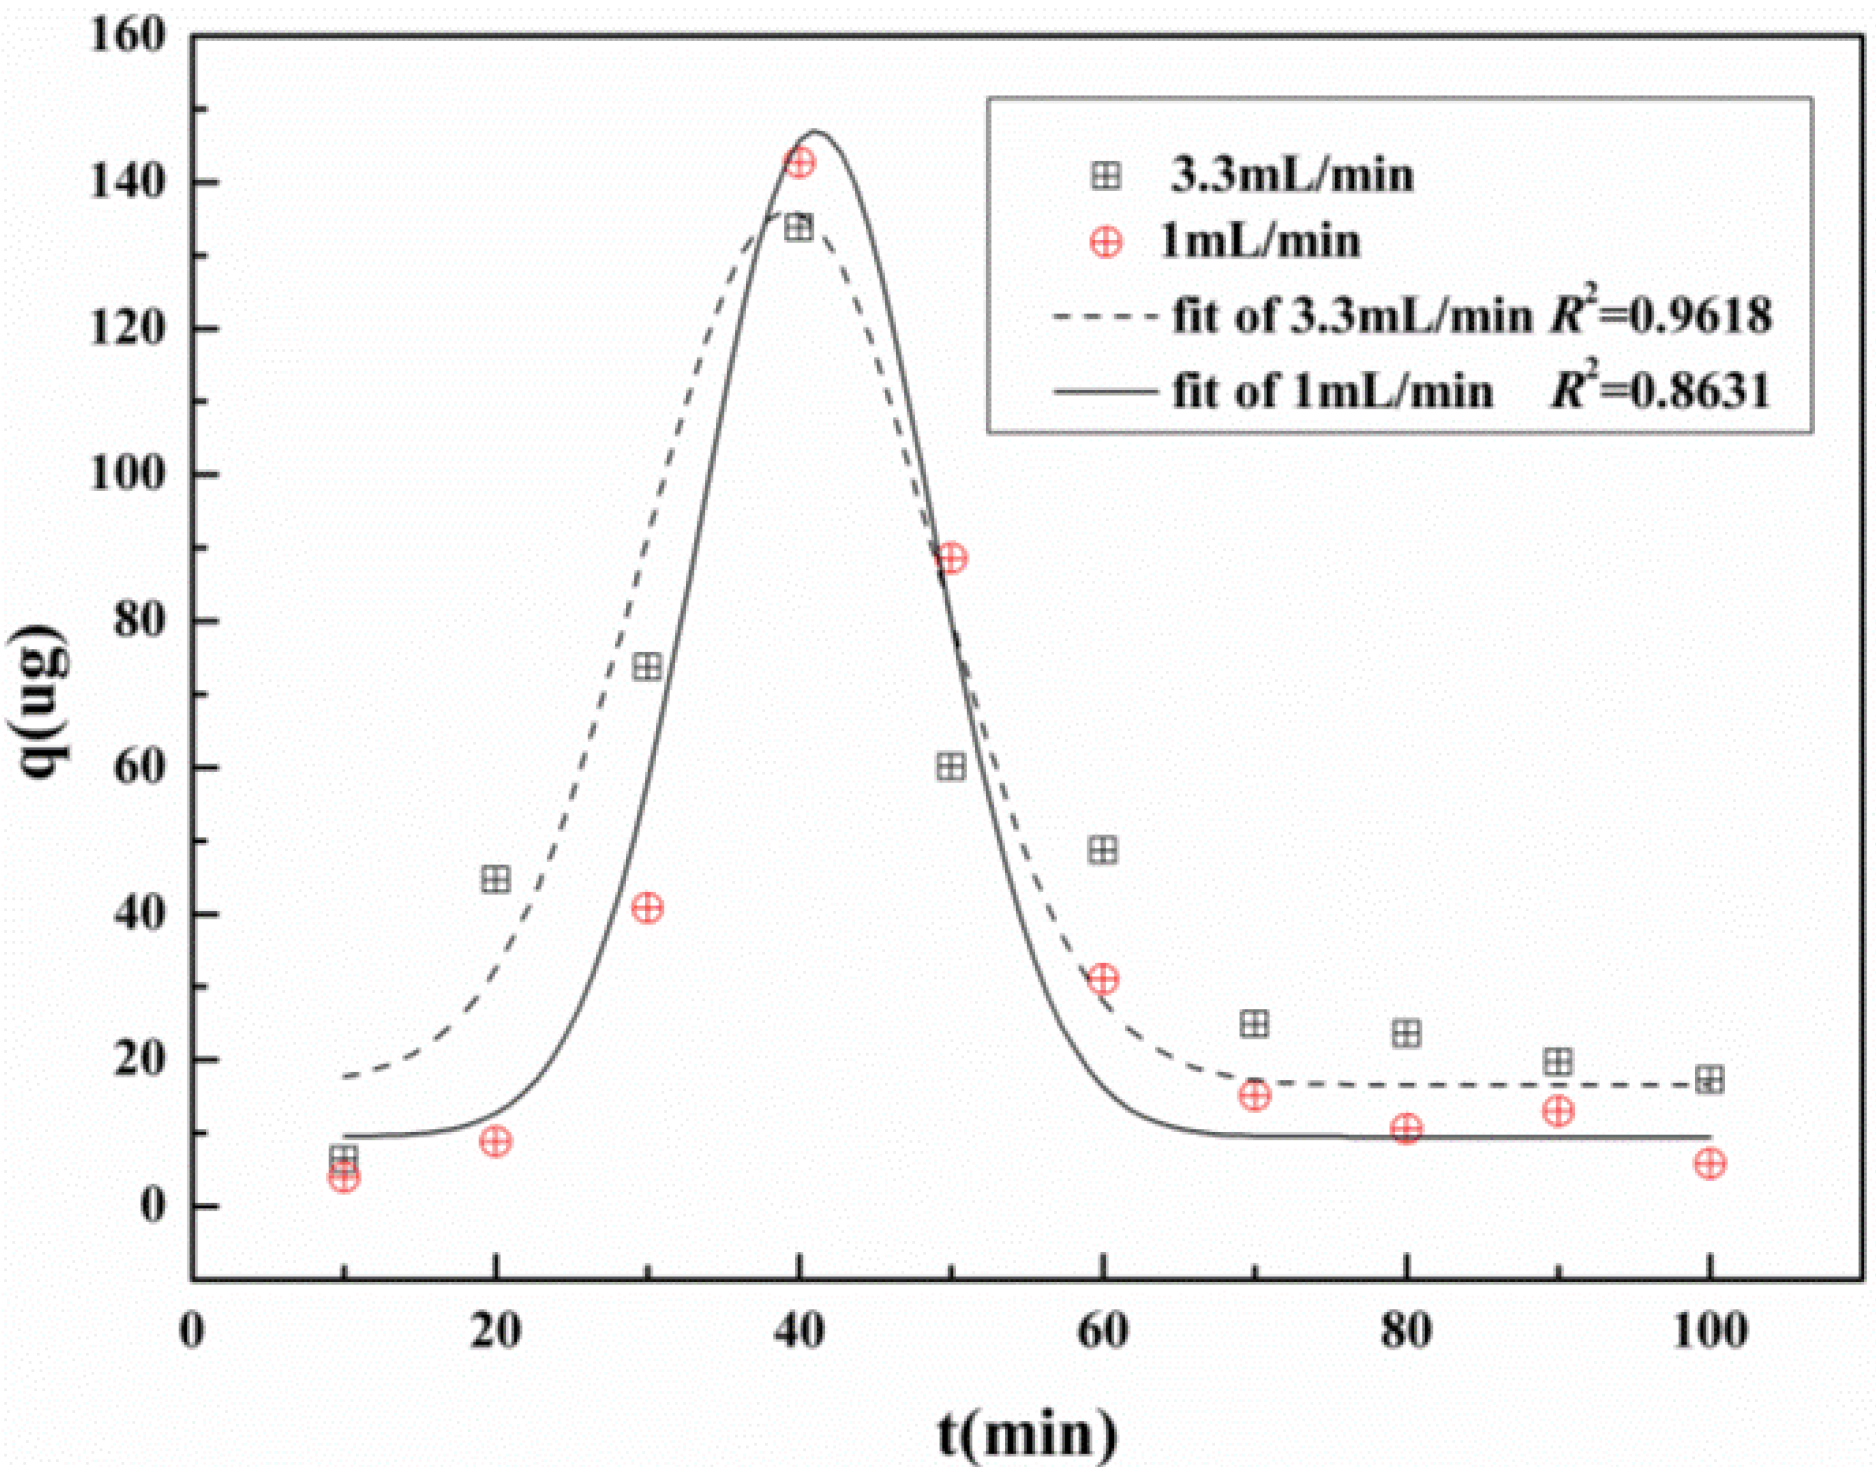
:
1. Introduction
2. Results and Discussion
2.1. Optimization of Extraction Parameters of 1-DNJ
2.1.1. Fitting the Response Surface Model

| Number | X1 | X2 | X3 | X4 | Y (mg/100g dry powder) |
|---|---|---|---|---|---|
| 1 | 0 | 0 | −1 | −1 | 224 |
| 2 | 0 | 0 | −1 | 1 | 240.8 |
| 3 | 0 | −1 | 0 | −1 | 174.8 |
| 4 | 0 | 0 | 1 | −1 | 248.8 |
| 5 | 0 | 1 | 1 | 0 | 160.4 |
| 6 | 1 | 1 | 0 | 0 | 125.2 |
| 7 | −1 | −1 | 0 | 0 | 105.2 |
| 8 | −1 | 1 | 0 | 0 | 154 |
| 9 | 0 | 0 | 0 | 0 | 249.2 |
| 10 | 1 | 0 | 0 | 1 | 110.8 |
| 11 | 1 | 0 | 1 | 0 | 175.2 |
| 12 | 0 | 0 | 0 | 0 | 244.4 |
| 13 | 0 | 0 | 0 | 0 | 246 |
| 14 | −1 | 0 | 0 | 1 | 250.8 |
| 15 | 1 | 0 | 0 | −1 | 149.2 |
| 16 | 0 | 1 | 0 | −1 | 128.8 |
| 17 | 0 | 1 | −1 | 0 | 127.2 |
| 18 | −1 | 0 | 0 | −1 | 114.8 |
| 19 | 1 | −1 | 0 | 0 | 168.8 |
| 20 | 0 | 0 | 0 | 0 | 245.6 |
| 21 | −1 | 0 | −1 | 0 | 172.8 |
| 22 | 0 | 1 | 0 | 1 | 164.4 |
| 23 | 1 | 0 | −1 | 0 | 114.4 |
| 24 | 0 | −1 | −1 | 0 | 212.8 |
| 25 | 0 | 0 | 1 | 1 | 246.4 |
| 26 | −1 | 0 | 1 | 0 | 104.4 |
| 27 | 0 | −1 | 1 | 0 | 158.8 |
| 28 | 0 | −1 | 0 | 1 | 148.8 |
| 29 | 0 | 0 | 0 | 0 | 249.2 |

| Source | DF | Sum of Square | Mean Square | F-value | p-value |
|---|---|---|---|---|---|
| Model | 14 | 67,638.64 | 4831.33 | 5.3781 | 0.0017 |
| X1 | 1 | 284.21 | 284.21 | 0.3163 | 0.5827 |
| X2 | 1 | 993.72 | 993.72 | 1.1061 | 0.3107 |
| X3 | 1 | 0.33 | 0.333 | 0.0004 | 0.9849 |
| X4 | 1 | 1232.21 | 1232.21 | 1.3716 | 0.2611 |
| X1X2 | 1 | 2134.44 | 2134.44 | 2.3760 | 0.1455 |
| X1X3 | 1 | 4173.16 | 4173.16 | 4.6455 | 0.0490 |
| X1X4 | 1 | 7603.84 | 7603.84 | 8.4645 | 0.0114 |
| X2X3 | 1 | 1900.96 | 1900.96 | 2.1161 | 0.1678 |
| X2X4 | 1 | 948.64 | 948.64 | 1.0560 | 0.3216 |
| X3X4 | 1 | 92.16 | 92.16 | 0.1026 | 0.7535 |
| X12 | 1 | 32,827.46 | 32,827.45 | 36.5431 | <0.0001 |
| X22 | 1 | 23,891.52 | 23,891.5 | 26.5957 | 0.0001 |
| X32 | 1 | 1679.27 | 1679.27 | 1.8693 | 0.1931 |
| X42 | 1 | 1278.62 | 1278.62 | 1.4233 | 0.2527 |
| Lack of Fit | - | - | 259.88 | 0.0001 | |
| Pure Error | 4 | 19.28 | 4.83 | ||
| Total | 28 | 80,215.13 |
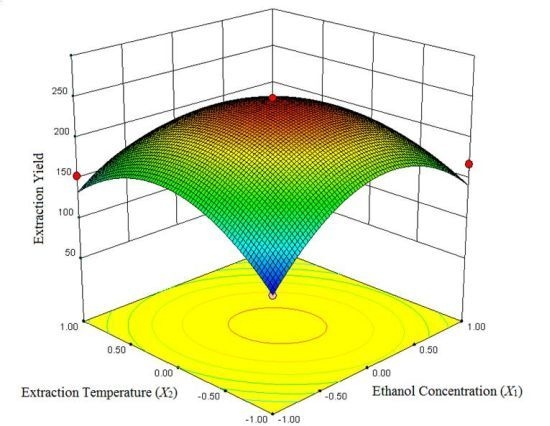
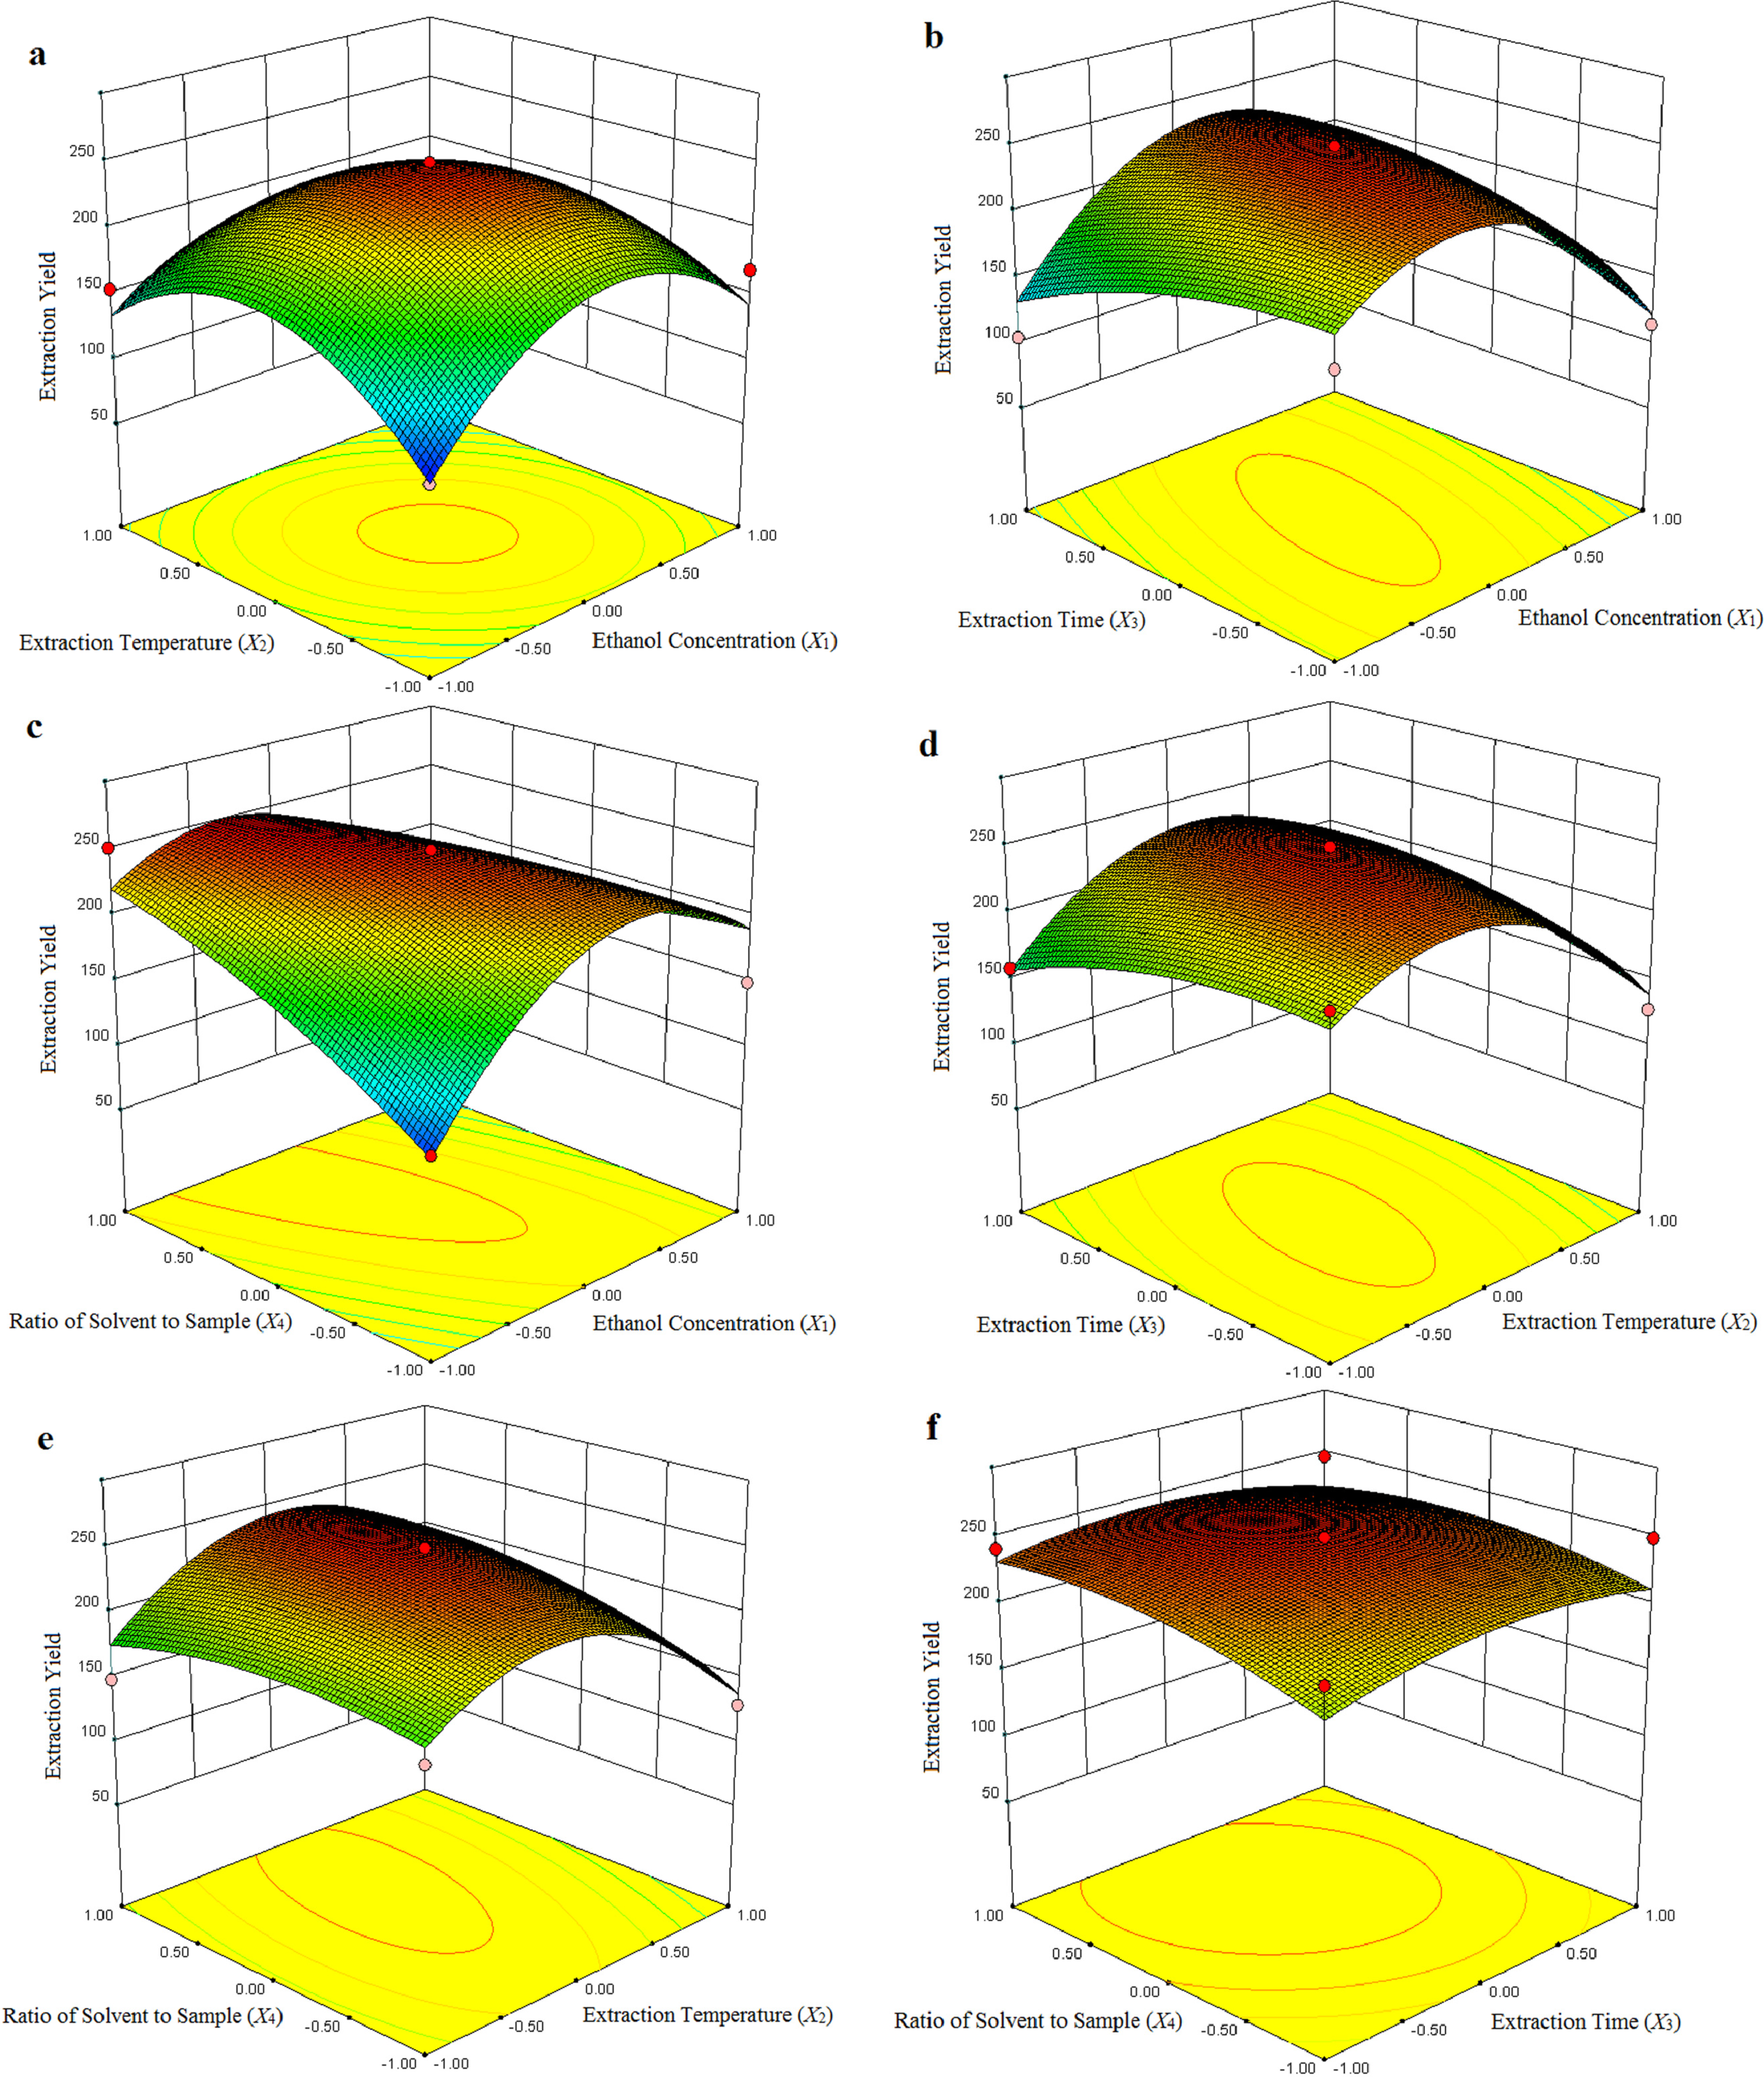
2.1.2. Analysis of the Response Surface
2.1.3. Validation of the Model Equation

| Extraction variables | Predicted yield (mg/100 g dry powder) | Experimental yield (mg/100 g dry powder) | |||
|---|---|---|---|---|---|
| X1 (%) | X2 (°C) | X3 (h) | X4 (g/mL) | 256 | 255 ± 2.54 a |
| 55 | 80 | 1.2 | 12 | ||
2.2. Static Adsorption Capacity, Adsorption Ratio, Desorption Ratio and Recovery

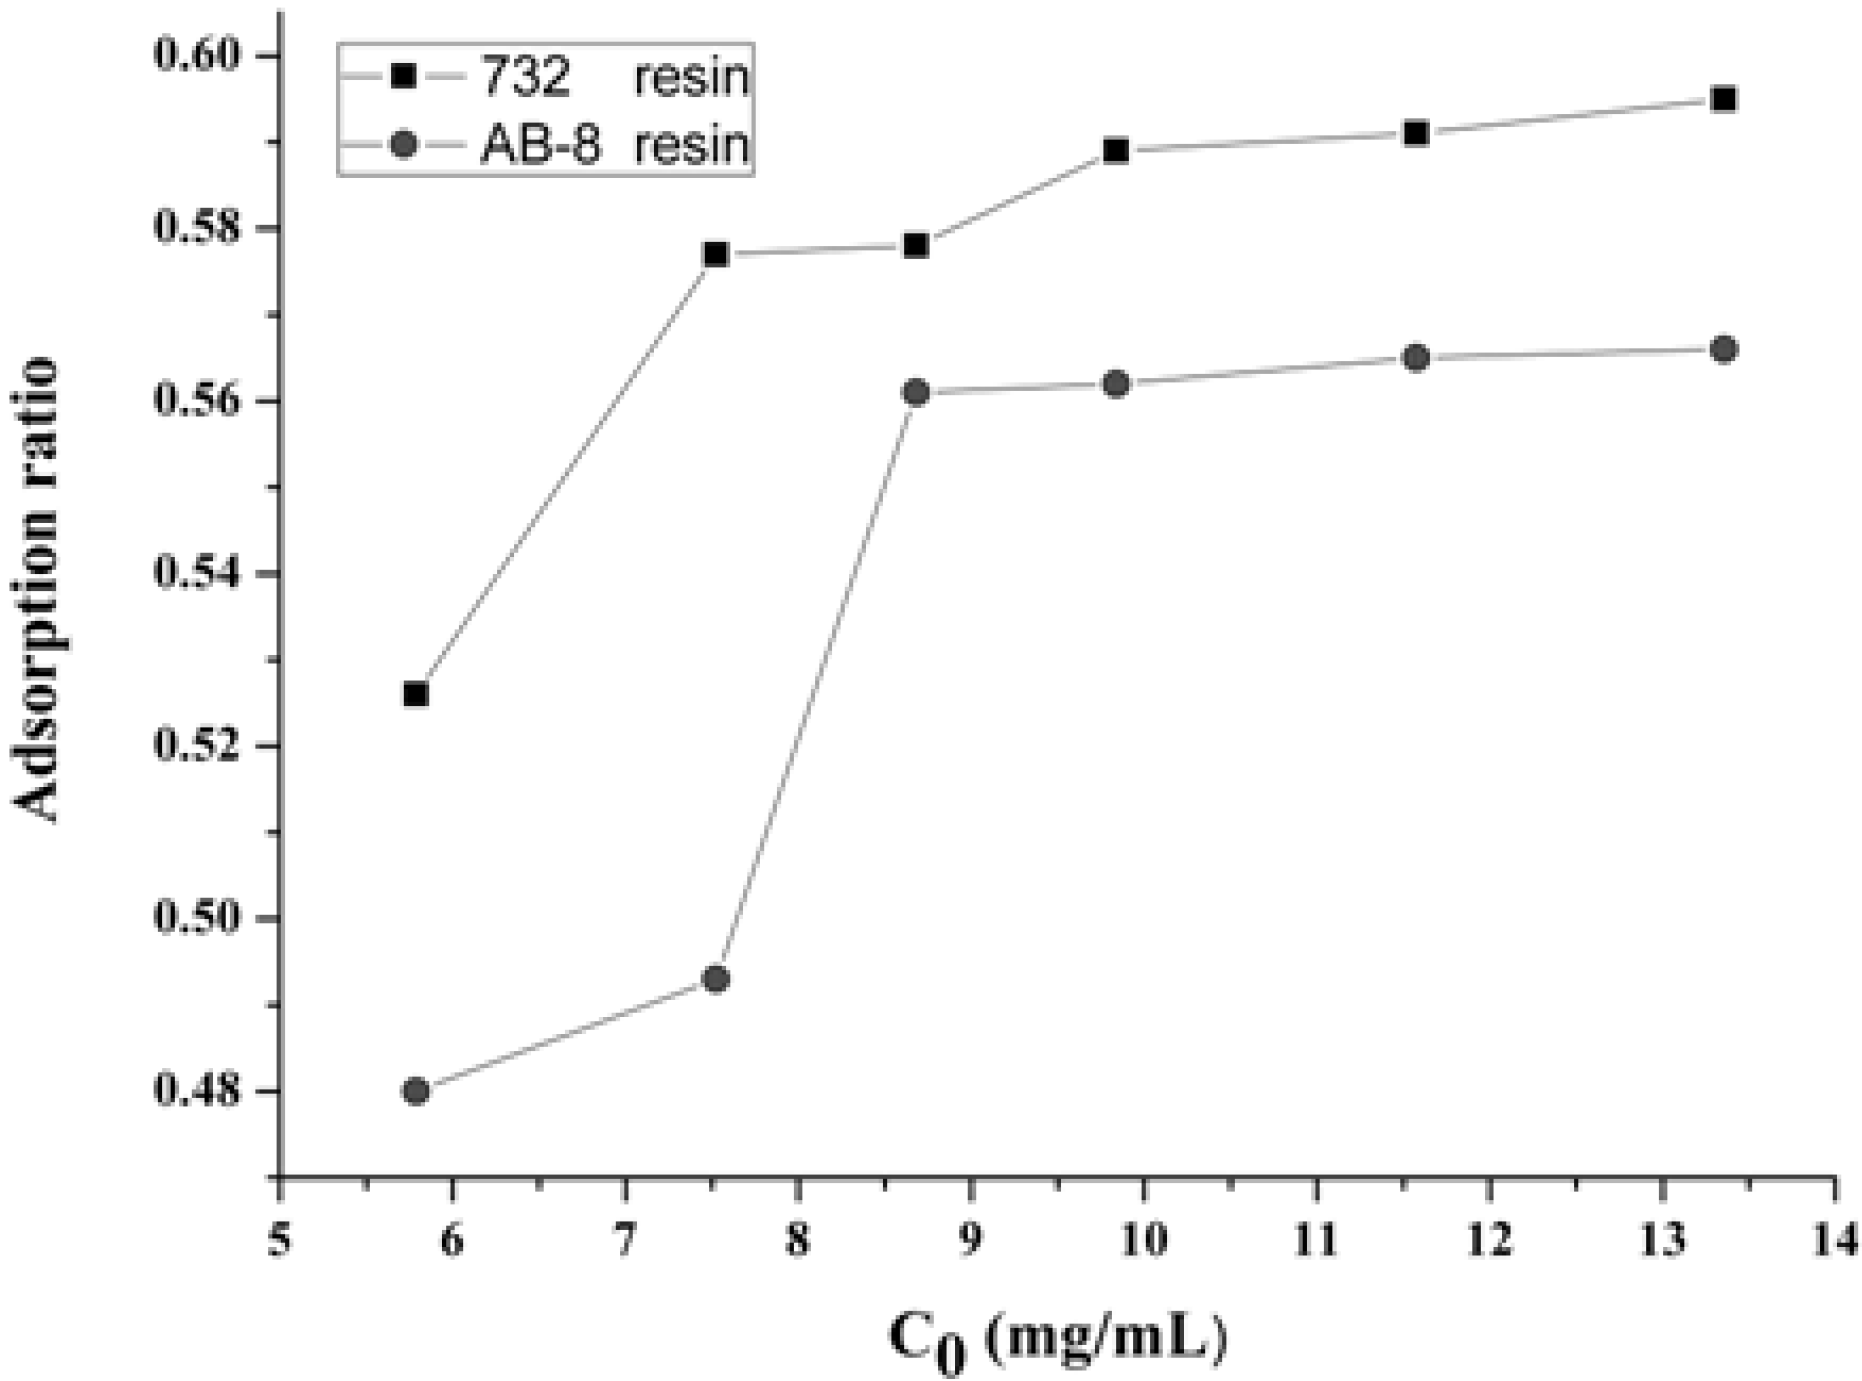
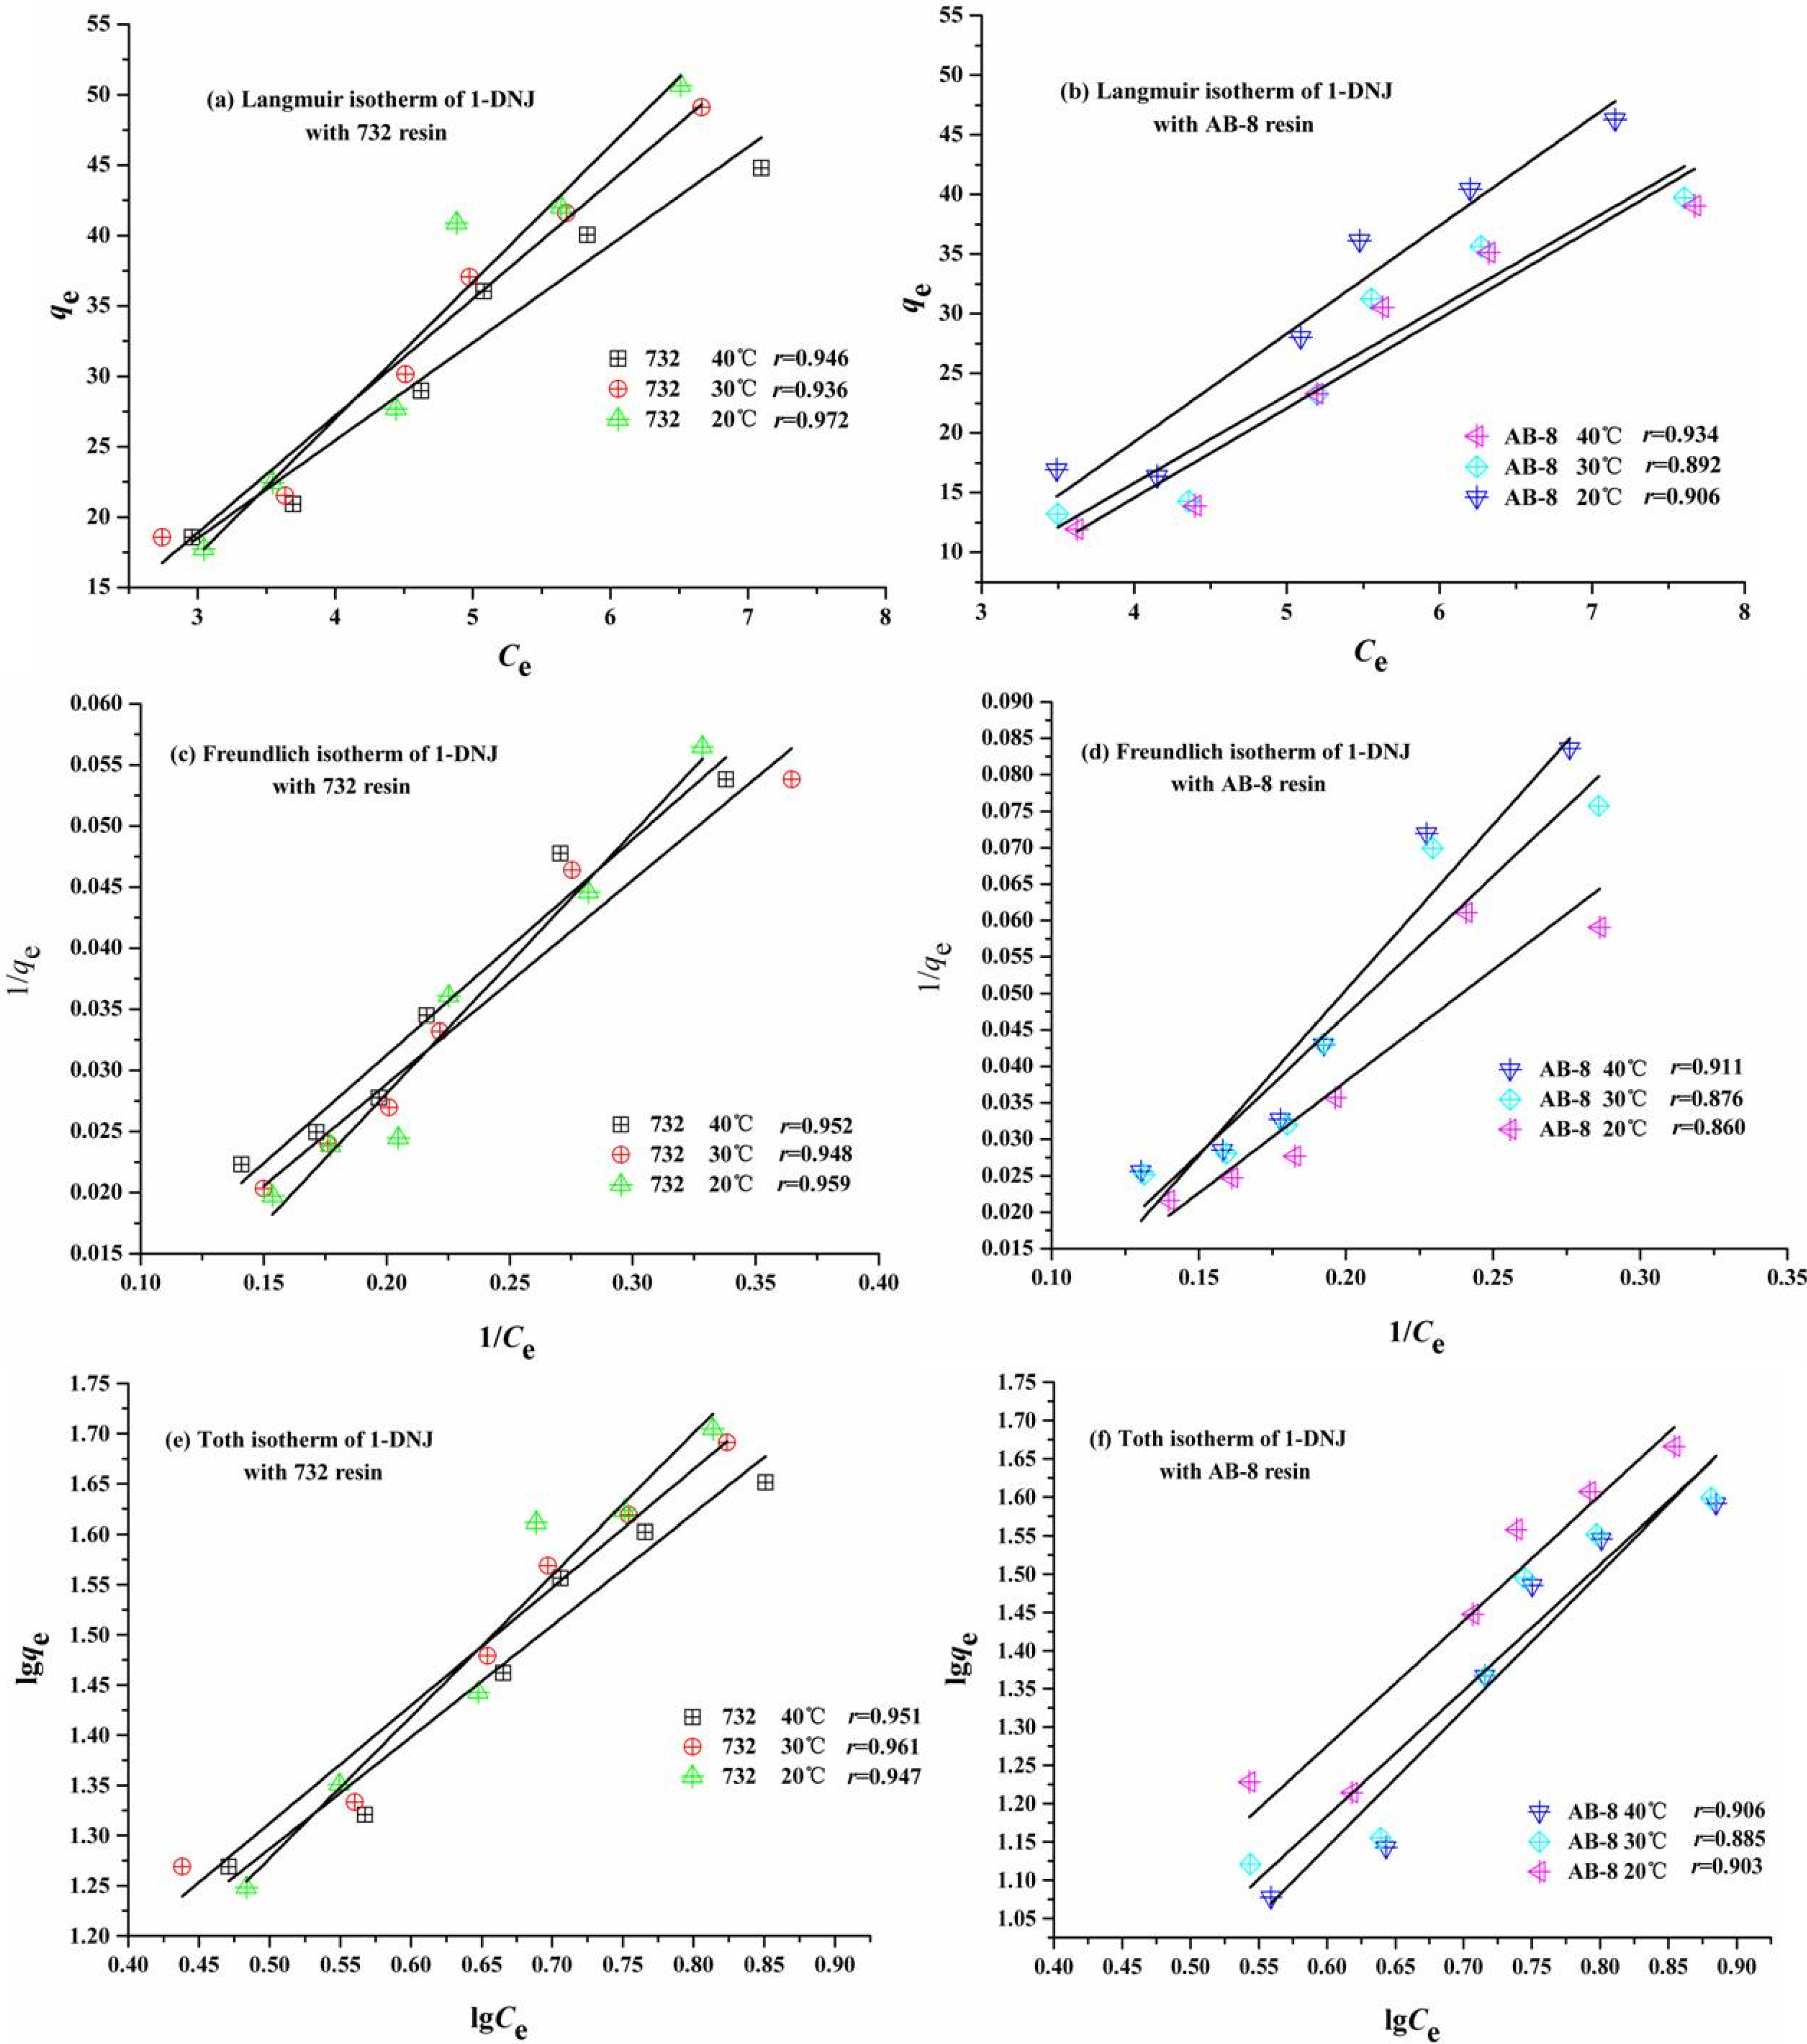
2.3. Static Adsorption Isotherms of 1-DNJ with 732 and AB-8 Resins


2.4. Static Adsorption Kinetic of 1-DNJ with 732 Resin

2.5. Dynamic Adsorption Curve of 1-DNI with 732 Resin


2.6. Dynamic Desorption Curve of 1-DNJ with 732 Resin

2.7. The Results of 1-DNJ Separation with 732 Resin
3. Experimental
3.1. Materials
3.2. The Extraction and Determination of 1-DNJ
3.2.1. The Extraction of 1-DNJ
3.2.2. Quantitative Determination of 1-DNJ
3.2.3. Experimental Designs
| Variables | Symbol | Experimental Value | ||
|---|---|---|---|---|
| Low, -1 | Zero, 0 | High, 1 | ||
| Ethanol concentration (%) | X1 | 50 | 60 | 70 |
| Extraction temperature (°C) | X2 | 70 | 80 | 90 |
| Extraction time (h) | X3 | 1 | 1.5 | 2 |
| ratio of solvent to sample (mL/g) | X4 | 8 | 10 | 12 |
3.3. Static Adsorption and Desorption Tests
3.4. Static Adsorption Equilibrium Isotherms Tests


3.5. Static Adsorption Kinetic Tests

3.6. Dynamic Adsorption and Desorption Tests
3.7. The Preparative Separation of 1-DNJ with 732 Resin under Optimal Conditions
4. Conclusions
Acknowledgments
Author Contributions
Conflicts of Interest
References
- Naowaboot, J.; Pannangpetch, P.; Kukongviriyapan, V.; Kongyingyoes, B.; Kukongviriyapan, U. Antihyperglycemic, antioxidant and antiglycationactivities of mulberry leaf extract in streptozotocin-induced chronic diabetic rats. Plant Foods Hum. Nutr. 2009, 64, 116–121. [Google Scholar] [CrossRef]
- Chon, S.U.; Kim, Y.M.; Park, Y.J.; Heo, B.G.; Park, Y.S.; Gorinstein, S. Antioxidant and antiproliferative effects of methanol extracts from raw and fermented parts of mulberry plant (Morus alba L.). Eur. Food Res. Technol. 2009, 230, 231–237. [Google Scholar] [CrossRef]
- Yoshida, Y.; Hiradate, S.; Tsukamoto, T.; Hatakeda, K.; Shirata, A. Antimicrobial activity of culture filtrate of Bacillus amyloliquefaciens RC-2 isolated from mulberry leaves. Am. Phytopath. Soc. 2001, 91, 181–187. [Google Scholar] [CrossRef]
- Kooij, R.; Branderhorst, H.M.; Bonte, S.; Wieclawska, S.; Martin, N.I.; Pieters, R.J. Glycosidase inhibition by novel guanidinium and urea iminosugar derivatives. Med. Chem. Commun. 2013, 4, 387–393. [Google Scholar] [CrossRef]
- Tsuduki, T.; Kikuchi, I.; Kimura, T.; Nakagawa, K.; Miyazawa, T. Intake of mulberry 1-deoxynojirimycin prevents diet-induced obesity through increases in adiponectin in mice. Food Chem. 2013, 139, 16–23. [Google Scholar] [CrossRef]
- Liu, J.W.; Chen, Y.; Xiong, F.L. Studies on separation and purification of total flavones from Herba with macroreticular resin. Chin. Pharm. J. 2006, 16, 1222–1224. [Google Scholar]
- Keka, S.; Papita, D.S.; Siddhartha, D. Extraction of natural dye from petals of Flame of forest (Butea monosperma) flower: Process optimization using response surface methodology (RSM). Dyes Pigm. 2012, 94, 212–216. [Google Scholar] [CrossRef]
- Lee, W.C.; Yusof, S.; Hamid, N.S.A.; Baharin, B.S. Optimizing conditions for hot water extraction of banana juice using response surface methodology (RSM). J. Food Eng. 2006, 75, 473–479. [Google Scholar] [CrossRef]
- Ahmad, A.L.; Derek, C.J.C.; Zulkali, M.M.D. Optimization of thaumatin extraction by aqueous two-phase system (ATPS) using response surface methodology (RSM). Sep. Purif. Technol. 2008, 62, 702–708. [Google Scholar] [CrossRef]
- Baş, D.; Boyacı, İ.H. Modeling and optimization I: Usability of response surface methodology. J. Food Eng. 2007, 78, 836–845. [Google Scholar] [CrossRef]
- Lai, J.X.; Xin, C.; Zhao, Y.; Feng, B.; He, C.F.; Dong, Y.M.; Fang, Y.; Wei, S.M. Optimization of Ultrasonic Assisted Extraction of Antioxidants from Black Soybean (Glycine max var) Sprouts Using Response Surface Methodology. Molecules 2013, 18, 1101–1110. [Google Scholar] [CrossRef]
- Wang, X.S.; Wu, Q.N.; Wu, Y.F.; Chen, G.Y.; Yue, W.; Liang, Q.L. Response Surface Optimized Ultrasonic-Assisted Extraction of Flavonoids from Sparganii Rhizoma and Evaluation of Their in Vitro Antioxidant Activities. Molecules 2012, 17, 6769–6783. [Google Scholar] [CrossRef]
- Zou, T.B.; Xia, E.Q.; He, T.P.; Huang, M.Y.; Jia, Q.; Li, H.W. Ultrasound-Assisted Extraction of Mangiferin from Mango (Mangifera indica L.) Leaves Using Response Surface Methodology. Molecules 2014, 19, 1411–1421. [Google Scholar] [CrossRef]
- Asano, N.; Yamashita, T.; Yasuda, K. Polyhydroxylated alkaloids isolated from mulberry trees (Morus alba L.) and silkworms (Bombyx mori L.). Agric. Food Chem. 2001, 49, 4208–4213. [Google Scholar] [CrossRef]
- Kimura, M.; Chen, F. Antihyperglycemic effects of N-containing sugars derived from mulberry leaves is streptozocin-in-duced diabetic mice. Wakan Iyakugaku Zasshi 1995, 12, 214–219. [Google Scholar]
- Dong, K. The overview of macroporous adsorptive resins in the study of Chinese herbal medicine. J. Pharm. Pract. 2006, 1, 13–16. [Google Scholar]
- Mirhosseini, H.; Tan, C.P.; Hamid, N.S.A.; Yusof, S.; Chern, B.H. Characterization of the influence of main emulsion components on the physicochemical properties of orange beverage emulsion using response surface methodology. Food Hydrocolloid. 2009, 23, 271–280. [Google Scholar] [CrossRef]
- Pericin, D.; Popovic, S. Modeling and optimization of proteolytic process: Application of response surface methodology (RSM). J. Biotechnol. 2010, 150, S304. [Google Scholar] [CrossRef]
- Liu, X.Y.; Wang, Z.Y.; Wang, L.; Elfalleh, W.; Zhang, H. Ultrasonic-assisted extraction of polysaccharides from Hohenbueheliaserotina by response surface methodology. Int. J. Biol. Macromol. 2011, 51, 1–8. [Google Scholar]
- Prakash, J.M.; Manikandanb, S.K.; Thirugnanasambandhama, C.; Vigna, N.R. Box-Behnken design based statistical modeling for ultrasound-assisted extraction of corn silk polysaccharide. Carbohyd. Polym. 2003, 92, 604–611. [Google Scholar]
- Zinatizadeh, A.A.L.; Mohamed, A.R.; Abdullah, A.Z.; Mashitah, M.D.; Isa, M.H.; Najafpour, G.D. Process modeling and analysis of palm oil mill effluent treatment in an up-flow anaerobic sludge fixed film bioreactor using response surface methodology (RSM). Water Res. 2006, 40, 3193–3208. [Google Scholar] [CrossRef]
- Fu, B.Q.; Liu, J.; Li, H.; Li, L.; Lee, F.S.C.; Wang, X.R. The application of macroporous resins in the separation of licorice flavonoids andglycyrrhizic acid. J. Chromatogr. A 2005, 1089, 18–24. [Google Scholar] [CrossRef]
- Nagaoka, H.; Imae, T. Analytical investigation of two-step adsorption kinetics on surfaces. J. Colloid Interface Sci. 2003, 264, 335–342. [Google Scholar] [CrossRef]
- Xu, R.; Cheng, N.; Huang, W.; Gao, H.; Deng, J.; Cao, W. Effects of the processing steps on parathion levels during honey production and parathion removal by macroporous adsorption resins. Food Control 2012, 23, 234–237. [Google Scholar] [CrossRef]
- Kimura, T.; Nakagawa, K.; Saito, Y.; Yamagishi, K.; Suzuki, M.; Yamaki, K.; Shinmoto, H.; Miyazawa, T. Simple and rapid determination of deoxynojirimycin in mulberry leaves. Biofactors 2004, 22, 341–345. [Google Scholar] [CrossRef]
- Kim, J.W.; Kim, S.U.; Lee, H.S.; Kim, I.; Ahn, M.Y.; Ryu, K.S. Determination of 1-deoxynojirimycin in Morus alba L. leaves by derivatization with 9-fluorenylmethyl chloroformate followed by reversed-phase high-performance liquid chromatography. J. Chromatogr. A 2003, 1002, 93–99. [Google Scholar] [CrossRef]
- Chaluntorn, V.; Kiyotaka, N.; Phumon, S. Optimization of 1-deoxynojirimycin extraction from mulberry leaves by using response surface methodology. Biosci. Biotechnol. Biochem. 2009, 73, 2684–2689. [Google Scholar] [CrossRef]
- Nakagawa, K.; Ogawa, K.; Higuchi, O.; Kimura, T.; Miyazawa, T.; Hori, M. Determination of iminosugars in mulberry leaves and silkworms using hydrophilic interaction chromatography-tandem mass spectrometry. Anal. Biochem. 2010, 404, 217–222. [Google Scholar] [CrossRef]
- Giovanni, M. Response surface methodology and product optimization. Food Technol. 1983, 37, 41–45. [Google Scholar]
- Chaluntorn, V.; Kiyotaka, N.; Phumon, S. Development of high 1-deoxynojirimycin (DNJ) content mulberry tea and use of response surface methodology to optimize tea-making conditions for highest DNJ extraction. Food Sci. Technol. 2012, 45, 226–232. [Google Scholar]
- Ren, Y.; Wei, X. Adsorption character for removal for Cu(II) by magnetic Cu(II) ion imprinted composite adsorbent. J. Hazard. Mater. 2008, 15, 14–22. [Google Scholar] [CrossRef]
- Lin, S.H.; Juang, R.S. Heavy metal removal from water by sorption using surfactant-modified montmorillonite. J. Hazard. Mater. 2002, 92, 315–326. [Google Scholar] [CrossRef]
- Feng, C.W.; Tseng, R.L.; Juang, R.S. Initial behavior of intraparticle diffusion model used in the description of adsorption kinetics. Chem. Eng. J. 2009, 153, 1–8. [Google Scholar]
- Araceli, R.; Juan, G.; Gabriel, O.; María, M. Adsorption of anionic and cationic dyes on activated carbon from aqueous solutions: Equilibrium and kinetics. J. Hazard. Mater. 2009, 172, 1311–1320. [Google Scholar] [CrossRef]
- Yuan, Y.L. Equilibrium, thermodynamics and breakthrough studies for adsorption of solanesol onto macroporous resins. Chem. Eng. Process. 2008, 47, 1420–1427. [Google Scholar] [CrossRef]
- Zhong, Li.; Li, X.B.; Xi, H.X.; Hua, B. Effects of ultrasound on adsorption equilibrium of phenol on polymeric adsorption resin. Chem. Eng. J. 2002, 86, 375–379. [Google Scholar] [CrossRef]
- Jun, W.; Fu, A.W.; Hui, Z.; Li, L.; Qiu, S.W. Isolation of flavonoids from mulberry (Morus alba L.) leaves with macroporous resins. Afric. J. Biotechnol. 2008, 13, 2147–2155. [Google Scholar]
- Sample Availability: Samples of the crude extract are available from the authors.
© 2014 by the authors. licensee MDPI, Basel, Switzerland. This article is an open access article distributed under the terms and conditions of the Creative Commons Attribution license ( http://creativecommons.org/licenses/by/3.0/).
Share and Cite
Wang, T.; Li, C.-Q.; Zhang, H.; Li, J.-W. Response Surface Optimized Extraction of 1-Deoxynojirimycin from Mulberry Leaves (Morus alba L.) and Preparative Separation with Resins. Molecules 2014, 19, 7040-7056. https://doi.org/10.3390/molecules19067040
Wang T, Li C-Q, Zhang H, Li J-W. Response Surface Optimized Extraction of 1-Deoxynojirimycin from Mulberry Leaves (Morus alba L.) and Preparative Separation with Resins. Molecules. 2014; 19(6):7040-7056. https://doi.org/10.3390/molecules19067040
Chicago/Turabian StyleWang, Teng, Cui-Qing Li, Hong Zhang, and Ji-Wen Li. 2014. "Response Surface Optimized Extraction of 1-Deoxynojirimycin from Mulberry Leaves (Morus alba L.) and Preparative Separation with Resins" Molecules 19, no. 6: 7040-7056. https://doi.org/10.3390/molecules19067040