
Combined Pharmacophore Modeling, 3D-QSAR, Homology Modeling and Docking Studies on CYP11B1 Inhibitors

Abstract
:1. Introduction
2. Results and Discussion
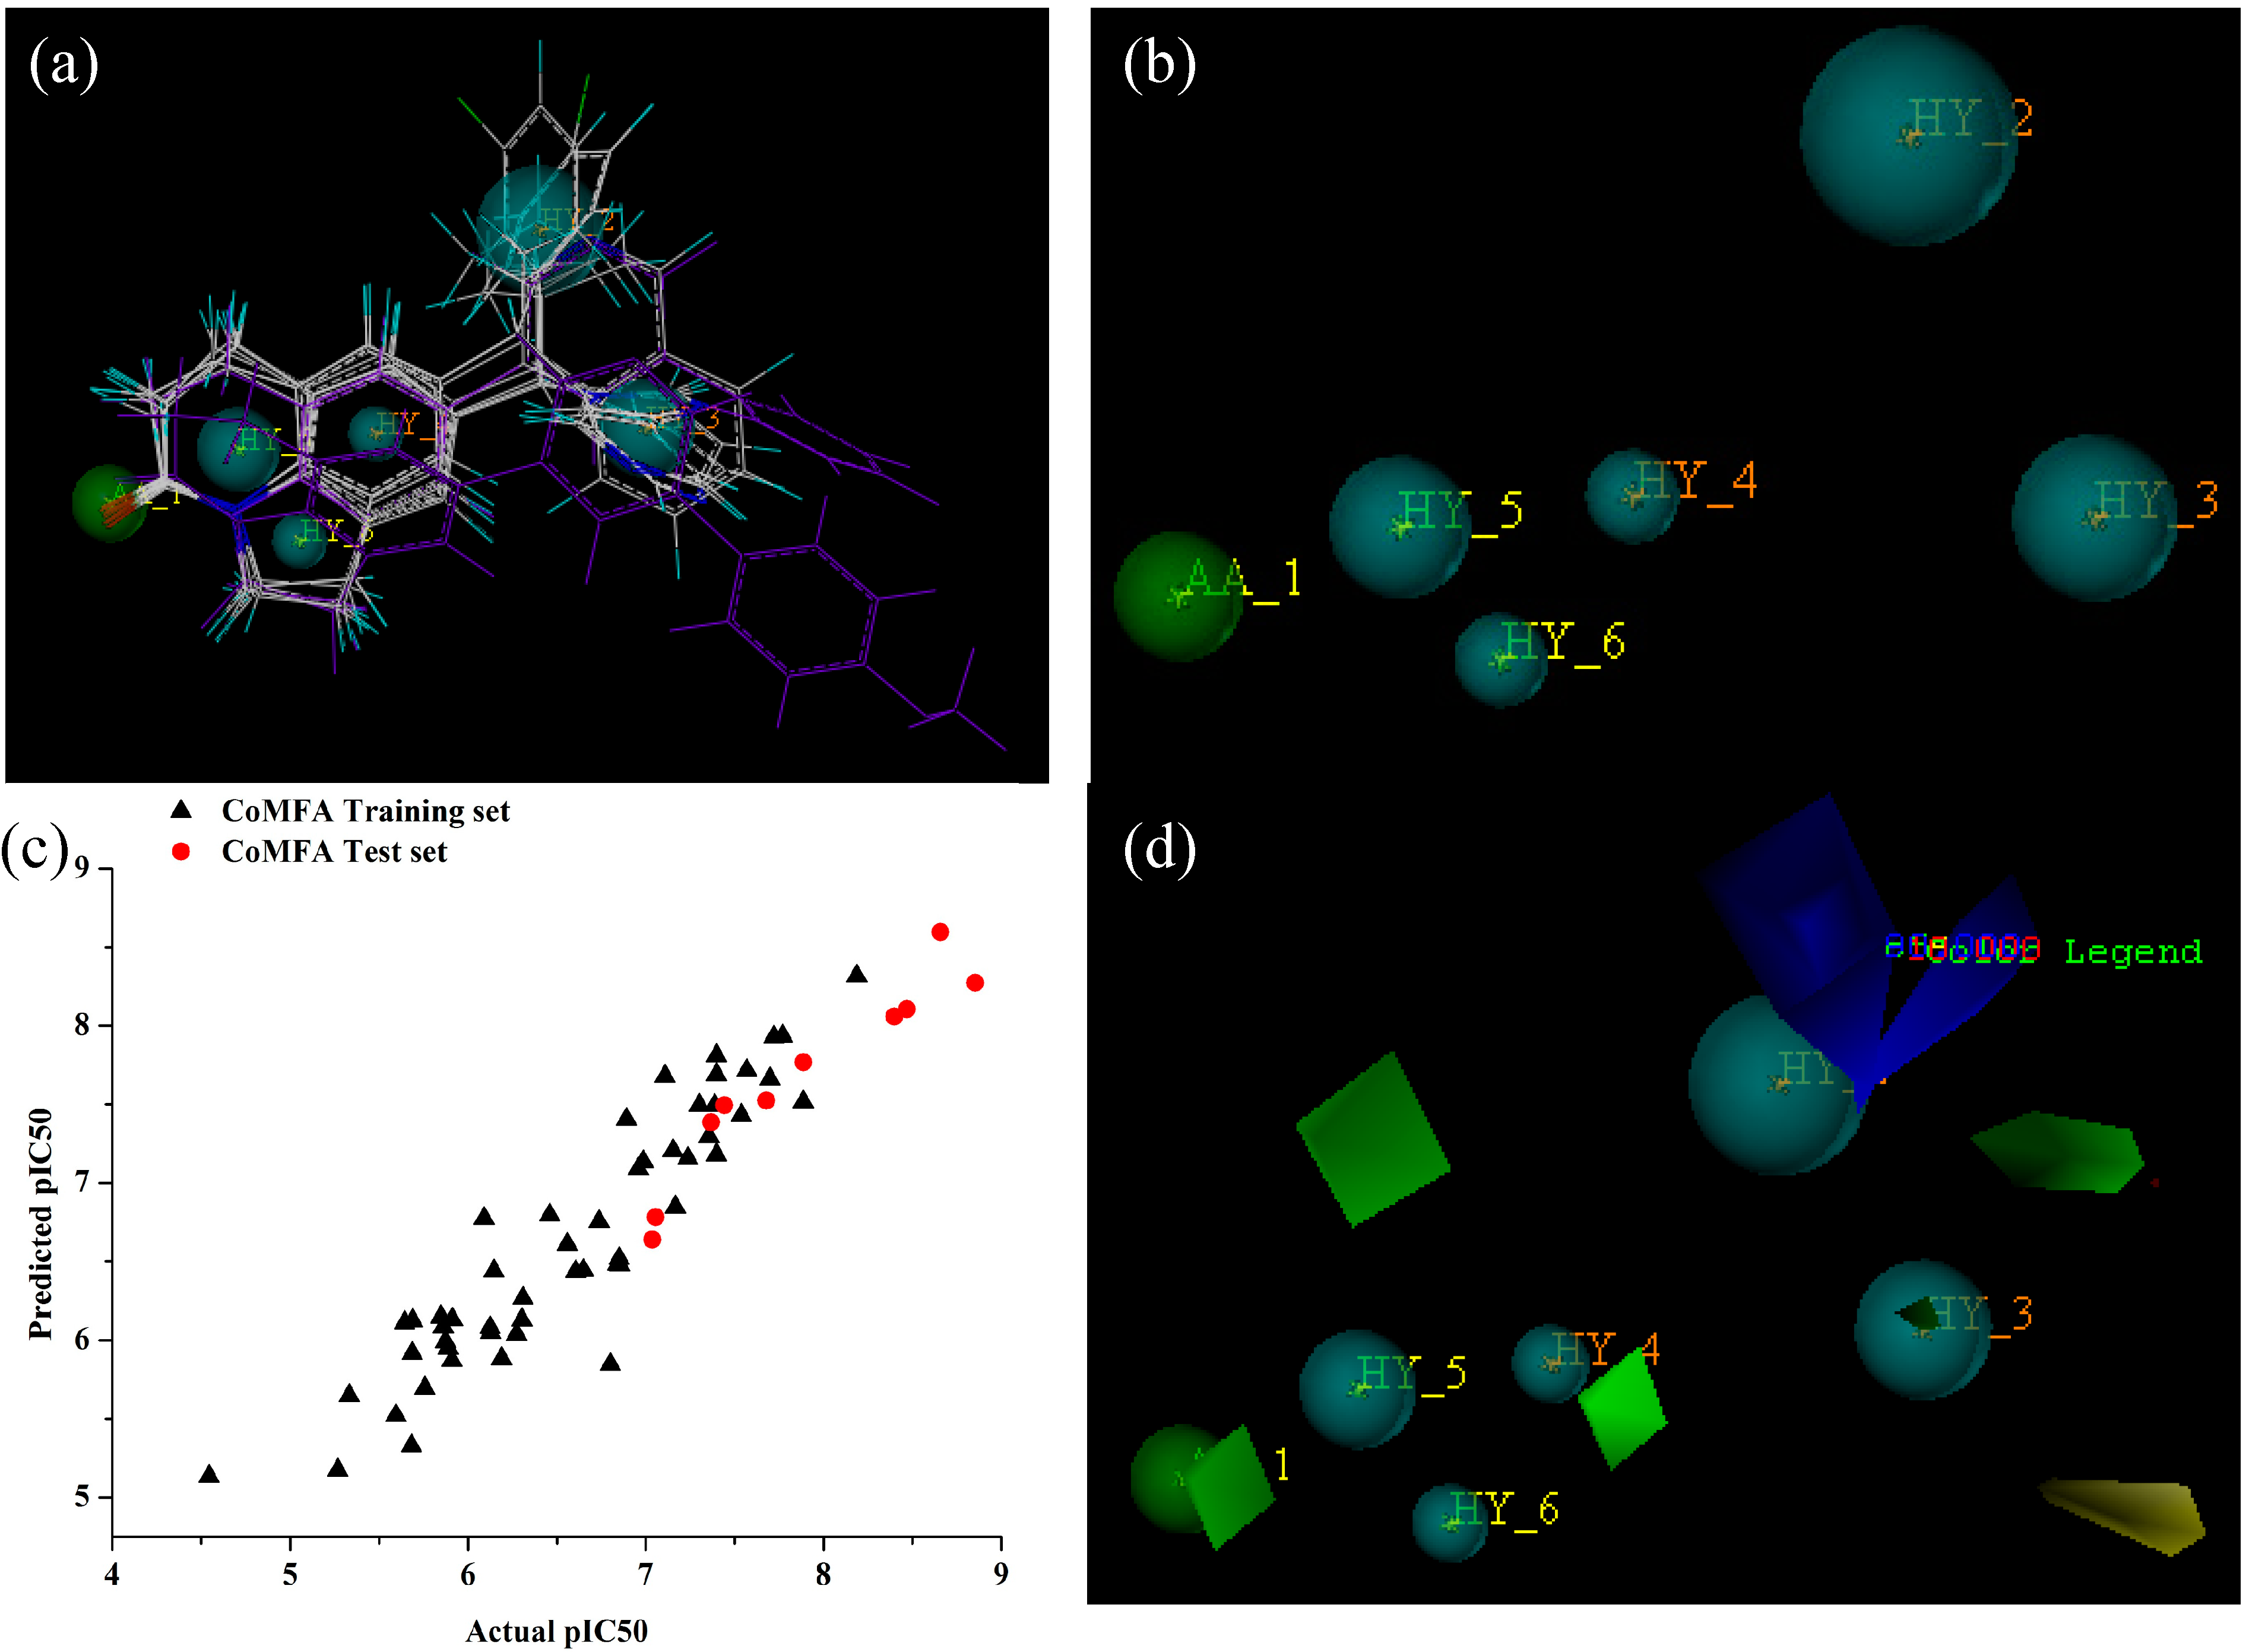
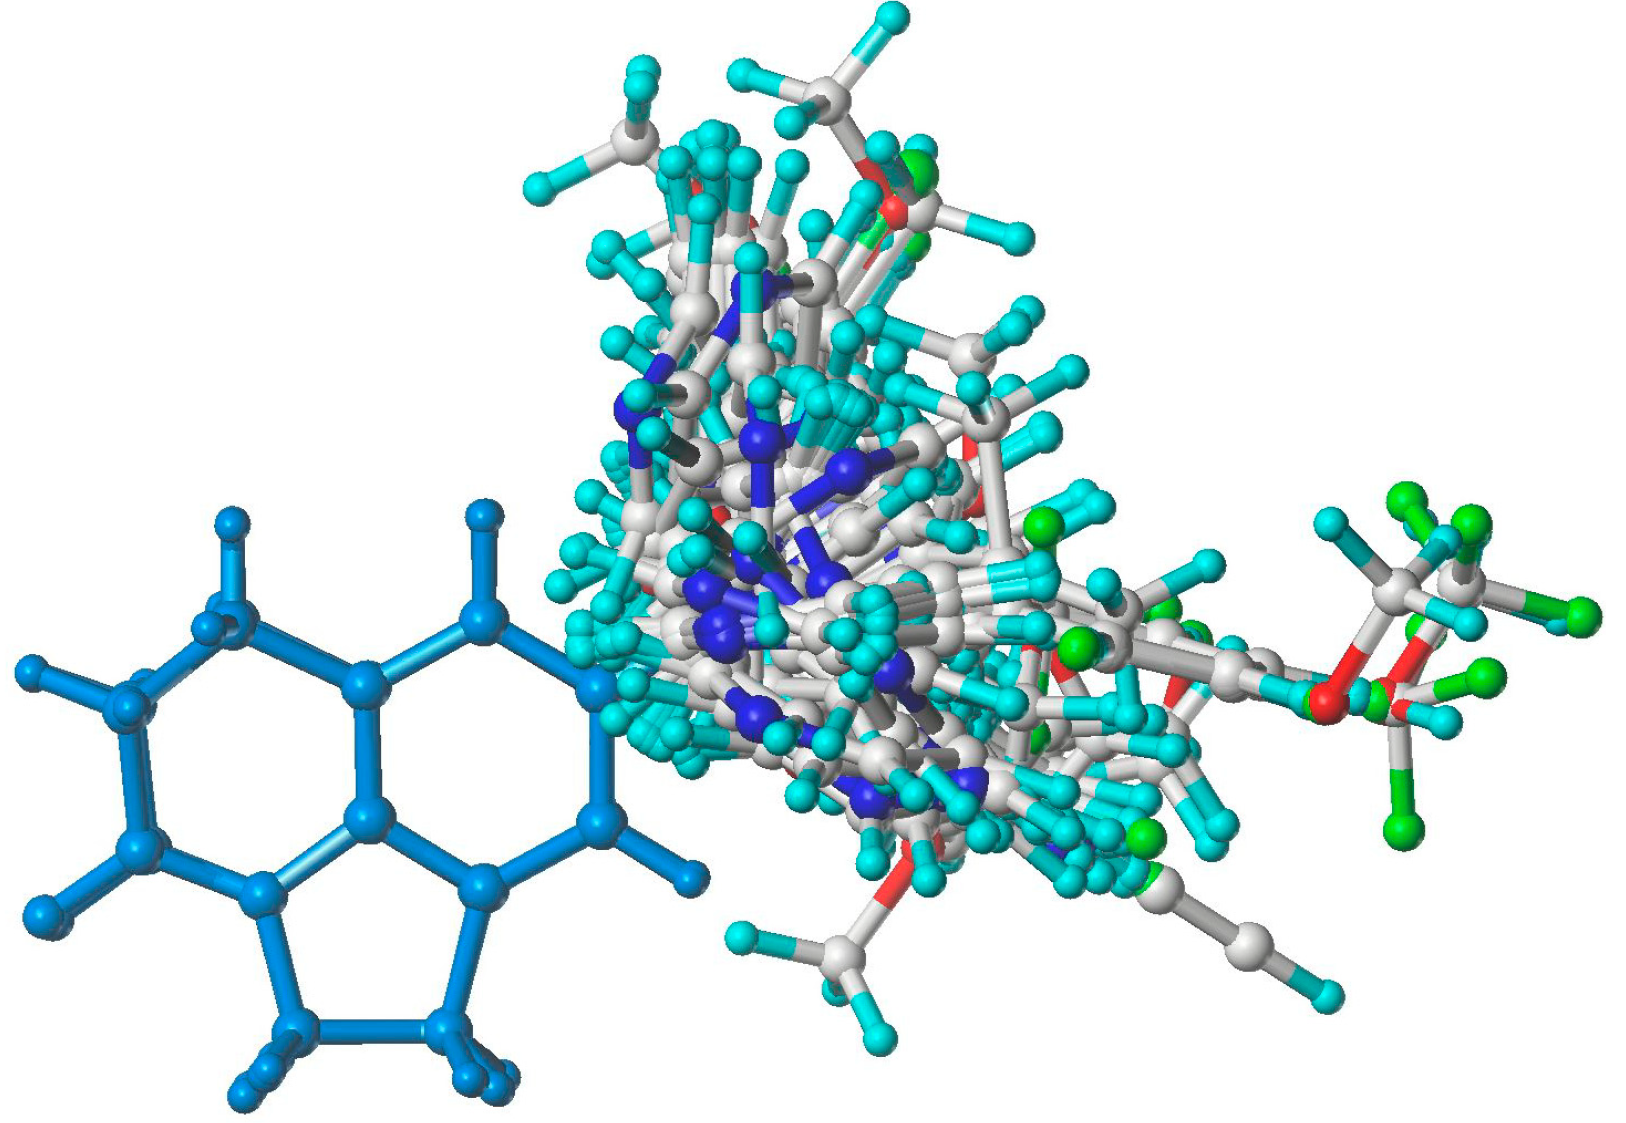
2.1. GALAHAD Modeling Results


| Compounds | pIC50 | |||
|---|---|---|---|---|
| Observed | Predicted | |||
| Pharmacophore | RMS | |||
| CoMFA | CoMFA | CoMSIA | ||
| 1 | 6.460 | 6.795 | 6.503 | 6.267 |
| 2 | 6.650 | 6.442 | 6.724 | 6.837 |
| 3 | 5.910 | 5.872 | 6.383 | 7.355 |
| 4 | 6.854 | 6.476 | 6.216 | 6.870 |
| 5 | 5.848 | 6.147 | 7.039 | 6.978 |
| 6 | 6.128 | 6.049 | 6.027 | 5.972 |
| 7 | 5.268 | 5.174 | 5.294 | 5.237 |
| 8 | 6.559 | 6.608 | 6.635 | 6.589 |
| 9 | 5.595 | 5.521 | 5.605 | 5.488 |
| 10 | 6.092 | 6.773 | 6.594 | 6.809 |
| 11 | 6.274 | 6.038 | 6.286 | 6.199 |
| 12 | 7.056 | 6.781 | 7.047 | 7.100 |
| 13 | 6.190 | 5.883 | 5.569 | 5.832 |
| 14 | 7.036 | 6.638 | 7.112 | 7.184 |
| 15 | 5.874 | 5.991 | 5.820 | 5.838 |
| 16 | 6.125 | 6.082 | 6.059 | 6.145 |
| 17 | 7.387 | 7.493 | 7.384 | 7.462 |
| 18 | 8.398 | 8.059 | 8.256 | 8.199 |
| 19 | 7.167 | 6.846 | 6.657 | 6.474 |
| 20 | 5.644 | 6.111 | 5.710 | 5.526 |
| 21 | 5.914 | 6.131 | 6.081 | 6.216 |
| 22 | 7.444 | 7.493 | 7.465 | 7.332 |
| 23 | 7.108 | 7.679 | 7.499 | 7.460 |
| 24 | 7.770 | 7.936 | 8.755 | 8.459 |
| 25 | 8.187 | 8.317 | 8.456 | 8.444 |
| 26 | 8.854 | 8.274 | 8.730 | 8.643 |
| 27 | 8.658 | 8.598 | 8.663 | 8.569 |
| 28 | 8.469 | 8.105 | 8.332 | 8.414 |
| 29 | 7.721 | 7.929 | 7.230 | 8.223 |
| 30 | 7.398 | 7.690 | 7.280 | 7.521 |
| 31 | 7.538 | 7.430 | 7.158 | 7.394 |
| 32 | 7.569 | 7.715 | 7.188 | 7.315 |
| 33 | 6.959 | 7.089 | 7.352 | 7.539 |
| 34 | 7.398 | 7.810 | 6.608 | 7.151 |
| 35 | 6.842 | 6.483 | 7.030 | 7.225 |
| 36 | 7.155 | 7.205 | 7.335 | 7.278 |
| 37 | 7.301 | 7.494 | 7.316 | 7.284 |
| 38 | 7.699 | 7.662 | 7.777 | 7.700 |
| 39 | 7.886 | 7.515 | 7.693 | 7.596 |
| 40 | 6.146 | 6.438 | 5.974 | 6.149 |
| 41 | 6.607 | 6.435 | 6.367 | 6.426 |
| 42 | 6.801 | 5.847 | 6.021 | 6.082 |
| 43 | 6.987 | 7.134 | 7.057 | 6.944 |
| 44 | 5.689 | 6.125 | 5.698 | 5.658 |
| 45 | 5.890 | 5.949 | 5.699 | 6.199 |
| 46 | 6.851 | 6.518 | 6.369 | 7.034 |
| 47 | 7.886 | 7.768 | 6.820 | 6.869 |
| 48 | 4.544 | 5.135 | 5.004 | 4.603 |
| 49 | 5.683 | 5.329 | 5.408 | 5.758 |
| 50 | 7.237 | 7.156 | 7.095 | 7.108 |
| 51 | 7.367 | 7.385 | 7.244 | 7.113 |
| 52 | 6.310 | 6.264 | 6.075 | 6.183 |
| 53 | 7.398 | 7.178 | 7.525 | 7.237 |
| 54 | 6.738 | 6.753 | 6.844 | 6.712 |
| 55 | 6.305 | 6.128 | 6.510 | 6.321 |
| 56 | 5.757 | 5.695 | 5.681 | 5.796 |
| 57 | 6.893 | 7.405 | 7.022 | 7.331 |
| 58 | 5.862 | 6.085 | 6.465 | 7.034 |
| 59 | 7.678 | 7.524 | 7.821 | 7.828 |
| 60 | 7.357 | 7.294 | 6.605 | 6.842 |
| 61 | 5.687 | 5.917 | 5.705 | 5.600 |
| 62 | 5.333 | 5.648 | 5.336 | 5.397 |
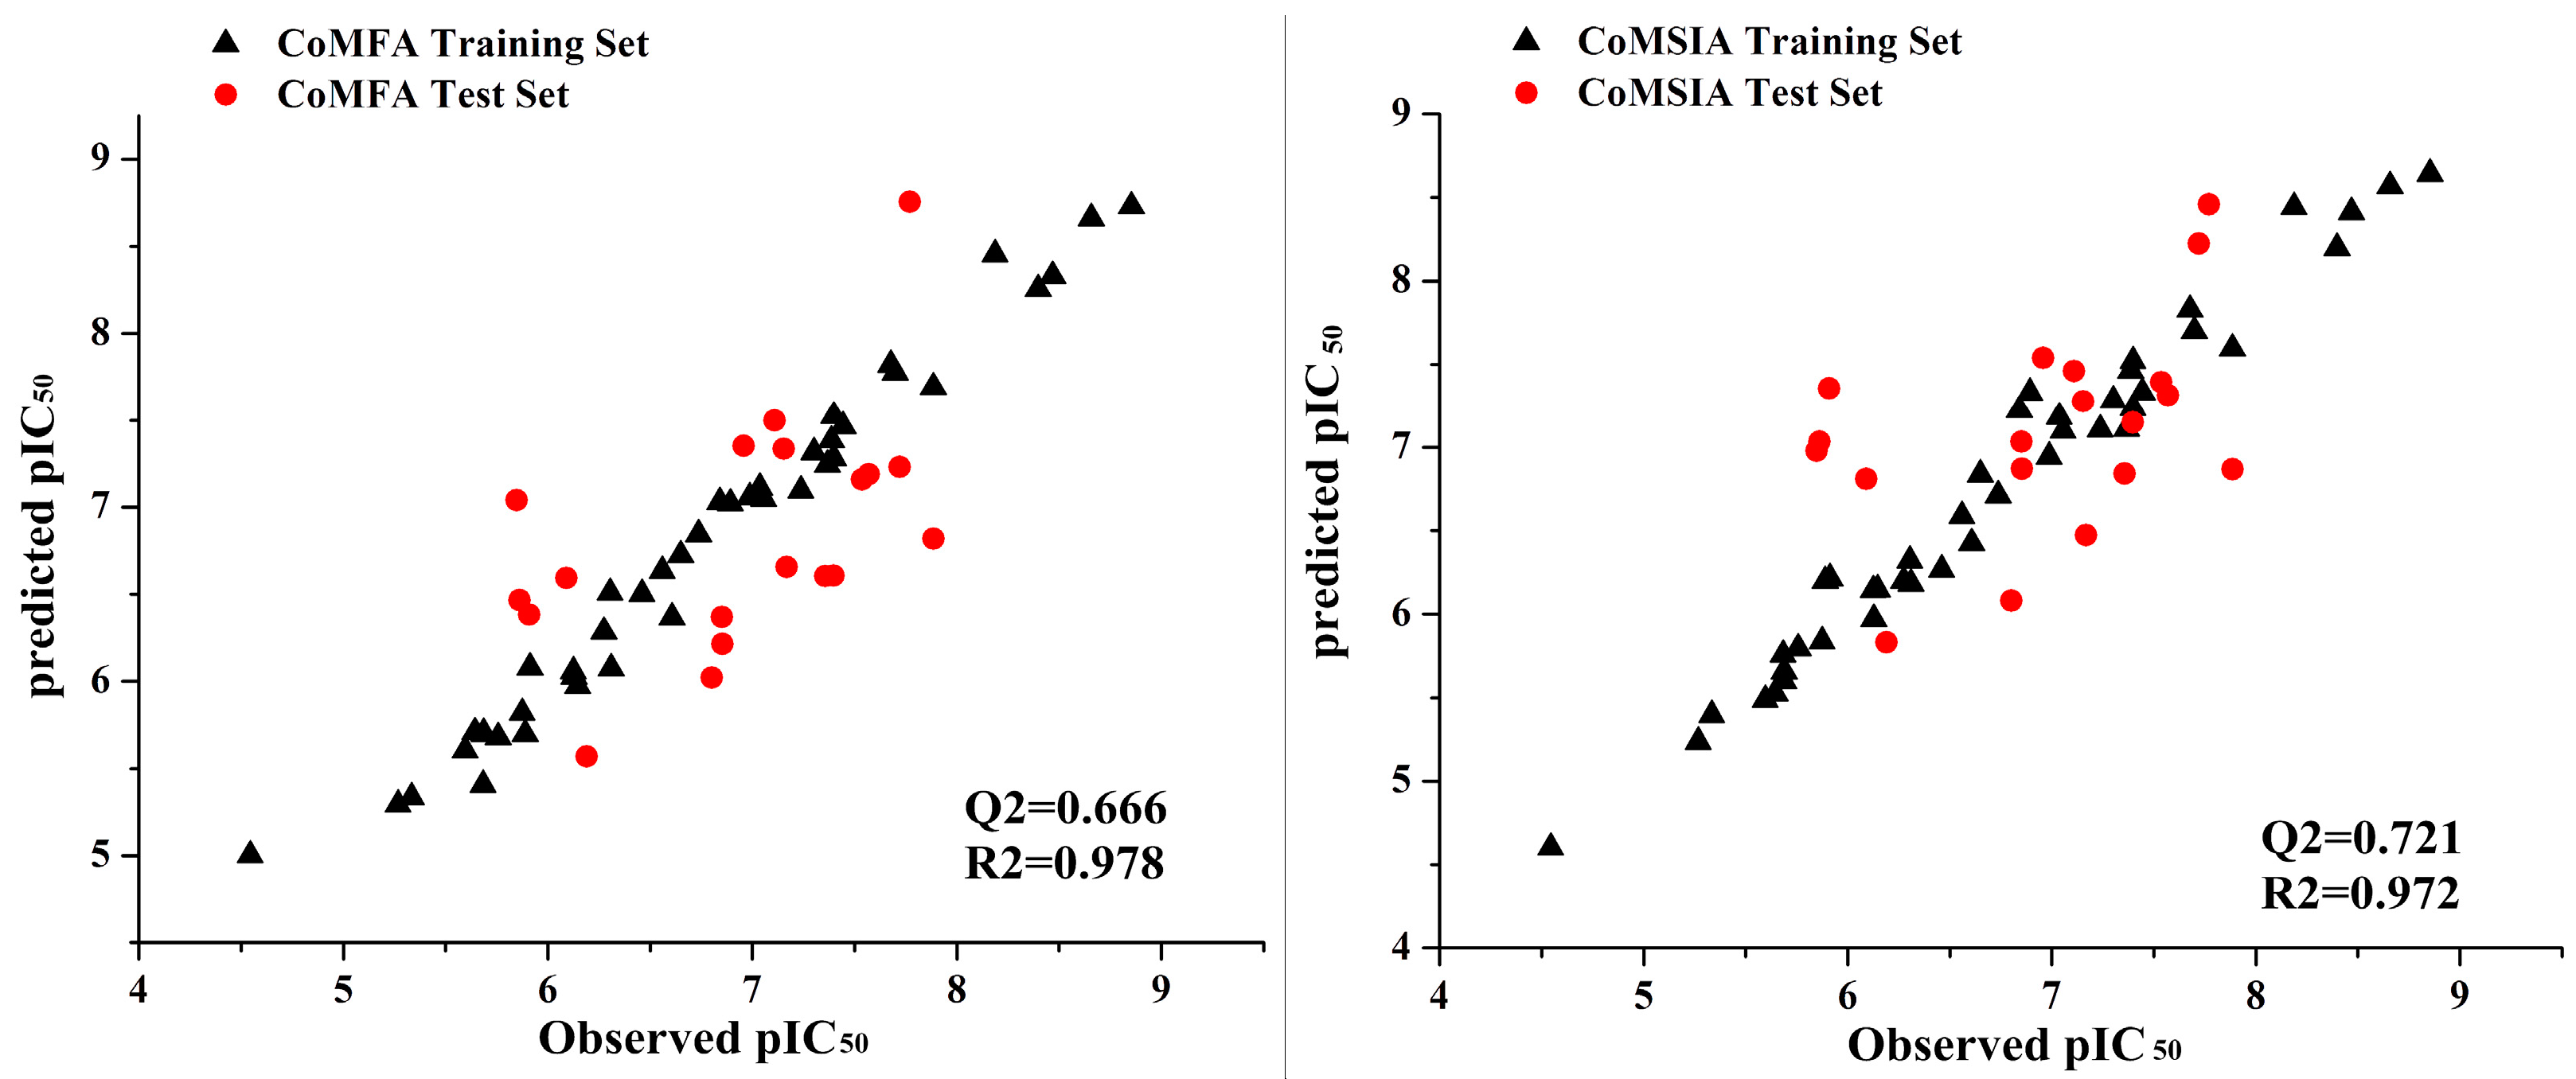
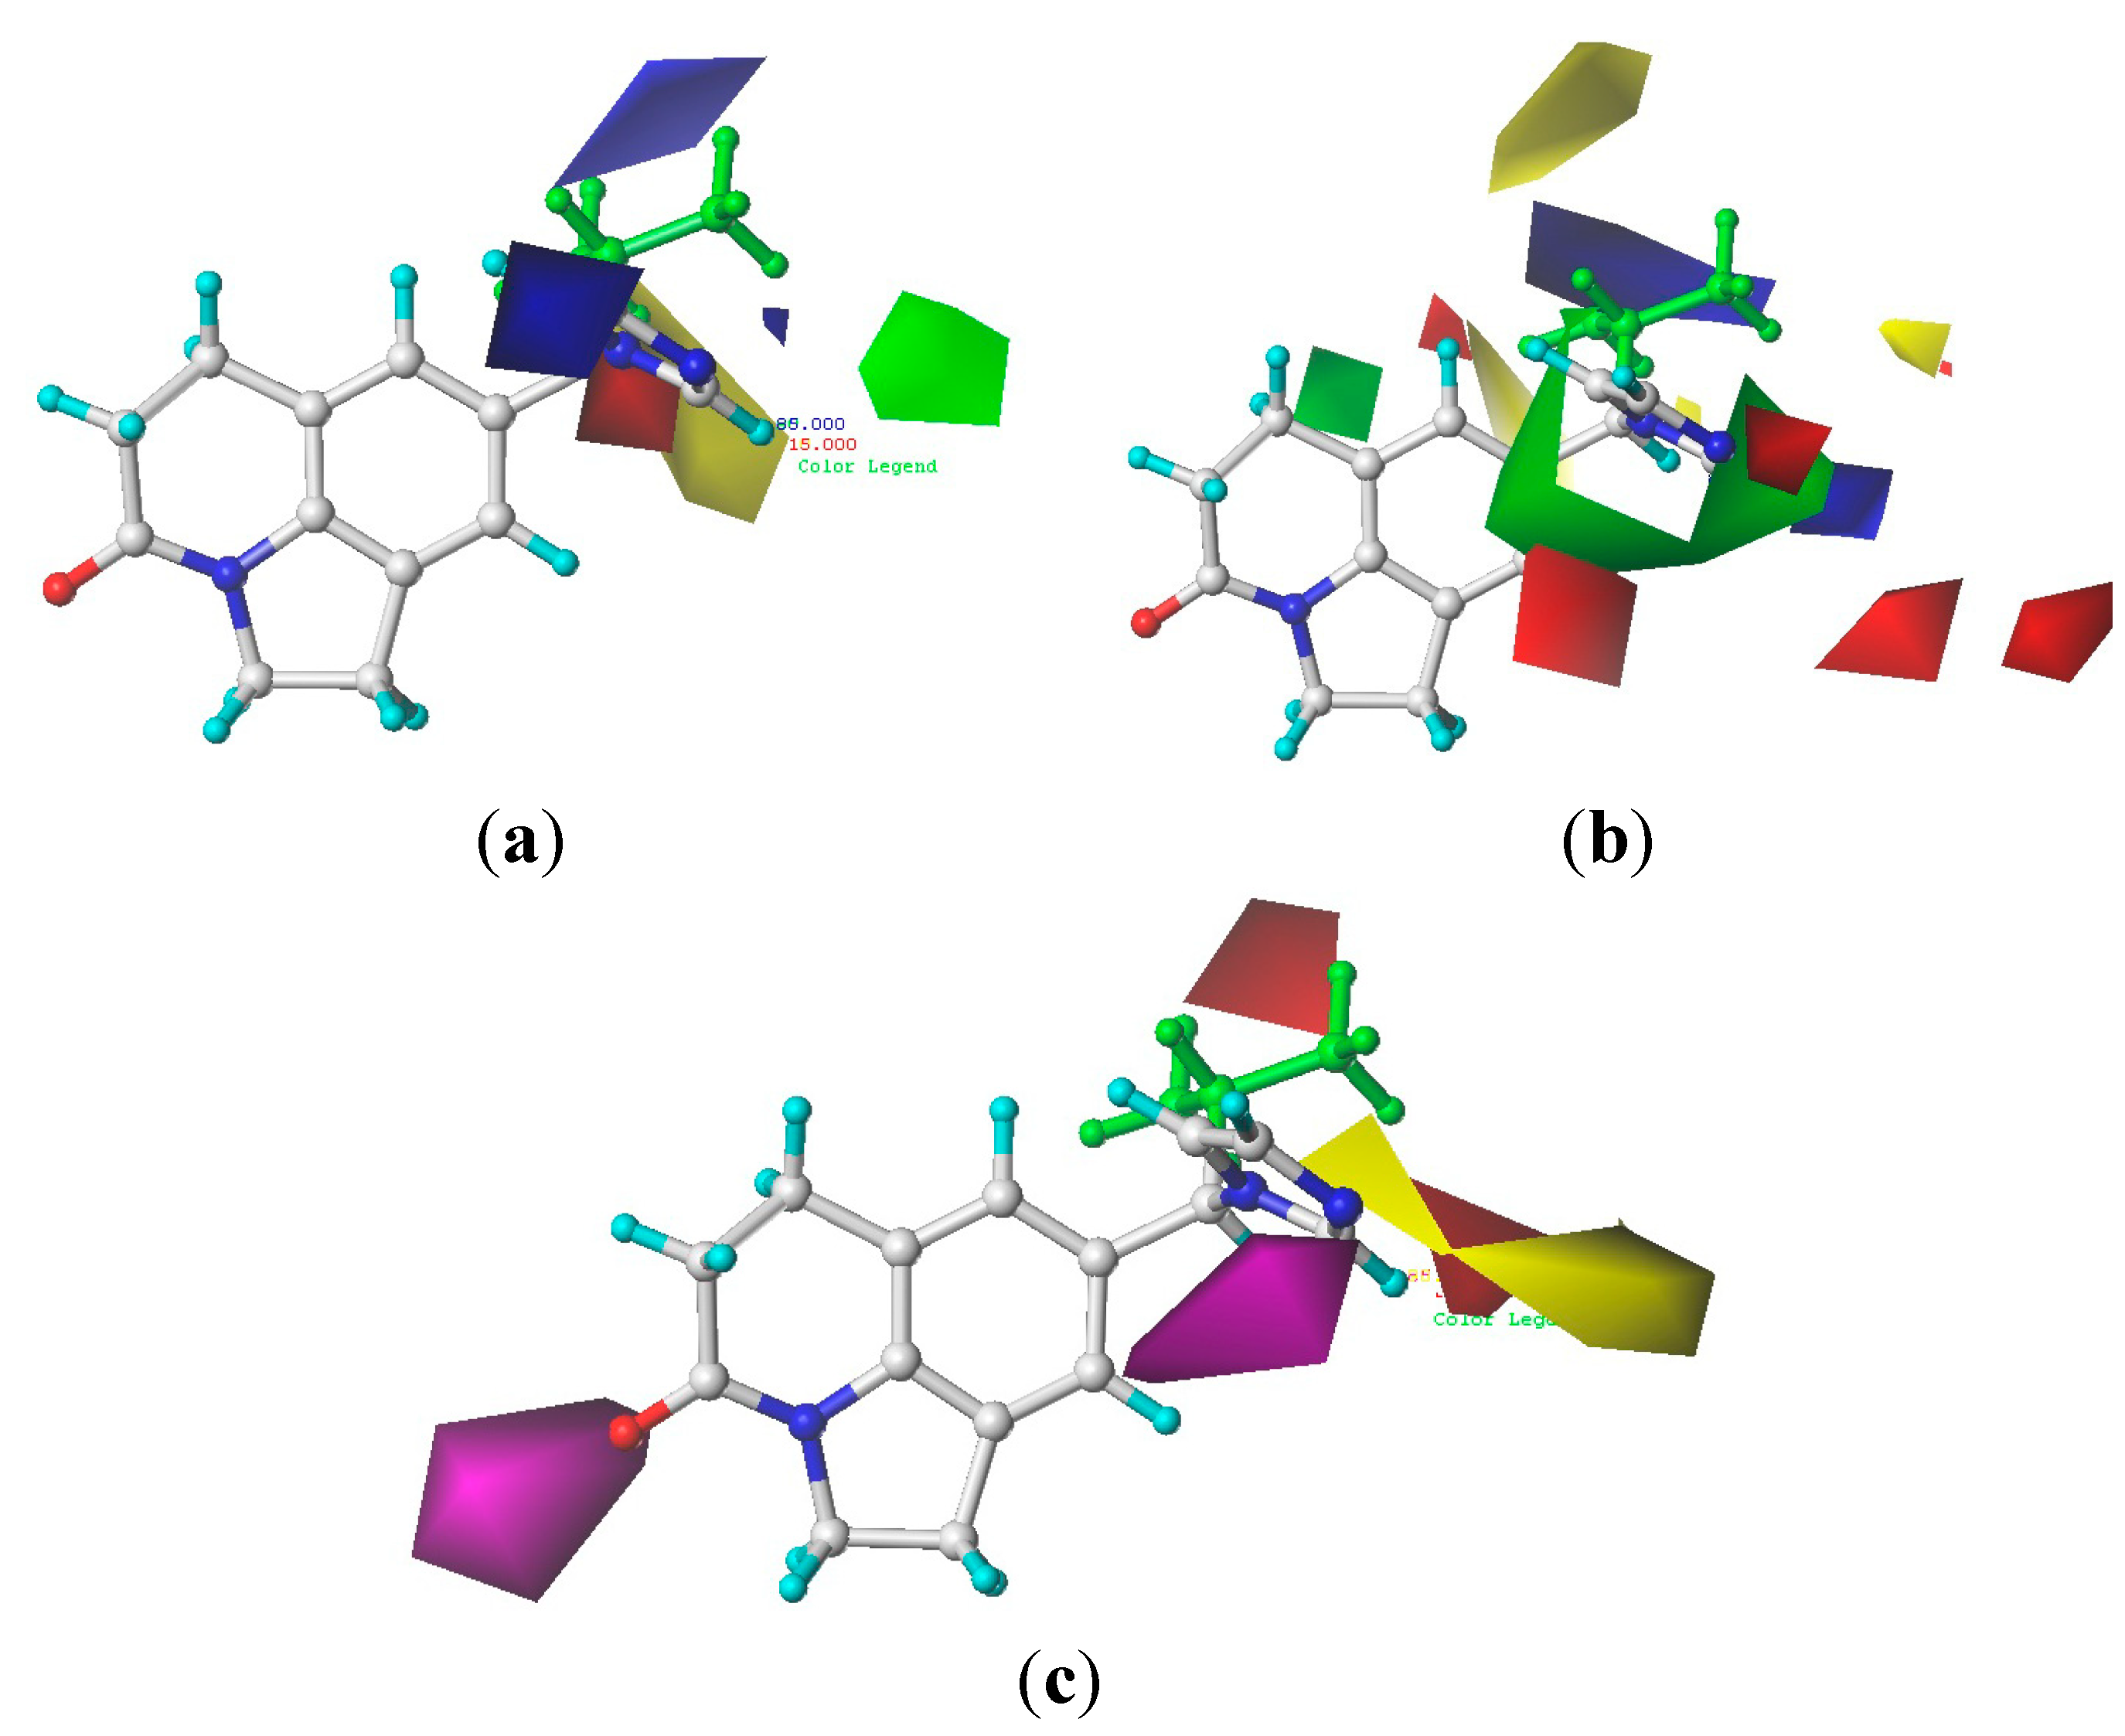
2.2. 3D-QSAR Modeling Result

| Method | Q2 | R2 | N | SEE | F |
|---|---|---|---|---|---|
| CoMFA + SE | 0.666 | 0.978 | 6 | 0.159 | 270.441 |
| CoMSIA + S | 0.510 | 0.833 | 6 | 0.441 | 29.904 |
| CoMSIA + E | 0.416 | 0.869 | 5 | 0.385 | 49.217 |
| CoMSIA + H | 0.446 | 0.852 | 6 | 0.414 | 34.641 |
| CoMSIA + D | - | - | - | - | - |
| CoMSIA + A | 0.219 | 0.729 | 6 | 0.562 | 16.074 |
| CoMSIA + SE | 0.531 | 0.955 | 6 | 0.229 | 126.791 |
| CoMSIA + SH | 0.626 | 0.890 | 6 | 0.357 | 48.766 |
| CoMSIA + SA | 0.487 | 0.830 | 6 | 0.445 | 29.213 |
| CoMSIA + EH | 0.446 | 0.882 | 6 | 0.361 | 70.933 |
| CoMSIA + EA | 0.520 | 0.924 | 6 | 0.298 | 72.500 |
| CoMSIA + HA | 0.443 | 0.873 | 6 | 0.384 | 41.344 |
| CoMSIA + SEH | 0.547 | 0.912 | 6 | 0.312 | 98.306 |
| CoMSIA + SEA | 0.699 | 0.962 | 6 | 0.211 | 150.046 |
| CoMSIA + SHA | 0.595 | 0.916 | 6 | 0.312 | 65.746 |
| CoMSIA + EHA | 0.632 | 0.958 | 6 | 0.220 | 138.387 |
| CoMSIA + SEHA | 0.721 | 0.972 | 6 | 0.180 | 209.908 |
2.3. Predictive Power of 3D-QSAR Analyses


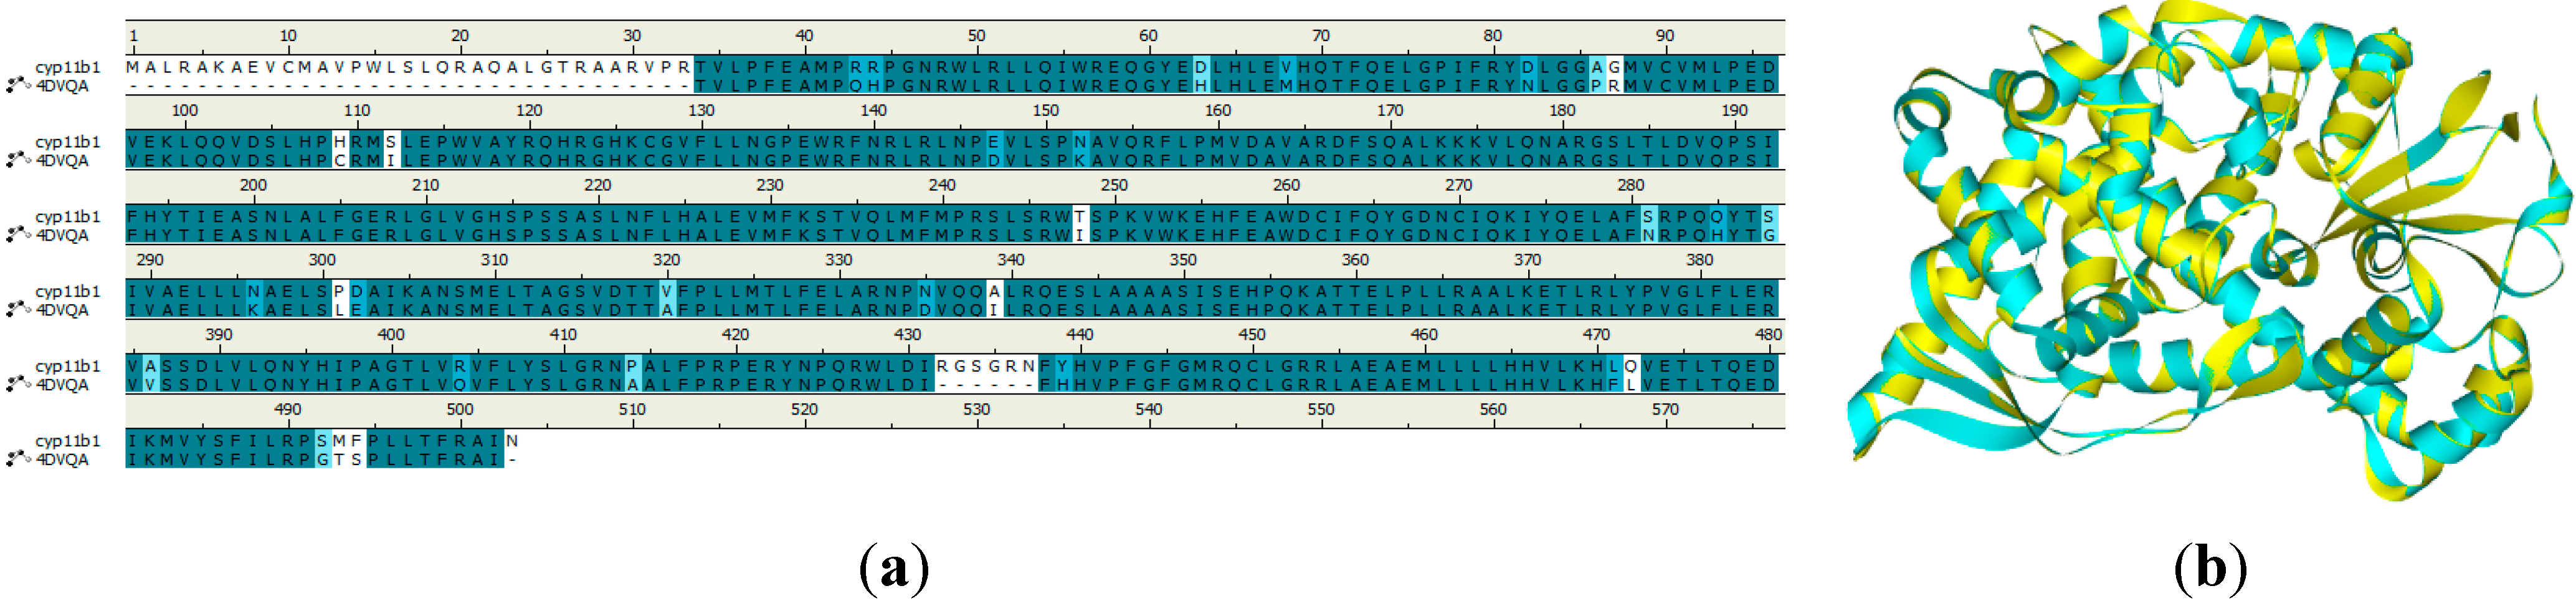
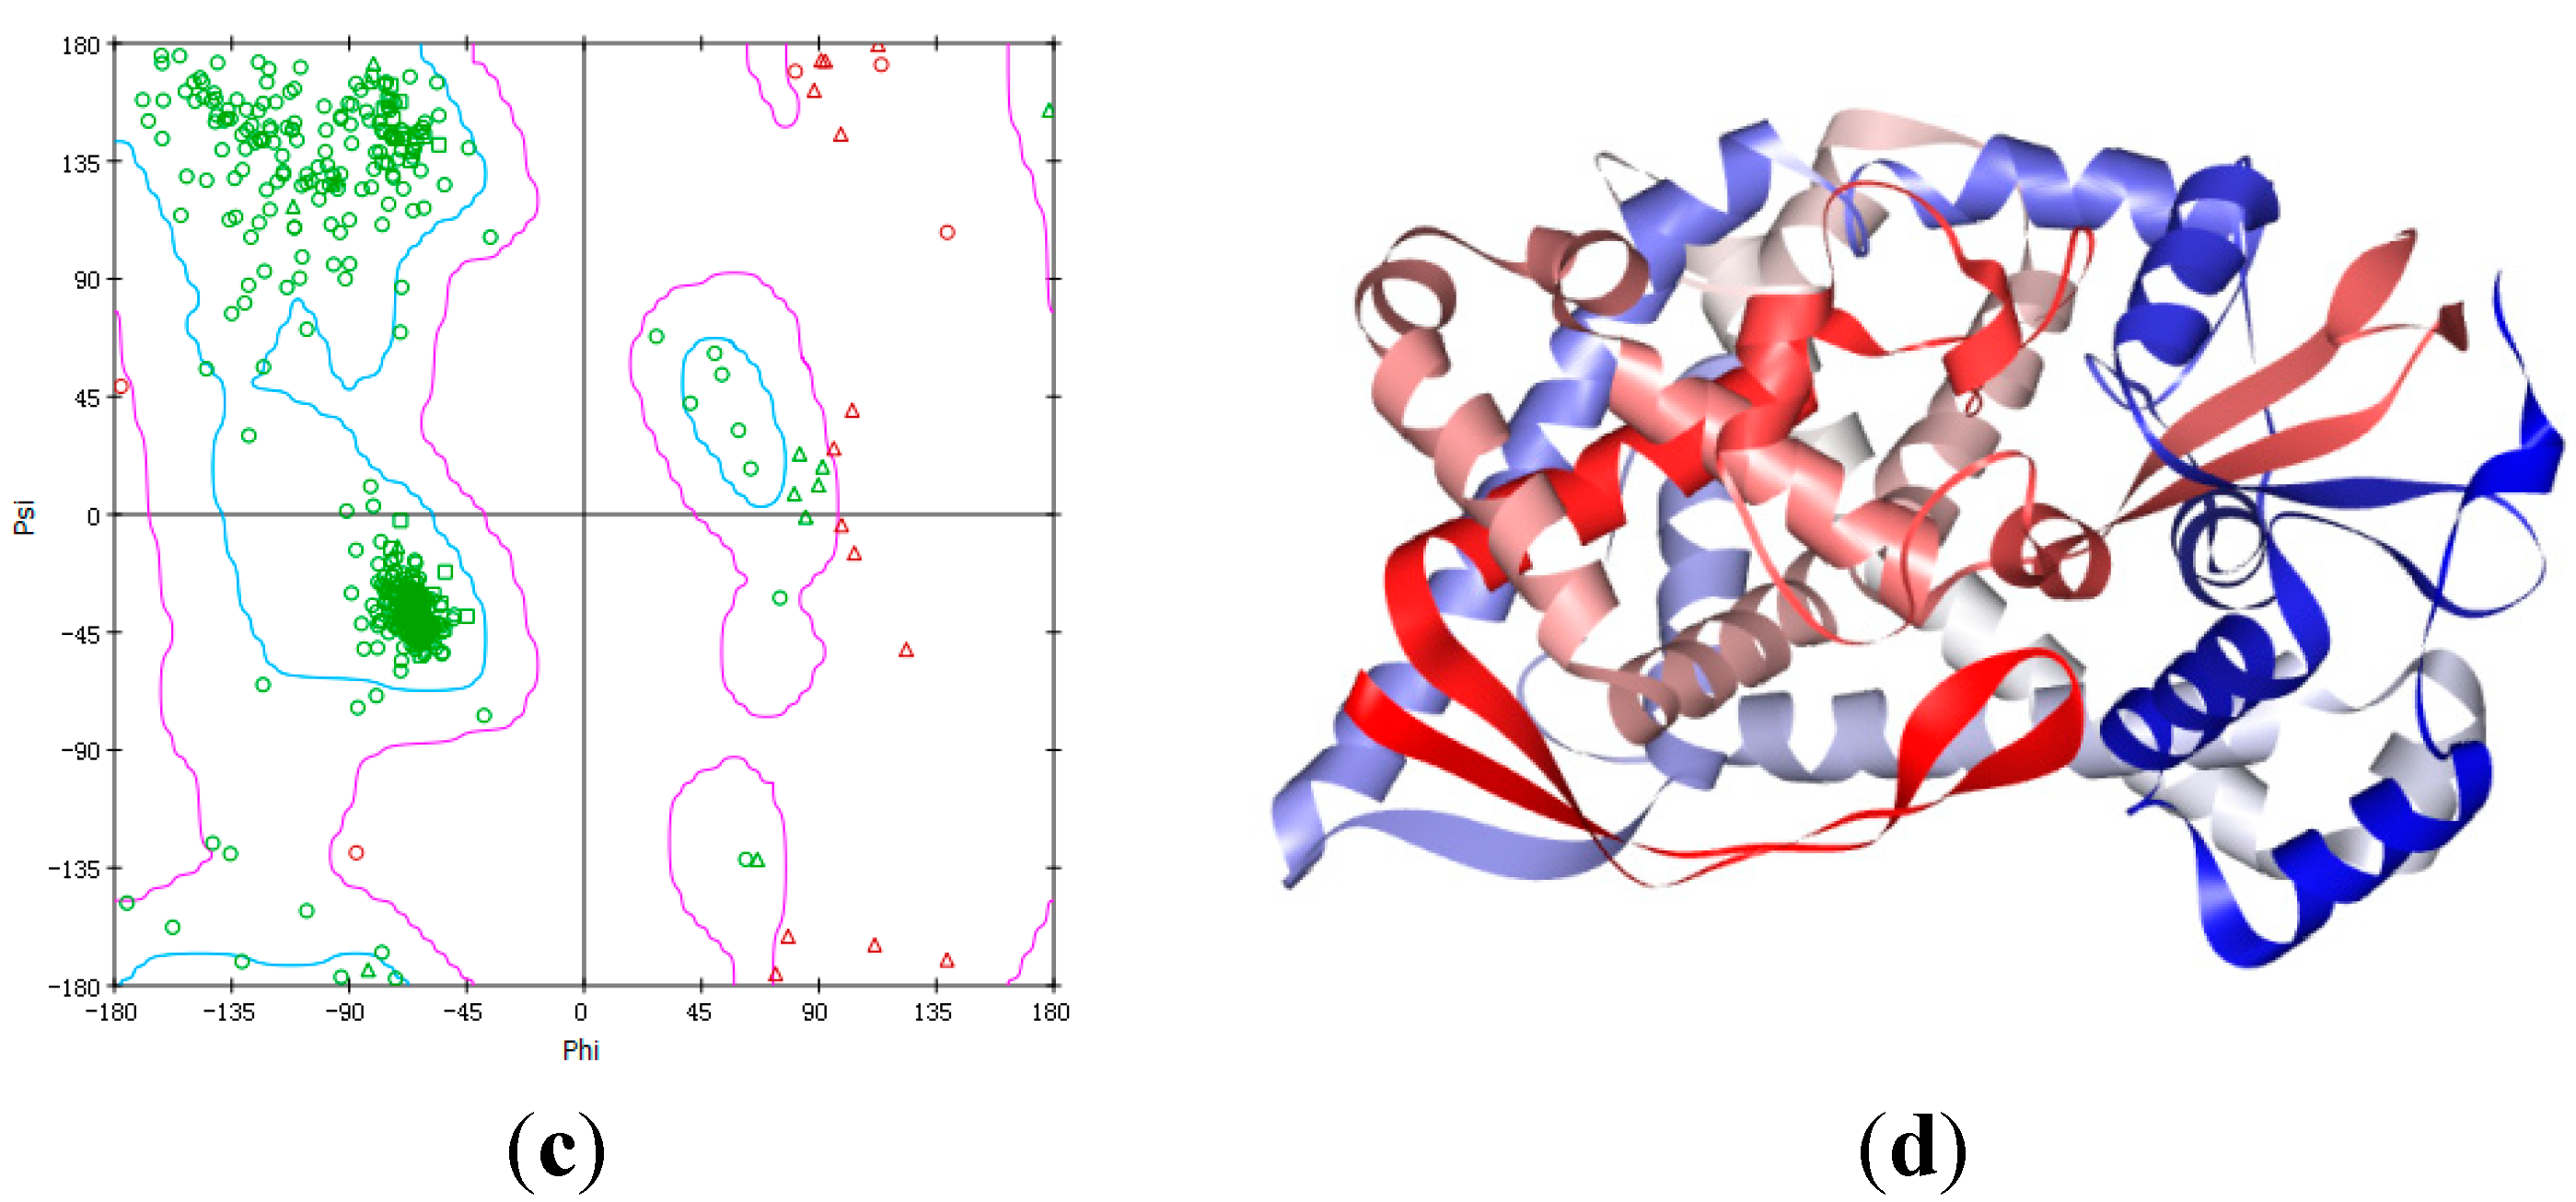
2.4. Homology Modeling Result


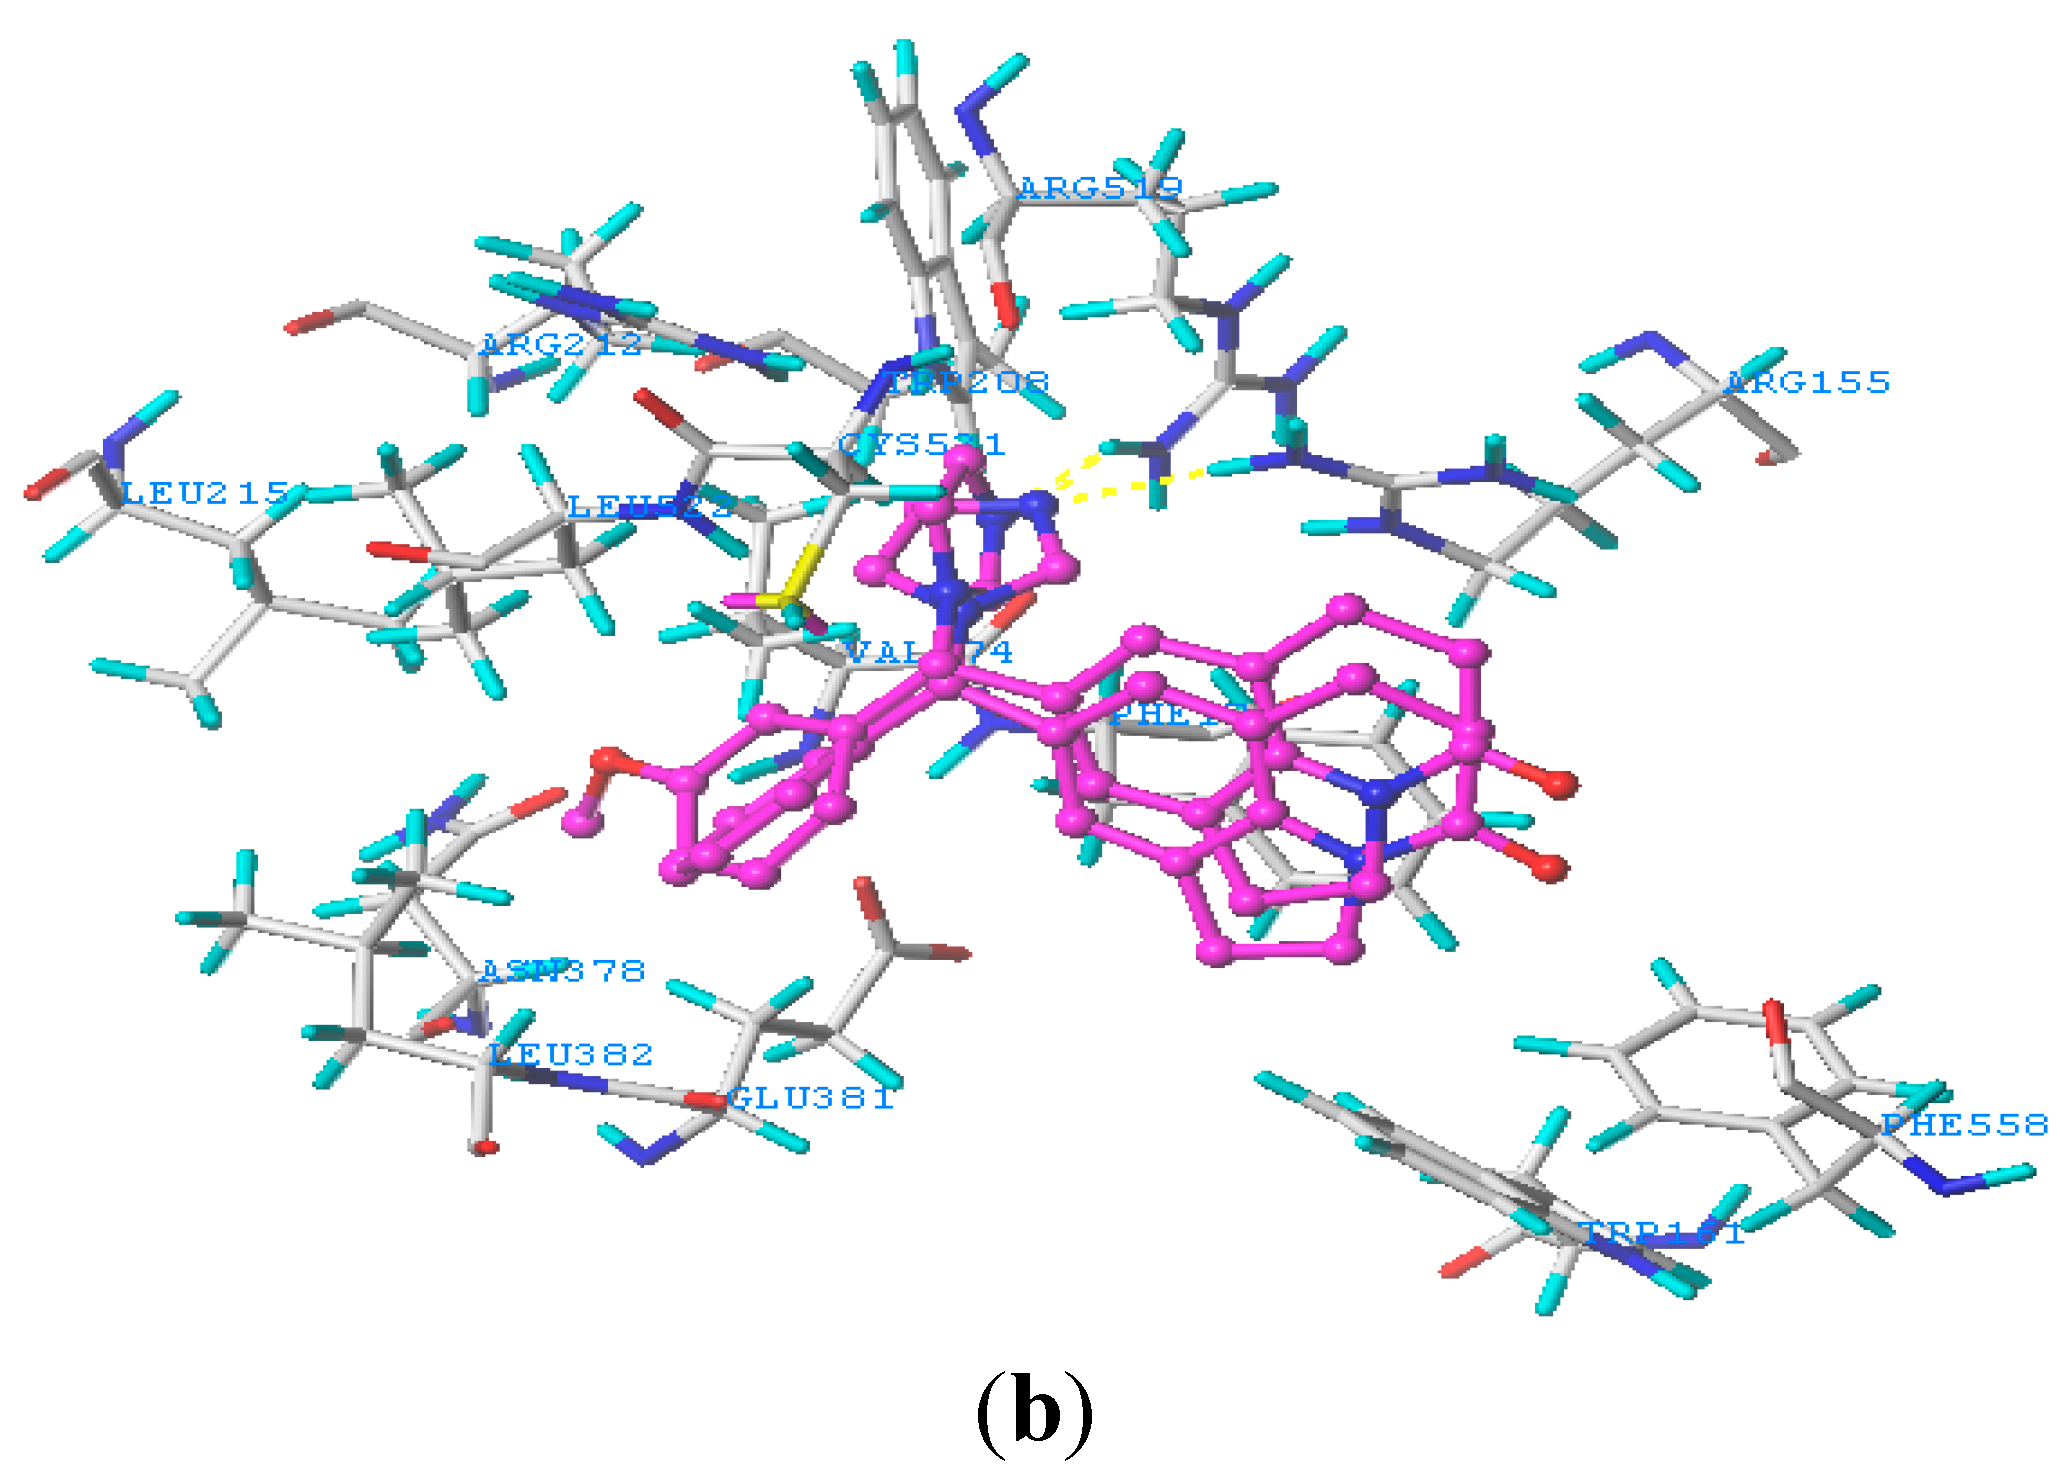
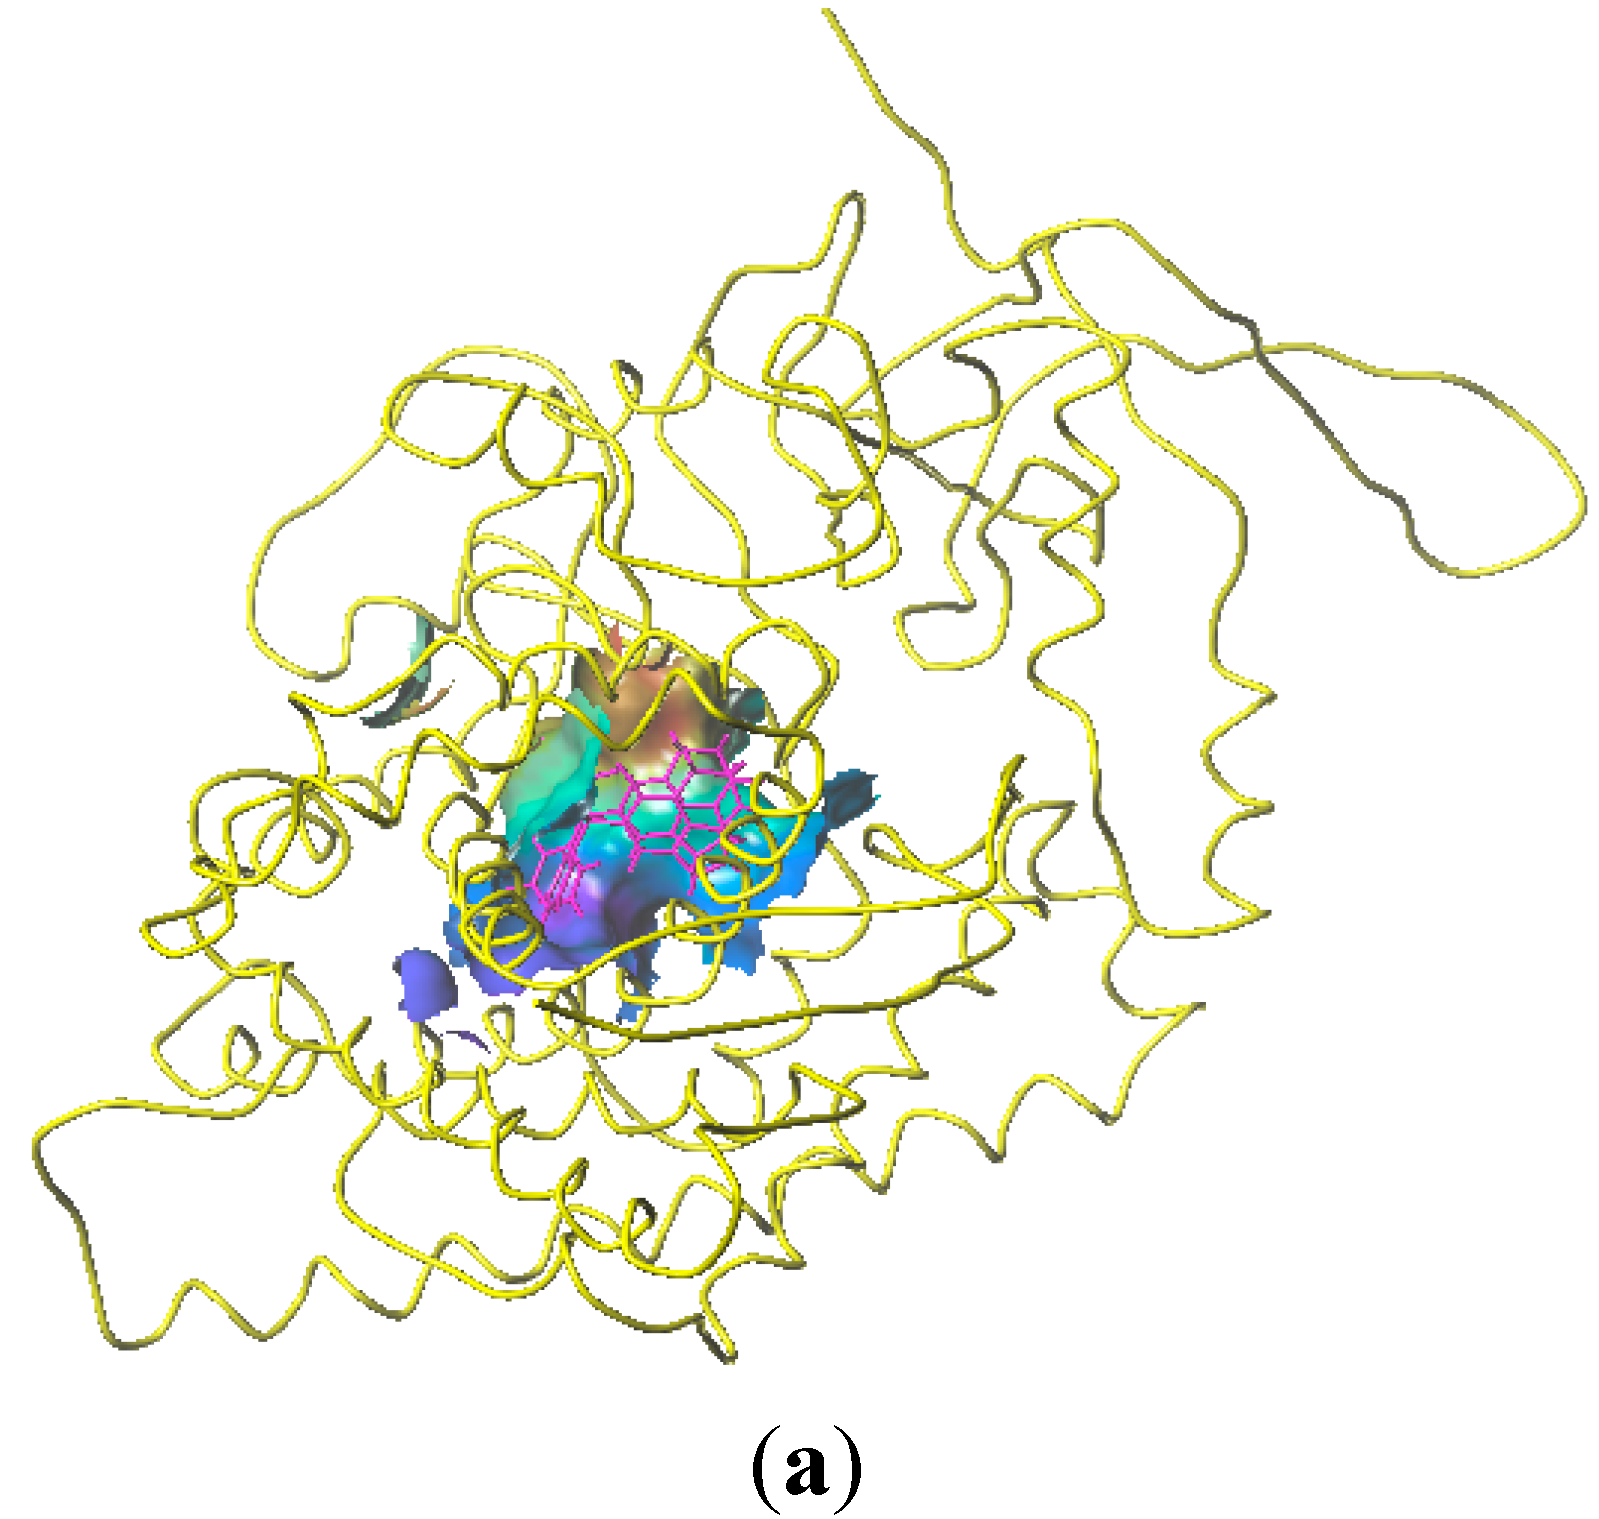
2.5. Docking Analysis

3. Experimental Section
3.1. Data Set
3.2. GALAHAD
| Compound | Skeleton | R | IC50 (nM) | pIC50 |
|---|---|---|---|---|
| 1 | 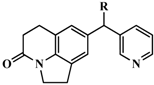 | OH | 347 | 6.4597 |
| 2 | H | 224 | 6.6498 | |
| 3 * | =CH2 | 1230 | 5.9101 | |
| 4 * | Me | 140 | 6.8539 | |
| 5 * | i-Pr | 1420 | 5.8477 | |
| 6 | Ph | 745 | 6.1278 | |
| 7 | Ph,OH | 5399 | 5.2677 | |
| 8 | 2-MeOPh | 276 | 6.5591 | |
| 9 | 3-MeOPh | 2539 | 5.5953 | |
| 10 * | 4-MeOPh | 810 | 6.0915 | |
| 11 | 3-FPh | 532 | 6.2741 | |
| 12 # | 4-FPh | 88 | 7.0555 | |
| 13 * | 3-ClPh | 646 | 6.1898 | |
| 14 # | 4-ClPh | 92 | 7.0362 | |
| 15 | 3-CH3Ph | 1336 | 5.8742 | |
| 16 | 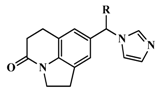 | OH | 750 | 6.1249 |
| 17 | =CH2 | 41 | 7.3872 | |
| 18 # | Me | 4 | 8.3979 | |
| 19 * | Ph | 68 | 7.1675 | |
| 20 | 2-MeOPh | 2270 | 5.6440 | |
| 21 * | 3-MePh | 1220 | 5.9136 | |
| 22 # | 3-ClPh | 36 | 7.4437 | |
| 23 * | 4-FPh | 78 | 7.1079 | |
| 24 * | 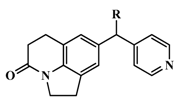 | Me | 17 | 7.7696 |
| 25 | Et | 6.5 | 8.1871 | |
| 26 # | i-propyl | 1.4 | 8.8539 | |
| 27 # | c-propyl | 2.2 | 8.6576 | |
| 28 # | c-butyl | 3.4 | 8.4685 | |
| 29 * | =CH2 | 19 | 7.7212 | |
| 30 * | 2-FPh | 40 | 7.3979 | |
| 31 * | 3-FPh | 29 | 7.5376 | |
| 32 * | 4-FPh | 27 | 7.5686 | |
| 33 * | 3-MeOPh | 110 | 6.9586 | |
| 34 * | 4-MeOPh | 40 | 7.3979 | |
| 35 | 3-CNPh | 144 | 6.8416 | |
| 36 * | 4-CNPh | 70 | 7.1549 | |
| 37 | Ph | 50 | 7.3010 | |
| 38 | 2-furanyl | 20 | 7.6990 | |
| 39 | 2-thienyl | 13 | 7.8861 | |
| 40 |  | H | 715 | 6.1457 |
| 41 | OMe | 247 | 6.6073 | |
| 42 * | OEt | 158 | 6.8013 | |
| 43 | OiPr | 103 | 6.9872 | |
| 44 | OH | 2045 | 5.6893 | |
| 45 | F | 1288 | 5.8901 | |
| 46 | CF3 | 141 | 6.8508 | |
| 47 #* | 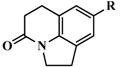 | 4-isoquinoline | 13 | 7.8861 |
| 48 | 5-pyrimidine | 28546 | 4.5445 | |
| 49 | 1-imidazole | 2077 | 5.6826 | |
| 50 | 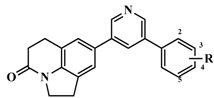 | H | 58 | 7.2366 |
| 51 # | 2-F | 43 | 7.3665 | |
| 52 | 3-F | 490 | 6.3098 | |
| 53 | 4-F | 40 | 7.3979 | |
| 54 | 2,5-F | 183 | 6.7375 | |
| 55 | 3,4-F | 496 | 6.3045 | |
| 56 | 3,5-F | 1748 | 5.7575 | |
| 57 | 2-OMe | 128 | 6.8928 | |
| 58 * | 3-OMe | 1374 | 5.8620 | |
| 59 # | 4-OMe | 21 | 7.6778 | |
| 60 * | 3-OH | 44 | 7.3565 | |
| 61 | 3-OCF3 | 2058 | 5.6866 | |
| 62 | 3-CF3 | 4646 | 5.3329 |
3.3. 3D-QSAR Modeling

3.4. Homology Modeling and Docking Analysis
4. Conclusions
Acknowledgments
Author Contributions
Conflicts of Interest
References
- Yin, L.; Lucas, S.; Maurer, F.; Kazmaier, U.; Hu, Q.; Hartmann, R.W. Novel imidazol-1-ylmethyl substituted 1,2,5,6-tetrahydropyrrolo[3,2,1-ij]quinolin-4-ones as potent and selective CYP11B1 inhibitors for the treatment of Cushing’s syndrome. J. Med. Chem. 2012, 55, 6629–6633. [Google Scholar] [CrossRef] [PubMed]
- Emmerich, J.; Hu, Q.; Hanke, N.; Hartmann, R.W. Cushing’s syndrome: Development of highly potent and selective CYP11B1 inhibitors of the (pyridylmethyl)pyridine type. J. Med. Chem. 2013, 56, 6022–6032. [Google Scholar] [CrossRef] [PubMed]
- Hille, U.E.; Zimmer, C.; Haupenthal, J.; Hartmann, R.W. Optimization of the First Selective Steroid-11β-hydroxylase (CYP11B1) Inhibitors for the Treatment of Cortisol Dependent Diseases. ACS Med. Chem. Lett. 2011, 2, 559–564. [Google Scholar] [CrossRef] [PubMed]
- White, P.C.; Rainey, W.E. Editorial: Polymorphisms in CYP11B genes and 11-hydroxylase activity. J. Clin. Endocrinol. Metab. 2005, 90, 1252–1255. [Google Scholar] [CrossRef] [PubMed]
- Hofland, J.; Hofland, L.J.; van Koetsveld, P.M.; Steenbergen, J.; de Herder, W.W.; van Eijck, C.H.; de Krijger, R.R.; van Nederveen, F.H.; van Aken, M.O.; de Groot, J.W.; et al. ACTH-independent macronodular adrenocortical hyperplasia reveals prevalent aberrant in vivo and in vitro responses to hormonal stimuli and coupling of arginine-vasopressin type 1a receptor to 11β-hydroxylase. Orphanet J. Rare Dis. 2013, 8. [Google Scholar] [CrossRef] [Green Version]
- Bista, B.; Beck, N. Cushing syndrome. Indian J. Pediatr. 2014, 81, 158–164. [Google Scholar] [CrossRef] [PubMed]
- Cao, C.; Yang, X.; Li, L.; Sun, R.; Xian, Y.; Lv, W.; Jing, W.; Jun, X.; Yan, G. Increased expression of CYP17 and CYP11B1 in subclinical Cushing’s syndrome due to adrenal adenomas. Int. J. Urol. 2011, 18, 691–696. [Google Scholar] [CrossRef] [PubMed]
- Maser-Gluth, C.; Reincke, M.; Allolio, B.; Schulze, E. Metabolism of glucocorticoids and mineralocorticoids in patients with adrenal incidentalomas. Eur. J. Clin. Investig. 2000, 30 (Suppl. 3), 83–86. [Google Scholar] [CrossRef]
- Hu, Q.; Yin, L.; Hartmann, R.W. Aldosterone Synthase Inhibitors as Promising Treatments for Mineralocorticoid Dependent Cardiovascular and Renal Diseases. J. Med. Chem. 2014, 57, 5011–5022. [Google Scholar] [CrossRef] [PubMed]
- Chauhan, K.; Singh, P.; Kumar, V.; Shukla, P.K.; Siddiqi, M.I.; Chauhan, P.M. Investigation of Ugi-4CC derived 1H-tetrazol-5-yl-(aryl) methyl piperazinyl-6-fluoro-4-oxo-1,4-dihydroquinoline-3-carboxylic acid: Synthesis, Biology and 3D-QSAR analysis. Eur. J. Med. Chem. 2014, 78, 442–454. [Google Scholar] [CrossRef] [PubMed]
- Shepphird, J.K.; Clark, R.D. A marriage made in torsional space: Using GALAHAD models to drive pharmacophore multiplet searches. J. Comput.-Aided Mol. Des. 2006, 20, 763–771. [Google Scholar] [CrossRef] [PubMed]
- Lucas, S.; Negri, M.; Heim, R.; Zimmer, C.; Hartmann, R.W. Fine-tuning the selectivity of aldosterone synthase inhibitors: Structure-activity and structure-selectivity insights from studies of heteroaryl substituted 1,2,5,6-tetrahydropyrrolo[3,2,1-ij]quinolin-4-one derivatives. J. Med. Chem. 2011, 54, 2307–2319. [Google Scholar] [CrossRef] [PubMed]
- Platania, C.B.; Salomone, S.; Leggio, G.M.; Drago, F.; Bucolo, C. Homology modeling of dopamine D2 and D3 receptors: Molecular dynamics refinement and docking evaluation. PLoS One 2012, 7, e44316. [Google Scholar] [CrossRef] [PubMed]
- Roy, P.P.; Roy, K. Exploring QSAR for CYP11B2 binding affinity and CYP11B2/CYP11B1 selectivity of diverse functional compounds using GFA and G/PLS techniques. J. Enzym. Inhib. Med. Chem. 2010, 25, 354–369. [Google Scholar] [CrossRef]
- Abbaszadegan, M.R.; Hassani, S.; Vakili, R.; Saberi, M.R.; Baradaran-Heravi, A.; A’Rabi, A.; Hashemipour, M.; Razzaghi-Azar, M.; Moaven, O.; Baratian, A.; et al. Two novel mutations in CYP11B1 and modeling the consequent alterations of the translated protein in classic congenital adrenal hyperplasia patients. Endocrine 2013, 44, 212–219. [Google Scholar] [CrossRef] [PubMed]
- Lucas, S.; Heim, R.; Negri, M.; Antes, I.; Ries, C.; Schewe, K.E.; Bisi, A.; Gobbi, S.; Hartmann, R.W. Novel aldosterone synthase inhibitors with extended carbocyclic skeleton by a combined ligand-based and structure-based drug design approach. J. Med. Chem. 2008, 51, 6138–6149. [Google Scholar] [CrossRef] [PubMed]
- Ji, Y.; Shu, M.; Lin, Y.; Wang, Y.; Wang, R.; Hu, Y.; Lin, Z. Combined 3D-QSAR modeling and molecular docking study on azacycles CCR5 antagonists. J. Mol. Struct. 2013, 1045, 35–41. [Google Scholar] [CrossRef]
- Yin, L.; Hu, Q.; Hartmann, R.W. Tetrahydropyrroloquinolinone type dual inhibitors of aromatase/aldosterone synthase as a novel strategy for breast cancer patients with elevated cardiovascular risks. J. Med. Chem. 2013, 56, 460–470. [Google Scholar] [CrossRef] [PubMed]
- Gobbi, S.; Hu, Q.; Negri, M.; Zimmer, C.; Belluti, F.; Rampa, A.; Hartmann, R.; Bisi, A. Modulation of cytochromes P450 with xanthone-based molecules: From aromatase to aldosterone synthase and steroid 11β-hydroxylase inhibition. J. Med. Chem. 2013, 56, 1723–1729. [Google Scholar] [CrossRef] [PubMed]
- Gadhe, C.G.; Kothandan, G.; Cho, S.J. Binding site exploration of CCR5 using in silico methodologies: A 3D-QSAR approach. Arch. Pharm. Res. 2013, 36, 6–31. [Google Scholar] [CrossRef] [PubMed]
- Bhatt, H.G.; Patel, P.K. Pharmacophore modeling, virtual screening and 3D-QSAR studies of 5-tetrahydroquinolinylidine aminoguanidine derivatives as sodium hydrogen exchanger inhibitors. Bioorganic Med. Chem. Lett. 2012, 22, 3758–3765. [Google Scholar] [CrossRef]
- Ai, Y.; Wang, S.T.; Sun, P.H.; Song, F.J. Molecular modeling studies of 4,5-dihydro-1H-pyrazolo[4,3-h] quinazoline derivatives as potent CDK2/Cyclin A inhibitors using 3D-QSAR and docking. Int. J. Mol. Sci. 2010, 11, 3705–3724. [Google Scholar] [CrossRef] [PubMed]
- Ding, W.; Sun, M.; Luo, S.; Xu, T.; Cao, Y.; Yan, X.; Wang, Y. A 3D QSAR study of betulinic acid derivatives as anti-tumor agents using topomer CoMFA: Model building studies and experimental verification. Molecules 2013, 18, 10228–10241. [Google Scholar] [CrossRef] [PubMed]
- Almerico, A.M.; Tutone, M.; Pantano, L.; Lauria, A. A3 adenosine receptor: Homology modeling and 3D-QSAR studies. J. Mol. Graph. Model. 2013, 42, 60–72. [Google Scholar] [CrossRef] [PubMed]
- Balupuri, A.; Gadhe, C.G.; Balasubramanian, P.K.; Kothandan, G.; Cho, S.J. In silico study on indole derivatives as anti HIV-1 agents: A combined docking, molecular dynamics and 3D-QSAR study. Arch. Pharmacal Res. 2013, 37, 1001–1015. [Google Scholar] [CrossRef]
- Parulekar, R.S.; Barage, S.H.; Jalkute, C.B.; Dhanavade, M.J.; Fandilolu, P.M.; Sonawane, K.D. Homology modeling, molecular docking and DNA binding studies of nucleotide excision repair UvrC protein from M. tuberculosis. Protein J. 2013, 32, 467–476. [Google Scholar] [CrossRef] [PubMed]
- Shen, J.; Zhang, W.; Fang, H.; Perkins, R.; Tong, W.; Hong, H. Homology modeling, molecular docking, and molecular dynamics simulations elucidated alpha-fetoprotein binding modes. BMC Bioinform. 2013, 14 (Suppl. 14). [Google Scholar] [CrossRef]
- Yang, W.; Shu, M.; Wang, Y.; Wang, R.; Hu, Y.; Meng, L.; Lin, Z. 3D-QSAR and docking studies of 3-Pyridine heterocyclic derivatives as potent PI3K/mTOR inhibitors. J. Mol. Struct. 2013, 1054–1055, 107–116. [Google Scholar] [CrossRef]
- Richmond, N.J.; Abrams, C.A.; Wolohan, P.R.; Abrahamian, E.; Willett, P.; Clark, R.D. GALAHAD: 1. Pharmacophore identification by hypermolecular alignment of ligands in 3D. J. Comput.-Aided Mol. Des. 2006, 20, 567–587. [Google Scholar] [CrossRef] [PubMed]
- Liu, M.; Wu, Q.S.; Hu, W.X. Pharmacophore Screening on Piperidinecarboxamides Derivatives Based on GALAHAD and CoMFA Models. Chin. J. Chem. 2011, 29, 1075–1083. [Google Scholar] [CrossRef]
- Xiang, Y.; Hou, Z.; Zhang, Z. Pharmacophore and QSAR studies to design novel histone deacetylase 2 inhibitors. Chem. Biol. Drug Des. 2012, 79, 760–770. [Google Scholar] [CrossRef] [PubMed]
- Caballero, J. 3D-QSAR (CoMFA and CoMSIA) and pharmacophore (GALAHAD) studies on the differential inhibition of aldose reductase by flavonoid compounds. J. Mol. Graph. Model. 2010, 29, 363–371. [Google Scholar] [CrossRef] [PubMed]
- Arooj, M.; Thangapandian, S.; John, S.; Hwang, S.; Park, J.K.; Lee, K.W. 3D QSAR pharmacophore modeling, in silico screening, and density functional theory (DFT) approaches for identification of human chymase inhibitors. Int. J. Mol. Sci. 2011, 12, 9236–9264. [Google Scholar] [CrossRef] [PubMed]
- Amnerkar, N.D.; Bhusari, K.P. Synthesis, anticonvulsant activity and 3D-QSAR study of some prop-2-eneamido and 1-acetyl-pyrazolin derivatives of aminobenzothiazole. Eur. J. Med. Chem. 2010, 45, 149–159. [Google Scholar] [CrossRef] [PubMed]
- Cao, R.; Guan, X.; Shi, B.; Chen, Z.; Ren, Z.; Peng, W. Design, synthesis and 3D-QSAR of β-carboline derivatives as potent antitumor agents. Eur. J. Med. Chem. 2010, 45, 2503–2515. [Google Scholar] [CrossRef] [PubMed]
- Cvijetic, I.N.; Zizak, Z.P.; Stanojkovic, T.P.; Juranic, Z.D.; Terzic, N.; Opsenica, I.M.; Opsenica, D.M.; Jurani, I.O.; Drakuli, B.J. An alignment independent 3D QSAR study of the antiproliferative activity of 1,2,4,5-tetraoxanes. Eur. J. Med. Chem. 2010, 45, 4570–4577. [Google Scholar] [CrossRef] [PubMed]
- Debnath, U.; Verma, S.; Jain, S.; Katti, S.B.; Prabhakar, Y.S. Pyridones as NNRTIs against HIV-1 mutants: 3D-QSAR and protein informatics. J. Comput.-Aided Mol. Des. 2013, 27, 637–654. [Google Scholar] [CrossRef] [PubMed]
- Fernandez, D.; Ortega-Castro, J.; Frau, J. Human farnesyl pyrophosphate synthase inhibition by nitrogen bisphosphonates: A 3D-QSAR study. J. Comput.-Aided Mol. Des. 2013, 27, 739–754. [Google Scholar] [CrossRef] [PubMed]
- NCBI. National Center for Biotechnology Information Search database. Available online: http://www.wip.ncbi.nlm.nih.gov/ (accessed on 3 October 2013).
- Sample Availability: Samples of the all compounds are available from the authors.
© 2015 by the authors. Licensee MDPI, Basel, Switzerland. This article is an open access article distributed under the terms and conditions of the Creative Commons Attribution license ( http://creativecommons.org/licenses/by/4.0/).
Share and Cite
Yu, R.; Wang, J.; Wang, R.; Lin, Y.; Hu, Y.; Wang, Y.; Shu, M.; Lin, Z. Combined Pharmacophore Modeling, 3D-QSAR, Homology Modeling and Docking Studies on CYP11B1 Inhibitors. Molecules 2015, 20, 1014-1030. https://doi.org/10.3390/molecules20011014
Yu R, Wang J, Wang R, Lin Y, Hu Y, Wang Y, Shu M, Lin Z. Combined Pharmacophore Modeling, 3D-QSAR, Homology Modeling and Docking Studies on CYP11B1 Inhibitors. Molecules. 2015; 20(1):1014-1030. https://doi.org/10.3390/molecules20011014
Chicago/Turabian StyleYu, Rui, Juan Wang, Rui Wang, Yong Lin, Yong Hu, Yuanqiang Wang, Mao Shu, and Zhihua Lin. 2015. "Combined Pharmacophore Modeling, 3D-QSAR, Homology Modeling and Docking Studies on CYP11B1 Inhibitors" Molecules 20, no. 1: 1014-1030. https://doi.org/10.3390/molecules20011014