Article

Chemical Composition and Antioxidant Characteristic of Traditional and Industrial Zhenjiang Aromatic Vinegars during the Aging Process

1
State Key Laboratory of Food Nutrition and Safety, Key Laboratory of Industrial Fermentation Microbiology, Ministry of Education, Tianjin Engineering Research Center of Microbial Metabolism and Fermentation Process Control, College of Biotechnology, Tianjin University of Science and Technology, Tianjin 300457, China
2
Jiangsu Hengshun Vinegar Industry Co., Ltd., Zhenjiang 212143, China
*
Authors to whom correspondence should be addressed.
These authors contributed equally to this paper.
Molecules 2018, 23(11), 2949; https://doi.org/10.3390/molecules23112949
Submission received: 30 September 2018 / Revised: 9 November 2018 / Accepted: 9 November 2018 / Published: 12 November 2018
(This article belongs to the Special Issue Natural Products Used as Foods and Food Ingredients)

Abstract

:
Zhenjiang aromatic vinegar (ZAV) is one of the well-known fermented condiments in China, which is produced by solid-state fermentation. It can be classified into traditional Zhenjiang aromatic vinegar (TZAV) and industrial Zhenjiang aromatic vinegar (IZAV) because of different production methods. The purpose of the study was to evaluate the variations and differences on chemical compositions and antioxidant activities of TZAV and IZAV during the aging process. The proximate composition, organic acids content, total phenolic content (TPC), total flavonoid content (TFC), total antioxidant activity (TAA) and phenolic compounds composition of TZAV and IZAV were detected during the aging process. Organic acids contents, TPC, TFC, TAA and phenolic compounds contents in ZAV were increased during the aging process. Acetic acid, lactic acid and pyroglutamic acid in ZAV were major organic acids. With the extension of aging time, TZAV and IZAV had similar proximate compositions and organic acids content. The values of TPC, TFC and TAA were higher in TZAV than in IZAV when aging is more than 3 years. Rutin and p-coumaric acid were detected in TZAV but not in IZAV. In principal component analysis (PCA), TZAV and IZAV can be divided into two groups according to their phenolic compounds composition. These findings provide references for evaluating TZAV and IZAV on the basis of their characterizations.

1. Introduction

Vinegar has been used as an acid condiment for thousands of years [1]. In European countries, liquid-state fermentation techniques are widely used for vinegar production. But in Asian countries, especially China and Japan, most vinegars are produced by typical solid-state fermentation techniques [2,3,4]. Based on the differences of raw materials, vinegars can be divided into grain vinegars and fruit vinegars. Chinese vinegar is produced from cereals and its manufacturing process mainly includes saccharification, alcohol fermentation, solid-state acetic acid fermentation, leaching, decoction and aging [5,6].
Zhenjiang aromatic vinegar (ZAV) is one of the famous Chinese vinegars, which is generally produced from glutinous rice, wheat bran, and rice hulls through solid-state fermentation [7,8]. ZAV is rich in organic acids, sugar, protein, amino acids and other nutrient and flavor ingredients, which largely affect its taste characteristics and organoleptic quality [9,10]. Furthermore, abundant antioxidant compounds, involving polyphenols, flavonoids, and melanoidins, were found in ZAV. These compounds play crucial roles in the prevention of diseases and contribute benefits to human health [11,12,13]. Flavor, nutrient and bioactive compounds in vinegars are mainly derived from raw materials and are accumulated through microbial metabolism during the production process. Complex chemical reactions and physical changes occur during the aging process, which can improve the taste and functional characteristics of vinegar [14,15,16,17].
There are mainly two vinegar manufacturing methods: the traditional method and the industrial method. The traditional method is a slow and complicated fermentation process, which are controlled empirically to facilitate microbial growth and accumulation of components in vinegar. The industrial method is a mechanical and fast production procedure. Advanced techniques and equipment are used in the industrial method, which can improve productivity and reduce production cost. Traditional Zhenjiang aromatic vinegar (TZAV) and industrial Zhenjiang aromatic vinegar (IZAV) are produced by these two production methods (Figure 1). With a mixture of cooked glutinous rice and unique Mai Qu in ceramic pots, starch saccharification and alcohol fermentation of TZAV are performed simultaneously. The acetic acid fermentation procedure requires experienced technicians turning over the Pei regularly. After leaching and decoction, TZAV is sealed and stored in ceramic pots on spacious ground for aging. In another manufacturing method, the raw materials of IZAV are crushed and cooked. Starch saccharification is accelerated by glucoamylase and then followed by alcohol fermentation in a large fermentation tank [18,19]. Subsequently, an automatic machine is used to turn over the Pei during acetic acid fermentation. Leaching and decoction are performed by equipment, and aging is conducted with mechanical devices in large jars [20]. Several authors have studied the characteristics of liquid-state fermentation vinegars, such as balsamic vinegar and grape wine vinegar, which are produced by two kinds of techniques (the traditional method and the industrial method). The two kinds of vinegars can be discriminated according to their chemical compositions and functional properties [21,22,23,24,25,26,27]. However, the differences in compositions and properties of solid-state fermentation vinegars, which were produced by traditional and industrial methods, have been rarely explored.
In this study, the proximate composition, organic acids content, total phenolic content, total flavonoids content, phenolic components and antioxidant activities of TZAV and IZAV were determined during the aging process. Principal component analysis (PCA) was performed on the composition of phenolic compounds to obtain information about the differences between TZAV and IZAV. The variations and differences were firstly evaluated on the chemical composition and antioxidant activities of TZAV and IZAV during the aging process. These results contribute to a theoretical basis for the effects of production techniques on the quality of ZAV, and provide references for the advancement of mechanical production procedures and manufacturing process standardization in ZAV.

2. Results and Discussion

2.1. Proximate Composition of Traditional Zhenjiang Aromatic Vinegar (TZAV) and Industrial Zhenjiang Aromatic Vinegar (IZAV)

The proximate composition of ZAV samples is summarized in Table 1. pH values in all ZAV samples varied from 3.38 to 3.62, which were in line with previous studies [28,29]. pH values were lower in IZAV samples than in TZAV samples. Total acidity is an important indicator for assessing the quality of vinegar [30]. All ZAV samples complied with regulatory limits for total acidity (Chinese National Standard: GB/T 18623-2011; total acidity ≥ 4.50 represent as qualified). There was no significant difference in the average values of total acidity between TZAV and IZAV samples (p > 0.05). Soluble solid content is the reflection of ingredients contained in liquid food, which has a significant influence on the taste of the food [31,32]. In this study, the content of soluble solid in ZAV samples ranged from 12.23 ± 0.00 to 23.02 ± 0.00 g/100 mL, which increased during 5 years of aging times. The average content of soluble solid were significantly higher in TZAV samples than in IZAV samples (p < 0.05), which is because longer fermentation time was possibly conducive to the accumulation of components in vinegar. Carbohydrates, fats and proteins are three main nutrients in foods, which provide energy sources for human body and constitute the structure and content of many cells [33,34]. Reducing sugars and amino nitrogen play an important role in the evaluation of quality in foods [35]. The content of protein in ZAV samples ranged from 0.86 ± 0.01 to 1.06 ± 0.03 g/100 mL. There was no significant difference between the average amount of protein in TZAV and those in IZAV (p > 0.05). The content of crude fat, amino nitrogen and carbohydrate in ZAV samples varied from 0.15 ± 0.03 to 0.44 ± 0.02 g/100 mL, from 0.21 ± 0.01 to 0.36 ± 0.00 g/100 mL and from 3.52 ± 0.12 to 5.36 ± 0.00 g/100 mL, respectively. The average amounts of amino nitrogen, crude fat and carbohydrate were significantly higher in TZAV samples than in IZAV samples (p < 0.05). The reducing sugar content of IZAV samples decreased gradually in 5 years of the aging process, which was in accordance with the finding of Wang et al. [36]. The average amount of reducing sugar was significantly higher in TZAV samples than in IZAV samples (p < 0.05). These findings suggest that the aging stage could enhance the quality of vinegar products. Even though IZAV samples had lower average content in many ingredients than TZAV samples, proximate compositions in IZAV samples are similar to those in TZAV samples with the extension of aging time.

2.2. Organic Acid Contents in TZAV and IZAV

Organic acids are important components of vinegar, which contribute to the specific flavor and organoleptic property of vinegars [37,38]. As shown in Table 2, the main organic acids of ZAV samples were detected by the high-performance liquid chromatography (HPLC) method. In ZAV samples, acetic acid, lactic acid and pyroglutamic acid were three major organic acids and represented more than 90% of the total organic acids. Acetic acid contents ranged from 1.58 ± 0.08 to 4.92 ± 0.17 g/100 mL, which mainly contributed to sourness in ZAV. The average content of acetic acid in TZAV samples was significantly higher than that in IZAV samples (p < 0.05). Lactic acid and pyroglutamic acid contents varied from 1.16 ± 0.05 to 3.41 ± 0.06 g/100 mL and from 0.22 ± 0.01 to 2.26 ± 0.17 g/100 mL, respectively, which increased with the extension of aging time. These values were consistent with values obtained by Xu et al., who reported the contents of acetic acid and lactic acid in ZAV [39]. In addition, TZAV-3 and TZAV-4 had higher succinic acid content than other samples. Malic acid, oxalic acid and tartaric acid contents varied from 0.01 ± 0.00 to 0.34 ± 0.01 g/100 mL, which presented lower levels in comparison to other organic acids. These results indicate that appropriate aging times could improve organic acid contents in ZAV samples, especially lactic acid and pyroglutamic acid, which belong to non-volatile acids. The accumulation of non-volatile acids could neutralize the pungent odor and harsh taste in ZAV.

2.3. Total Phenolic, Flavonoid Contents and Antioxidant Activities in TZAV and IZAV

Polyphenols and flavonoids are important bioactive compounds in foods, which have a significant contribution to defend against oxidative stress [40,41,42]. Table 3 shows total phenolic content (TPC) and total flavonoid content (TFC) in TZAV and IZAV. The lowest TPC and TFC were 2.07 ± 0.01 mg gallic acids equivalents (GAE)/mL and 1.21 ± 0.05 mg rutin equivalents (RE) /mL, respectively, which were determined in IZAV-1. The values of TPC and TFC in TZAV samples increased by 159.0% and 246.4% during 5 years of aging process, and TZAV-3 had the highest TPC and TFC (6.45 ± 0.19 mg GAE/mL and 5.44 ± 0.09 mg RE/mL). The values of TPC and TFC in IZAV samples increased by 96.6% and 47.9% during 6 years of aging process, and the highest TPC and TFC was determined in IZAV-8 (4.07 ± 0.11 mg GAE/mL and 3.00 ± 0.07 mg RE/mL). A tendency was obvious that values of TPC and TFC in TZAV and IZAV samples were increased with the extension of aging time, whereas these values decreased slowly in the later stage of the aging process. The average contents of TPC and TFC were higher in TZAV samples than in IZAV samples (TPC values: p < 0.05; TFC values: p > 0.05). There are differences in TPC and TFC between our results in ZAV and other results in varied vinegars due to different raw materials and production procedures. The TPC of red wine vinegars, which produced in barrels made from different woods, varied from 1006.19 to 1882.7 mg/L. The highest TPC of red wine vinegar was measured in Chestnut barrel [43]. In Shanxi aged vinegars, TPC and TFC contents measured 0.96 to 5.80 mg GAE/mL and 0.33 to 4.50 mg RE/mL, respectively, and increased with the extension of aging time [44]. TPC in cherry vinegars, which obtained by three varieties of cherry and two fermentation methods, ranged from 3.26 to 7.57 mg GAE/mL [45]. Verzelloni et al. [46] have shown that TPC and TFC ranged from 1.99 to 3.72 mg catechin/mL and from 2.29 to 3.34 mg catechin/mL in balsamic vinegars.
The antioxidant activities of vinegar mainly derived from its bioactive compounds [47,48,49]. Several studies have suggested that total antioxidant activity (TAA) of vinegars was highly correlated with TPC and TFC [50,51,52]. TAA in ZAV samples was investigated by 2,2-diphenyl-1-picrylhydrazyl (DPPH), ferric reducing antioxidant power (FRAP) and 2,2′-azino-bis(3-ethylbenzthiazoline-6-sulfonic acid) (ABTS) assays (Table 3). Values of DPPH, FRAP and ABTS in IZAV-1 were 17.82 ± 1.69, 9.25 ± 0.77 and 10.47 ± 1.02 mmol Trolox equivalent antioxidant capacity (TEAC)/L, respectively, which were lower than those in other samples. TAA values of TZAV and IZAV samples, which were measured by FRAP and ABTS assays, were similar at the beginning of aging processs. With the extension of aging time, the values of TAA were significant higher in TZAV samples than in IZAV samples except for DPPH values (p < 0.05). This difference could be due to the different reaction principles among DPPH, FRAP and ABTS assay [53,54]. In ZAV, the values of TAA were increased during 5 years of aging process, and then decreased slowly with the extension of aging time. This tendency was in line with TPC and TFC in ZAV samples, which indicated that the antioxidant power in vinegars was influenced by their TPC and TFC [55]. During the aging process, phenolic compounds interact with macromolecules, such as melanoidin, protein and polysaccharide, result in the formation of precipitates in vinegar. The decline in TPC, TFC and TAA of ZAV possibly due to precipitation of phenolic compounds in the later stage of the aging process [56,57]. The average antioxidant activity values of traditional and industrial Turkey grape vinegars (unaged) measured by ABTS assay were 13.50 and 10.37 mmol TEAC/L, respectively, which were consistent with our result [27]. The TAA of cherry vinegars was measured by Kawa-Rygielska et al. [45]. The result showed that TAA of coral-fruit cherry vinegar was 10.23 mmol TE/mL (DPPH method), and 3.6 mmol TE/mL (FRAP method), which were higher than other cornelian cherry vinegars. Moreover, the relationships between TAA of TZAV and IZAV and their TPC and TFC were shown in Table 4. In TZAV samples, the positive correlation was found between TAA and TPC evaluated by DPPH, FRAP and ABTS assays (r = 0.963, r = 0.998 and r = 0.987, respectively; p < 0.05). The TAA of IZAV was positively correlated with TFC (r = 0.985, r = 0.997 and r = 0.981, respectively; p < 0.05) when detected by DPPH, FRAP and ABTS assays. Similarly, TPC and TFC of IZAV samples were also significantly correlated with their TAA measured by DPPH, FRAP and ABTS assays. In general, these results indicate that TPC, TFC and TAA of ZAV were increased during the aging process, and TZAV samples were associated with higher values of TPC, TFC and TAA when the aging times more than 3 years. During the aging process, TPC and TFC have significant correlation with TAA in TZAV and IZAV samples.

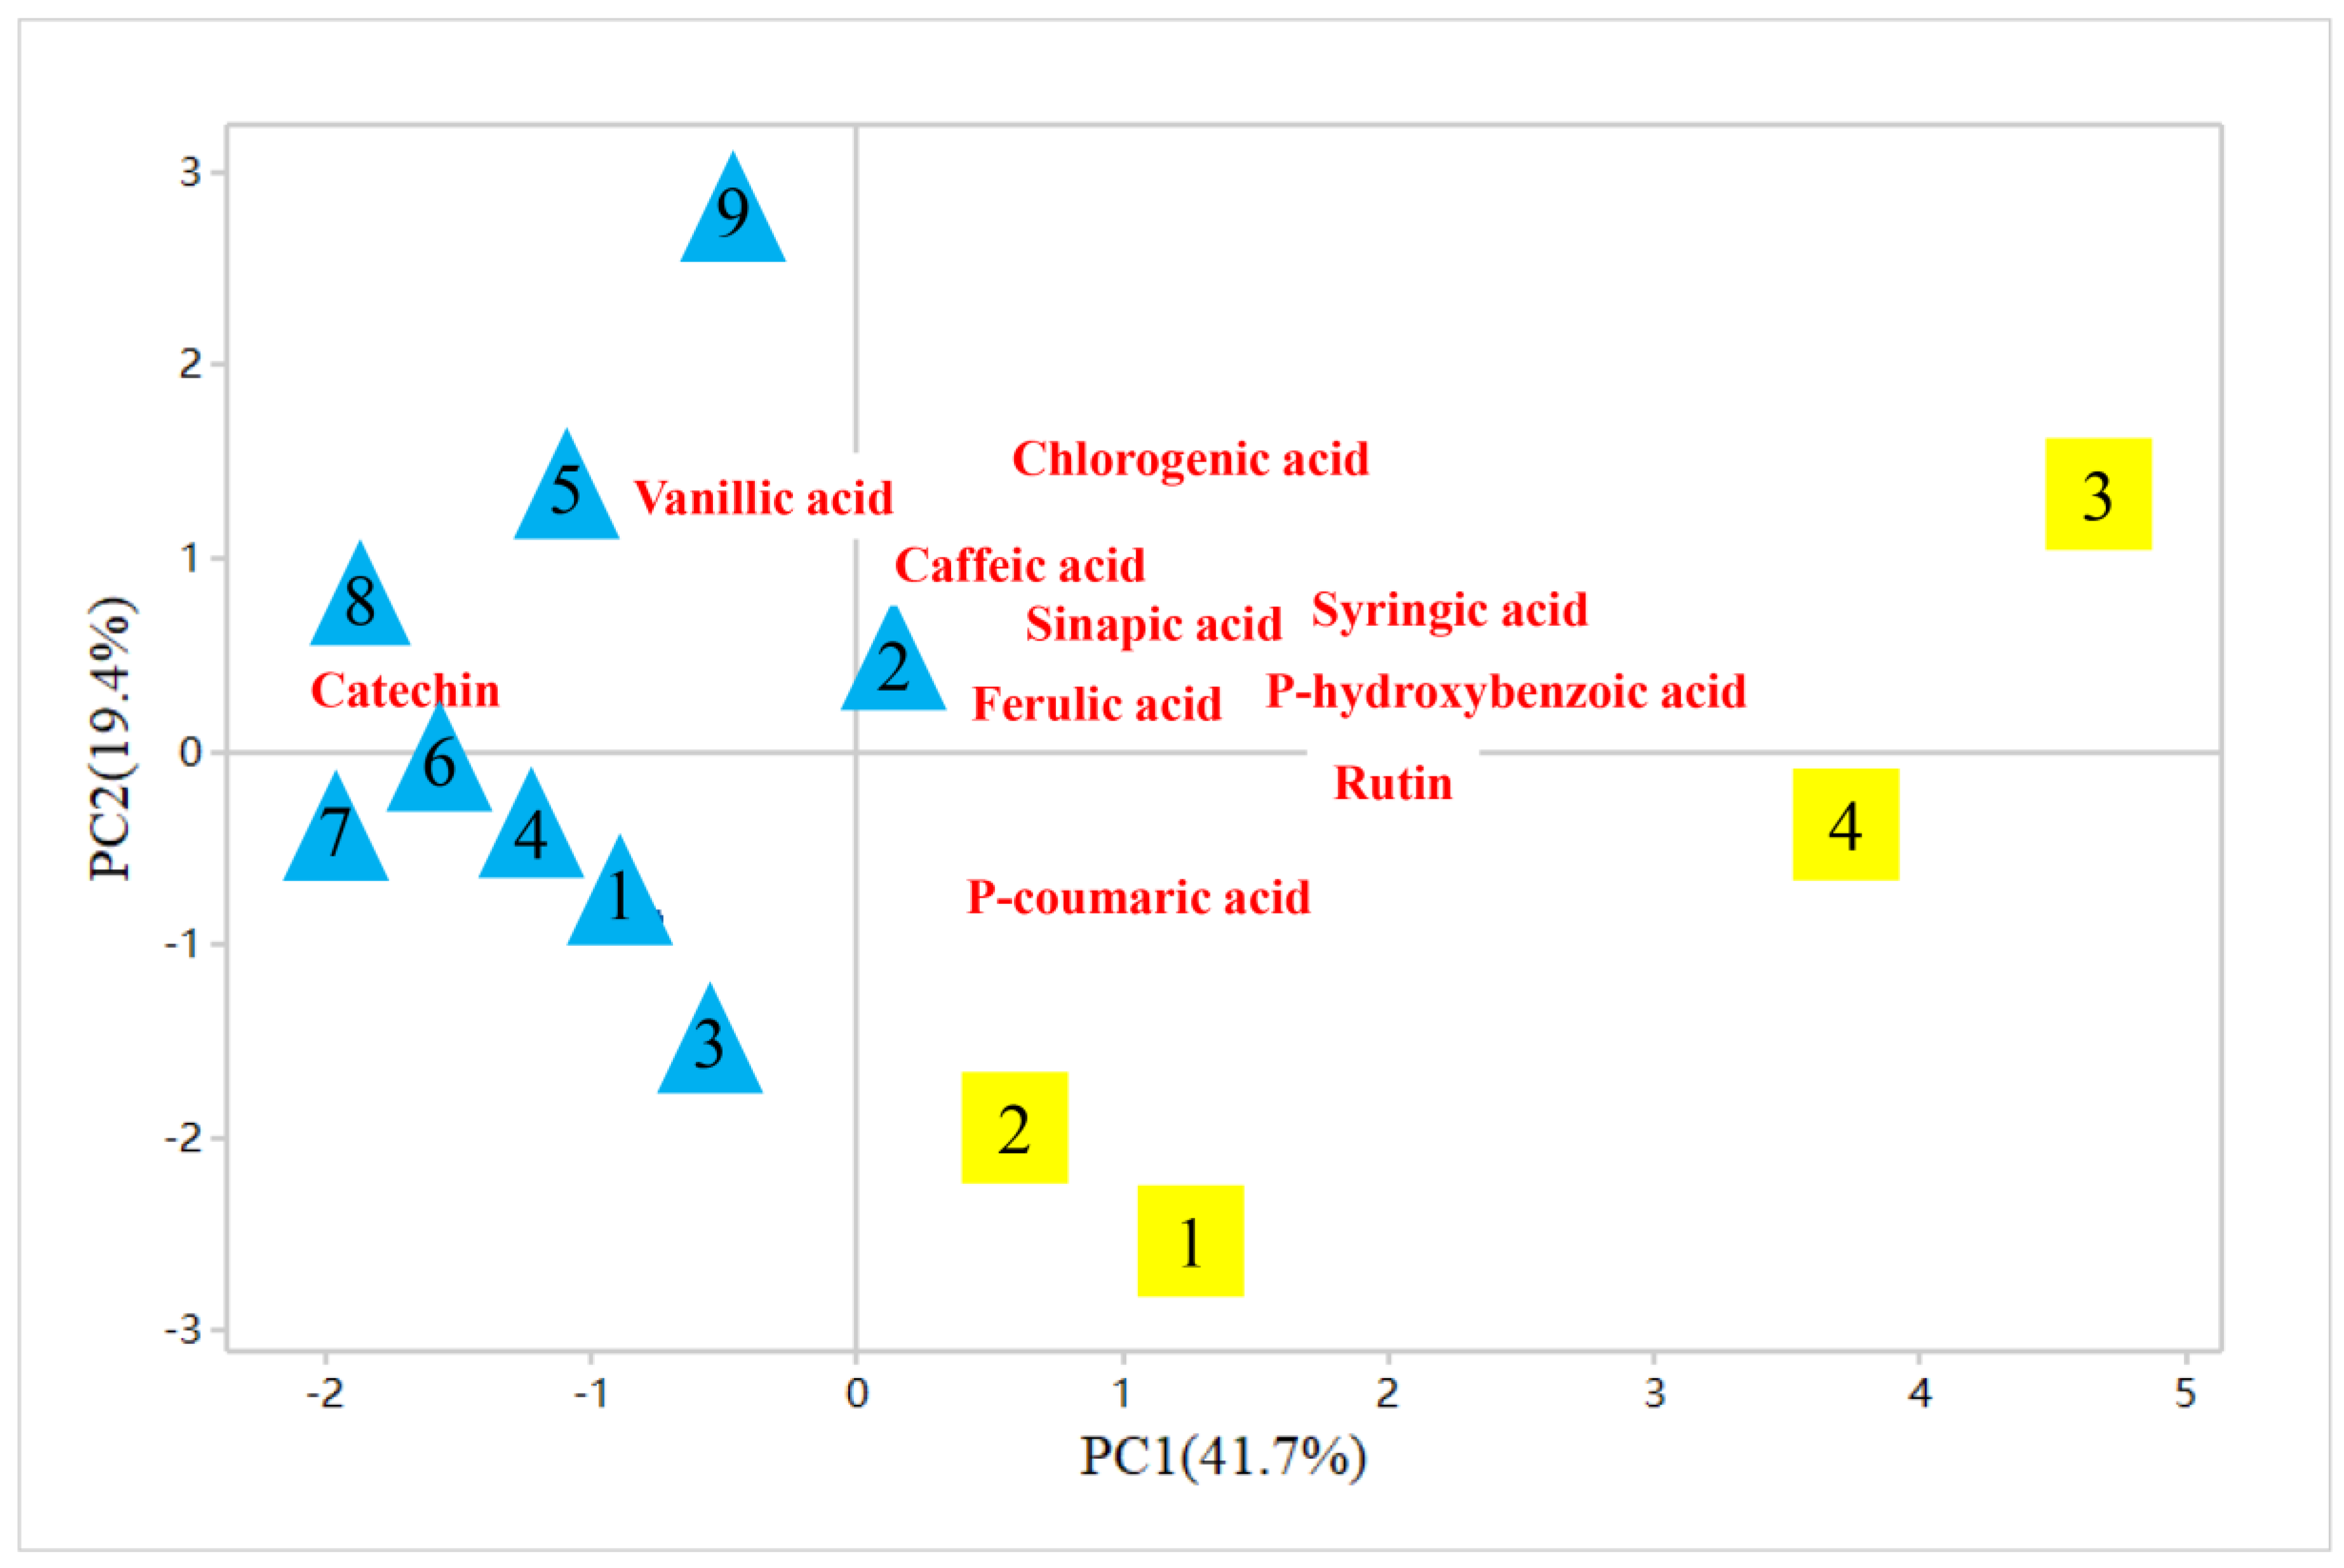
2.4. Phenolic Compounds and Their Contributions to Total Antioxidant Activity (TAA) in TZAV and IZAV

Ten phenolic compounds, including p-hydroxybenzoic acid, chlorogenic acid, caffeic acid, vanillic acid, syringic acid, catechin, p-coumaric acid, ferulic acid, sinapic acid and rutin were separated and quantified by the HPLC method (Figure 2). The distributions of phenolic compounds in extracts obtained from ZAV samples were presented in Table 5. Total phenolic contents in IZAV samples ranged from 84.36 ± 1.86 to 114.06 ± 3.57 mg/L, and those in TZAV samples ranged from 81.08 ± 3.94 to 133.92 ± 0.63 mg/L. Total phenolic contents by the HPLC method were significantly lower than those by Folin–Ciocalteu and colorimetric assays (p < 0.05), because more phenolic compounds were determined by Folin–Ciocalteu and colorimetric assays. In IZAV samples, rutin and p-coumaric acid were not detected or at lower levels than the limit of detection (LOD) of the method (0.04 and 0.02 μg/mL, respectively). Catechin in the ZAV samples contributed to 29.08–74.89% of total phenolic contents and decreased with the aging time. Catechin, syringic acid, p-hydroxybenzoic acid and chlorogenic acid were major phenolic compounds in TZAV samples. Catechin, vanillic acid, chlorogenic acid and caffeic acid were the main phenolic acids in IZAV samples. TZAV had higher average amounts of p-hydroxybenzoic acid and Syringic acid (7.46 ± 2.54 mg/L and 12.81 ± 11.37 mg/L) than IZAV (4.15 ± 1.75 mg/L and 3.08 ± 1.27 mg/L) (p < 0.05). The average contents of vanillic acid and catechin in IZAV (7.62 ± 2.07 mg/L and 64.17 ± 8.71 mg/L) was significantly higher than that in TZAV (5.76 ± 1.06 mg/L and 41.35 ± 5.56 mg/L) (p < 0.05). Abundant phenolic compounds also were detected in other vinegars. Bakir et al. [58] reported that apple vinegars contained abundant phenolic compounds, including gallic acid, p-hydroxybenzoic acid, catechin, syringic acid, p-coumaric acid and caffeic acid. Fourteen kinds of anthocyanin compounds were identified in strawberry vinegar, which pelargonidin 3-glucoside and pelargonidin 3-rutinoside were predominant phenolic compounds [59]. Yu et al. [60] found that ferulic acid, p-coumaric acid, protocatechuic acid, caffeic acid, vanillic acid and gallic acid were detected in oat and buckwheat vinegar, and contents of ferulic acid, p-coumaric acid, protocatechuic acid, caffeic acid and gallic acid were higher in oat vinegar than in buckwheat vinegar. Fruits and cereals are rich in phenolic compounds, which present in two forms: soluble-free and insoluble-bound. Soluble-free is a major form of phenolic compound in fruits, whereas a majority of phenolic compounds in cereals belong to the insoluble-bound form [61,62]. This is the reason why most of fruit vinegars possess more abundant phenolic compounds than cereal vinegars. Bound phenolics could be released by microbial catalysis during the production process of vinegar [63]. Thus, production techniques have great effects on phenolic compounds composition of vinegars.
Moreover, differences between TZAV and IZAV samples were evident from the PCA on compositions of phenolic compounds (Figure 3). Two principal components (PCs) expressed 61.1% of total variance. TZAV samples were located in the positive part of PC1, which showed the most discriminating variables 41.7% of the variance and positively associated with rutin, syringic acid, p-hydroxybenzoic acid and sinapic acid. IZAV samples were located in the negative part of PC1, which was associated with higher contents of vanillic acid and catechin. These results indicate that TZAV and IZAV samples can be divided according to different compositions and concentrations of phenolic compounds. The relationships between TAA of TZAV and IZAV samples and their main phenolic compounds contents are shown in Table 6. The results showed that syringic acid, sinapic acid and rutin contents of TZAV were positively correlated with TAA measured by DPPH, FRAP and ABTS assays (p < 0.05). In addition, DPPH values of TZAV were also positively correlated with their chlorogenic acid contents (r = 0.960, p < 0.05). A negative correlation was found between p-coumaric acid contents of TZAV samples and their ABTS values (r = −0.971, p < 0.05). In IZAV samples, caffeic acid contents were positively correlated with TAA measured by FRAP assays (p < 0.05). However, p-hydroxybenzoic acid contents had significantly negative correlation with TAA measured by DPPH, FRAP and ABTS assays (p < 0.05). Alonso et al. [64] analyzed the correlation between the TAA and phenolic compounds in sherry vinegars aged in wood and without wood. The results showed that TAA of sherry vinegars aged in wood was positively correlated with caffeic acid content whereas it was negatively correlated with ferulic acid contents. These results were opposite to the correlation between TAA of sherry vinegars aged without wood and their caffeic acid and ferulic acid contents. Xie et al. [44] reported the relationship between TAA and phenolic compounds in Shanxi aged vinegars during the brewing process. The results showed that TAA of Shanxi aged vinegars measured by ABTS and FRAP assays was positively correlated with their gallic acid, catechin and chlorogenic acid contents, whereas they were negatively correlated with their ferulic acid contents. These results indicate that phenolic compounds in TZAV and IZAV samples exert different contributions to TAA.

3. Materials and Methods

3.1. Samples and Reagents

Samples were collected by using sterilized cylinder-shaped samplers. In the Vinegar Culture Museum of China Zhenjiang (Jiangsu, China), TZAV was not collected at every aging year in ceramic aging pots. IZAV samples were collected from large glass aging jars in Jiangsu Hengshun Vinegar Industry Co., Ltd. (Jiangsu, China). TZAV1, TZAV-2, TZAV-3 and TZAV-4 represented samples with aging time of 0, 2, 5 and 7 years. IZAV1-9 represented samples with aging time of 0, 1, 2, 3, 4, 4.5, 5, 6 and 7 years. Every kind of vinegar was collected from three pots or jars at the same aging time. In total, 13 kinds of samples of ZAV were analyzed.
HPLC standards of organic acids and phenolic compounds were purchased from Sigma Aldrich (Deisenhofen, Germany). Folin–Ciocalteu reagent, DPPH, gallic acid and rutin were obtained from Sinopharm Chemical Reagent Co., Ltd. (Shanghai, China). Total antioxidant capacity assay kits with ABTS and FRAP were purchased from the Beyotime Institute of Biotechnology (Shanghai, China).

3.2. Proximate Compositions

pH in ZAV samples was measured with a pH meter (Metrohm, Herisau, Switzerland). Total acidity of ZAV samples was determined by methods of the Chinese National Standard (GB/T 12456-2008). The protein content in ZAV was calculated by the Bradford method [65]. Contents of soluble solid, crude fat, reducing sugar and amino nitrogen in ZAV were determined according to the methods of the Chinese National Standard (GB/T 18187-2000; GB/T 5009.6-2016; GB/T 5009.7-2016; GB/T 5009.235-2016). Carbohydrate in ZAV sample was converted into reducing sugar after acid hydrolysis: 5 mL of sample was mixed with 5mL of HCl (21%, w/v). After 15 min at 70 °C, the mixture was neutralized with NaOH solution. The treated sample was determined by GB 5009.7-2016.

3.3. Analysis of Organic Acids

The contents of organic acids in ZAV samples were analyzed by an Agilent 1260 HPLC system (Agilent Corp., Karlsruhe, Germany); 2 mL of diluted samples was centrifuged at 6000 g for 10 min, and then the supernatant was filtered through 0.45 μm membrane. The HPLC working parameters were as follows: the chromatography column (Aminex HPX-87H lon Exculsion Column, 7.8 × 300 mm i.d., 5 μm), 0.6 mL/min of flow rate, 30 °C of column temperature, 20 μL of injection volume, the H2O containing 0.049% H2SO4 (w/v) as the mobile phase. Detection was performed by measuring the ultraviolet (UV) absorption at 215 nm. Identification of organic acids was conducted by comparing retention times and ultraviolet-visible (UV-Vis) data of 7 kinds of organic acid standards. A standard curve was obtained according to 8 concentration levels of organic acid standard. Concentrations of organic acids were quantified by their corresponding standard curves. The coefficients of all organic acids in standard curves were higher than 0.999 (Table S1). The precision of the HPLC methods were tested by measuring samples at 3 concentration levels for 6 times. The relative standard deviations (RSD) did not exceed 5%. The accuracy of the HPLC methods were checked by measuring standard addition recovery of samples. The values of standard addition recovery in the organic acids method were ranged from 92.1% to 98.5%. In addition, LOD and limits of detection quantitation (LOQ) of organic acids ranged from 0.01 to 0.03 μg/mL and 0.03 to 0.12 μg/mL, respectively.

3.4. Measurement of Total Phenolic and Flavonoid Contents

The TPC of the ZAV samples was determined by the Folin-Ciocalteu method. Every sample was diluted 10 times with distilled water, and 0.2 mL of diluted sample was mixed with 0.8 mL of Folin–Ciocalteu reagent. After 3–5 min, 1.5 mL of 10% Na2CO3 (w/v) solution was mixed and then distilled water was added to obtain a final volume of 10 mL. The mixture was measured at 765 nm after 120 min in the dark. Gallic acid was used as a reference, and the results were expressed as mg GAE/mL.
The TFC of ZAV samples was measured through a colorimetric assay. Every sample was neutralized with NaOH solution (2%, w/v) and diluted 10 times with distilled water. 2 mL of diluted sample, 8 mL of distilled water and 1 mL of NaNO2 solution (5%, w/v) were mixed. After 6 min, 1 mL of Al(NO3)3 solution (5%, w/v) was added and stood for 6 min. Finally, 4 mL of NaOH solution (20%, w/v) was added and made up to 25 mL with distilled water. After 15 min, the absorbance was measured at 510 nm. Rutin was used as a reference, and TFC was expressed as mg RE/mL.

3.5. Determination of TAA

The antioxidant activities of ZAV samples were evaluated by the DPPH radical scavenging activity assay. Briefly, 20 μL of diluted samples was mixed sufficiently with 180 μL of DPPH working solution. The mixture was incubated at room temperature for 30 min in the dark. The absorbance was measured at 517 nm with a microplate reader. A calibration curve was prepared with different concentrations of Trolox solutions, and the results were expressed as mmol TEAC/L of vinegar.
The ABTS radical scavenging capacities of ZAV samples were conducted with a Total Antioxidant Capacity Assay Kit. The ABTS radical cation (ABTS+) was generated by mixing an aqueous solution of ABTS and oxidant. These reagents reacted in a ratio of 1:1 (v/v) respectively and were kept to react completely in the dark for 12 h, then diluted to an absorbance of 0.70 ± 0.05 at 414 nm with ethanol. 200 μL ABTS working solution and 10 μL diluted samples were mixed. After 2–6 min in the dark, the absorbance was measured at 414 nm in a microplate reader. Trolox was used as a standard compound. The TAC was expressed as mmol TEAC/L of vinegar.
The reducing abilities of ZAV samples were measured by a Total Antioxidant Capacity Assay Kit with the FRAP method. A working solution was freshly prepared by mixing diluted solution, TPTZ, and detection buffer solution at a ratio of 10:1:1 (v/v/v). 180 μL of FRAP working solution and 5 μL of diluted sample were mixed and then incubated at 37 °C for 5 min. The absorbance was recorded at 593 nm with the microplate reader. Trolox was used as a reference compound. The results were calculated as reported as mmol TEAC/L of vinegar.

3.6. Identification of Phenolic Compositions

Phenolic compositions of ZAV were identified by the HPLC method. Every sample (5 mL) was ultrasonically extracted with 20 mL ethyl acetate three times. The extracts were mixed and evaporated to dry using a rotary evaporation instrument (40 °C). Subsequently, the residue was dissolved in 600 μL of 50% methanol (v/v). The solution was filtered through 0.45 μm membrane and injected into the HPLC system (Agilent Technologies Inc., California, CA, USA). The Phenyl chromatography column (250 mm × 4.6 mm i.d., 5 μm) was obtained from Nano-Micro (Suzhou, China). The following gradient system was used with water/acetic acid (98:2, v/v, solvent A) and water/acetonitrile/acetic acid (73:25:2, v/v/v, solvent B): 0 min, 5% B; 40 min, 30% B; 45 min, 20% B; 50min, 100% B; 51 min 5% B, and then held for 5 min. The flow rate was 1.00 mL/min, column temperature was 40 °C. UV-vis detection wavelengths were 278 nm. Identification of the major phenolic compounds was conducted by comparing retention times and UV-Vis data of phenolic standards. In addition, phenolic compounds were quantified by their corresponding standard curves. The coefficients of all phenolic compounds in standard curves were higher than 0.999 (Table S2). The precision of the HPLC methods were tested by measuring samples at 3 concentration levels 6 times. The relative standard deviations (RSD) did not exceed 5%. The accuracy of the HPLC methods were checked by measuring standard addition recovery of samples. The values of standard addition recovery in phenolic compounds methods ranged from 86.5% to 96.8%. LOD and LOQ of phenolic compounds ranged from 0.01 to 0.05 μg/mL and 0.06 to 0.12 μg/mL, respectively.

3.7. Statistical Analysis

All determinations were performed in triplicate. Results were presented as mean ± standard deviation (S.D.). All statistical analyses were performed in SPSS 24.0 for Windows (SPSS Inc., Chicago, IL, USA). Differences among the groups were tested by one-way analysis of variance (ANOVA) with the Duncan multiple comparison test. The Student’s t-test was used to evaluate difference between mean values of all parameters in TZAV samples and those in IZAV samples. The related correlation analyses were performed with the Pearson’s correlation test. To assess divergence in different values between TZAV and IZAV samples, PCA were performed using Minitab 17.0 (IBM Inc., New York, NY, USA).

4. Conclusions

In this study, the chemical compositions and functional characterizations between TZAV and IZAV samples were analyzed during the aging process. With the extension of aging time, TZAV and IZAV samples had similar proximate compositions and organic acid content. Moreover, the TZAV samples represented more abundant phenolic compounds and stronger antioxidant capacity than the IZAV samples. PCA evaluated the difference between the TZAV and IZAV samples according to compositions and proportions of phenolic compounds. This study proved the production method to have a significant impact on phenolic compounds’ composition and antioxidant capacity in ZAV during the aging process. These results contributed to better comprehension of the compositional and antioxidant characteristics of TZAV and IZAV samples during the aging process. In future, these parameters can be monitored to control the quality of ZAV and improve industrial procedures.

Supplementary Materials

The following are available online, Table S1: Statistical evaluation of the calibration data of organic acids contents by the HPLC method, Table S2: Statistical evaluation of the calibration data of phenolic compound content by the HPLC method.

Author Contributions

Conceptualization, C.Z. and T.X.; Formal analysis, B.Z. and J.Z.; Investigation, P.D. and W.D.; Resources, S.Z. and Y.Y.; Supervision, T.X., Y.Z., M.W. and Y.Y.; Validation, M.W.; Writing—original draft, C.Z.; Writing—review and editing, C.Z. and T.X.

Funding

This research was funded by National Natural Science Foundation of China (81600126, 31671722), the National Key R&D Program of China (2016YFD0400505), Tianjin Municipal Science and Technology Commission (17PTGCCX00190), Rural Affairs Committee of Tianjin (201701180), the Innovative Research Team of Tianjin Municipal Education Commission (TD13-5013), and Tianjin Municipal Education Commission (2017KJ009).

Conflicts of Interest

The authors declare no conflict of interest.

Abbreviations

ABTS2,2′-azino-bis(3-ethylbenzthiazoline-6-sulfonic acid
ANOVAanalysis of variance
DPPH2,2-diphenyl-1-picrylhydrazyl
FRAPferric reducing antioxidant power
GAEgallic acids equivalents
HPLChigh performance liquid chromatography
IZAVindustrial Zhenjiang aromatic vinegar
LODlimits of detection
LOQlimits of detection quantitation
PCprincipal components
PCAprincipal component analysis
RErutin equivalents
TAAtotal antioxidant activity
TEACTrolox equivalent antioxidant capacity
TFCtotal flavonoid content
TPCtotal phenolic content
TEACTrolox equivalent antioxidant capacity
TZAVtraditional Zhenjiang aromatic vinegar
ZAVZhenjiang aromatic vinegar

References

  1. Mas, A.; Torija, M.J.; García-Parrilla, M.C.; Troncoso, A.M. Acetic acid bacteria and the production and quality of wine vinegar. Sci. World J. 2014, 394671. [Google Scholar] [CrossRef] [PubMed]
  2. Tesfaye, W.; Morales, M.L.; García-Parrilla, M.C.; Troncoso, A.M. Wine vinegar: Technology, authenticity and quality evaluation. Trends Food Sci. Technol. 2002, 13, 12–21. [Google Scholar] [CrossRef]
  3. Liu, D.; Zhu, Y.; Beeftink, R.; Ooijkaas, L.; Rinzema, A.; Chen, J.; Tramper, J. Chinese vinegar and its solid-state fermentation process. Food Res. Int. 2004, 20, 407–424. [Google Scholar] [CrossRef]
  4. Nie, Z.; Zheng, Y.; Wang, M.; Han, Y.; Wang, Y.; Luo, J.; Niu, D. Exploring microbial succession and diversity during solid-state fermentation of Tianjin duliu mature vinegar. Bioresour. Technol. 2013, 148, 325–333. [Google Scholar] [CrossRef] [PubMed]
  5. Xu, Q.; Tao, W.; Ao, Z. Antioxidant activity of vinegar melanoidins. Food Chem. 2007, 102, 841–849. [Google Scholar] [CrossRef]
  6. Xu, W.; Xu, Q.; Chen, J.; Lu, Z.; Xia, R.; Li, G.; Xu, Z.; Ma, Y. Ligustrazine formation in Zhenjiang aromatic vinegar: Changes during fermentation and storing process. J. Sci. Food Agric. 2011, 91, 1612–1617. [Google Scholar] [CrossRef] [PubMed]
  7. Liu, J.; Gan, J.; Yu, Y.; Zhu, S.; Yin, L.; Cheng, Y. Effect of laboratory-scale decoction on the antioxidative activity of Zhenjiang aromatic vinegar: The contribution of melanoidins. J. Funct. Foods 2016, 21, 75–86. [Google Scholar] [CrossRef]
  8. Zhou, Z.; Liu, S.; Kong, X.; Ji, Z.; Han, X.; Wu, J.; Mao, J. Elucidation of the aroma compositions of Zhenjiang aromatic vinegar using comprehensive two dimensional gas chromatography coupled to time-of-flight mass spectrometry and gas chromatography-olfactometry. J. Chromatogr. A 2017, 1487, 218–226. [Google Scholar] [CrossRef] [PubMed]
  9. Budak, N.H.; Aykin, E.; Seydim, A.C.; Greene, A.K.; Guzel-Seydim, Z.B. Functional properties of vinegar. J. Food Sci. 2014, 79, 757–764. [Google Scholar] [CrossRef] [PubMed]
  10. Chen, H.; Chen, T.; Giudici, P.; Chen, F. Vinegar functions on health: Constituents, sources, and formation mechanisms. Compr. Rev. Food. Sci. Food Saf. 2016, 15, 1124–1138. [Google Scholar] [CrossRef]
  11. Dávalos, A.; Bartolomé, B.; Gómez-Cordovés, C. Antioxidant properties of commercial grape juices and vinegars. Food Chem. 2005, 93, 325–330. [Google Scholar] [CrossRef]
  12. Verzelloni, E.; Tagliazucchi, D.; Conte, A. Changes in major antioxidant compounds during aging of traditional balsamic vinegar. J. Food Biochem. 2010, 34, 152–171. [Google Scholar] [CrossRef]
  13. Pazuch, C.M.; Siepmann, F.B.; Canan, C.; Colla, E. Vinegar: Functional aspects. Científica 2015, 43, 302–308. [Google Scholar] [CrossRef]
  14. Samad, A.; Azlan, A.; Ismail, A. Therapeutic effects of vinegar: A review. Curr. Opin. Food Sci. 2016, 8, 56–61. [Google Scholar] [CrossRef]
  15. García-Parrilla, M.C.; Heredia, F.J.; Troncoso, A.M. Sherry wine vinegars: Phenolic composition changes during aging. Food Res. Int. 1999, 32, 433–440. [Google Scholar] [CrossRef]
  16. Palacios, V.; Valcárcel, M.; Caro, I.; Pérez, L. Chemical and biochemical transformations during the industrial process of sherry vinegar aging. J. Agric. Food. Chem. 2002, 50, 4221–4225. [Google Scholar] [CrossRef] [PubMed]
  17. Tagliazucchi, D.; Verzelloni, E.; Conte, A. Contribution of melanoidins to the antioxidant activity of traditional balsamic vinegar during aging. J. Food Biochem. 2010, 34, 1061–1078. [Google Scholar] [CrossRef]
  18. Lu, Z.M.; Xu, W.; Yu, N.H.; Zhou, T.; Li, G.Q.; Shi, J.S.; Xu, Z.H. Recovery of aroma compounds from Zhenjiang aromatic vinegar by supercritical fluid extraction. Int. J. Food Sci. Technol. 2011, 46, 1508–1514. [Google Scholar] [CrossRef]
  19. Yu, Y.J.; Lu, Z.M.; Yu, N.H.; Xu, W.; Li, G.Q.; Shi, J.S.; Xu, Z.H. HS-SPME/GC-MS and chemometrics for volatile composition of Chinese traditional aromatic vinegar in the Zhenjiang region. J. Inst. Brew. 2012, 118, 133–141. [Google Scholar] [CrossRef] [Green Version]
  20. Wang, Z.M.; Lu, Z.M.; Yu, Y.J.; Li, G.Q.; Shi, J.S.; Xu, Z.H. Batch-to-batch uniformity of bacterial community succession and flavor formation in the fermentation of Zhenjiang aromatic vinegar. Food Microbiol. 2015, 50, 64–69. [Google Scholar] [CrossRef] [PubMed]
  21. Cocchi, M.; Lambertini, P.; Manzini, D.; Marchetti, A.; Ulrici, A. Determination of carboxylic acids in vinegars and in Aceto Balsamico Tradizionale di Modena by HPLC and GC methods. J. Agric. Food Chem. 2002, 50, 5255–5261. [Google Scholar] [CrossRef] [PubMed]
  22. Consonni, R.; Gatti, A. 1H NMR studies on Italian balsamic and traditional balsamic vinegars. J. Agric. Food Chem. 2004, 52, 3446–3450. [Google Scholar] [CrossRef] [PubMed]
  23. Consonni, R.; Cagliani, L.R.; Benevelli, F.; Spraul, M.; Humpfer, E.; Stocchero, M. NMR and chemometric methods: A powerful combination for characterization of balsamic and traditional balsamic vinegar of Modena. Anal. Chim. Acta 2008, 611, 31–40. [Google Scholar] [CrossRef] [PubMed]
  24. Cirlini, M.; Caligiani, A.; Palla, L.; Palla, G. HS-SPME/GC-MS and chemometrics for the classification of balsamic vinegars of Modena of different maturation and ageing. Food Chem. 2011, 124, 1678–1683. [Google Scholar] [CrossRef]
  25. Bertelli, D.; Maietti, A.; Papotti, G.; Tedeschi, P.; Bonetti, G.; Graziosi, R.; Brandolini, V.; Plessi, M. Antioxidant activity, phenolic compounds, and NMR characterization of balsamic and traditional balsamic vinegar of Modena. Food Anal. Methods 2015, 8, 371–379. [Google Scholar] [CrossRef]
  26. Papotti, G.; Bertelli, D.; Graziosi, R.; Maietti, A.; Tedeschi, P.; Marchetti, A.; Plessi, M. Traditional balsamic vinegar and balsamic vinegar of Modena analyzed by nuclear magnetic resonance spectroscopy coupled with multivariate data analysis. LWT Food Sci. Technol. 2015, 60, 1017–1024. [Google Scholar] [CrossRef]
  27. Budak, H.N.; Guzel-Seydim, Z.B. Antioxidant activity and phenolic content of wine vinegars produced by two different techniques. J. Sci. Food Agric. 2010, 90, 2021–2026. [Google Scholar] [CrossRef] [PubMed]
  28. Budak, N.H.; Doguc, D.K.; Savas, C.M.; Seydim, A.C.; Tas, T.K.; Ciris, M.I.; Guzel-Seydim, Z.B. Effects of apple cider vinegars produced with different techniques on blood lipids in high-cholesterol-fed rats. J. Agric. Food Chem. 2011, 59, 6638–6644. [Google Scholar] [CrossRef] [PubMed]
  29. Ozturk, I.; Caliskan, O.; Tornuk, F.; Ozcan, N.; Yalcin, H.; Baslar, M.; Sagdic, O. Antioxidant, antimicrobial, mineral, volatile, physicochemical and microbiological characteristics of traditional home-made Turkish vinegars. LWT Food Sci. Technol. 2015, 63, 144–151. [Google Scholar] [CrossRef]
  30. Lalou, S.; Hatzidimitriou, E.; Papadopoulou, M.; Kontogianni, V.G.; Tsiafoulis, C.G.; Gerothanassis, I.P.; Tsimidou, M.Z. Beyond traditional balsamic vinegar: Compositional and sensorial characteristics of industrial balsamic vinegars and regulatory requirements. J. Food Compos. Anal. 2015, 43, 175–184. [Google Scholar] [CrossRef]
  31. Liu, F.; He, Y.; Wang, L. Comparison of calibrations for the determination of soluble solids content and pH of rice vinegars using visible and short-wave near infrared spectroscopy. Anal. Chim. Acta 2008, 610, 196–204. [Google Scholar] [CrossRef] [PubMed]
  32. Bao, Y.; Liu, F.; Kong, W.; Sun, D.W.; He, Y.; Qiu, Z. Measurement of soluble solid contents and pH of white vinegars using VIS/NIR spectroscopy and least squares support vector machine. Food Bioprocess Technol. 2014, 7, 54–61. [Google Scholar] [CrossRef]
  33. Willett, W.C.; Stampfer, M.J. Current evidence on healthy eating. Annu. Rev. Public Health 2013, 34, 77–95. [Google Scholar] [CrossRef] [PubMed]
  34. Chiu, Y.H.; Chavarro, J.F.; Souter, I. Diet and female fertility: Doctor, what should I eat? Fertil. Steril. 2018, 110, 560–569. [Google Scholar] [CrossRef] [PubMed]
  35. Falcone, P.M.; Chillo, S.; Giudici, P.; Nobile, M.A.D. Measuring rheological properties for applications in quality assessment of traditional balsamic vinegar: Description and preliminary evaluation of a model. J. Food Eng. 2007, 80, 234–240. [Google Scholar] [CrossRef]
  36. Wang, Z.; Li, T.; Liu, F.; Zhang, C.; Ma, H.; Wang, L.; Zhao, S. Effects of ultrasonic treatment on the maturation of Zhenjiang vinegar. Ultrason. Sonochem. 2017, 39, 272–280. [Google Scholar] [CrossRef] [PubMed]
  37. Chen, Q.; Ding, J.; Cai, J.; Zhang, J. Rapid measurement of total acid content (TAC) in vinegar using near infrared spectroscopy based on efficient variables selection algorithm and nonlinear regression tools. Food Chem. 2012, 135, 590–595. [Google Scholar] [CrossRef] [PubMed]
  38. Shi, J.; Zou, X.; Huang, X.; Zhao, J.; Li, Y.; Hao, L.; Zhang, J. Rapid detecting total acid content and classifying different types of vinegar based on near infrared spectroscopy and least-squares support vector machine. Food Chem. 2013, 138, 192–199. [Google Scholar] [CrossRef]
  39. Xu, W.; Huang, Z.; Zhang, X.; Li, Q.; Lu, Z.; Shi, J.; Xu, Z.; Ma, Y. Monitoring the microbial community during solid-state acetic acid fermentation of Zhenjiang aromatic vinegar. Food Microbiol. 2011, 28, 1175–1181. [Google Scholar] [CrossRef] [PubMed]
  40. Yang, T.; García, J.F.; Sun, D.W. Advances in wine aging technologies for enhancing wine quality and accelerating wine aging process. Crit. Rev. Food Sci. Nutr. 2014, 54, 817–835. [Google Scholar] [CrossRef]
  41. Maieves, H.A.; López-Froilán, R.; Morales, P.; Pérez-Rodríguez, M.L.; Ribani, R.H.; Cámara, M.; Sánchez-Mata, M.C. Antioxidant phytochemicals of Hovenia dulcis, Thunb. peduncles in different maturity stages. J. Funct. Foods 2015, 18, 1117–1124. [Google Scholar] [CrossRef]
  42. Chou, C.H.; Liu, C.W.; Yang, D.J.; Wu, Y.S.; Chen, Y. Amino acid, mineral, and polyphenolic profiles of black vinegar, and its lipid lowering and antioxidant effects in vivo. Food Chem. 2015, 168, 63–69. [Google Scholar] [CrossRef] [PubMed]
  43. Cerezo, A.B.; Tesfaye, W.; Torija, M.J.; Mateo, E.; García-Parrilla, M.C.; Troncoso, A.M. The phenolic composition of red wine vinegar produced in barrels made from different woods. Food Chem. 2008, 109, 606–615. [Google Scholar] [CrossRef]
  44. Xie, X.; Zheng, Y.; Liu, X.; Cheng, C.; Zhang, X.; Xia, T.; Yu, S.; Wang, M. Antioxidant activity of Chinese Shanxi aged vinegar and its correlation with polyphenols and flavonoids during the brewing process. J. Food Sci. 2017, 82, 2479–2486. [Google Scholar] [CrossRef] [PubMed]
  45. Kawa-Rygielska, J.; Adamenko, K.; Kucharska, A.Z.; Piórecki, N. Bioactive compounds in cornelian cherry vinegars. Molecules 2018, 23, 379. [Google Scholar] [CrossRef] [PubMed]
  46. Verzelloni, E.; Tagliazucchi, D.; Conte, A. Relationship between the antioxidant properties and the phenolic and flavonoid content in traditional balsamic vinegar. Food Chem. 2007, 105, 564–571. [Google Scholar] [CrossRef]
  47. Shimoji, Y.; Tamura, Y.; Nakamura, Y.; Nanda, K.; Nishidai, S.; Nishikawa, Y.; Ishihara, N.; Uenakai, K.; Ohigashi, H. Isolation and identification of DPPH radical scavenging compounds in Kurosu (Japanese unpolished rice vinegar). J. Agric. Food. Chem. 2002, 50, 6501–6503. [Google Scholar] [CrossRef] [PubMed]
  48. Gülçin, İ. Antioxidant activity of food constituents: An overview. Arch. Toxicol. 2012, 86, 345–391. [Google Scholar] [CrossRef] [PubMed]
  49. Ho, C.W.; Lazim, A.M.; Fazry, S.; Zaki, U.K.H.H.; Lim, S.J. Varieties, production, composition and health benefits of vinegars: A review. Food Chem. 2016, 221, 1621–1630. [Google Scholar] [CrossRef] [PubMed]
  50. Bastante, M.J.C.; Guerrero, E.D.; Mejías, R.C.; Marín, R.N.; Dodero, M.C.R.; Barroso, C.G. Study of the polyphenolic composition and antioxidant activity of new sherry vinegar-derived products by maceration with fruits. J. Agric. Food Chem. 2010, 58, 11814–11820. [Google Scholar] [CrossRef] [PubMed]
  51. Wang, A.; Zhang, J.; Li, Z. Correlation of volatile and nonvolatile components with the total antioxidant capacity of tartary buckwheat vinegar: Influence of the thermal processing. Food Res. Int. 2012, 49, 65–71. [Google Scholar] [CrossRef]
  52. Liu, J.; Gan, J.; Nirasawa, S.; Zhou, Y.; Xu, J.; Zhu, S.; Cheng, Y. Cellular uptake and trans-enterocyte transport of phenolics bound to vinegar melanoidins. J. Funct. Foods 2017, 37, 632–640. [Google Scholar] [CrossRef]
  53. Prior, R.L.; Wu, X.; Schaich, K. Standardized methods for the determination of antioxidant capacity and phenolics in foods and dietary supplements. J. Agric. Food Chem. 2005, 53, 4290–4302. [Google Scholar] [CrossRef] [PubMed]
  54. Candrawinata, V.I.; Golding, J.B.; Roach, P.D.; Stathopoulos, C.E. Optimisation of the phenolic content and antioxidant activity of apple pomace aqueous extracts. CyTA-J. Food 2015, 13, 293–299. [Google Scholar] [CrossRef]
  55. Rice-Evans, C.; Miller, N.; Paganga, G. Antioxidant properties of phenolic compounds. Trends Plant Sci. 1997, 2, 152–159. [Google Scholar] [CrossRef]
  56. Le, B.C.; Renard, C.M. Interactions between polyphenols and macromolecules: Quantification methods and mechanisms. Crit. Rev. Food Sci. Nutr. 2012, 52, 213–248. [Google Scholar]
  57. Bindon, K.A.; Carew, A.L.; Mierczynska-Vasilev, A.; Kassara, S.; Kerslake, F.; Smith, P.A. Characterization of macromolecular complexes in red wine: Composition, molecular mass distribution and particle size. Food Chem. 2016, 199, 838–846. [Google Scholar] [CrossRef] [PubMed]
  58. Bakir, S.; Toydemir, G.; Boyacioglu, D.; Beekwilder, J.; Capanoglu, E. Fruit antioxidants during vinegar processing: Changes in content and in vitro bio-accessibility. Int. J. Mol. Sci. 2016, 17, 1658. [Google Scholar] [CrossRef] [PubMed]
  59. Hornedo-Ortega, R.; Álvarez-Fernández, M.A.; Cerezo, A.B.; Garcia-Garcia, I.; Troncoso, A.M.; Garcia-Parrilla, A.C. Influence of fermentation process on the anthocyanin composition of wine and vinegar elaborated from strawberry. J. Food Sci. 2017, 82, 364–372. [Google Scholar] [CrossRef] [PubMed]
  60. Yu, X.; Yang, M.; Dong, J.; Shen, R. Comparative analysis of the antioxidant capacities and phenolic compounds of oat and buckwheat vinegars during production processes. J. Food Sci. 2018, 83, 844–853. [Google Scholar] [CrossRef] [PubMed]
  61. Wang, C.; Zuo, Y. Ultrasound-assisted hydrolysis and gas chromatography-mass spectrometric determination of phenolic compounds in cranberry products. Food Chem. 2011, 128, 562–568. [Google Scholar] [CrossRef] [PubMed]
  62. Shao, Y.; Hu, Z.; Yu, Y.; Mou, R.; Zhu, Z.; Beta, T. Phenolic acids, anthocyanins, proanthocyanidins, antioxidant activity, minerals and their correlations in non-pigmented, red, and black rice. Food Chem. 2018, 239, 733–741. [Google Scholar] [CrossRef] [PubMed]
  63. Yin, Z.; Wu, W.; Sun, C.; Lei, Z.; Chen, H.; Liu, H.; Chen, W.; Ma, I.; Min, T.; Zhang, M.; et al. Comparison of releasing bound phenolic acids from wheat bran by fermentation of three aspergillus species. Int. J. Food Sci. Technol. 2017, 53, 1120–1130. [Google Scholar] [CrossRef]
  64. Alonso, A.M.; Guillen, D.A.; Barroso, C.G. Study of the antioxidant power of brandies and vinegars derived from Sherry wines and correlation with their content in polyphenols. Food Res. Int. 2004, 37, 715–721. [Google Scholar] [CrossRef]
  65. Kruger, N.J. The Bradford method for protein quantitation. Methods Mol. Biol. 1988, 32, 9–15. [Google Scholar]
Sample Availability: Samples of traditional and industrial Zhenjiang aromatic vinegars are available from the authors.
Figure 1. The production flow chart of traditional Zhenjiang aromatic vinegar (TZAV) and industrial Zhenjiang aromatic vinegar (IZAV).
Molecules 23 02949 g001
Figure 2. High-performance liquid chromatography (HPLC) chromatograms (recorded at 278 nm) of IZAV (A) and TZAV (B) samples showing the major phenolic compounds. Numbers represent different phenolic compounds (1: P-hydroxybenzoic acid; 2: chlorogenic acid; 3: caffeic acid; 4: vanillic acid; 5: syringic acid; 6: catechin; 7: p-coumaric acid; 8: ferulic acid; 9: sinapic acid; 10: rutin).
Molecules 23 02949 g002
Figure 3. Principal component analysis (PCA) biplot displayed associations between phenolic compositions and two kinds of ZAV samples. Blue triangles represent IZAV and yellow squares represent TZAV.
Molecules 23 02949 g003
Table 1. Proximate compositions of TZAV and IZAV samples 1,2.
SamplesAging Time (Year)pHTotal Acidity (g/100 mL)Soluble Solid (g/100 mL)Protein (g/100 mL)Crude Fat (g/100 mL)Carbohydrate (g/100 mL)Reducing Sugar (g/100 mL)Amino Nitrogen (g/100 mL)
TZAV-103.59 ± 0.00 b5.80 ± 0.00 l17.81 ± 0.01 e0.86 ± 0.01 i0.31 ± 0.03 b5.36 ± 0.00 a2.70 ± 0.06 c0.26 ± 0.01 f
TZAV-223.61 ± 0.01 a6.82 ± 0.01 b17.23 ± 0.00 g0.90 ± 0.01 gh0.33 ± 0.02 b5.43 ± 0.07 a2.47 ± 0.01 e0.32 ± 0.00 c
TZAV-353.62 ± 0.00 a6.64 ± 0.00 d23.02 ± 0.00 a1.02 ± 0.02 b0.32 ± 0.00 b5.24 ± 0.08 b2.60 ± 0.03 d0.34 ± 0.00 b
TZAV-473.56 ± 0.00 c6.48 ± 0.01 f19.42 ± 0.00 b1.03 ± 0.02 b0.44 ± 0.02 a4.82 ± 0.04 c2.89 ± 0.06 b0.36 ± 0.00 a
IZAV-103.41 ± 0.01 g4.75 ± 0.01 m12.23 ± 0.00 l0.90 ± 0.01 gh0.22 ± 0.00 d4.35 ± 0.03 d1.35 ± 0.03 j0.21 ± 0.01 h
IZAV-213.47 ± 0.00 e6.13 ± 0.00 i12.56 ± 0.00 k0.95 ± 0.01 de0.15 ± 0.01 e4.35 ± 0.04 d2.13 ± 0.02 f0.26 ± 0.03 f
IZAV-323.49 ± 0.01 d6.09 ± 0.02 j15.79 ± 0.01 i0.88 ± 0.01 hi0.23 ± 0.01 d3.52 ± 0.12 f3.00 ± 0.03 a0.27 ± 0.00 ef
IZAV-433.41 ± 0.02 g5.95 ± 0.00 k14.18 ± 0.01 j0.89 ± 0.01 h0.43 ± 0.03 a5.16 ± 0.09 b2.40 ± 0.10 e0.24 ± 0.00 g
IZAV-543.45 ± 0.01 f6.41 ± 0.00 g18.42 ± 0.00 d0.97 ± 0.01 cd0.31 ± 0.02 b4.38 ± 0.00 d1.59 ± 0.08 h0.28 ± 0.00 def
IZAV-64.53.41 ± 0.01 g6.84 ± 0.00 a17.14 ± 0.01 h0.92 ± 0.01 fg0.21 ± 0.00 d3.64 ± 0.04 e1.78 ± 0.05 g0.29 ± 0.01 de
IZAV-753.49 ± 0.01 d6.32 ± 0.01 h17.37 ± 0.01 f0.98 ± 0.01 c0.27 ± 0.03 c3.62 ± 0.06 ef1.45 ± 0.06 i0.27 ± 0.01 ef
IZAV-863.44 ± 0.01 f6.69 ± 0.01 c17.81 ± 0.01 e1.06 ± 0.03 a0.22 ± 0.01 d4.74 ± 0.10 c2.67 ± 0.10 cd0.30 ± 0.02 d
IZAV-973.38 ± 0.01 h6.61 ± 0.00 e18.79 ± 0.00 c0.93 ± 0.01 ef0.43 ± 0.00 a5.37 ± 0.07 a2.72 ± 0.03 c0.29 ± 0.03 de
Mean values
TZAV 3.60 ± 0.26 A6.44 ± 0.40 A19.37 ± 2.36 A0.95 ± 0.08 A0.35 ± 0.06 A5.21 ± 0.25 A2.67 ± 0.16 A0.32 ± 0.04 A
IZAV 3.44 ± 0.39 B6.20 ± 0.59 A16.03 ± 2.39 B0.94 ± 0.06 A0.27 ± 0.10 B4.35 ± 0.65 B2.12 ± 0.58 B0.27 ± 0.03 B
1 Data are presented as mean ± standard deviation (S.D.) (n = 3). 2 Significant differences are evaluated using the Duncan multiple comparison test (small letter) and Student’s t-test (capital letter). The different small letters or capital letters in the same column indicate significant differences (p < 0.05).
Table 2. Organic acid contents of TZAV and IZAV samples 1,2,3.
SamplesAging Time
(Year)
Acetic AcidLactic AcidPyroglutamic AcidSuccinic AcidMalic AcidOxalic AcidTartaric Acid
TZAV-104.22 ± 0.17 cd1.55 ± 0.03 j0.82 ± 0.03 g0.51 ± 0.02 de0.08 ± 0.01 g0.11 ± 0.00 e0.05 ± 0.00 d
TZAV-224.72 ± 0.15 ab2.44 ± 0.13 hi1.43 ± 0.05 d0.64 ± 0.01 c0.09 ± 0.01 g0.14 ± 0.01 cde0.06 ± 0.01 cd
TZAV-354.89 ± 0.22 a2.93 ± 0.06 d2.26 ± 0.17 a1.16 ± 0.05 b0.34 ± 0.01 a0.21 ± 0.00 a0.12 ± 0.01 a
TZAV-474.92 ± 0.17 a2.72 ± 0.03 ef2.05 ± 0.11 c1.37 ± 0.17 a0.30 ± 0.01 b0.20 ± 0.00 ab0.11 ± 0.01 ab
IZAV-101.58 ± 0.08 e1.16 ± 0.05 k0.22 ± 0.01 hND 40.01 ± 0.00 h0.01 ± 0.00 fND
IZAV-213.92 ± 0.10 cd2.77 ± 0.09 ef1.33 ± 0.05 de0.17 ± 0.00 g0.13 ± 0.01 f0.23 ± 0.01 a0.05 ± 0.01 d
IZAV-323.86 ± 0.15 d3.11 ± 0.08 c1.48 ± 0.08 d0.54 ± 0.04 d0.22 ± 0.03 d0.17 ± 0.01 bc0.07 ± 0.03 bcd
IZAV-434.45 ± 0.21 bc2.56 ± 0.10 gh1.45 ± 0.07 d0.09 ± 0.02 g0.27 ± 0.02 bc0.13 ± 0.01 de0.10 ± 0.03 abc
IZAV-544.03 ± 0.09 cd3.41 ± 0.06 a1.64 ± 0.05 c0.29 ± 0.01 f0.18 ± 0.01 e0.16 ± 0.01 cd0.06 ± 0.01 cd
IZAV-64.54.56 ± 0.16 b2.84 ± 0.05 de1.23 ± 0.04 ef0.30 ± 0.00 f0.23 ± 0.04 d0.12 ± 0.02 e0.08 ± 0.01 abcd
IZAV-754.09 ± 0.33 cd3.27 ± 0.09 b1.18 ± 0.04 f0.28 ± 0.00 f0.13 ± 0.03 f0.14 ± 0.05 cde0.10 ± 0.05 abc
IZAV-864.65 ± 0.11 ab2.37 ± 0.11 i1.75 ± 0.10 c0.33 ± 0.01 f0.23 ± 0.01 d0.17 ± 0.03 bc0.10 ± 0.02 abc
IZAV-974.12 ± 0.12 cd2.65 ± 0.06 fg2.13 ± 0.14 ab0.44 ± 0.00 e0.24 ± 0.01 cd0.13 ± 0.01 de0.09 ± 0.00 abcd
Mean values
TZAV 4.68 ± 0.33 A2.41 ± 0.55 A1.64 ± 0.60 A0.92 ± 0.38 A0.20 ± 0.12 A0.17 ± 0.04 A0.09 ± 0.03 A
IZAV 3.91 ± 0.90 B2.68 ± 0.64 A1.37 ± 0.51 A0.31 ± 0.14 B0.18 ± 0.08 A0.14 ± 0.06 A0.08 ± 0.03 A
1 Data are presented as mean ± S.D. (n = 3). 2 Significant differences are evaluated using the Duncan multiple comparison test (small letter) and Student’s t-test (capital letter). The different small letters or capital letters in the same column indicate significant differences (p < 0.05). 3 Organic acid contents expressed as g/100 mL. 4 ND indicates not detected.
Table 3. Total phenolic content (TPC), total flavonoid content (TFC) and total antioxidant activity (TAA) (measured by 2,2-diphenyl-1-picrylhydrazyl (DPPH), ferric reducing antioxidant power (FRAP) and 2,2′-azino-bis(3-ethylbenzthiazoline-6-sulfonic acid) (ABTS) assays) in TZAV and IZAV 1,2.
SamplesAging Time
(Year)
TPC
(mg GAE/mL)
TFC
(mg RE/mL)
TAC (mmol TEAC/L)
DPPHFRAPABTS
TZAV-102.49 ± 0.03 g1.57 ± 0.03 f33.32 ± 1.94 cde11.31 ± 0.48 g14.29 ± 0.98 e
TZAV-222.82 ± 0.16 f1.64 ± 0.11 ef32.35 ± 1.35 cde9.83 ± 0.35 h11.96 ± 0.77 fg
TZAV-356.45 ± 0.19 a5.44 ± 0.09 a54.72 ± 0.79 a30.85 ± 0.14 a41.07 ± 1.06 a
TZAV-475.55 ± 0.19 b4.15 ± 0.09 b43.76 ± 1.90 abc24.03 ± 0.33 b37.49 ± 1.28 b
IZAV-102.07 ± 0.01 h1.21 ± 0.05 g17.82 ± 1.69 f9.25 ± 0.77 h10.47 ± 1.02 g
IZAV-212.58 ± 0.17 fg2.23 ± 0.03 d26.06 ± 0.79 ef13.44 ± 0.88 f10.74 ± 1.04 g
IZAV-322.65 ± 0.06 fg1.88 ± 0.05 e28.10 ± 2.08 def13.41 ± 1.25 f11.85 ± 2.28 fg
IZAV-433.34 ± 0.06 e2.26 ± 0.09 d37.08 ± 2.24 cde13.72 ± 0.35 f13.93 ± 0.67 ef
IZAV-543.34 ± 0.07 e2.40 ± 0.08 d38.99 ± 0.79 cd13.97 ± 0.47 f17.28 ± 0.18 d
IZAV-64.53.42 ± 0.19 e2.85 ± 0.09 c43.39 ± 1.91 abc19.80 ± 0.19 c20.74 ± 1.82 e
IZAV-753.35 ± 0.09 e2.38 ± 0.04 d44.51 ± 0.81 abc20.79 ± 0.56 c21.25 ± 1.49 c
IZAV-864.07 ± 0.11 c3.00 ± 0.07 c53.01 ± 1.81 ab15.54 ± 0.39 e21.52 ± 0.65 c
IZAV-973.76 ± 0.14 d2.77 ± 0.16 c40.65 ± 1.14 bcd16.65 ± 0.75 d19.35 ± 1.19 cd
Mean values
TZAV 4.33 ± 1.79 A3.20 ± 1.73 A41.04 ± 12.45 A19.01 ± 9.18 A26.20 ± 13.78 A
IZAV 3.16 ± 0.61 B2.37 ± 0.60 A36.62 ± 11.18 A15.18 ± 3.45 A16.34± 4.60 B
1 Data are presented as mean ± S.D. (n = 3). 2 Significant differences are evaluated using the Duncan multiple comparison test (small letter) and Student’s t-test (capital letter). The different small letters or capital letters in the same column indicate significant differences (p < 0.05).
Table 4. Correlations between TAA of TZAV and IZAV samples and their TPC and TFC 1,2.
DPPHFRAPABTS
TZAVIZAVTZAVIZAVTZAVIZAV
TPC0.963 *0.960 **0.988 *0.682 *0.987 *0.872 *
TFC0.985 *0.903 **0.997 *0.724 *0.981 *0.824 *
1 Correlations are evaluated using Pearson’s correlation test. * and ** indicate the significant levels at 0.05 and 0.01, respectively. 2 Different numbers represent Pearson correlation coefficient (−1 ≤ r ≤ 1).
Table 5. Compositions of phenolic compound in TZAV and IZAV samples 1,2,3.
SamplesAging Time (Year)P-hydroxybenzoic AcidChlorogenic AcidCaffeic AcidVanillic AcidSyringic AcidCatechinP-coumaric AcidFerulic AcidSinapic AcidRutin
TZAV-107.96 ± 1.05 b2.77 ± 0.38 fg4.46 ± 1.45 cd4.47 ± 0.97 d2.32 ± 0.18 ef44.66 ± 2.68 hi1.01 ± 0.09 a0.89 ± 0.06 h2.66 ± 0.30 def9.88 ± 0.98 c
TZAV-224.47 ± 0.27 ef3.75 ± 0.00 fg5.57 ± 0.96 abcd5.78 ± 0.82 cd2.08 ± 0.31 efg47.09 ±1.42 gh1.11 ± 0.01 a1.30 ± 0.08 h2.11 ±0.25 ef10.11 ±1.58 c
TZAV-3510.90 ± 0.02 a15.09 ± 0.01 b7.37 ± 0.14 a5.82 ± 0.06 cd24.39 ± 0.01 a39.86 ± 0.09 i0.35 ± 0.00 b6.41 ± 0.00 b5.24 ± 0.03 ab18.50 ± 0.31 a
TZAV-476.52 ± 0.04 f bc6.23 ± 0.07 d3.66 ± 0.03 d6.97 ± 0.02 c22.46 ± 0.01 b33.81 ± 1.16 j0.19 ± 0.04 c17.98 ± 0.05 a4.43 ± 0.07 bc14.03 ± 0.19 b
IZAV-106.22 ± 2.15 cd4.32 ± 0.05 ef1.61 ± 0.21 e7.75 ± 0.09 bc2.83 ± 1.22 ef81.12 ± 1.26 aND 45.41 ± 0.23 c3.81 ± 1.36 bcdND
IZAV-216.20 ± 0.24 cd6.49 ± 1.75 d5.57 ± 0.36 abcd6.28 ± 0.25 cd2.69 ± 0.24 ef62.28 ± 1.43 deND2.91 ± 0.24 de6.54 ± 0.26 aND
IZAV-324.89 ± 0.13 def3.29 ± 0.07 fg5.08 ± 0.15 bcd4.40 ± 0.21 d3.00 ± 0.07 e67.49 ± 0.23 bcND4.90 ± 0.02 c2.83 ± 0.09 cdefND
IZAV-432.83 ± 0.09 g6.20 ± 0.15 d5.13 ± 1.79 bcd5.90 ± 2.43 cd2.76 ± 0.58 ef57.80 ± 0.84 efND2.01 ± 0.15 g1.88 ± 0.10 efND
IZAV-544.10 ± 0.25 efg8.23 ± 1.50 c6.04 ± 0.15 abc9.10 ± 0.26 ab5.38 ± 0.48 c63.37 ± 6.87 cdND2.69 ± 0.58 ef3.09 ± 1.74 cdeND
IZAV-64.52.70 ± 0.10 g2.14 ± 0.25 g5.01 ± 0.59 bcd9.03 ± 0.90 ab4.00 ± 0.00 d57.06 ± 0.46 fND3.35 ± 0.08 d1.45 ± 0.04 efND
IZAV-751.22 ± 0.05 h2.50 ± 0.03 g6.45 ± 0.58 abc6.24 ± 1.10 cd4.02 ± 0.05 d70.20 ± 0.09 bND1.90 ± 0.00 g1.59 ± 0.02 efND
IZAV-863.65 ± 0.28 fg5.68 ± 0.26 de5.48 ± 1.72 abcd9.59 ± 0.49 ab1.89 ± 0.38 fg65.30 ± 0.86 bcdND2.26 ± 0.47 fg1.29 ± 0.06 fND
IZAV-975.54 ± 0.01 cde20.00 ± 0.75 a6.81 ± 0.12 ab10.31 ± 0.00 a1.17 ± 0.33 g51.87 ± 1.20 gND0.96 ± 0.10 h2.84± 0.99 cdefND
Mean values
TZAV 7.46 ± 2.54 A6.96 ± 5.19 A5.27 ± 1.63 A5.76 ± 1.06 B12.81 ± 11.37 A41.35 ± 5.56 B0.66 ± 0.436.65 ± 7.37 A3.61 ± 1.37 A13.13 ± 3.82
IZAV 4.15 ± 1.75 B6.54 ± 5.30 A5.24 ± 1.59 A7.62 ± 2.07 A3.08 ± 1.27 B64.17± 8.71 A 2.83 ± 1.52 A2.81 ± 1.70 A
1 Data are presented as mean ± S.D. (n = 3). 2 Significant differences are evaluated using the Duncan multiple comparison test (small letter) and Student’s t-test (capital letter). The different small letters or capital letters in the same column indicates significant difference (p < 0.05). 3 Phenolic compounds contents expressed as mg/L. 4 ND indicates not detected.
Table 6. Correlations between TAA of TZAV and IZAV samples and their main phenolic compounds contents 1,2.
Phenolic CompoundsDPPHFRAPABTS
TZAVIZAVTZAVIZAVTZAVIZAV
p-hydroxybenzoic acid0.784−0.693 *0.725−0.749 *0.626−0.674 *
Chlorogenic acid0.960 *0.1110.903−0.0390.8140.135
Caffeic acid0.5540.6640.4140.673 *0.2510.577
Vanillic acid0.4320.4810.5320.2010.6360.596
Syringic acid0.929 *0.0120.976*0.1780.998 **0.080
Catechin−0.631−0.492−0.749−0.454−0.855−0.386
p-coumaric acid−0.834-−0.913-−0.971 *-
Ferulic acid0.475−0.711 *0.610−0.5780.742−0.636
Sinapic acid0.971 *−0.717 *0.994 **−0.5400.987 *−0.725 *
Rutin0.998 **-0.979 *-0.929 *-
1 Correlations are evaluated using the Pearson’s correlation test. * and ** indicate the significant levels at 0.05 and 0.01, respectively. 2 Different numbers represent Pearson correlation coefficient (−1 ≤ r ≤ 1).

