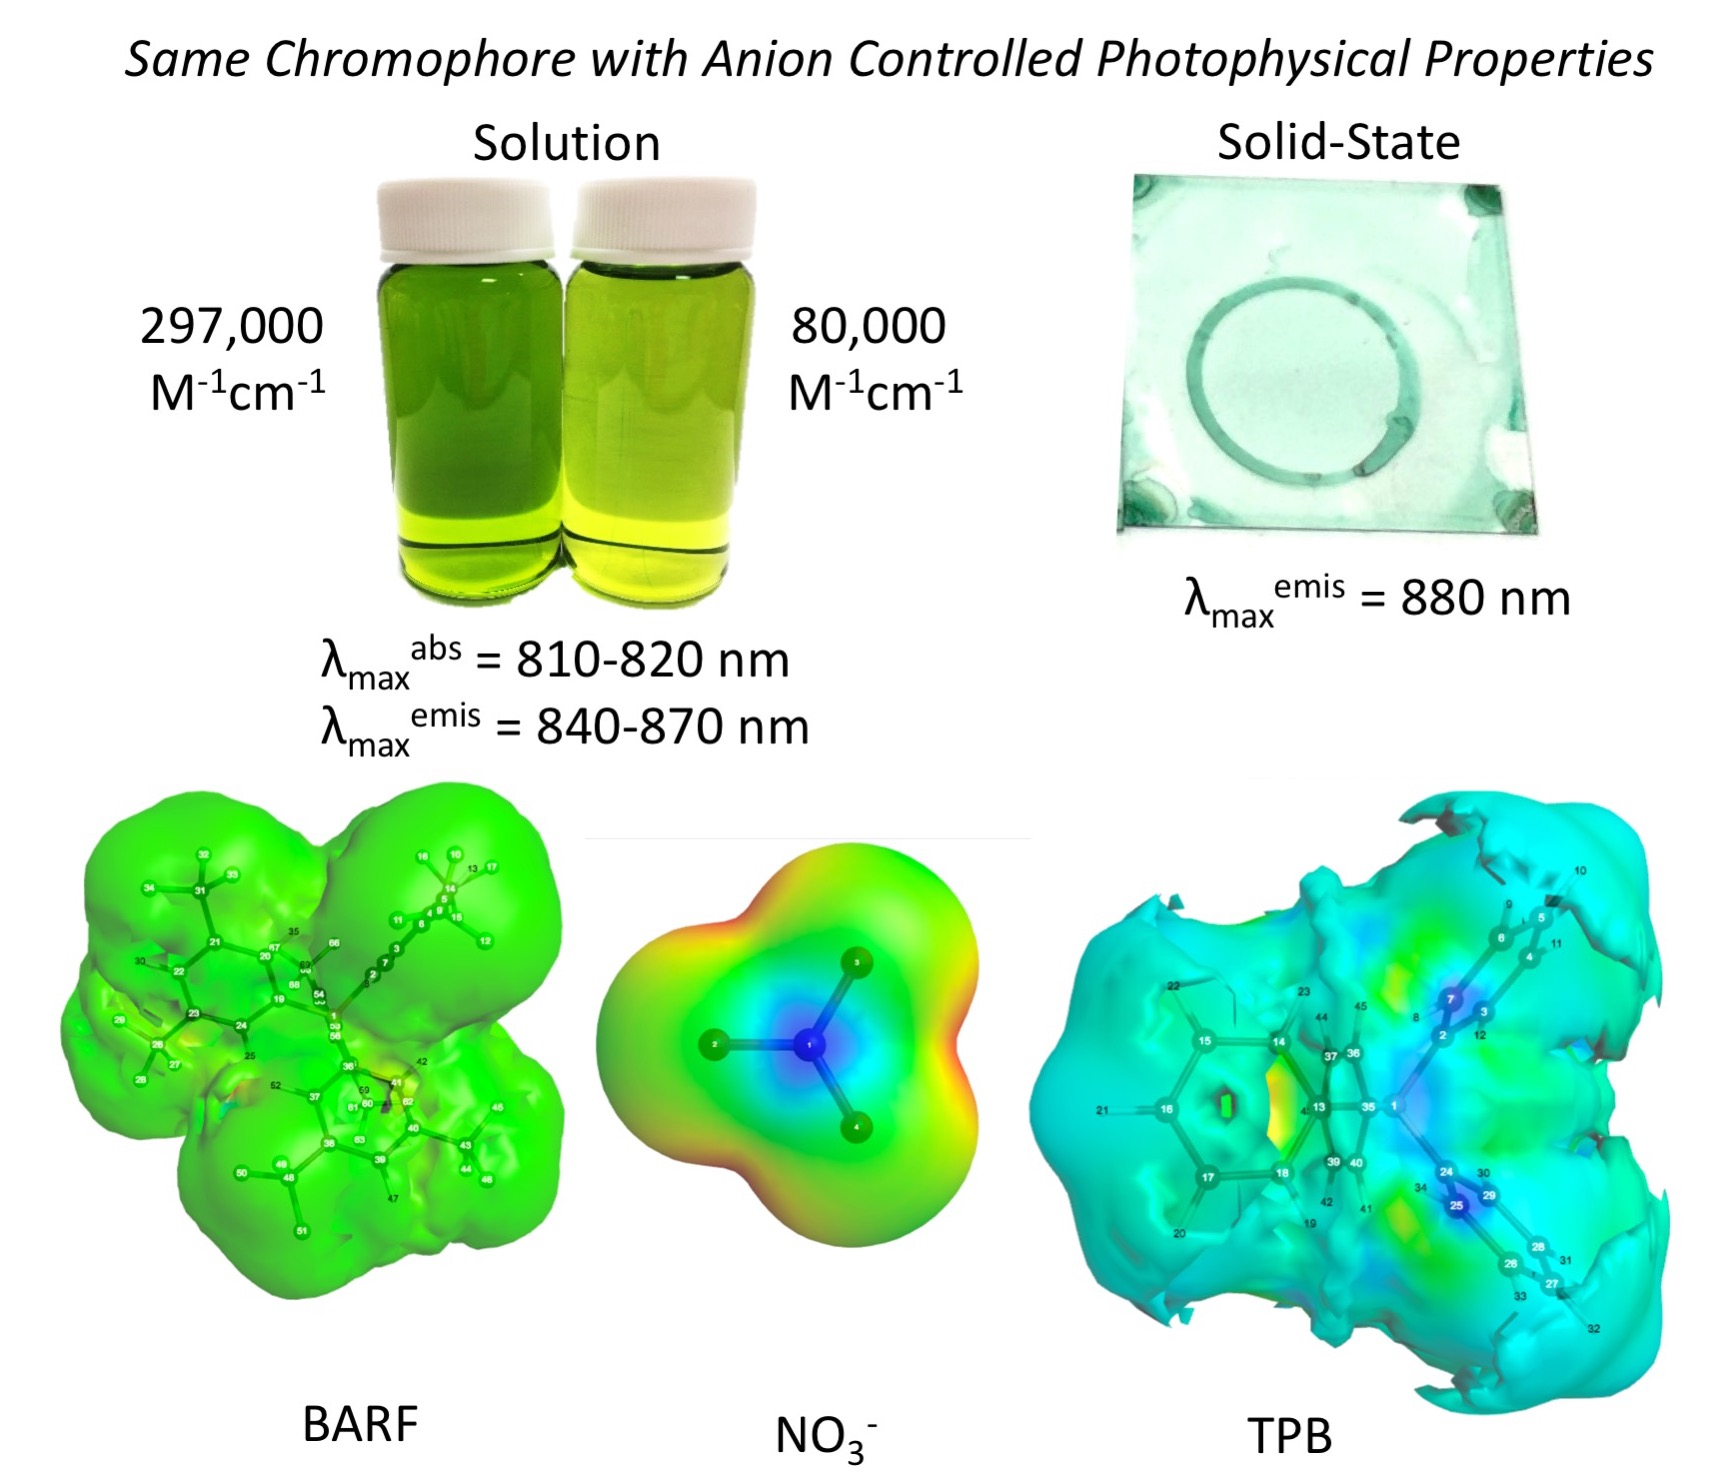
Counter Anion Effect on the Photophysical Properties of Emissive Indolizine-Cyanine Dyes in Solution and Solid State

 , , , and
Abstract
:
1. Introduction
2. Results and Discussion
3. Materials and Methods
4. Conclusions
Supplementary Materials
Author Contributions
Funding
Conflicts of Interest
References
- Suzuki, H. Organic light-emitting materials and devices for optical communicaiton technology. J. Photochem. Photobiol. A 2004, 166, 155–161. [Google Scholar] [CrossRef]
- Smith, A.M.; Mancini, M.C.; Nie, S. Bioimaging: Second window for in vivo imaging. Nat. Nanotech. 2009, 4, 710–711. [Google Scholar] [CrossRef] [PubMed] [Green Version]
- Berezin, M.Y.; Achilefu, S. Fluorescence lifetime measurements and biological imaging. Chem. Rev. 2010, 110, 2641–2684. [Google Scholar] [CrossRef] [PubMed]
- Escobedo, J.O.; Rusin, O.; Lim, S.; Strongin, R.M. NIR dyes for bioimaging applications. Curr. Opin. Chem. Biol. 2010, 14, 64–70. [Google Scholar] [CrossRef] [PubMed] [Green Version]
- Keereweer, S.; Van Driel, P.B.A.A.; Snoeks, T.J.A.; Kerrebijn, J.D.F.; Baatenburg de Jong, R.J.; Vahrmeijer, A.L.; Sterenborg, H.J.C.M.; Löwik, C.W.G.M. Optical image-guided cancer surgery: Challenges and limitations. Clin. Cancer Res. 2013, 19, 3745–3754. [Google Scholar] [CrossRef] [PubMed]
- Guo, Z.; Park, S.; Yoon, J.; Shin, I. Recent progress in the development of near-infrared fluorescent probes for bioimaging applications. Chem. Soc. Rev. 2014, 43, 16–29. [Google Scholar] [CrossRef] [PubMed]
- Shindy, H.A. Fundamentals in the chemistry of cyanine dyes: A review. Dyes Pigm. 2017, 145, 505–513. [Google Scholar] [CrossRef]
- Zhao, J.; Zhong, D.; Zhou, S. NIR-I-to-NIR-II fluorescent nanomaterials for biomedical imaging and cancer therapy. J. Mater. Chem. 2018, 6, 349–365. [Google Scholar] [CrossRef]
- Yao, L.; Zhang, S.; Wang, R.; Li, W.; Shen, F.; Yang, B.; Ma, Y. Highly efficient near-infrared organic light-emitting diode based on a butterfly-shaped donor–acceptor chromophore with strong solid-state fluorescence and a large proportion of radiative excitons. Angew. Chem. Int. Ed. 2014, 53, 2119–2123. [Google Scholar] [CrossRef] [PubMed]
- Tuong Ly, K.; Chen-Cheng, R.-W.; Lin, H.-W.; Shiau, Y.-J.; Liu, S.-H.; Chou, P.-T.; Tsao, C.-S.; Huang, Y.-C.; Chi, Y. Near-infrared organic light-emitting diodes with very high external quantum efficiency and radiance. Nat. Photon. 2016, 11, 63–68. [Google Scholar] [CrossRef]
- Xue, J.; Li, C.; Xin, L.; Duan, L.; Qiao, J. High-efficiency and low efficiency roll-off near-infrared fluorescent OLEDs through triplet fusion. Chem. Sci. 2016, 7, 2888–2895. [Google Scholar] [CrossRef] [PubMed] [Green Version]
- Antaris, A.L.; Chen, H.; Cheng, K.; Sun, Y.; Hong, G.; Qu, C.; Diao, S.; Deng, Z.; Hu, X.; Zhang, B.; et al. A small-molecule dye for NIR-II imaging. Nat. Mater. 2016, 15, 235–242. [Google Scholar] [CrossRef] [PubMed]
- Sun, Y.; Qu, C.; Chen, H.; He, M.; Tang, C.; Shou, K.; Hong, S.; Yang, M.; Jiang, Y.; Ding, B.; et al. Novel benzo-bis(1,2,5-thiadiazole) fluorophores for in vivo NIR-II imaging of cancer. Chem. Sci. 2016, 7, 6203–6207. [Google Scholar] [CrossRef] [PubMed]
- McNamara, L.E.; Rill, T.A.; Huckaba, A.J.; Ganeshraj, V.; Gayton, J.; Nelson, R.A.; Sharpe, E.A.; Dass, A.; Hammer, N.I.; Delcamp, J.H. Indolizine-squaraines: NIR fluorescent materials with molecularly engineered stokes shifts. Chem. Eur. J. 2017, 23, 12494–12501. [Google Scholar] [CrossRef] [PubMed]
- McNamara, L.E.; Liyanage, N.; Peddapuram, A.; Murphy, J.S.; Delcamp, J.H.; Hammer, N.I. Donor-acceptor-donor thienopyrazines via Pd-catalyzed C-H activation as NIR fluorescent materials. J. Org. Chem. 2016, 81, 32–42. [Google Scholar] [CrossRef] [PubMed]
- Zhang, Y.; Autry, S.A.; McNamara, L.E.; Nguyen, S.T.; Le, N.; Brogdon, P.; Watkins, D.L.; Hammer, N.I.; Delcamp, J.H. Near-infrared fluorescent thienothiadiazole dyes with large stokes shifts and high photostability. J. Org. Chem. 2017, 82, 5597–5606. [Google Scholar] [CrossRef] [PubMed]
- Peng, X.; Song, F.; Lu, E.; Wang, Y.; Zhou, W.; Fan, J.; Gao, Y. Heptamethine cyanine dyes with a large stokes shift and strong fluorescence: A paradigm for excited-state intramolecular charge transfer. J. Am. Chem. Soc. 2005, 127, 4170–4171. [Google Scholar] [CrossRef] [PubMed]
- Cao, J.; Fan, J.; Sun, W.; Guo, Y.; Wu, H.; Peng, X. The photoprocess effects of an amino group located at different positions along the polymethine chain in indodicarbocyanine dyes. RSC Adv. 2017, 7, 30740–30746. [Google Scholar] [CrossRef] [Green Version]
- Gayton, J.; Autry, S.A.; Meador, W.; Parkin, S.; Hill, G.; Hammer, N.I.; Delcamp, J.H. Indolizine-cyanine dyes: Near infrared emissive cyanine dyes with increased stokes shifts. Chemistry 2018. under review. [Google Scholar]
- Han, J.; Engler, A.; Qi, J.; Tung, C.H. Ultra pseudo-stokes shift near infrared dyes based on energy transfer. Tetrahedron Lett. 2013, 54, 502–505. [Google Scholar] [CrossRef] [PubMed]
- Dost, T.L.; Gressel, M.T.; Henary, M. Synthesis and optical properties of pentamethine cyanine dyes with carboxylic acid moieties. Anal. Chem. Insights 2017, 12, 1–6. [Google Scholar] [CrossRef] [PubMed]
- Ashitate, Y.; Levitz, A.; Park, M.H.; Hyun, H.; Venugopal, V.; Park, G.; El Fakhri, G.; Henary, M.; Gioux, S.; Frangioni, J.V.; et al. Endocrine-specific NIR fluorophores for adrenal gland targeting. Chem. Commun. 2016, 52, 10305–10308. [Google Scholar] [CrossRef] [PubMed] [Green Version]
- Bouit, P.-A.; Aronica, C.; Toupet, L.; Guennic, B.L.; Andraud, C.; Maury, O. Continuous symmetry breaking induced by ion pairing effect in heptamethine cyanine dyes: Beyond the cyanine limit. J. Am. Chem. Soc. 2010, 132, 4328–4335. [Google Scholar] [CrossRef] [PubMed]
- Bates, M.; Lunt, R.R. Organic salt photovoltaics. Sustain. Energy Fuels 2017, 1, 955–968. [Google Scholar] [CrossRef]
- Li, Z.A.; Mukhopadhyay, S.; Jang, S.-H.; Brédas, J.-L.; Jen, A.K.Y. Supramolecular assembly of complementary cyanine salt J-aggregates. J. Am. Chem. Soc. 2015, 137, 11920–11923. [Google Scholar] [CrossRef] [PubMed]
- De Jonghe-Risse, J.; Heier, J.; Nüesch, F.; Moser, J.E. Ultrafast charge transfer in solid-state films of pristine cyanine borate and blend with fullerene. J. Mater. Chem. A 2015, 3, 10935–10941. [Google Scholar] [CrossRef]
- Zhang, H.; Jenatsch, S.; De Jonghe, J.; Nüesch, F.; Steim, R.; Véron, A.C.; Hany, R. Transparent organic photodetector using a near-infrared absorbing cyanine dye. Sci. Rep. 2015, 5, 9439. [Google Scholar] [CrossRef] [PubMed]
- Veron, A.C.; Zhang, H.; Linden, A.; Nuesch, F.; Heier, J.; Hany, R.; Geiger, T. NIR-absorbing heptamethine dyes with tailor-made counterions for application in light to energy conversion. Org. Lett. 2014, 16, 1044–1047. [Google Scholar] [CrossRef] [PubMed]
- Makha, M.; Schwaller, P.; Strassel, K.; Anantharaman, S.B.; Nuesch, F.; Hany, R.; Heier, J. Insights into photovoltaic properties of ternary organic solar cells from phase diagrams. Sci. Technol. Adv. Mater. 2018, 19, 669–682. [Google Scholar] [CrossRef] [PubMed]
- Frisch, M.J.; Trucks, G.W.; Schlegel, H.B.; Scurseria, G.E.; Robb, M.A.; Cheeseman, J.R.; Scalmani, G.; Barone, V.; Mennucci, B.; Petersson, A.; et al. Gaussian 09 Revision D.01; Gaussian, Inc.: Wallingford, CT, USA, 2009. [Google Scholar]
- Becke, A.D. Density-functional thermochemistry. III. The role of exact exchange. J. Chem. Phys. 1993, 98, 5648–5652. [Google Scholar] [CrossRef]
- Lee, C.; Yang, W.; Parr, R.G. Development of the colle-salvetti correlation-energy formula into a functional of the electron density. Phys. Rev. B 1988, 37, 785–789. [Google Scholar] [CrossRef]
- Hehre, W.J.; Ditchfield, R.; Pople, J.A. Self—Consistent molecular orbital methods. XII. Further extensions of gaussian—type basis sets for use in molecular orbital studies of organic molecules. J. Chem. Phys. 1972, 56, 2257–2261. [Google Scholar] [CrossRef]
- Hurst, M.O.; Fortenberry, R.C. Factors affecting the solubility of ionic compounds. Comput. Theor. Chem. 2015, 1069, 132–137. [Google Scholar] [CrossRef]
- Schmidt, J.R.P. F. WebMO Enterprise, version 14.0; WebMO LLC: Holland, MI, USA, 2014. [Google Scholar]
- Pascal, S.; Haefele, A.; Monnereau, C.; Charaf-Eddin, A.; Jacquemin, D.; Le Guennic, B.; Andraud, C.; Maury, O. Expanding the polymethine paradigm: Evidence for the contribution of a bis-dipolar electronic structure. J. Phys. Chem. A 2014, 118, 4038–4047. [Google Scholar] [CrossRef] [PubMed]
- Mustroph, H.; Towns, A. Fine structure in electronic spectra of cyanine dyes: Are sub-bands largely determined by a dominant vibration or a collection of singly excited vibrations? Chem. Phys. Chem. 2018, 19, 1016–1023. [Google Scholar] [CrossRef] [PubMed]
- Siebrand, W. Radiationless transitions in polyatomic molecules. I. Calculation of Franck—Condon factors. J. Chem. Phys. 1967, 46, 440–447. [Google Scholar] [CrossRef]
- Siebrand, W. Radiationless transitions in polyatomic molecules. II. Triplet-ground-state transitions in aromatic hydrocarbons. J. Chem. Phys. 1967, 47, 2411–2422. [Google Scholar] [CrossRef]
- Caspar, J.V.; Sullivan, B.P.; Kober, E.M.; Meyer, T.J. Application of the energy gap law to the decay of charge transfer excited-states. Solvent effects. Chem. Phys. Lett. 1982, 91, 91–95. [Google Scholar] [CrossRef]
- Englman, R.; Jortner, J. The energy gap law for radiationless transitions in large molecules. Mol. Phys. 1970, 18, 145–164. [Google Scholar] [CrossRef]
- Williams, A.T.R.; Winfield, S.A.; Miller, J.N. Relative fluorescence quantum yields using a computer-controlled luminescence spectrometer. Analyst 1983, 108, 1067–1071. [Google Scholar] [CrossRef]
- Reindl, S.; Penzkofer, A.; Gong, S.-H.; Landthaler, M.; Szeimies, R.M.; Abels, C.; Bäumler, W. Quantum yield of triplet formation for indocyanine green. J. Photochem. Photobiol. A 1997, 105, 65–68. [Google Scholar] [CrossRef]


| Anion | Volume/Mole (cm3/mol) | Volume (cm3) |
|---|---|---|
| Cl− | 36.741 | 6.1011 x 10⁻²³ |
| NO3− | 35.092 | 5.8273 x 10⁻²³ |
| ClO4− | 52.148 | 8.6596 x 10⁻²³ |
| PF6− | 90.531 | 1.5033 x 10⁻²² |
| TFSI | 130.771 | 2.1716 x 10⁻²² |
| TPB | 246.294 | 4.0899 x 10⁻²² |
| BARF | 414.785 | 6.8878 x 10⁻²² |
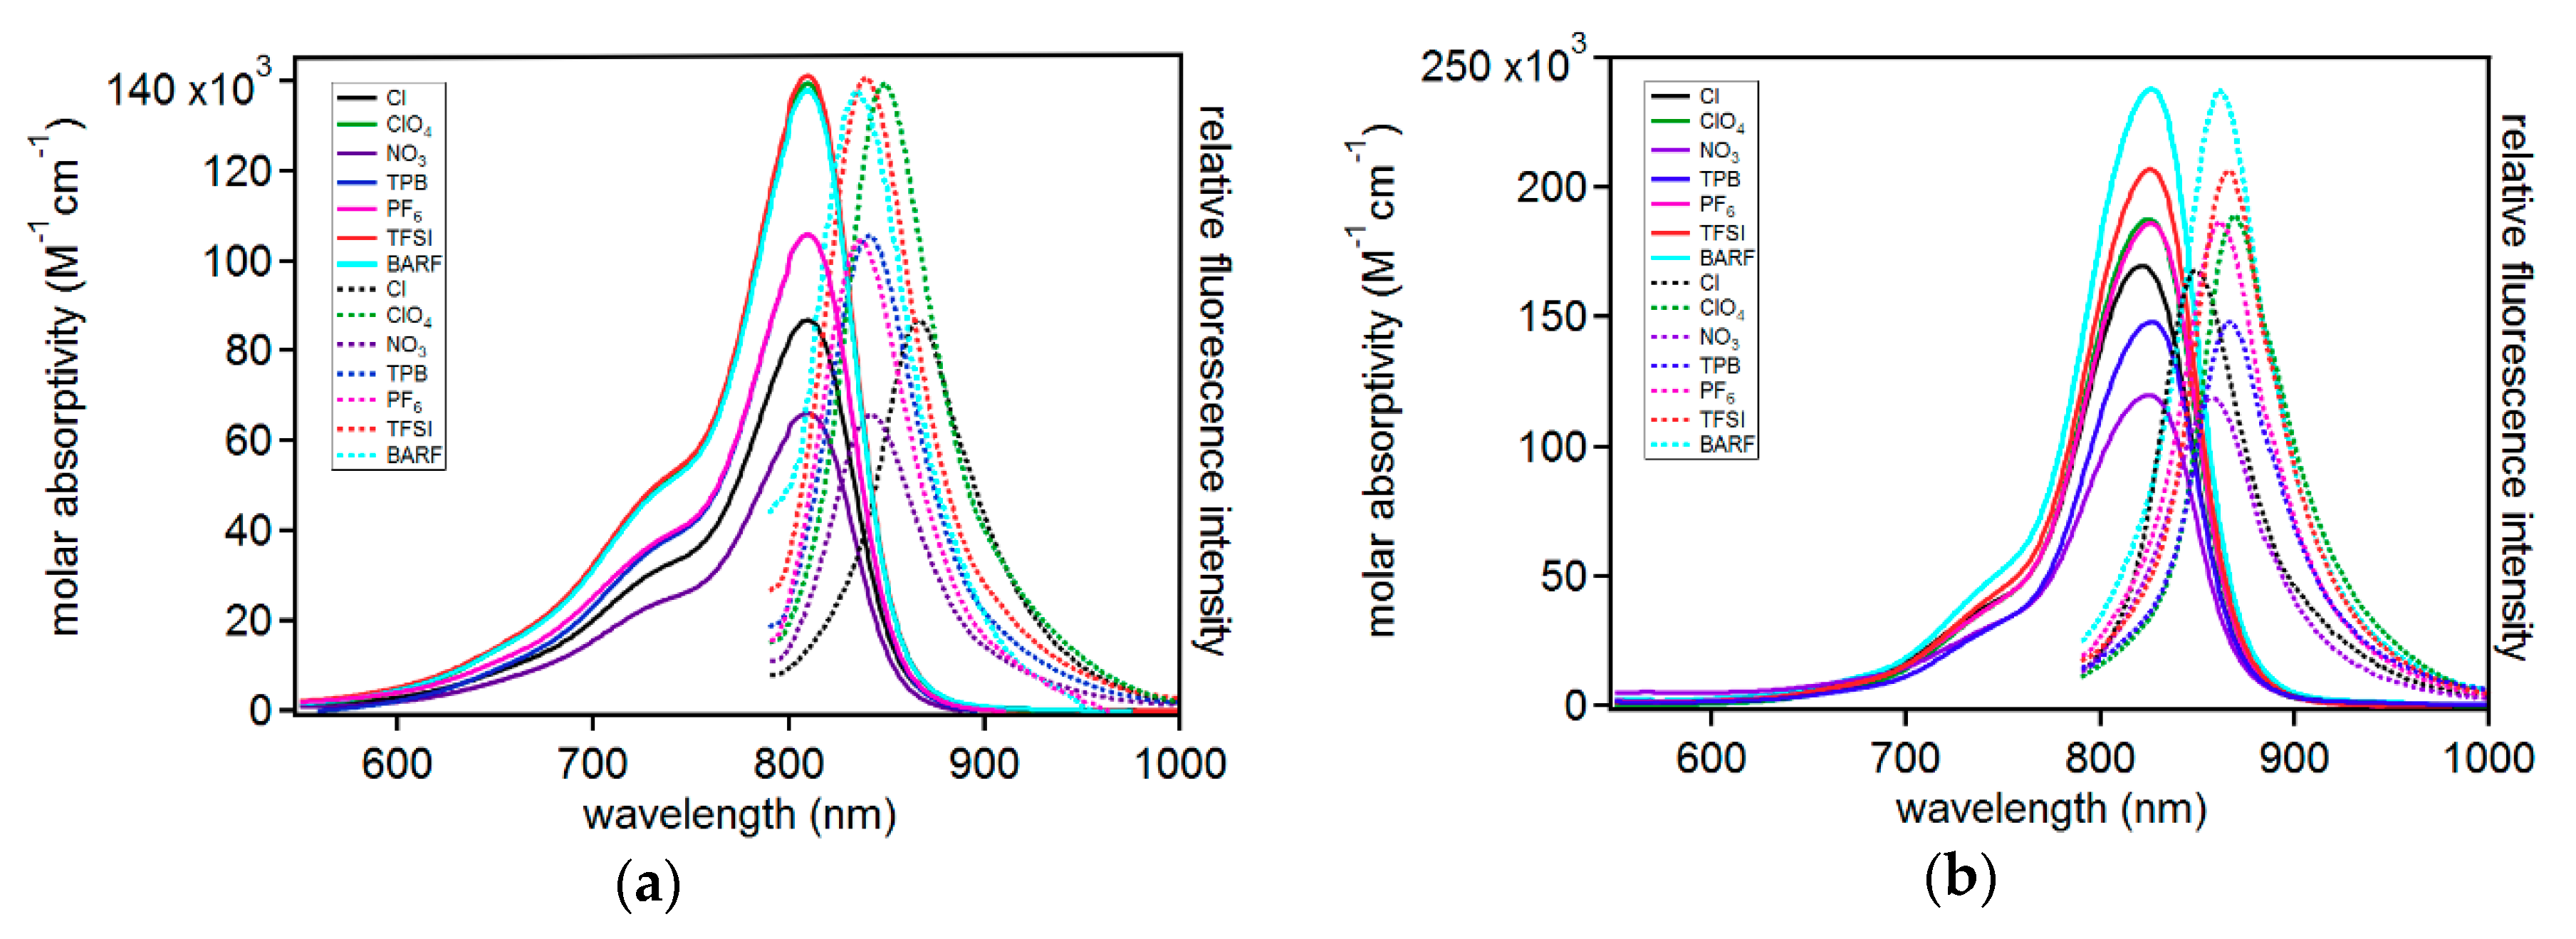
| Dye | Solvent | Molar Abs. (M−1cm−1) | λmaxabs (nm) | λmaxemis (nm) | Φ (%) | MB (ε × Φ) | Stokes Shift (nm | eV | cm−1) |
|---|---|---|---|---|---|---|---|
| C5-ClO4 | MeCN | 140,000 | 810 | 848 | 1.2 | 1,700 | 38 | 0.07 | 553 |
| DCM | 188,000 | 825 | 868 | 2.2 | 4,100 | 43 | 0.07 | 600 | |
| C5-Cl | MeCN | 87,000 | 810 | 866 | <1 | <870 | 56 | 0.10 | 798 |
| DCM | 170,000 | 821 | 849 | <1 | <1,700 | 28 | 0.05 | 402 | |
| C5-NO3 | MeCN | 66,000 | 810 | 842 | <1 | <660 | 32 | 0.06 | 469 |
| DCM | 120,000 | 825 | 856 | <1 | <1,200 | 31 | 0.06 | 439 | |
| C5-PF6 | MeCN | 106,000 | 810 | 836 | <1 | <1,060 | 26 | 0.05 | 384 |
| DCM | 186,000 | 826 | 862 | <1 | <1,860 | 36 | 0.07 | 506 | |
| C5-TFSI | MeCN | 141,000 | 810 | 838 | 1.1 | 1,551 | 28 | 0.06 | 413 |
| DCM | 207,000 | 826 | 866 | <1 | <2,070 | 40 | 0.07 | 559 | |
| C5-TPB | MeCN | 106,000 | 810 | 840 | 1.2 | 1,272 | 30 | 0.06 | 441 |
| DCM | 148,000 | 826 | 867 | <1 | <1,480 | 41 | 0.07 | 573 | |
| C5-BARF | MeCN | 138,000 | 810 | 836 | <1 | <1,380 | 26 | 0.05 | 384 |
| DCM | 238,000 | 826 | 861 | <1 | <2,380 | 35 | 0.06 | 492 |
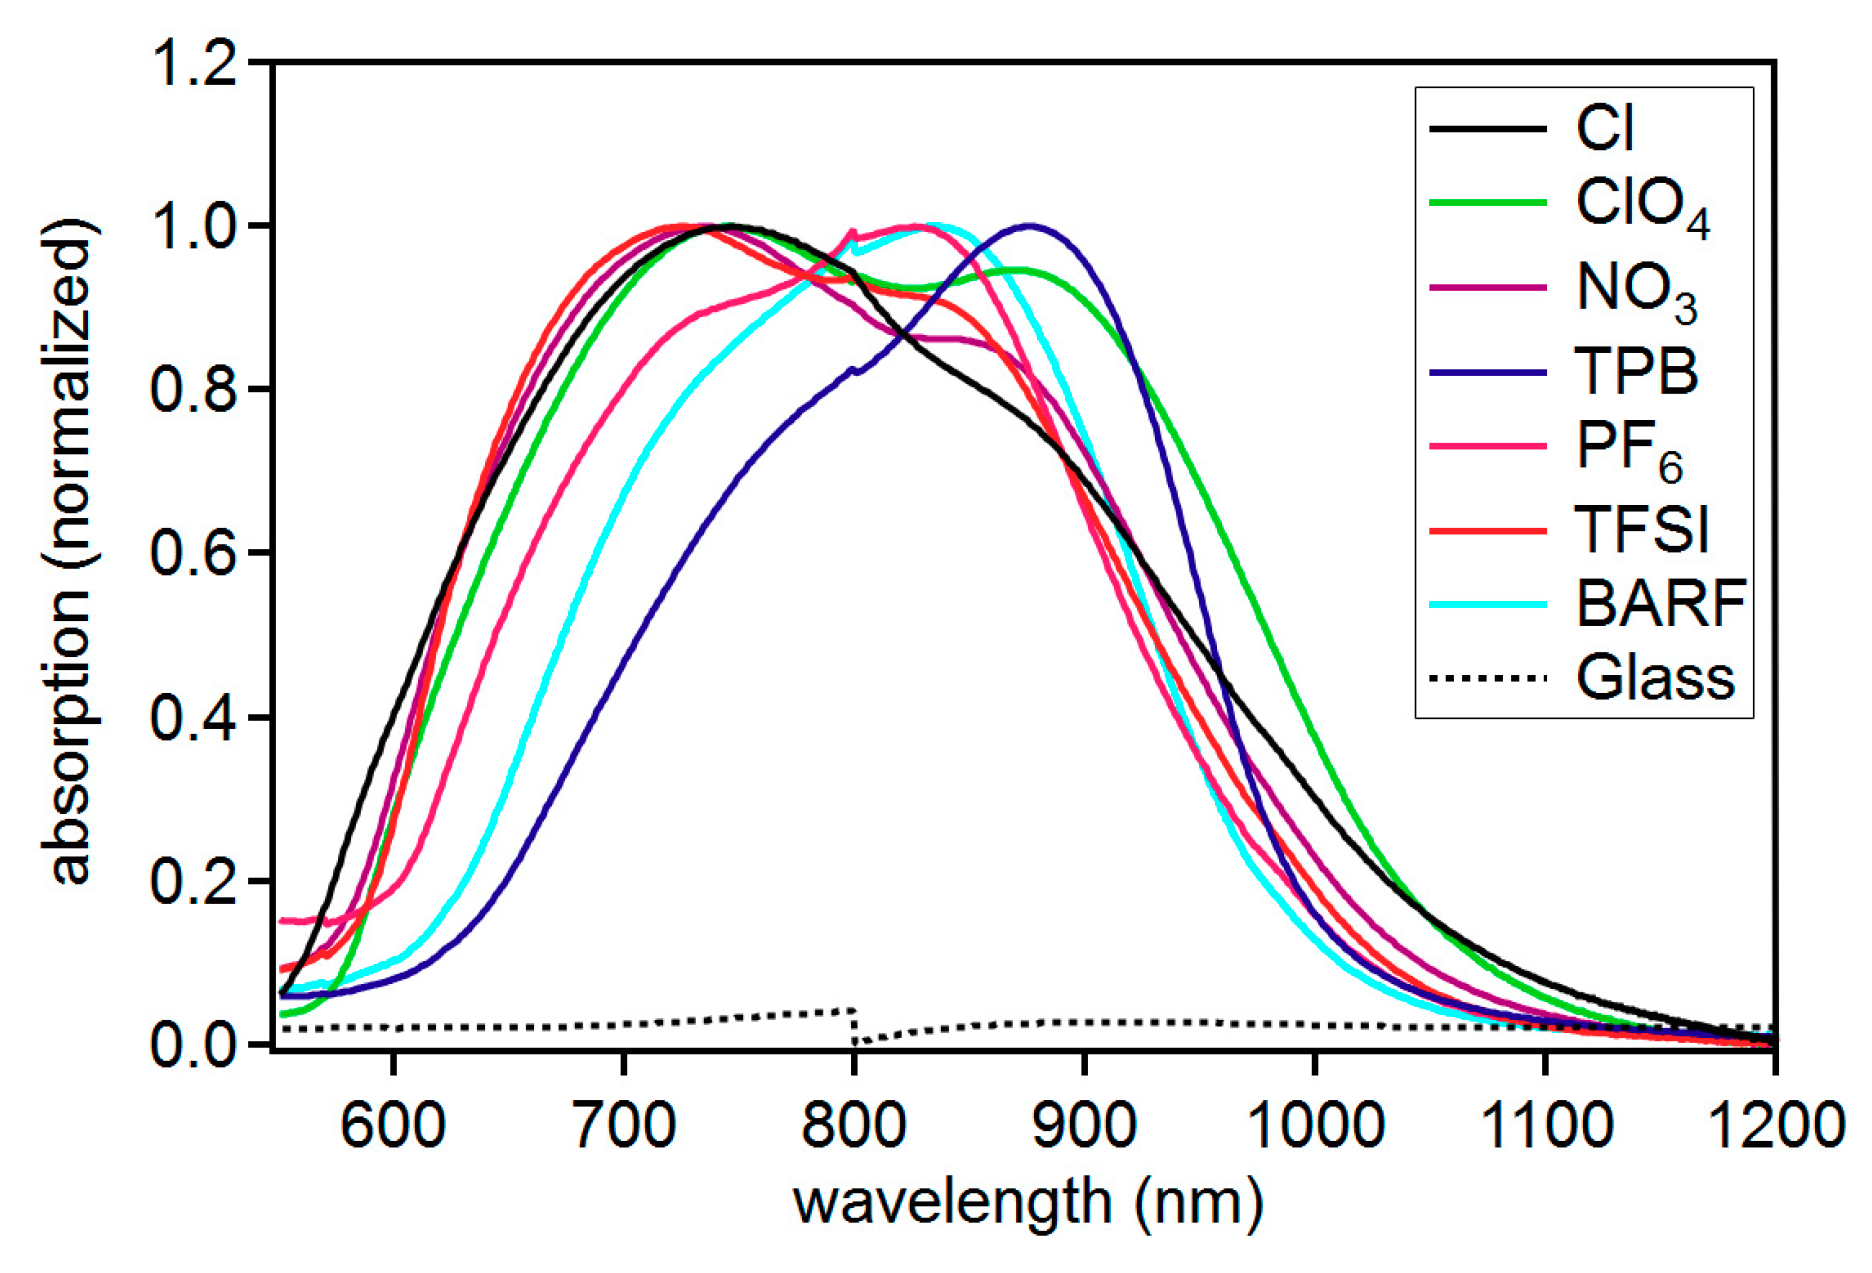
| Dye | λmaxabs (nm) | Abs. High E: Low E Feature Ratio |
|---|---|---|
| C5-ClO4 | 875 | 1:1 |
| C5-Cl | 750a | 1:0.7 |
| C5-NO3 | 735a | 1:0.8 |
| C5-PF6 | 778a | 1:0.9 |
| C5-TFSI | 722a | 1:0.7 |
| C5-TPB | 878b | 0.8:1 |
| C5-BARF | 800a | 1:1 |
© 2018 by the authors. Licensee MDPI, Basel, Switzerland. This article is an open access article distributed under the terms and conditions of the Creative Commons Attribution (CC BY) license (http://creativecommons.org/licenses/by/4.0/).
Share and Cite
Gayton, J.N.; Autry, S.; Fortenberry, R.C.; Hammer, N.I.; Delcamp, J.H. Counter Anion Effect on the Photophysical Properties of Emissive Indolizine-Cyanine Dyes in Solution and Solid State. Molecules 2018, 23, 3051. https://doi.org/10.3390/molecules23123051
Gayton JN, Autry S, Fortenberry RC, Hammer NI, Delcamp JH. Counter Anion Effect on the Photophysical Properties of Emissive Indolizine-Cyanine Dyes in Solution and Solid State. Molecules. 2018; 23(12):3051. https://doi.org/10.3390/molecules23123051
Chicago/Turabian StyleGayton, Jacqueline N., Shane Autry, Ryan C. Fortenberry, Nathan I. Hammer, and Jared H. Delcamp. 2018. "Counter Anion Effect on the Photophysical Properties of Emissive Indolizine-Cyanine Dyes in Solution and Solid State" Molecules 23, no. 12: 3051. https://doi.org/10.3390/molecules23123051