
Multi-Spheres Adsorptive Microextraction (MSAμE)—Application of a Novel Analytical Approach for Monitoring Chemical Anthropogenic Markers in Environmental Water Matrices


Abstract
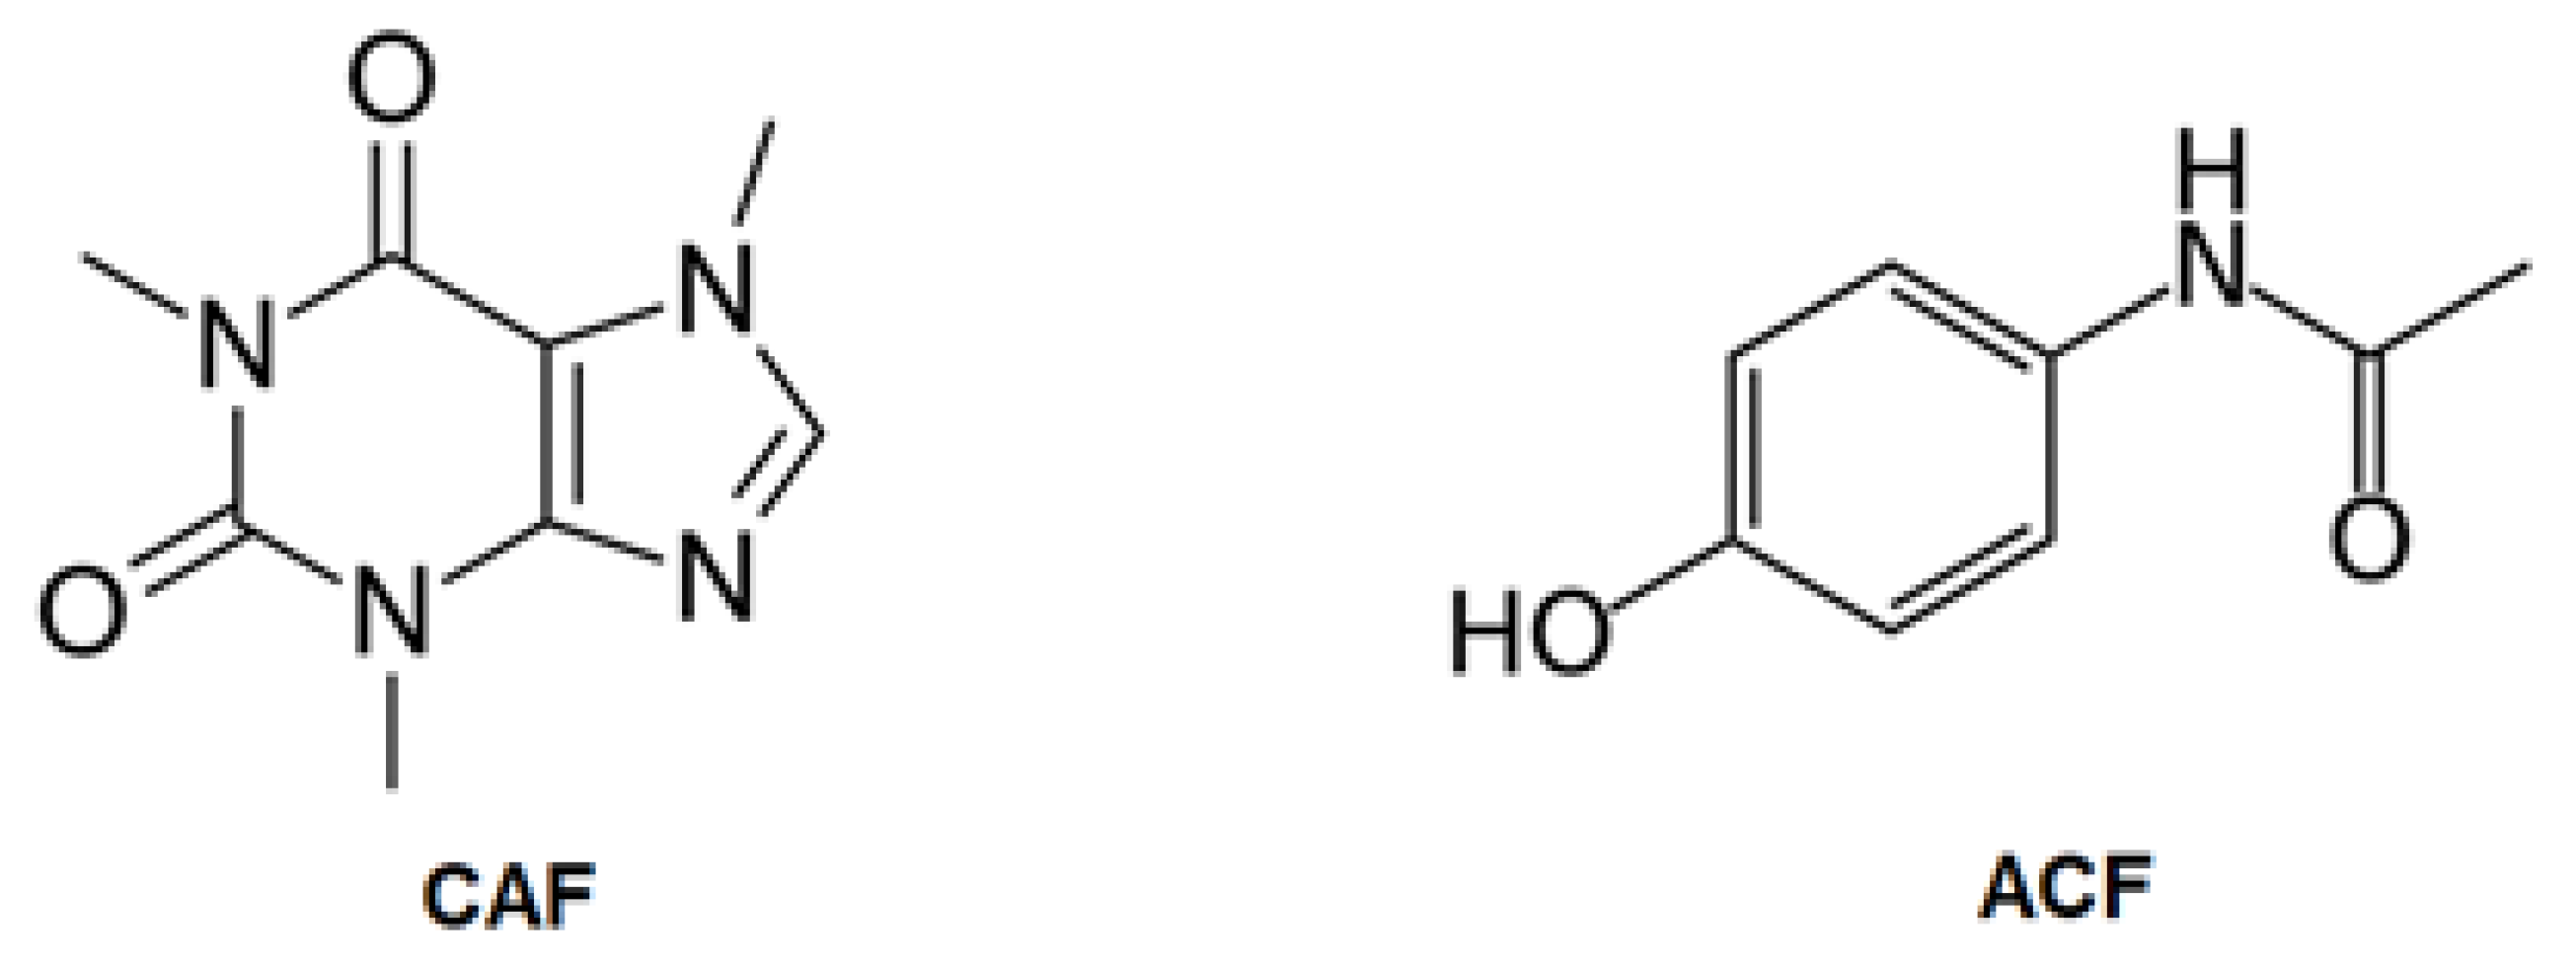
:1. Introduction
2. Results and Discussion
2.1. Characterization of the ACs
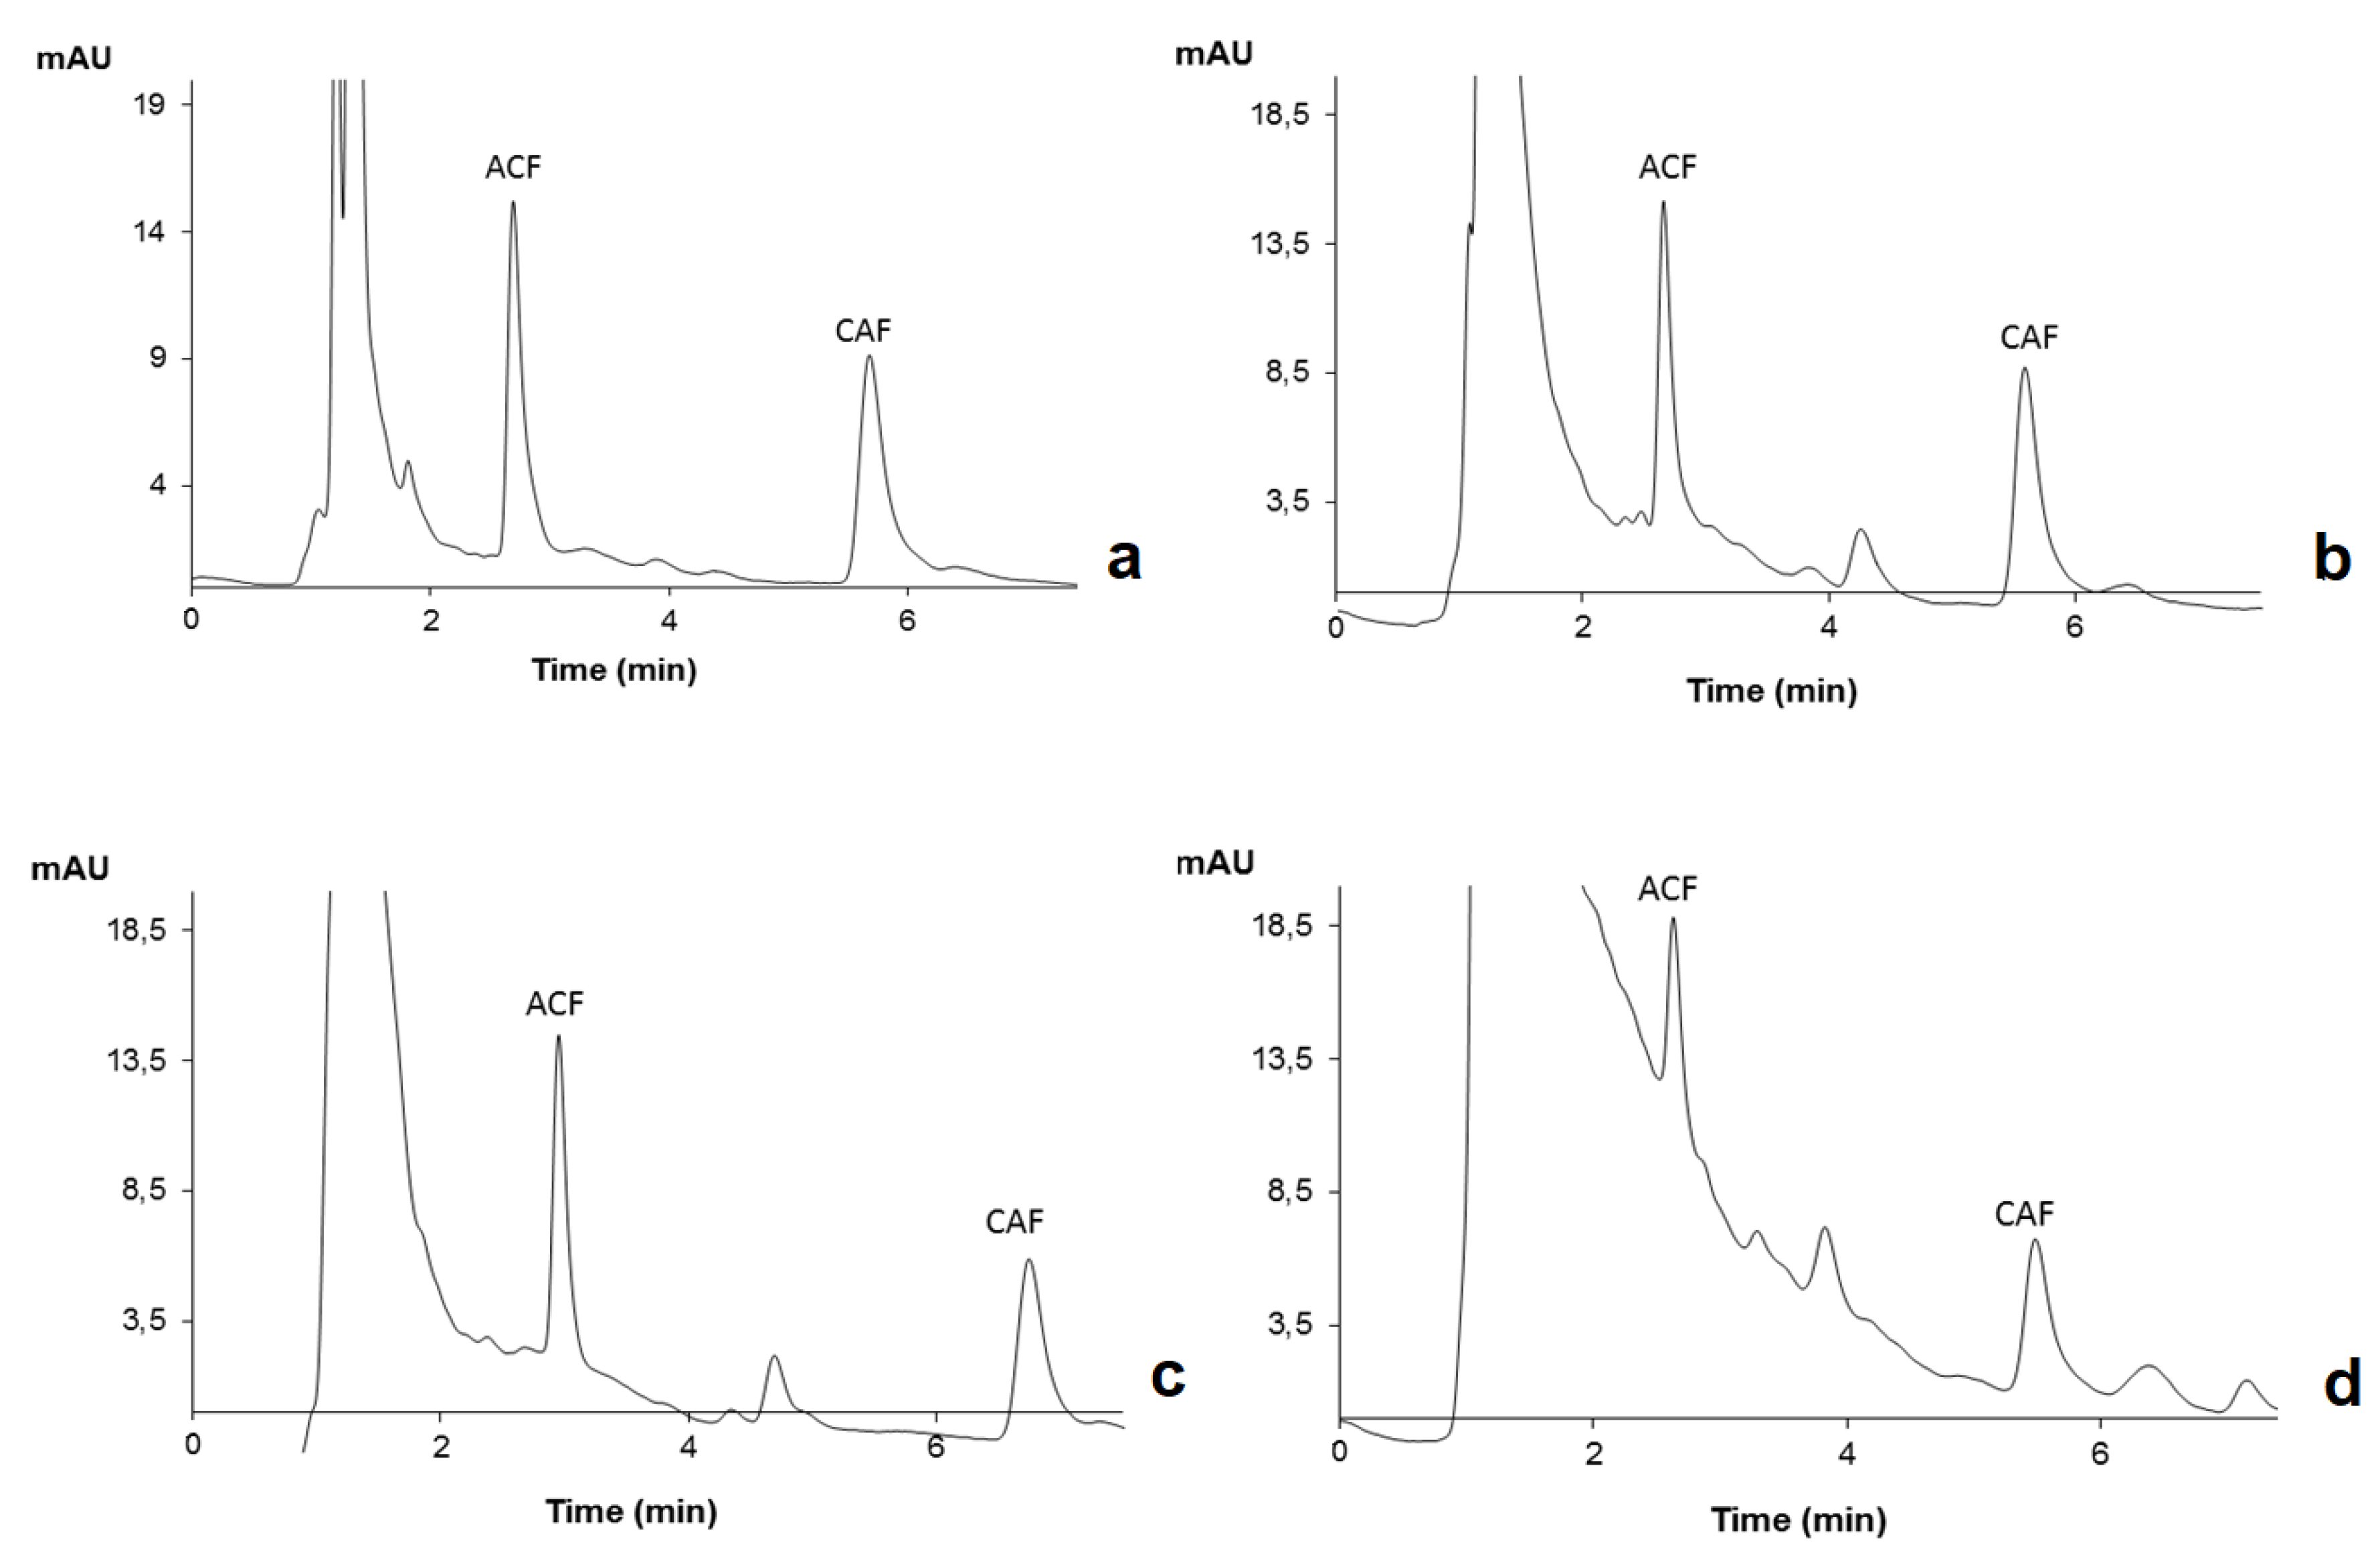
2.2. HPLC-DAD Optimization
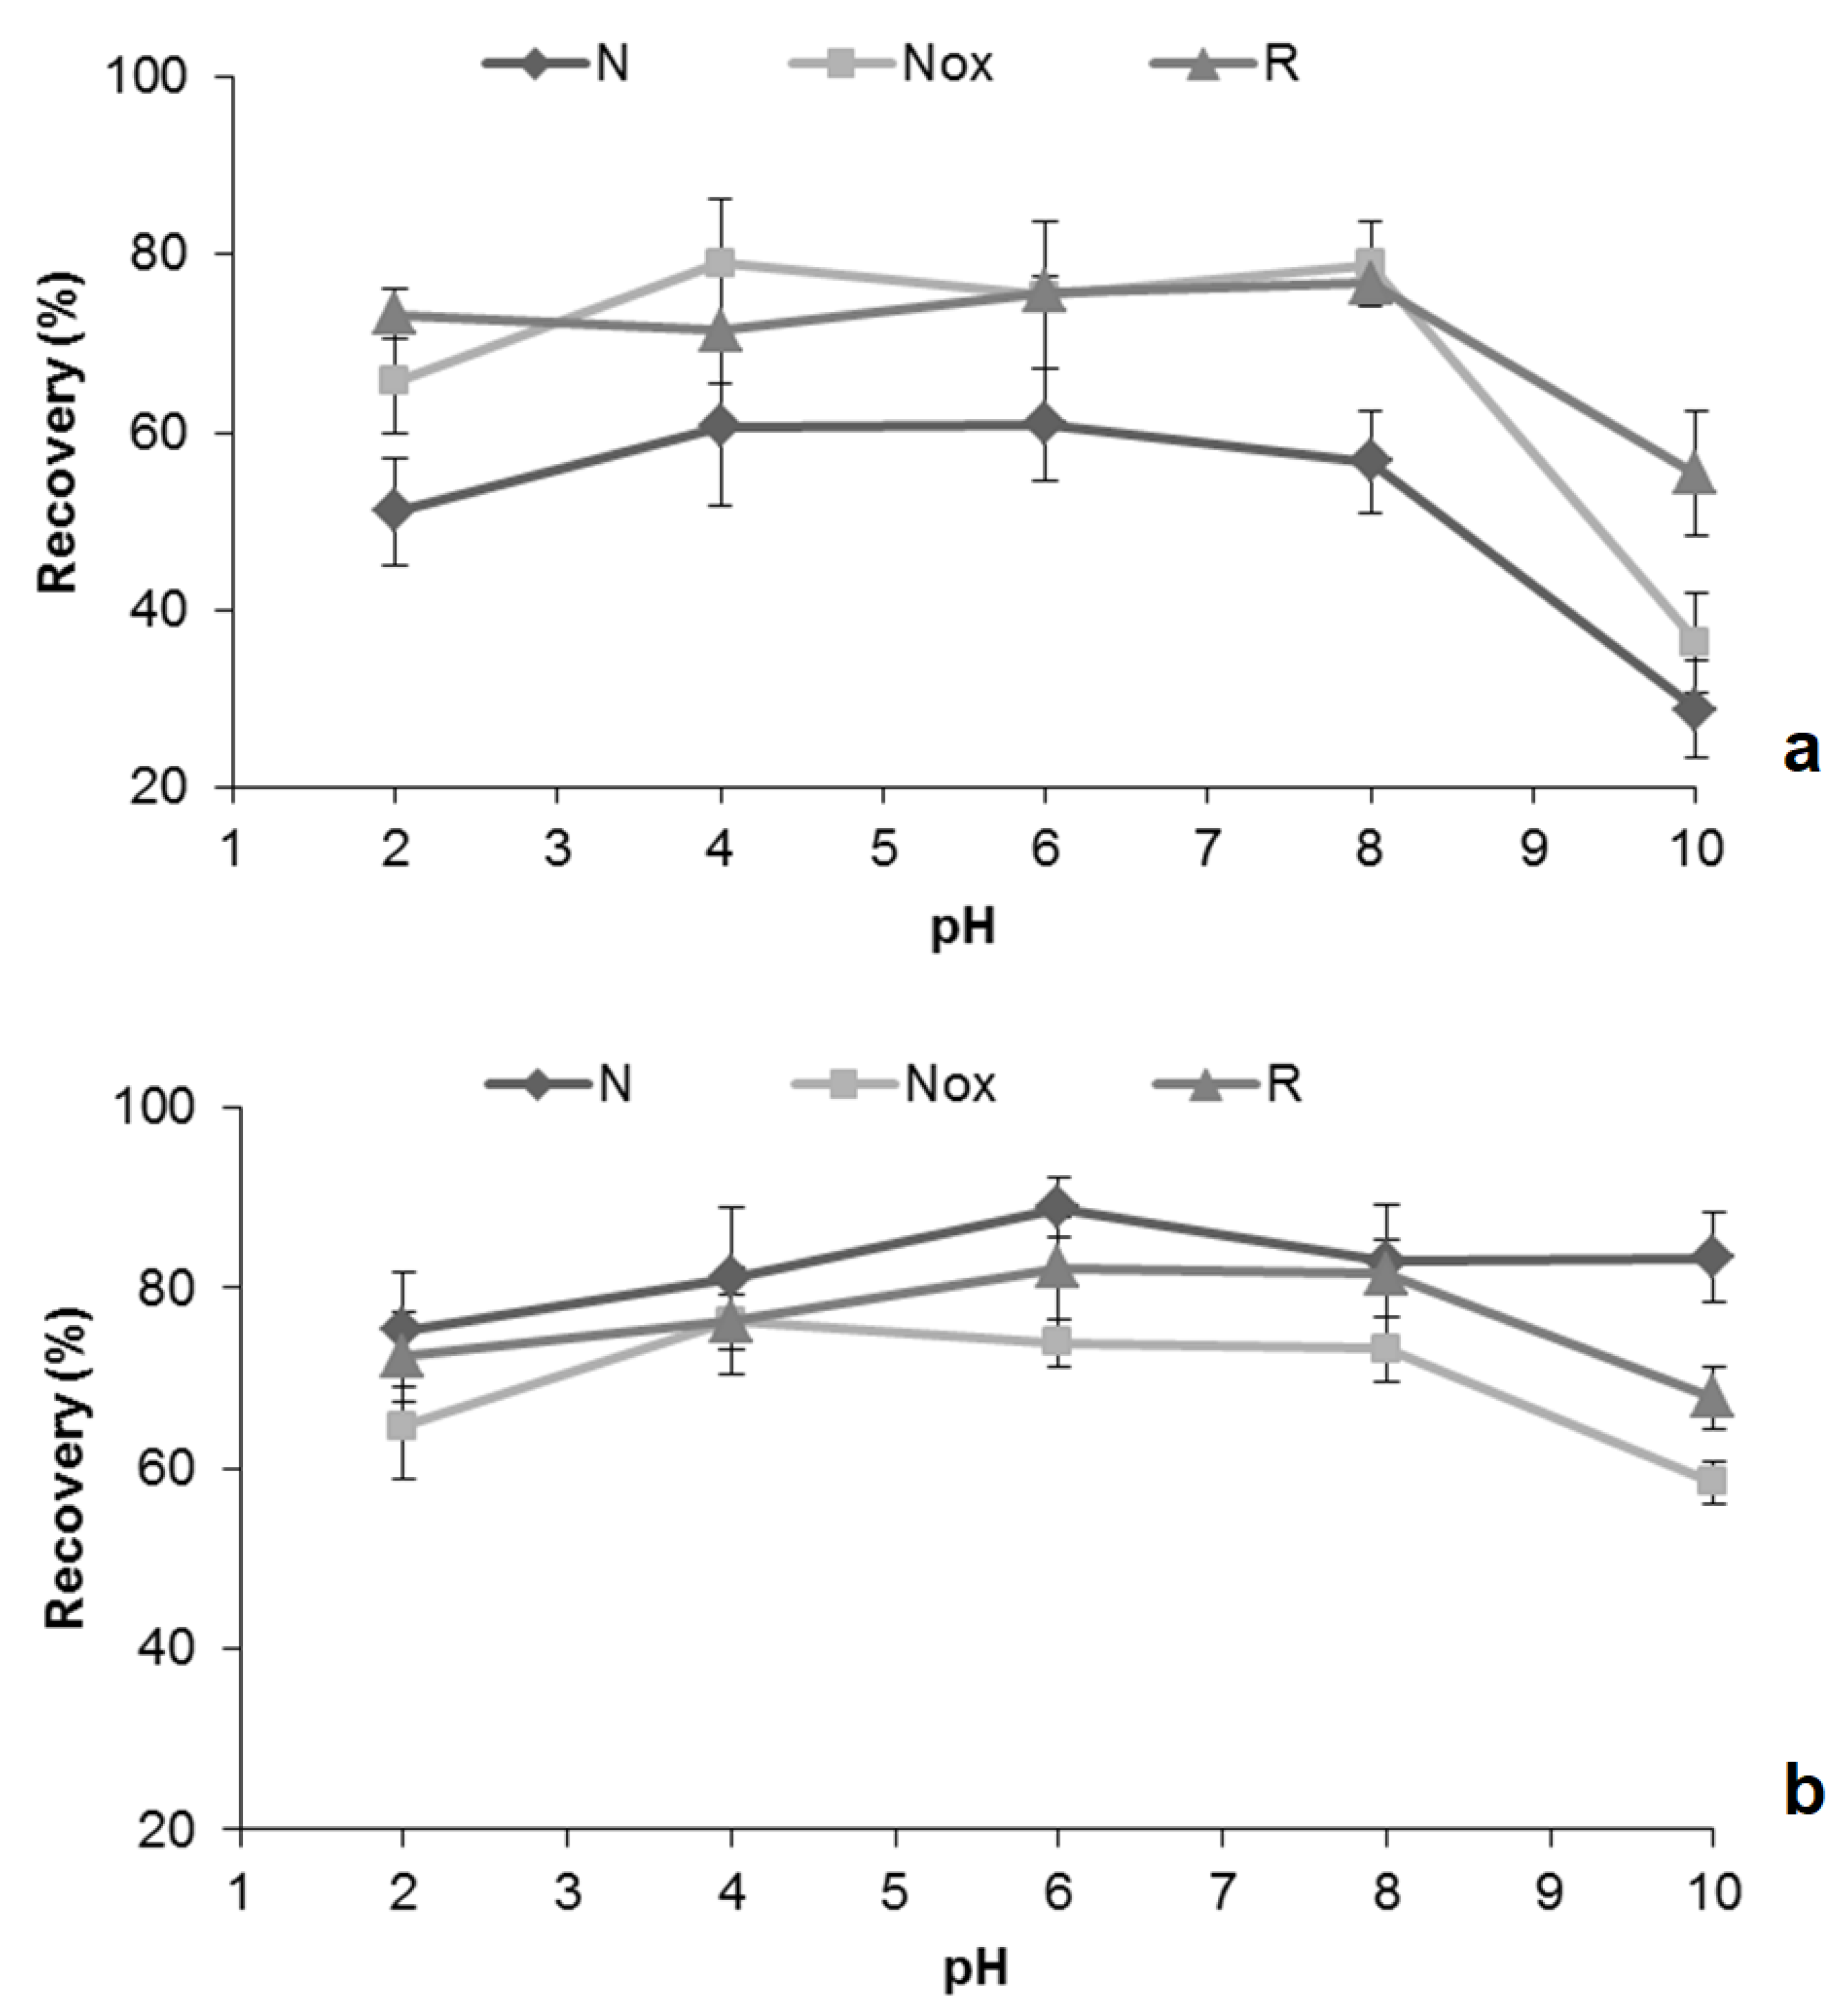
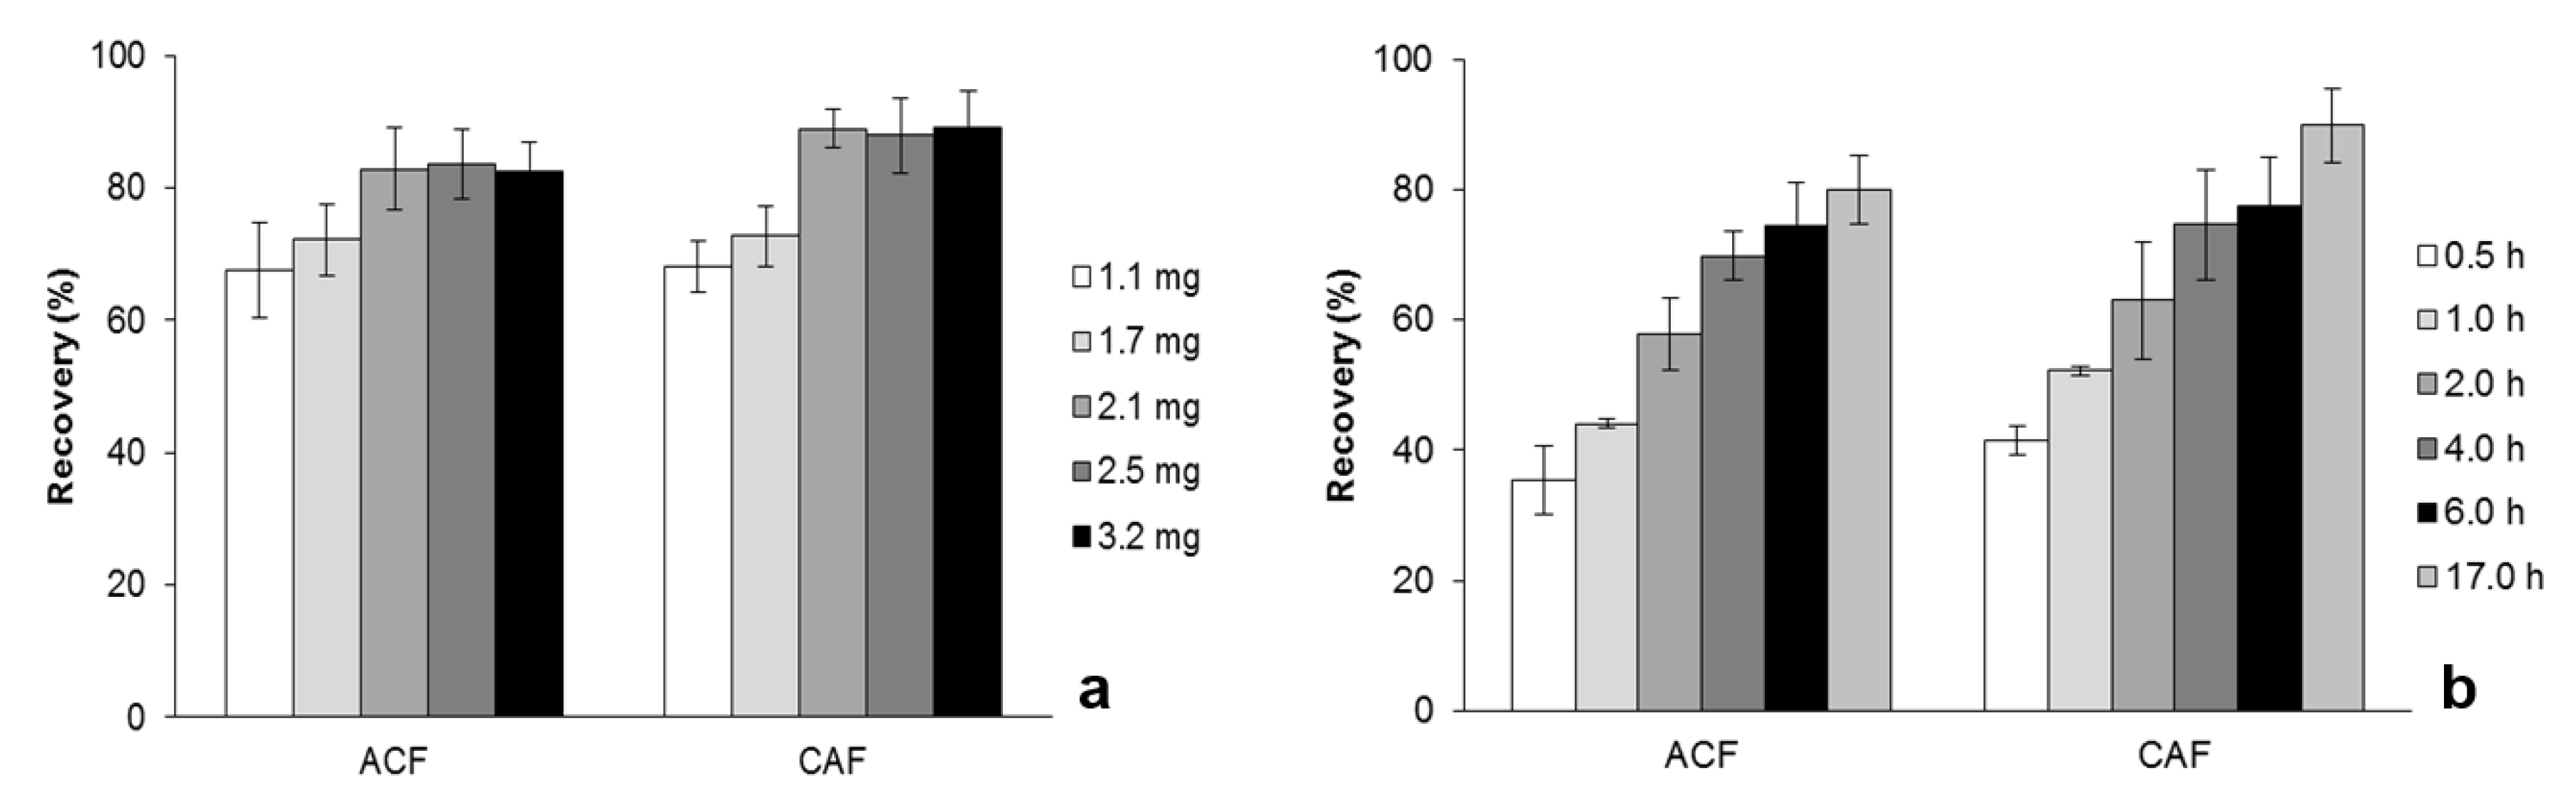
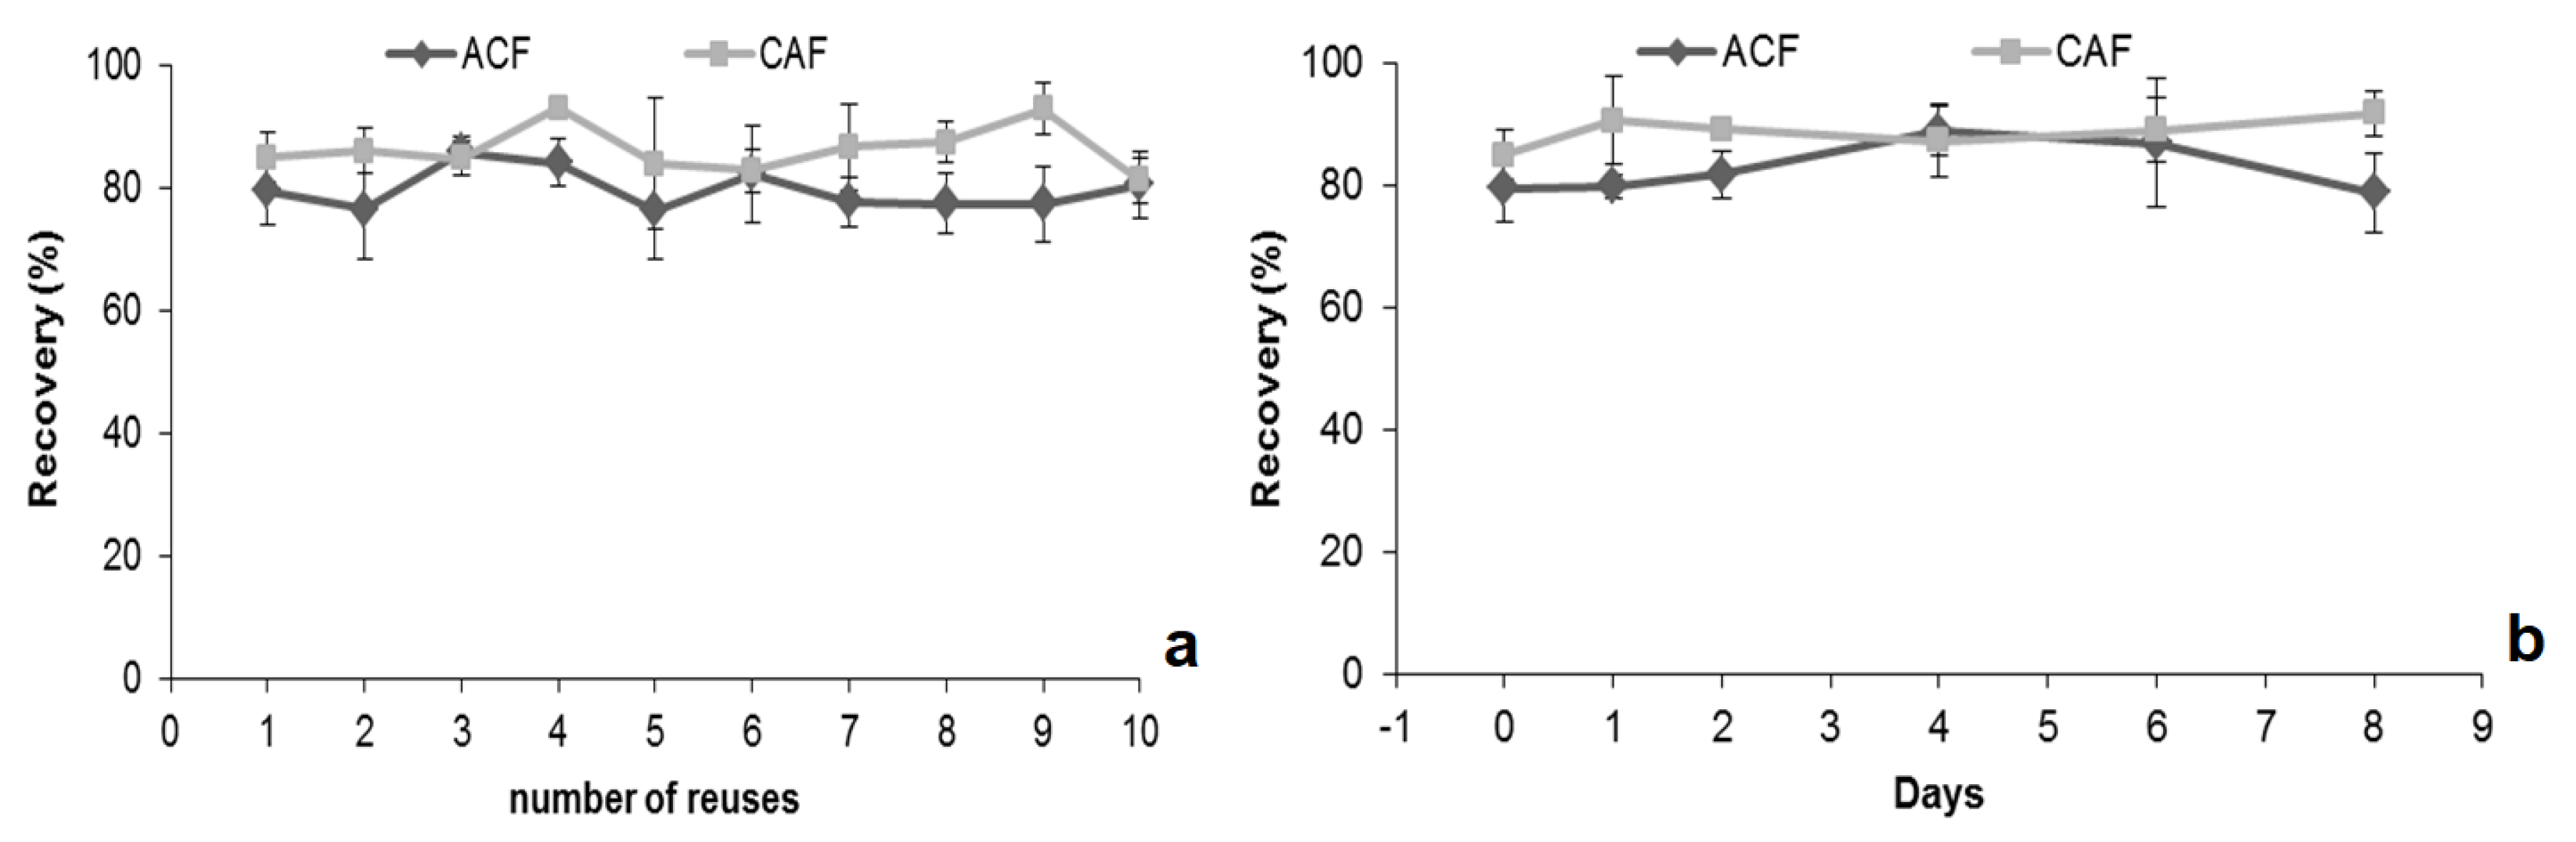
2.3. Optimization of MSAµE(AC)-LD Assays
2.4. Validation of the MSAμE(AC(R))-LD/HPLC-DAD Method
2.5. Application to Environmental Water Matrices
3. Materials and Methods
3.1. Samples and Reagents
3.2. ACs Characterization
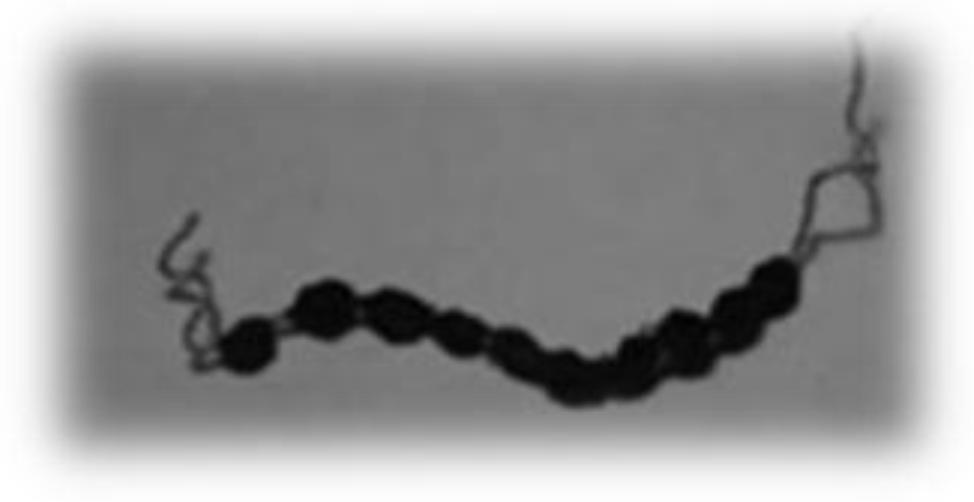
3.3. MSAµE Devices Preparation
3.4. Recovery Assays and Method Validation
3.5. HPLC-DAD Settings
4. Conclusions
Supplementary Materials
Author Contributions
Funding
Acknowledgments
Conflicts of Interest
References
- Kot-wasik, A.; De, J.; Namies, J. Analytical Techniques in Studies of the Environmental Fate of Pharmaceuticals and Personal-Care Products. TrAC-Trend Anal. Chem. 2007, 26, 557–568. [Google Scholar] [CrossRef]
- Sim, W.; Lee, J.; Lee, E.; Shin, S.; Hwang, S.; Oh, J. Occurrence and distribution of pharmaceuticals in wastewater from households, livestock farms, hospitals and pharmaceutical manufactures. Chemosphere 2011, 82, 179–186. [Google Scholar] [CrossRef] [PubMed]
- Sui, Q.; Cao, X.; Lu, S.; Zhao, W.; Qiu, Z.; Yu, G. Occurrence, Sources and Fate of Pharmaceuticals and Personal Care Products in the Groundwater: A Review. Emerg. Contam. 2015, 1, 14–24. [Google Scholar] [CrossRef]
- Al-odaini, N.A.; Pauzi, M.; Ismail, M.; Surif, S. Multi-Residue Analytical Method for Human Pharmaceuticals and Synthetic Hormones in River Water and Sewage Effluents by Solid-Phase Extraction and Liquid Chromatography-Tandem Mass Spectrometry. J. Chromatogr. A 2010, 1217, 6791–6806. [Google Scholar] [CrossRef] [PubMed]
- Wang, J.; Wang, S. Removal of Pharmaceuticals and Personal Care Products (PPCPs) from Wastewater: A Review. J. Environ. Manag. 2016, 182, 620–640. [Google Scholar] [CrossRef] [PubMed]
- Neng, N.R.; Nogueira, J.M.F. Development of a Bar Adsorptive Micro-Extraction-Large-Volume Injection-Gas Chromatography-Mass Spectrometric Method for Pharmaceuticals and Personal Care Products in Environmental Water Matrices. Anal. Bioanal. Chem. 2012, 402, 1355–1364. [Google Scholar] [CrossRef] [PubMed]
- Wang, S.; Oakes, K.D.; Bragg, L.M.; Pawliszyn, J.; Dixon, G.; Servos, M.R. Chemosphere Validation and Use of in Vivo Solid Phase Micro-Extraction (SPME) for the Detection of Emerging Contaminants in Fish. Chemosphere 2011, 85, 1472–1480. [Google Scholar] [CrossRef] [PubMed]
- Nogueira, J.M.F. Microextração Adsortiva Em Barra (BAµE): Um Conceito Analítico Inovador Para Microextração Estática. Sci. Chromatogr. 2014, 5, 275–283. [Google Scholar] [CrossRef]
- Neng, N.R.; Silva, A.R.M.; Nogueira, J.M.F. Adsorptive Micro-Extraction Techniques-Novel Analytical Tools for Trace Levels of Polar Solutes in Aqueous Media. J. Chromatogr. A 2010, 1217, 7303–7310. [Google Scholar] [CrossRef] [PubMed]
- Neng, N.R.; Mestre, A.S.; Carvalho, A.P.; Nogueira, J.M.F. Powdered Activated Carbons as Effective Phases for Bar Adsorptive Micro-Extraction (BAμE) to Monitor Levels of Triazinic Herbicides in Environmental Water Matrices. Talanta 2011, 83, 1643–1649. [Google Scholar] [CrossRef] [PubMed]
- David, F.; Sandra, P. Stir Bar Sorptive Extraction for Trace Analysis. J. Chromatogr. A 2007, 1152, 54–69. [Google Scholar] [CrossRef] [PubMed]
- Neng, N.R.; Nogueira, J.M.F. Determination of Short-Chain Carbonyl Compounds in Drinking Water Matrices by Bar Adsorptive Micro-Extraction (BAμE) with in Situ Derivatization. Anal. Bioanal. Chem. 2010, 398, 3155–3163. [Google Scholar] [CrossRef] [PubMed]
- European Commission. Council Directive 98/83/EC. Off. J. Eur. Commun. 1998, L330, 32–54. [Google Scholar]
- Mokh, S.; El Khatib, M.; Koubar, M.; Daher, Z.; Al Iskandarani, M. Innovative SPE-LC-MS/MS Technique for the Assessment of 63 Pharmaceuticals and the Detection of Antibiotic-Resistant-Bacteria: A Case Study Natural Water Sources in Lebanon. Sci. Total Environ. 2017, 609, 830–841. [Google Scholar] [CrossRef] [PubMed]
- De Kesel, P.M.M.; Lambert, W.E.; Stove, C.P. An Optimized and Validated SPE-LC-MS/MS Method for the Determination of Caffeine and Paraxanthine in Hair. Talanta 2015, 144, 62–70. [Google Scholar] [CrossRef] [PubMed]
- Paíga, P.; Lolić, A.; Hellebuyck, F.; Santos, L.H.M.L.M.; Correia, M.; Delerue-Matos, C. Development of a SPE-UHPLC-MS/MS Methodology for the Determination of Non-Steroidal Anti-Inflammatory and Analgesic Pharmaceuticals in Seawater. J. Pharm. Biomed. Anal. 2015, 106, 61–70. [Google Scholar] [CrossRef] [PubMed]
- Maldaner, L.; Jardim, I.C.S.F. Determination of Some Organic Contaminants in Water Samples by Solid-Phase Extraction and Liquid Chromatography-Tandem Mass Spectrometry. Talanta 2012, 100, 38–44. [Google Scholar] [CrossRef] [PubMed]
- Müller, C.; Vetter, F.; Richter, E.; Bracher, F. Determination of Caffeine, Myosmine, and Nicotine in Chocolate by Headspace Solid-Phase Microextraction Coupled with Gas Chromatography-Tandem Mass Spectrometry. J. Food Sci. 2014, 79, T251–T255. [Google Scholar] [CrossRef] [PubMed]
- Rodil, R.; Muniategui-lorenzo, S. Multiresidue Analysis of Acidic and Polar Organic Contaminants in Water Samples by Stir-Bar Sorptive Extraction–Liquid Desorption–Gas Chromatography–Mass Spectrometry. J. Chromatogr. A 2007, 1174, 27–39. [Google Scholar]
- Togola, A. Multi-Residue Analysis of Pharmaceutical Compounds in Aqueous Samples. J. Chromatogr. A 2008, 1177, 150–158. [Google Scholar] [CrossRef] [PubMed]
- Mestre, A.S.; Pires, J.; Nogueira, J.M.F.; Carvalho, A.P. Activated Carbons for the Adsorption of Ibuprofen. Carbon 2007, 45, 1979–1988. [Google Scholar] [CrossRef]
Sample Availability: Not available. |


| Compounds | Microextraction Techniques | Recovery (%) | Refs. |
|---|---|---|---|
| CAF | MSAµE | 75.3 | This work |
| SPE | 99.3 | 13 | |
| SPE | 88.0 | 14 | |
| SPME | 98.5 | 15 | |
| ACF | MSAµE | 82.6 | This work |
| SPE | 11.3 | 16 | |
| SPE | 47.0 | 17 |
| Compounds | Recovery (%); | |||
|---|---|---|---|---|
| (r2) | ||||
| Ultra-Pure Water | Surface Water | Sea Water | Wastewater | |
| ACF | 75.3 ± 9.5 | 64.8 ± 8.3 | 73.1 ± 2.9 | 50.1 ± 2.2 |
| (0.9983) | (0.9960) | (0.9970) | (0.9953) | |
| CAF | 82.6 ± 2.9 | 83.5 ± 1.1 | 74.6 ± 2.7 | 54.7 ± 5.6 |
| (0.9976) | (0.9935) | (0.9975) | (0.9989) | |
© 2019 by the authors. Licensee MDPI, Basel, Switzerland. This article is an open access article distributed under the terms and conditions of the Creative Commons Attribution (CC BY) license (http://creativecommons.org/licenses/by/4.0/).
Share and Cite
Silva, A.R.M.; Neng, N.R.; Nogueira, J.M.F. Multi-Spheres Adsorptive Microextraction (MSAμE)—Application of a Novel Analytical Approach for Monitoring Chemical Anthropogenic Markers in Environmental Water Matrices. Molecules 2019, 24, 931. https://doi.org/10.3390/molecules24050931
Silva ARM, Neng NR, Nogueira JMF. Multi-Spheres Adsorptive Microextraction (MSAμE)—Application of a Novel Analytical Approach for Monitoring Chemical Anthropogenic Markers in Environmental Water Matrices. Molecules. 2019; 24(5):931. https://doi.org/10.3390/molecules24050931
Chicago/Turabian StyleSilva, Ana R. M., Nuno R. Neng, and José M. F. Nogueira. 2019. "Multi-Spheres Adsorptive Microextraction (MSAμE)—Application of a Novel Analytical Approach for Monitoring Chemical Anthropogenic Markers in Environmental Water Matrices" Molecules 24, no. 5: 931. https://doi.org/10.3390/molecules24050931
APA StyleSilva, A. R. M., Neng, N. R., & Nogueira, J. M. F. (2019). Multi-Spheres Adsorptive Microextraction (MSAμE)—Application of a Novel Analytical Approach for Monitoring Chemical Anthropogenic Markers in Environmental Water Matrices. Molecules, 24(5), 931. https://doi.org/10.3390/molecules24050931