Article

3D-QSAR Studies on Thiazolidin-4-one S1P1 Receptor Agonists by CoMFA and CoMSIA

1
College of Biology Science and Technology, Jinan University, Guangzhou 510632, China
2
Faculty of Chemical Engineering and Light Industry, Guangdong University of Technology, Guangzhou 510006, China
3
Guangdong Province Key Laboratory of Pharmacodynamic Constituents of TCM and New Drugs Research, College of Pharmacy, Jinan University, Guangzhou 510632, China
*
Author to whom correspondence should be addressed.
Int. J. Mol. Sci. 2011, 12(10), 6502-6516; https://doi.org/10.3390/ijms12106502
Submission received: 12 July 2011 / Revised: 2 September 2011 / Accepted: 5 September 2011 / Published: 28 September 2011
(This article belongs to the Section Molecular Toxicology)

Abstract

:
Selective S1P1 receptor agonists have therapeutic potential to treat a variety of immune-mediated diseases. A series of 2-imino-thiazolidin-4-one derivatives displaying potent S1P1 receptor agonistic activity were selected to establish 3D-QSAR models using CoMFA and CoMSIA methods. Internal and external cross-validation techniques were investigated as well as some measures including region focusing, progressive scrambling, bootstraping and leave-group-out. The satisfactory CoMFA model predicted a q2 value of 0.751 and an r2 value of 0.973, indicating that electrostatic and steric properties play a significant role in potency. The best CoMSIA model, based on a combination of steric, electrostatic, hydrophobic and H-bond donor descriptors, predicted a q2 value of 0.739 and an r2 value of 0.923. The models were graphically interpreted using contour plots which gave more insight into the structural requirements for increasing the activity of a compound, providing a solid basis for future rational design of more active S1P1 receptor agonists.

1. Introduction

Sphingosine-1-phosphate (S1P), a widespread lysophospholipid, binds five specific G-protein coupled receptors (S1P1-S1P5) [14] and exerts a variety of biological activities such as vascular maturation, cell survival, proliferation, differentitation, migration and chemotaxis [57]. The S1P1 receptor only couples to Gαi/o while the other S1P receptors are promiscuous with respect to G-protein coupling, activating G12/13 in addition to Gαi/o and also Gαq in the case of S1P2 and S1P3 [8]. S1P1 modulates egress of T-lymphocytes from thymus and peripheral lymphoid organs [9], and experiments [10,11] have demonstrated that targeting S1P1 is sufficient to cause lymphocyte sequestration to thymus and lymphoid organs, without affecting the innate immune system and even cellular reactivity of lymphocytes to antigen challenge. On the other hand, activation of the S1P3 does not relate to lymphocyte recirculation but links to some undesirable effects such as bronchoconstriction, heart rate reduction and pulmonary epithelial leakage [1215]. Selective S1P1 receptor agonists are promisingly developed as a novel immunomodulator. S1P1 receptor has been considered a potential target for a variety of immune-mediated diseases, including rheumatoid arthritis, psoriasis and multiple sclerosis disease. Recently, a novel class of S1P1 receptor agonists based on the 2-imino-thiazolidin-4-one scaffold has been reported [8] and ligand-based drug design techniques will be employed to guide the synthesis of future generations of S1P1 receptor agonists since the crystal structure of S1P1 receptor remained unclear.
Three-dimensional quantitative structure-activity relationship (3D-QSAR) techniques are useful methods of ligand-based drug design by correlating physicochemical descriptors from a set of related compounds to their known molecular activity or molecular property values [16,17]. Many researchers [18,19] have carried out quantitative structure activity relationship (QSAR) studies on thiazolidin-4-ones as anti-HIV agents, but the present work reports the first application of QSAR to study thiazolidin-4-ones as potent S1P1 receptor agonists [8]. We studied 61 2-imino-thiazolidin-4-one derivatives using comparative molecular field analysis (CoMFA) [20] and comparative molecular similarity indices analysis (CoMSIA) [21]. The satisfactory QSAR models obtained provide a solid basis for future rational design of more active and selective S1P1 receptor agonists within the family of S1P receptors.

2. Results and Discussion
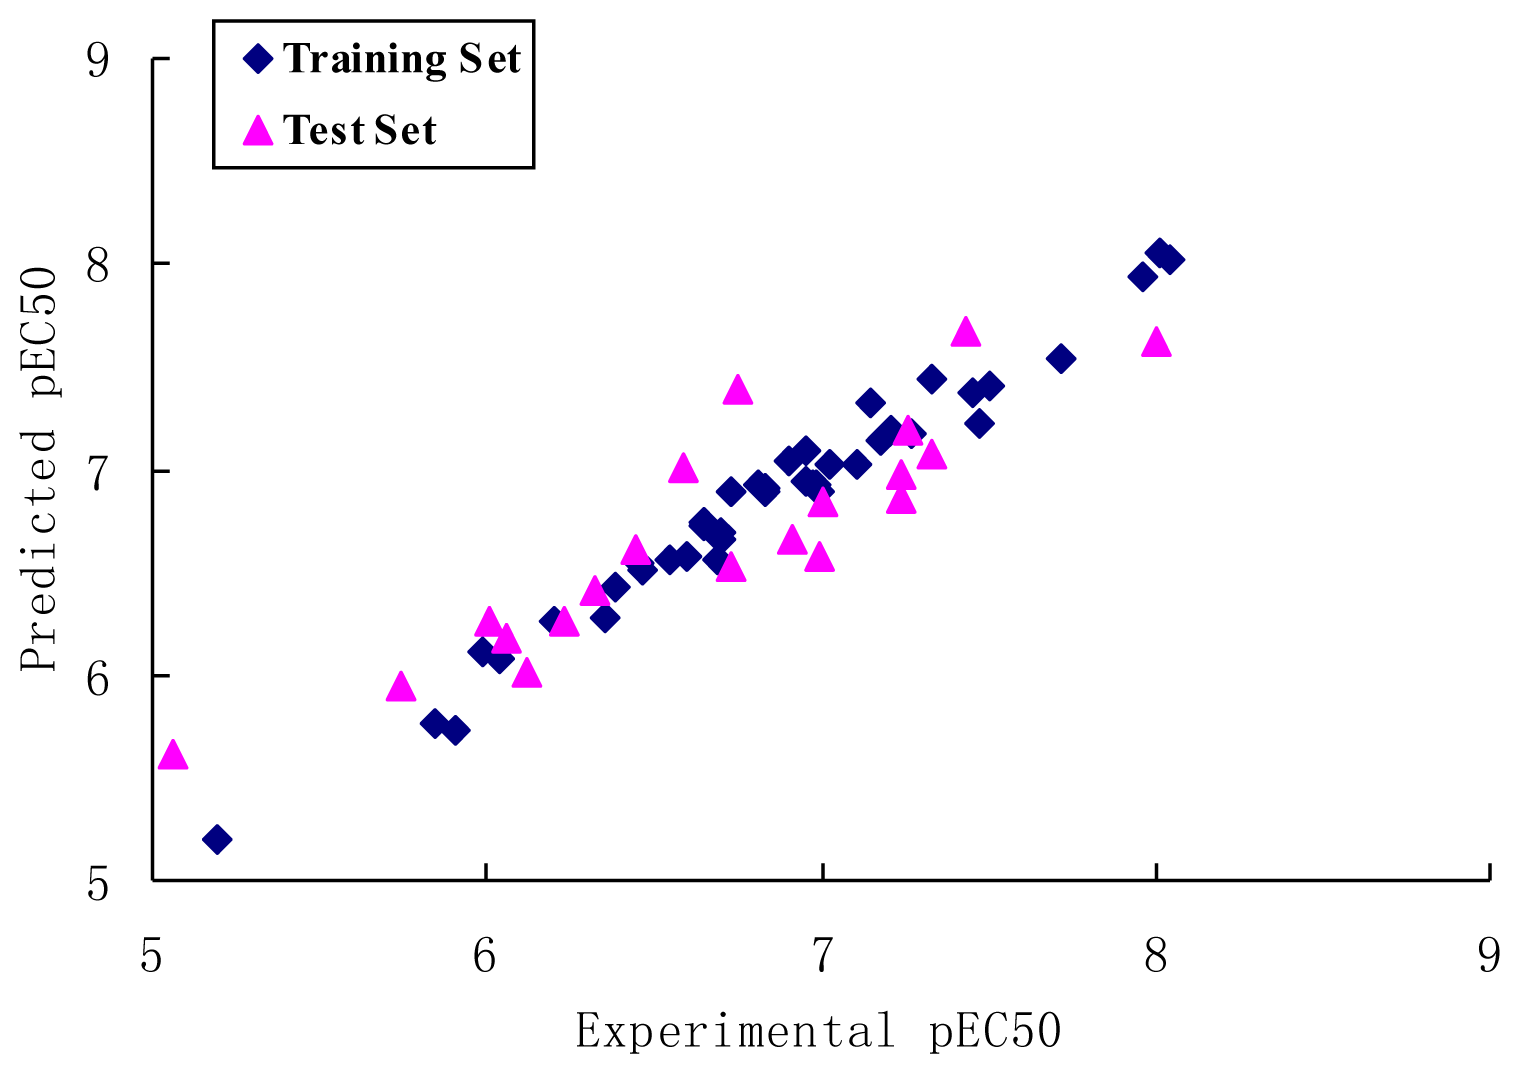
2.1. CoMFA Analysis

The most active molecule 60 was selected as the template for alignment (Figure 1) and the CoMFA model provided a cross-validation q2 value of 0.751 with 5 components and an r2 value of 0.973 (Table 1). The activity values predicted for the tested compounds are in good agreement with the experimental values (Figure 2) and the r2 pred value of 0.904 further confirms that the model is reliable and accurate with higher predictive capacity. The steric and electrostatic field contributions to the final model were 54.5% and 45.5%, respectively. The results of the progressive scrambling showed that the value for the slope in the 5 component model is acceptable (Figure 3), and the optimum statistics are also seen for 5 components because cSDEP is at a minimum with Q2 at a maximum (Table 2).

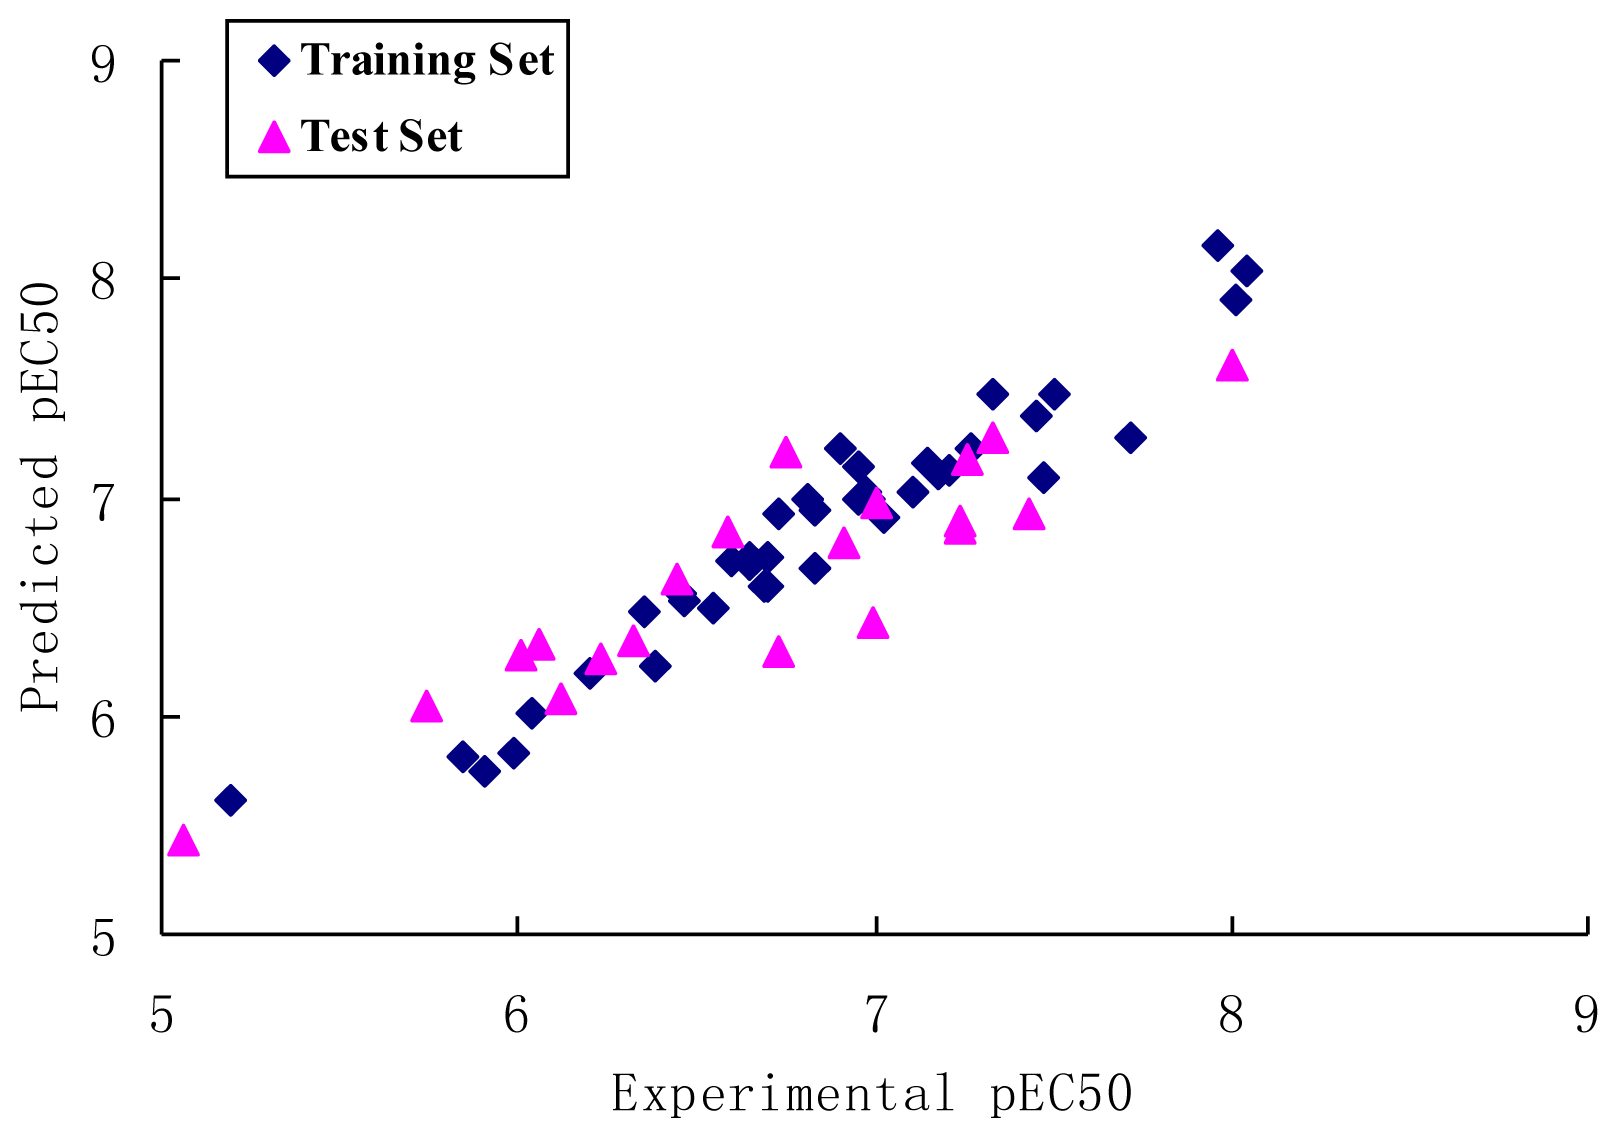
2.2. CoMSIA Analysis

Eight CoMSIA models were generated using combinations of two, three, four, and all five descriptors as shown in Table 3. Model 6, based on four descriptors of steric, electrostatic, hydrophobic and H-bond donor fields was found to be the most accurate yielding a q2 value of 0.739 and an r2 value of 0.923. The Group cross q2 value of 0.740, bootstrapped value of 0.973 ± 0.007 and test set r2 value of 0.730 further approve that it is the best CoMSIA model. The predicted values are consistent with the experimental data (Figure 4). The steric field explains 12.5% of the variances, the electrostatic field explains 29.0%, the hydrophobic field for 30.3% and the hydrogen-bond donor for 28.2% of the variance.

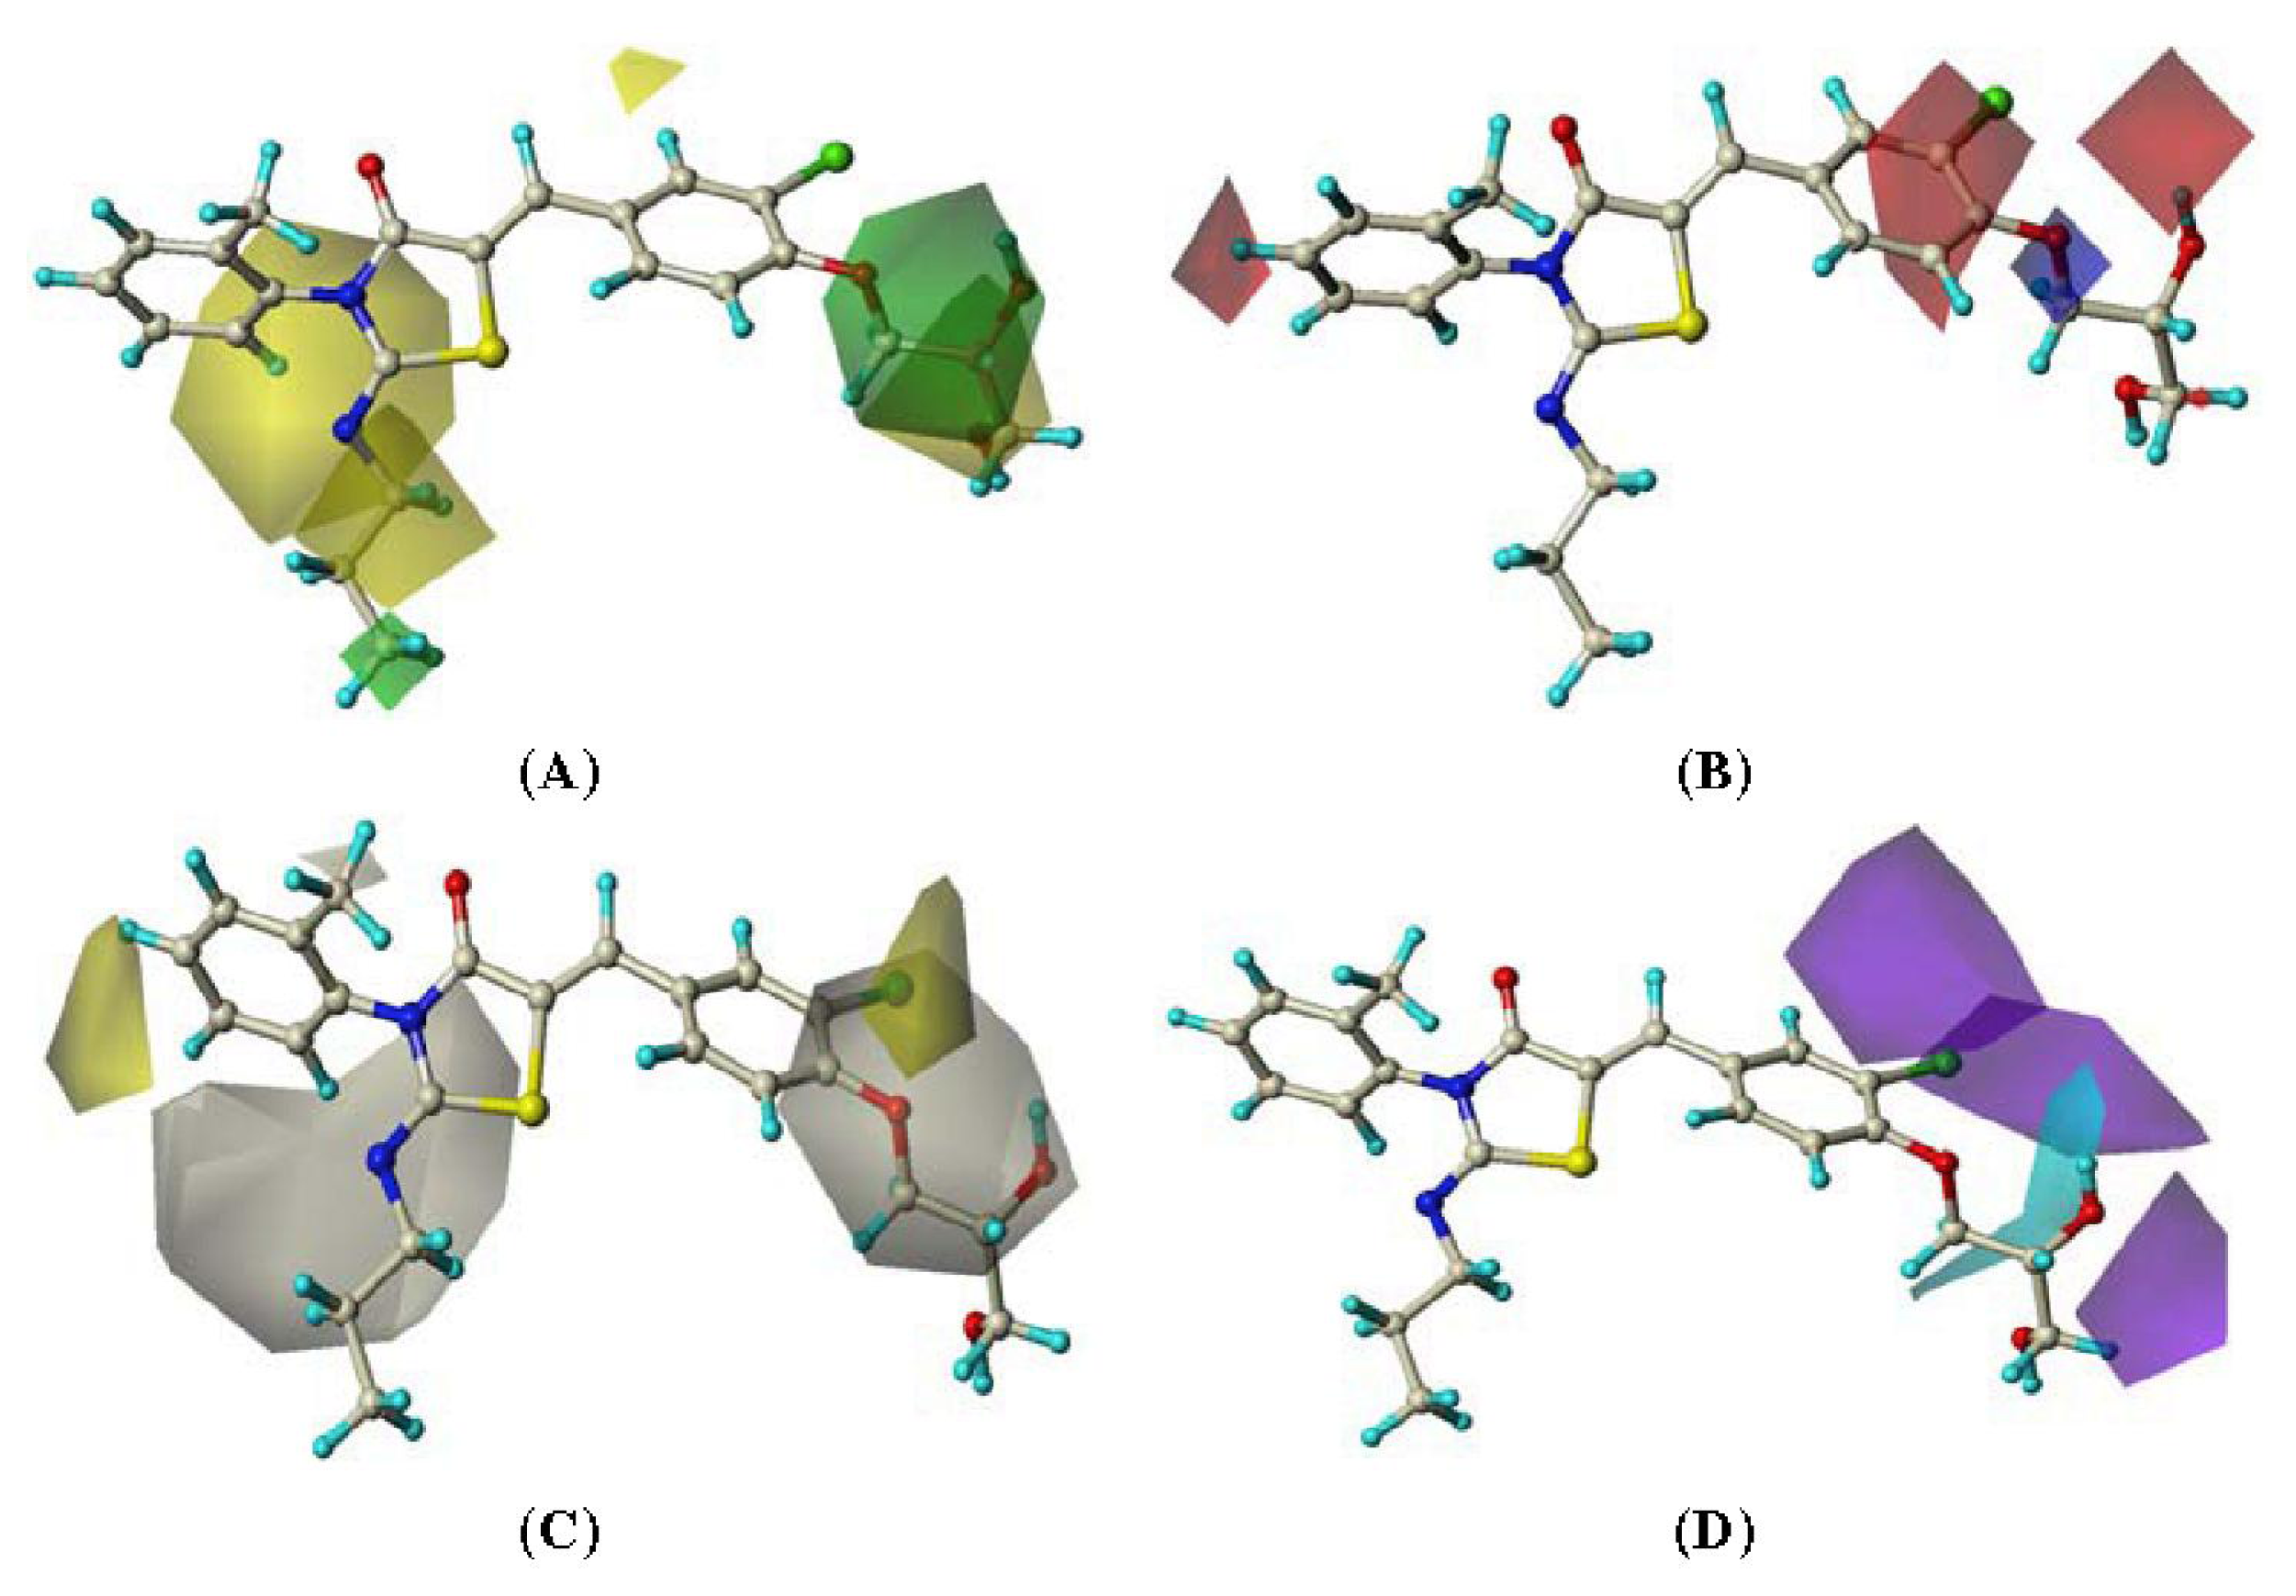
2.3. CoMFA Contour Maps

The results of 3D-QSAR models are presented in the contour coefficient maps as shown in Figure 5. The CoMFA steric contour map of the most active compound 60 shows a large green polyhedron around 3, 4-positions of 5-benzylidene and a small green one locates near 2-position of N3-phenyl ring, suggesting that bulky substituents are preferred in these regions. Large yellow polyhedra at 2-position of 5-benzylidene and around 2-substituent at the iminothiazolidinone scaffold indicate that bulks are disfavored here. These may be the reason why compound 60 with a chlorine atom and a hydroxylethyloxyl substitution at 3- and 4-positions of 5-benzylidene respectively, a methyl group linking to 2-position of 3-phenyl ring substituted at iminothiazolidinone ring, and no substitutions at 2-position of 5-benzylidene ring, showed the most active. Similar to compound 60, compounds 58, 59, 61 displayed almost identical potency. On the other hand, compound 56, with the reverse of substitution at each corresponding position, showed very low activity. The contour maps also show that compounds 18, 25–27, 40 exhibited much higher potency than 19, 30–32, 46 correspondingly. At the same time, the steric contour illustrated a weak trend for a reducing chain length to steadily improve the compound’s potency. For example, the activity of compounds 12, 11, 10, 9 was decreased in turn.
For the electrostatic contour plots, two small blue polyhedra and a large red polyhedron are both located around the side chain linking to 4-position of 5-benzylidene, indicating that negatively charged groups and electron donating groups are both available in these regions. A large red polyhedron located at 3-position of 5- benzylidene and around 3, 4-positions of N3-phenyl ring, indicating that electron-withdrawing groups are preferred at these positions. That is why compounds 26–28 were shown to be more potent than compounds 29–32 with electron-donating groups, and compounds 50–54 without any substituents at 3-position of 5-benzylidene displayed more potency than the corresponding compound 56. Combined with its steric contour map, the chloro-substituent at 3-position of the benzylidene ring is essential group for compound’s potency on S1P1.

2.4. CoMSIA Contour Maps

The best CoMSIA model contour maps of the most active analog (compound 60 in Table 4) are shown in Figure 6. Its steric and electrostatic contour plots (Figure 6A, B) correlate well with the CoMFA contour maps described above. Figure 6C displays the hydrophobic contour map represented by yellow and white polyhedra. A large yellow polyhedron and a small polyhedron located around 2, 3, 4-positions of N3-phenyl ring respectively, indicating that hydrophobic substituents on ligands in these regions can be favored and the white ones disfavored such substituents. That is why compounds 5861 with a methyl group at the region showed far more potent than others. Figure 6D shows the CoMSIA hydrogen-bond donor fields denoted by cyan and purple contours. Cyan contours represent regions where hydrogen-bond donor substituents are preferred and purple contours indicate unfavorable regions. One large cyan contour around the side chain linking to 4-position of 5-benzylidene indicate that the free OH at 4-position or on its side chain is necessary for potencies. A large purple contour at 2, 3-positions respectively shows where such substituents may be disfavored. That is why compound 40 showed more potent than 41 while compound 56 was less active than compounds 50–54 and 57.

3. Materials and Methods

3.1. Data Set

Sixty-one compounds in the present study were taken from the published works of Martin H. Bolli and co-workers [8], and some molecules whose activity was shown not to be very exact from the experimental study were excluded. The structures of the molecules and their biological data are given in Table 4. For convenience, the EC50 values of S1P1 receptor agonists were often converted to their negative logarithm (pEC50) values. The pEC50 values of these compounds have a span of 3.0 log units from 5.06 to 8.04, providing a broad and homogenous data set for 3D-QSAR study [22]. 20 compounds were randomly selected as the test set based on the structural diversity while the remaining 41 compounds were taken as the training set.
Three-dimensional structure building and all modeling were performed using the SYBYL 8.1 program package of Tripos, Inc. 3D structures of all compounds were constructed using the Sketch Molecule module. Structural energy minimization was carried out using the standard Tripos molecular mechanics force field and Gasteiger–Hückle charge, with the convergence criterion set at 0.05 kcal/(Å mol) and the max iterations for the minimization set to 2000.
One method of 3D-QSAR optimization is known as region focusing [23]. However, application of region focusing in this study resulted in a little decrease from 0.751 to 0.739 for the internal validity and from 0.973 to 0.958 for the non-validated r2. Obviously, the region focusing is not essential in this CoMFA model.

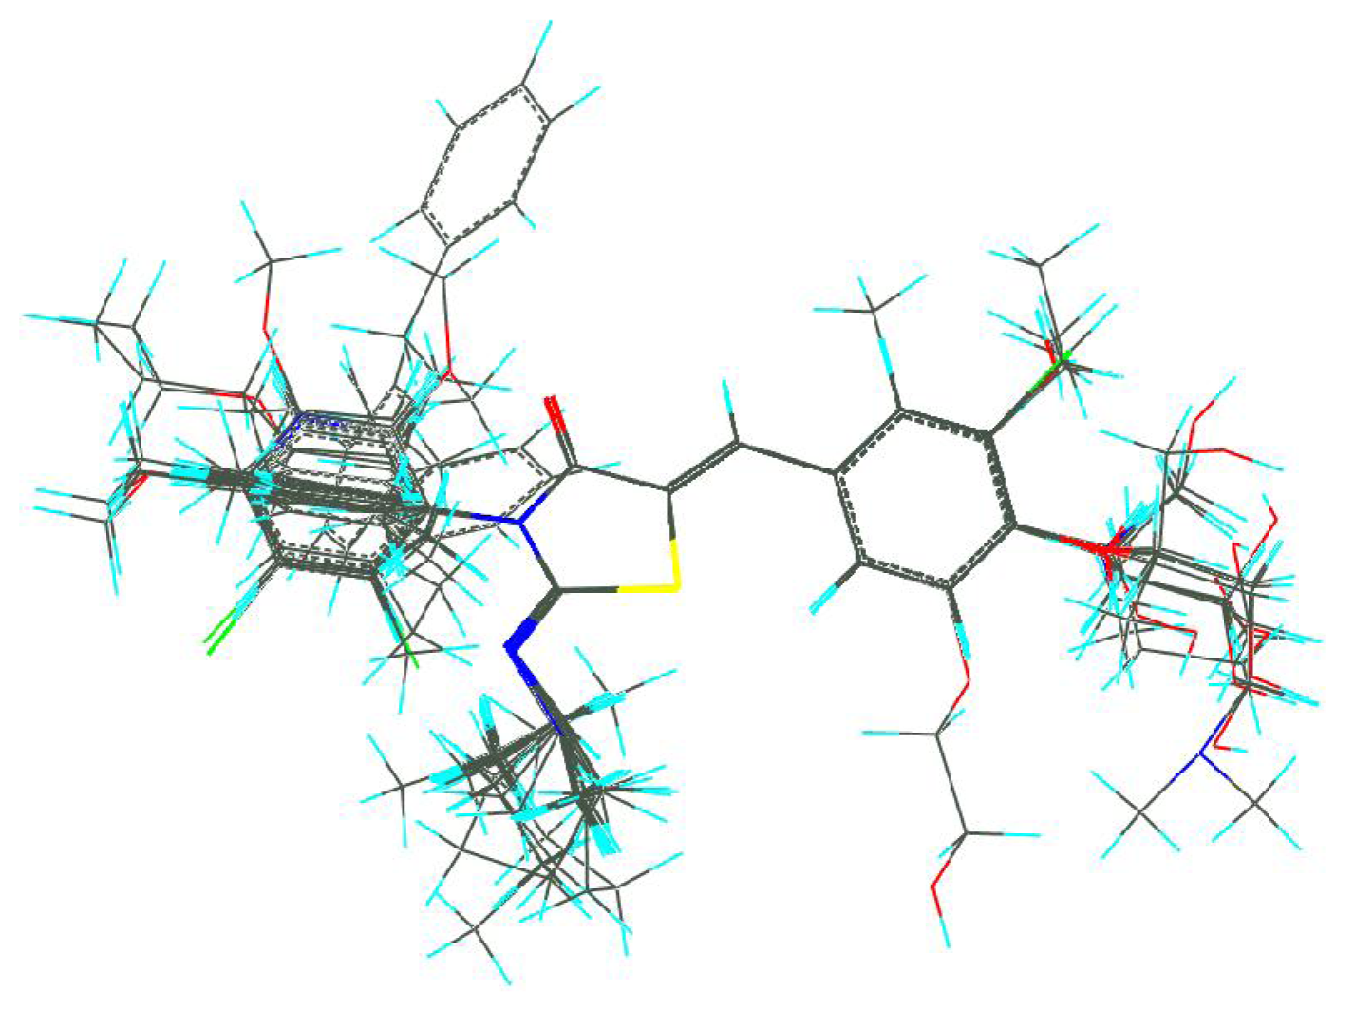
3.2. Molecular Alignment

A good alignment is the most important element for CoMFA and CoMSIA analysis although probe atom type, lattice shifting step size and over all orientation of the aligned compounds may have a bearing on their results [24]. The quality and the predictive ability of the model are directly dependent on the alignment rules. Once the active conformation was determined by energy minimization using Powell method and Tripos standard force field [25] with a distance-dependent dielectric function, the alignment was performed based on some rules such as substructure overlap, pharmacophore overlap and docking [26]. In order to produce a more robust CoMFA and CoMSIA models with a good cross-validated r2 value, the 5-benzylidenylthizaolindin-4-one with structural rigidity was selected as the common substructure to overlap and to align all of the molecules and the most active compound 65 was used as the alignment template. Alignment of all compounds was shown in Figure 1. It can be seen that all the compounds studied have similar active conformations.

3.3. Partial Least Squares (PLS) Analysis

PLS analysis [27], used to linearly correlate the 3D-QSAR fields to biological activity values, was first carried out by the leave-one-out (LOO) and leave-group-out (10 compound groups) cross-validation methods, respectively, to determine cross-validated r2 (q2) values and the optimal number of components, in which one compound was removed from the data set and its activity was predicted using the model from the rest of the data set. Non-cross-validation was then performed to establish the final 3D-QSAR model using the optimal number of components, in which conventional correlation coefficient (r2), standard errors of estimate (SEE), and F ratio between the variances of calculated and observed activities were given.
The optimal number of components, usually corresponding to the highest cross-validated squared coefficient (q2), was selected on the basis of the lowest standard error of prediction (SEP) and avoiding over-fitting the models. A higher component was accepted and used only when the q2 differences between two components was larger than 10%. The q2 has been a good indicator of the accuracy of actual predictions. In general, q2 values can be separated into three categories: q2 > 0.6 means a fairly good model, q2 = 0.4 – 0.6 means a questionable model, and q2 < 0.4 a poor model [27]. To further assess the robustness of the derived models, bootstraping analysis (10 runs) was also utilized to calculate confidence intervals for the r2 and SEE [28,29].

3.4. CoMFA Studies

Three-dimensional grid spacing was set at 2 Å in the x, y, and z directions and a 3D cubic lattice consisted its grid region that extended at least 4 Å beyond van der Waals volume of all aligned molecules in all directions. Steric energy (Lennard-Jones potential) and electrostatic energy (Coulomb potential) were calculated using the Tripos force field for each molecule, and the sp3-hybrized carbon atom with a +1 charge was taken as the probe atom to determine the magnitude of the field values. All energies that exceeded the cutoff value of 30 kcal/mol were ignored for the reduction of domination by large steric and electrostatic energies. With standard options for scaling of variables, the regression analysis was carried out using partial least squares (PLS) method [27]. To improve the signal to noise ratio, the column filtering was set to 2.0 kcal/mol, then those lattice points whose energy variation was below this threshold were automatically omitted [30]. The final model was developed with the optimum number of components to yield a non cross-validated r2 value. Despite being unable to describe all of the binding forces, CoMFA is still a widely useful tool for QSAR analysis at 3D level.

3.5. CoMSIA Studies

CoMSIA is similar to CoMFA based on the same assumption that changes in binding affinities of ligands are related to changes in molecular properties represented by fields. Moreover, for CoMSIA, besides steric and electrostatic fields, three other different fields (hydrophobic, hydrogen bond donor, and hydrogen bond acceptor) are calculated [31]. A Gaussian function was introduced to determine the distance between the probe atom and the molecule atoms. Similarity indices inside and outside different molecular surfaces can be calculated at all grid points, however only outside indices were calculated in CoMFA. Equation used to calculate the similarity indices is as follows:
A F , K ( j ) q = i W p r o b e , k W i k e - α r i q 2
Where, A is the similarity index at grid point q, summed over all atoms i of the molecule j under investigation. Wprobe, k is the probe atom with radius 1 Å, charge +1, hydrophobicity +1, hydrogen bond donating +1 and hydrogen bond accepting +1. Wik is the actual value of the physicochemical property k of atom i. riq is the mutual distance between the probe atom at grid point q and atom i of the test molecule. α is the attenuation factor whose optimal value is normally between 0.2 and 0.4, with a default value of 0.3 [32,33].

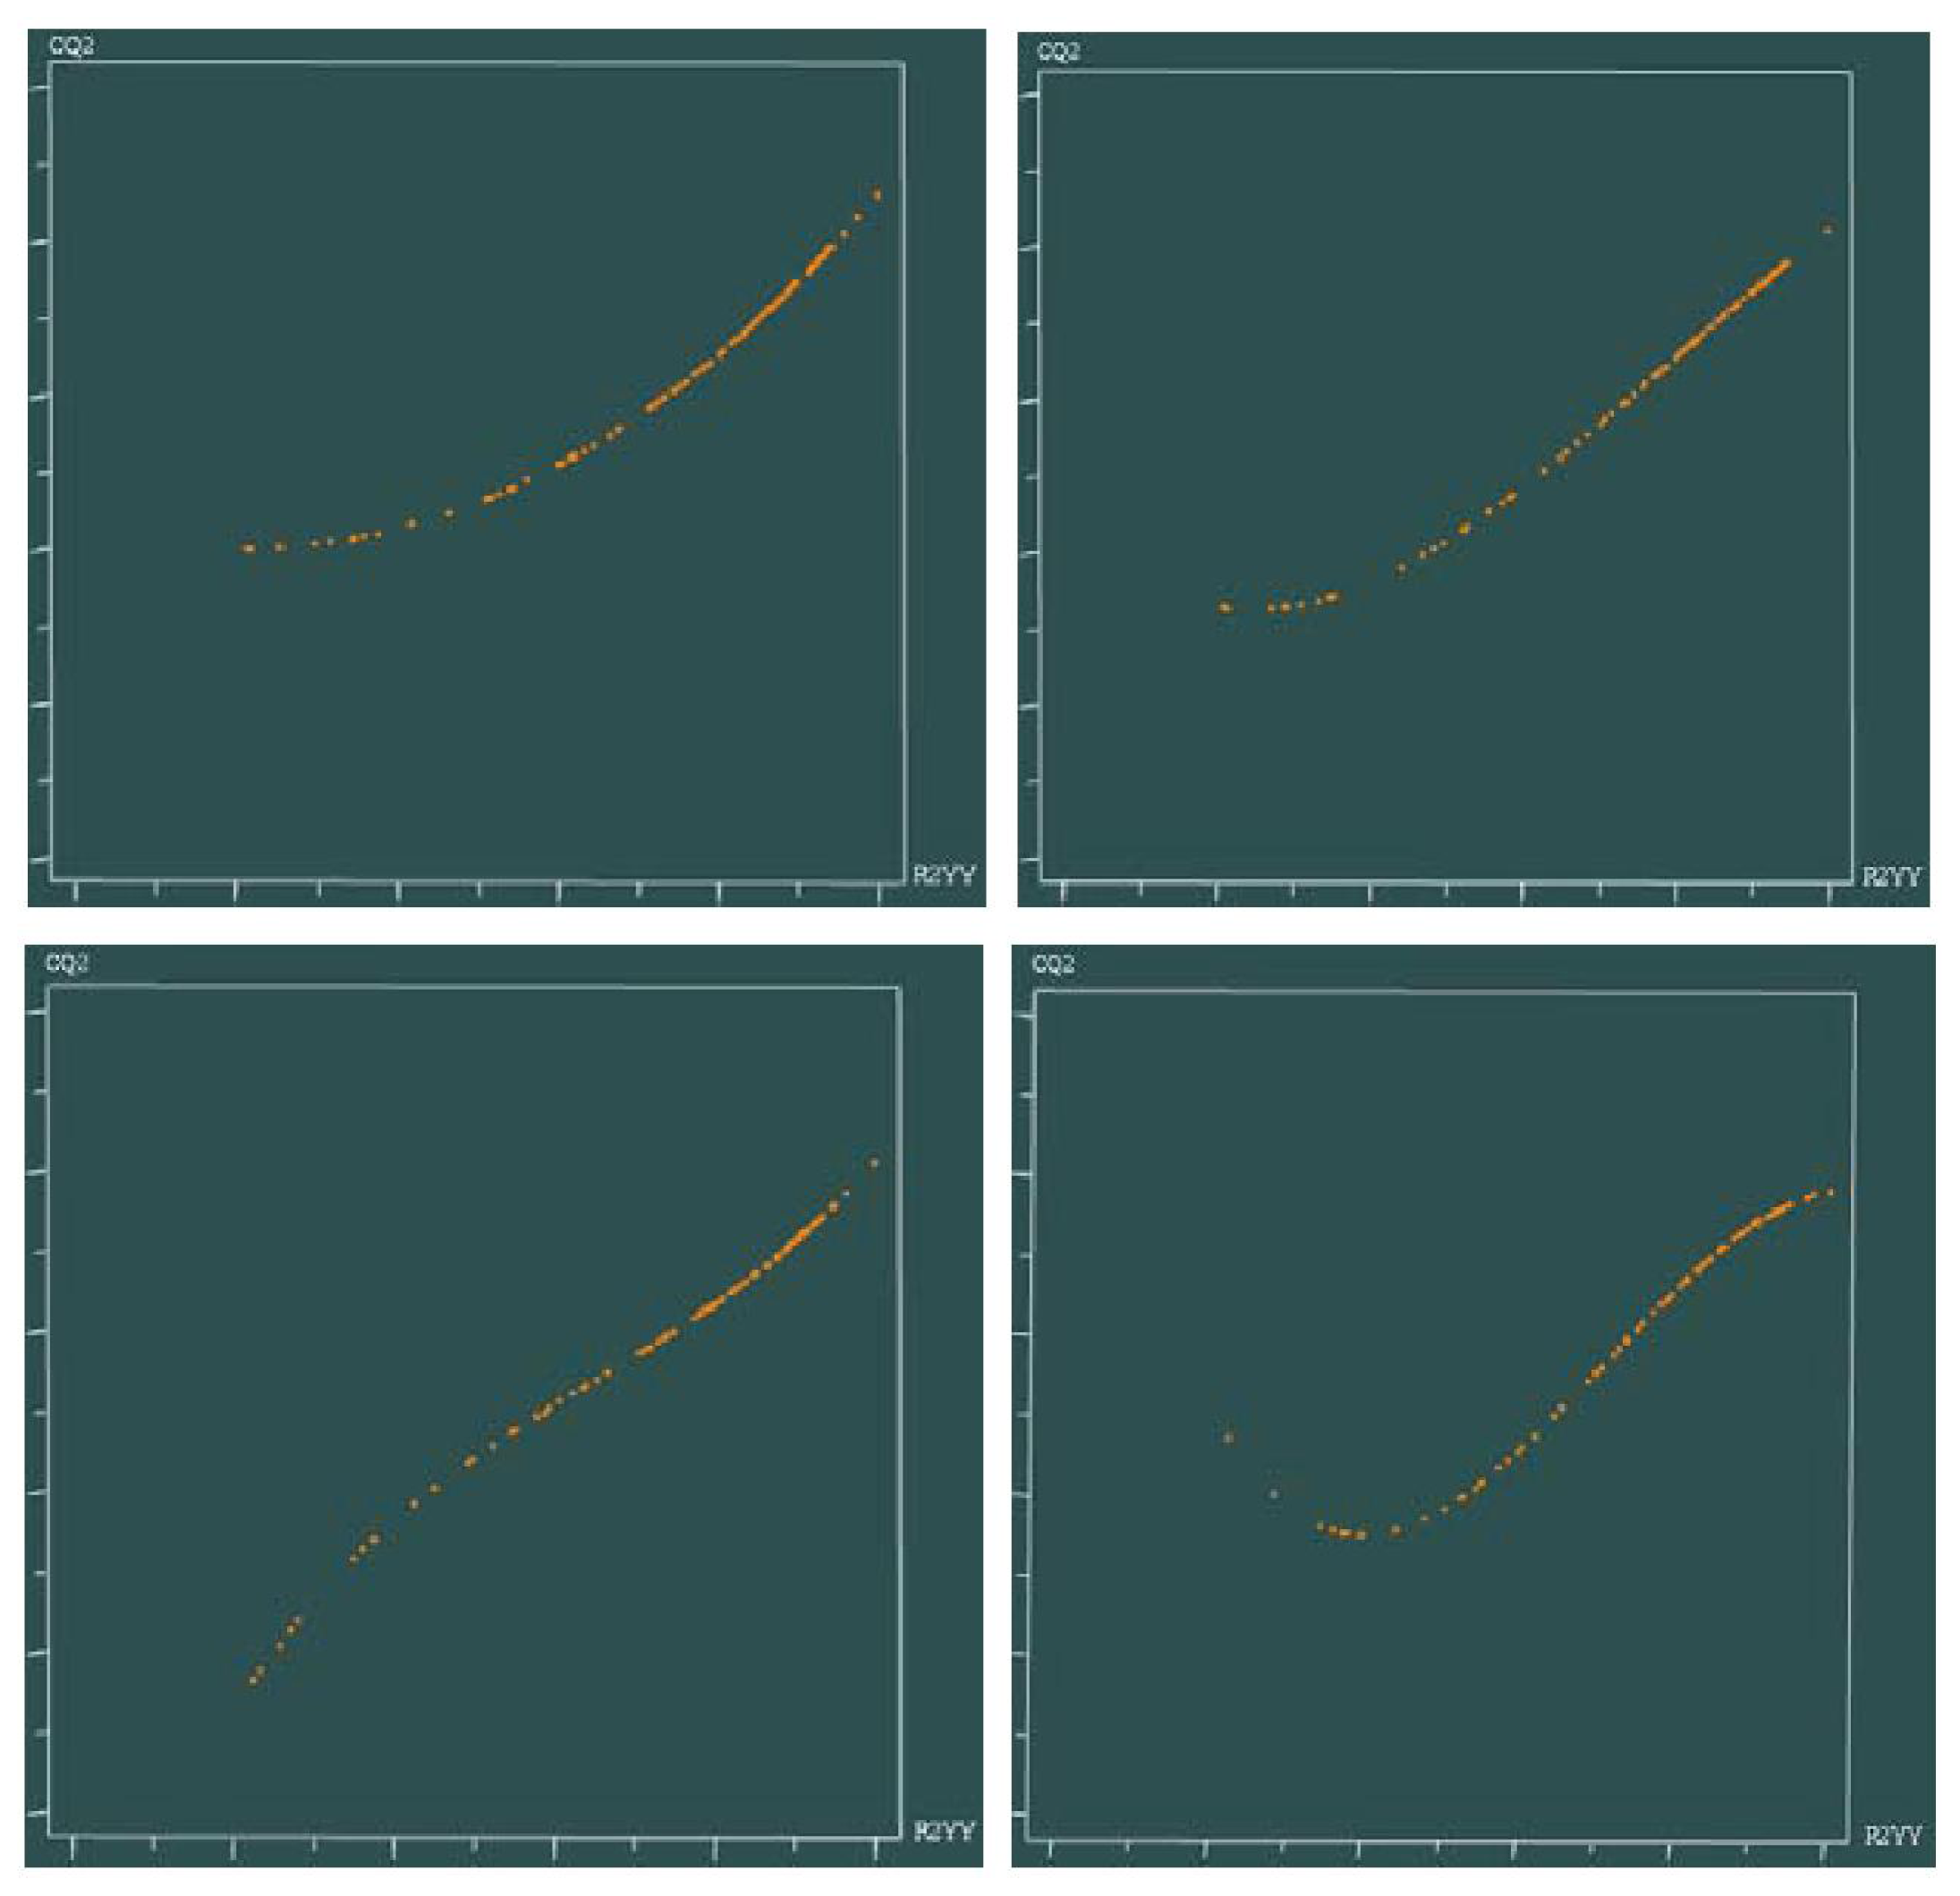
3.6. Sensitivity of a PLS Model

Most members of the data set, especially for large data sets, may have “twins” which make a near twin of each left-out molecule likely remain in the training data and usually obtain good predictions, so the q2 statistic obtained from cross-validation may give a false sense of confidence [34]. Progressive scrambling is used to test the model’s stability by determining the sensitivity of a QSAR model to small systematic perturbations of the response variable [35,36]. The values of Q2, cSDEP, and dq2/dr2 yy′ are used to interpret the predictivity of the model without the potentially confusing redundancy, in which the Q2 statistic is an estimate of the predictivity of the model after removing the effects of redundancy, and the cSDEP statistic is an estimated cross-validated standard error at a specific critical point for r2 yy′, and dq2/dr2 yy′ means slope of q2 evaluated at the specified critical point with respect to r2 yy′.
c S D E P [ r y y 2 ] = a 0 + a 1 ( r y y 2 ) + a 2 ( r y y 2 ) 2 + a 3 ( r y y 2 ) 3
q 2 ( r y y 2 ) = b 0 + b 1 ( r y y 2 ) + b 2 ( r y y 2 ) 2 + b 3 ( r y y 2 ) 3
d q 2 d r y y 2 = b 1 + 2 b 2 ( r y y 2 ) + 3 b 3 ( r y y 2 ) 2
Here, y indicates the perturbed (scrambled) responses and the statistic r2 yy′ expresses the degree of correlation between the perturbed responses and the original ones. The Q2 statistic obtained in this way is very conservative, in that it is necessarily reduced by the level of noise introduced to remove redundancy, so a value as low as 0.35 will signify that the original, unperturbed model is robust [33]. The dq2/dr2 yy′ means what extent the model changes with small changes to the dependent variable. In a stable model, changing proportionally with small changes in underlying data, has a slope near unity while unstable models change greatly with small changes in underlying response values and its effective slope is generally greater than 1.2. This method was employed to verify the optimal number of components and test the cross-validation against the possibility of such a redundancy in our training set [37].

3.7. Predictive Correlation Coefficient

q2 is a useful but not sufficient criterion for model validation, so an external test set (r2 pred) [38] was claimed for the estimation of predictive ability. Equation of predictive values r2 pred is as follows:
r p r e d 2 = 1 - ( P R E S S / S D )
Therein, SD means the sum of squared differences between the measured activities of the test set and the average measured activity of the training set.

4. Conclusions

Although many researchers have carried out quantitative structure activity relationship (QSAR) studies on thiazolidin-4-one as anti-HIV agents, the present work reports the first application of QSAR to study thiazolidin-4-ones as potent S1P1 receptor agonists [8]. We studied 61 2-imino-thiazolidin-4-one derivatives using CoMFA and CoMSIA, and some predictive 3D-QSAR models have been developed. Both CoMFA and CoMSIA models provided good statistical results in terms of q2 and r2 values, suggesting the significant correlations of molecular structures with its biological activities. Compared with CoMFA, CoMSIA provided a slightly better statistical model. The final CoMSIA model was generated from steric, electrostatic, hydrophobic and hydrogen-bond donor fields and validated by a variety of methods including crossvalidation, non-crossvalidation and test set predictions. The model developed has high internal validity (q2 above 0.6) and high predictive ability (test set r2 above 0.7). Compared with SAR summarized by Martin H. Bolli, the results of 3D-QSAR models presented in the contour coefficient maps further revealed how steric, electrostatic, hydrophobic and hydrogen-bond donor modifications should significantly affect the bioactivities of these compounds. Thus, the results of the quantitative structure activity relationships (QSAR) studies gave an insight to design new S1P1 receptor agonists which can effectively treat a variety of immune-mediated diseases.

Acknowledgments

Acknowlegements
This study was supported by the research grant from Guangdong Province 211 Project and the Fundamental Research Funds for the Central Universities (No. 21611319), and Guangzhou Science and Technology Support Project (2009Z1-E171).

References

  1. Gardell, SE; Dubi, AE; Chun, J. Emerging medicinal roles for lysophospholipid signaling. Trends Mol. Med 2006, 12, 65–75. [Google Scholar]
  2. Ishii, I; Fukushima, N; Ye, X; Chun, J. Lysophospholipid receptors: Signaling and biology. Annu. Rev. Biochem 2004, 73, 321–354. [Google Scholar]
  3. Chun, J; Goetzl, EJ; Hla, T; Igarashi, Y; Lynch, KR; Moolenaar, W; Pyne, S; Tigyi, G. International Union of Pharmacology. XXXIV. Lysophospholipid receptor nomenclature. Pharmacol. Rev 2002, 54, 265–269. [Google Scholar]
  4. Rosen, H; Gonzalez-Cabrera, PJ; Sanna, MG; Brown, S. Sphingosine-1-phosphate receptor Signaling. Annu. Rev. Biochem 2009, 78, 743–768. [Google Scholar]
  5. Spiegel, S; Milstien, S. Sphingosine-1-phosphate: An Enigmatic signalling lipid. Nature Rev. Mol. Cell Biol 2003, 4, 397–407. [Google Scholar]
  6. Kihara, A; Mitsutake, S; Mizutani, Y; Igarashi, Y. Metabolism and biological functions of two phosphorylated sphingolipids, sphingosine 1-phosphate and ceramide 1-phosphate. Prog. Lipid Res 2007, 46, 126–144. [Google Scholar]
  7. Hait, NC; Oskeritzian, CA; Paugh, SW; Milstien, S; Spiegel, S. Sphingosine kinases, sphingosine 1-phosphate, apoptosis and diseases. Biochim. Biophys. Acta 2006, 1758, 2016–2026. [Google Scholar]
  8. Boli, MH; Abele, S; Binkert, C; Bravo, R; Buchmann, S; Bur, D; Gatfield, J; Hess, P; Kohl, C; Mangold, C; et al. 2-Imino-thiazolidin-4-one Derivatives as Potent, Orally Active S1P1 Receptor Agonists. J. Med. Chem 2010, 53, 4198–4211. [Google Scholar]
  9. Matloubian, M; Lo, CG; Cinamon, G; Lesneski, MJ; Xu, Y; Brinkmann, V; Allende, ML; Prola, RL; Cyster, JG. Lymphocyte egress from thymus and peripheral lymphoid organs is dependent on S1P receptor 1. Nature 2004, 427, 355–360. [Google Scholar]
  10. Hale, JJ; Neway, W; Mills, SG; Hajdu, R; Keohane, CA; Rosenbach, M; Milligan, J; Shei, GJ; Chrebet, G; Bergstrom, J; et al. Potent S1P receptor agonists replicate the pharmacologic actions of the novel immune modulator FTY720. Bioorg. Med. Chem. Lett 2004, 14, 3351–3355. [Google Scholar]
  11. Allende, ML; Dreier, JL; Mandala, S; Proia, RL. Expression of the sphingosine 1-Phosphate Receptor, S1P1, on T-cells controls thymic emigration. J. Biol. Chem 2004, 279, 15396–15401. [Google Scholar]
  12. Forrest, M; Sun, SY; Hajdu, R; Bergstrom, J; Card, D; Doherty, G; Hale, J; Keohane, C; Meyers, C; Milligan, J; et al. Immune cell regulation and cardiovascular effects of sphingosine 1-phosphate receptor agonists in rodents are mediated via distinct receptor subtypes. J. Pharmacol. Exp. Ther 2004, 309, 758–768. [Google Scholar]
  13. Himmel, HM; Heringdorf, DMZ; Graf, E; Dobrev, D; Kortner, A; Schüler, S; Jakobs, KH; Ravens, U. Evidence for Edg-3 receptor-mediated activation of IK.ACh by sphingosine-1-phosphate in human atrial cardiomyocytes. Mol. Pharmacol 2000, 58, 449–454. [Google Scholar]
  14. Koyrakh, L; Roman, MI; Brinkmann, V; Wickman, K. The heart rate decrease caused by acute FTY720 administration is mediated by the G protein-gated potassium channel IKACh. Am. J. Transplant 2005, 5, 529–536. [Google Scholar]
  15. Sanna, MG; Liao, J; Jo, E; Alfonso, C; Ahn, MY; Peterson, MS; Webb, B; Lefebvre, S; Chun, J; Gray, N; Rosen, H. Sphingosine 1-phosphate (S1P) receptor subtypes S1P1 and S1P3, respectively, regulate lymphocyte recircuculation and heart rate. J. Biol. Chem 2004, 279, 13839–13848. [Google Scholar]
  16. Hansch, C; Smith, N; Engle, R; Wood, H. Quantitative structure-activity relationships of antineoplastic drugs: nitrosoureas and triazenoimidazoles. Cancer Chemother. Rep 1972, 56, 443–456. [Google Scholar]
  17. Yang, Z; Sun, P. 3D-QSAR study of potent inhibitors of phosphodiesterase-4 using a CoMFA Approach. Int. J. Mol. Sci 2007, 8, 714–722. [Google Scholar]
  18. Murugesan, V; Prabhakar, YS; Katti, SB. CoMFA and CoMSIA studies on thiazolidin-4-one as anti-HIV agents. J. Mol. Graph. Model 2009, 27, 735–743. [Google Scholar]
  19. Ravichandran, V; Mourya, VK; Agrawal, RK. Prediction of anti-HIV activity of 1,3-thiazolidin-4-ones: QSAR approach. Dig. J. Nanomater. Biostruct 2008, 3, 19–31. [Google Scholar]
  20. Cramer, RD, III; Patterson, DE; Bunce, JD. Comparative Molecular Field Analysis (CoMFA). 1. Effect of Shape on Binding of Steroids to Carrier Proteins. J. Am. Chem. Soc 1988, 110, 5959–5967. [Google Scholar]
  21. Klebe, G; Abraham, U; Mietzner, T. Molecular similarity indices in a comparative analysis (CoMSIA) of drug molecules to correlate and predict their biological activity. J. Med. Chem 1994, 37, 4130–4146. [Google Scholar]
  22. Cramer, RD, III; Patterson, DE; Bunce, JD. Recent advances in comparative molecular field analysis (CoMFA). Prog. Clin. Biol. Res 1989, 291, 161–165. [Google Scholar]
  23. Lindgren, F; Geladi, P; Rännar, S; Wold, S. Interactive variable selection (IVS) for PLS. Part 1: Theory and algorithms. J. Chemom 1994, 8, 349–363. [Google Scholar]
  24. Cho, SJ; Tropsha, A. Cross-validated R2-guided region selection for comparative molecular field analysis: a simple method to achieve consistent results. J. Med. Chem 1995, 38, 1060–1066. [Google Scholar]
  25. Clark, MC; Cramer, RD, III; Van Opdenbosch, N. Validation of general purpose Tripos 5.2 force fields. J. Comput. Chem 1989, 10, 982–1012. [Google Scholar]
  26. Cramer, RD, III; Clark, M; Simeroth, P; Patterson, DE. Recent developments in comparative molecular field analysis (CoMFA). Pharmacochem. Libr 1991, 16, 239–242. [Google Scholar]
  27. Bush, BL; Nachbar, RBJ. Sample-distance partial least squares: PLS optimized for many variables, with application to CoMFA. J. Comput. Aided Mol. Des 1993, 7, 587–619. [Google Scholar]
  28. Clark, M; Cramer, RD, III; Jones, DM; Patterson, DE; Simeroth, PE. Comparative molecular field analysis (CoMFA). 2. Toward its use with 3D-structural databases. Tetrahed. Comput. Methodol 1990, 3, 47–59. [Google Scholar]
  29. Klebe, G; Abraham, U. Comparative molecular similarity index analysis (CoMSIA) to study hydrogen bonding properties and to score combinatorial libraries. J. Comput. Aided Mol. Des 1999, 13, 1–10. [Google Scholar]
  30. Clark, M; Cramer, RD, III. The probability of chance correlation using partial least squares (PLS). Quant. Struct. Act. Relat 1993, 12, 137–145. [Google Scholar]
  31. Srivastava, V; Gupta, SP; Siddiqi, MI; Mishra, BN. 3D-QSAR studies on quinazoline antifolate thymidylate synthase inhibitors by CoMFA and CoMSIA models. Eur. J. Med. Chem 2010, 45, 1560–1571. [Google Scholar]
  32. Woodard, B; Saleh, MA. Three-dimensional quantitative structure activity relationships of quorum-sensing and biofilm inhibitors in gram-negative bacteria. J. Environ. Sci. Health 2008, 43, 281–287. [Google Scholar]
  33. Zheng, J; Wu, Z; Dai, M; Xu, Z; Li, X; Zhu, S; Lin, C; Hu, P; Zhang, L; Huang, H; et al. Quantitative structure activity relationship studies on a novel indolediones as long chain fatty acid elongase (ELOVL6) inhibitors. Lett. Drug Des. Discov 2011, 8, 422–429. [Google Scholar]
  34. Clark, RD; Sprous, DG; Leonard, JM. Validating Models Based on Large Data Sets. In Rational Approaches to Drug Design; Höltje, HD, Sippl, W, Eds.; Prous Science: Barcelona, Spain, 2001; pp. 475–485. [Google Scholar]
  35. Clark, RD; Fox, PC. Statistical variation in scrambling. J. Comput. Aided Mol. Des 2004, 18, 563–576. [Google Scholar]
  36. Luco, JM; Ferretti, FH. QSAR based on multiple linear regression and PLS methods for the anti-HIV activity of a large group of HEPT derivatives. J. Chem. Inf. Comput. Sci 1997, 37, 392–401. [Google Scholar]
  37. Hevener, KE; Ball, DM; Buolamwini, JK; Lee, RE. Quantitative structure-activity relationship studie on nitrofuranyl anti-tubercular agents. Bioorg. Med. Chem 2008, 16, 8042–8053. [Google Scholar]
  38. Golbraikh, A; Tropsha, A. Beware of q2. J. Mol. Graph. Model 2002, 20, 269–276. [Google Scholar]
Figure 1. Molecular alignment of 2-imino-thiazolidin-4-one derivatives.
Ijms 12 06502f1
Figure 2. Graph of experimental versus predicted pEC50 of the training set and the test set using the CoMFA model.
Ijms 12 06502f2
Figure 3. Variation fitted curves for progressive scrambling analyses with random number seed: (left upper) 3 components; (right upper) 4 components; (left lower) 5 components; (right lower) 6 components.
Ijms 12 06502f3
Figure 4. Graph of experimental versus predicted pEC50 of the training set and the test set using the best CoMSIA model 6.
Ijms 12 06502f4
Figure 5. CoMFA field contour maps for active compound 60. Steric fields (Left): Green fields indicate steric bulk favored, yellow fields indicate steric bulk disfavored. Electrostatic fields (Right): Blue fields indicate electropositive groups favored, red fields indicate electronegative groups favored.
Ijms 12 06502f5
Figure 6. CoMSIA fields. The CoMSIA fields from model 6 are shown with active compound 60. (A) Steric fields, green indicates steric bulk favored, yellow indicates bulk disfavored; (B) Electrostatic fields, blue indicates electropositive groups favored, red fields indicate electronegative groups favored; (C) Hydrophobic fields, yellow indicates favored, gray disfavored; (D) H-bond donor field, cyan indicates donor favored, purple disfavored.
Ijms 12 06502f6
Table 1. Statistical results of CoMFA and the best CoMSIA models.
CoMFACoMSIA (Model 6)
PLS statistics
LOO cross q2/SEP0.751/0.3200.739/0.328
Group cross q2/SEP0.744/0.3250.740/0.332
Non-validated r2/SEE0.973/0.1060.923/0.178
F250.67484.398
r2bootstrap0.985 ± 0.0060.973 ± 0.007
Sbootstrap0.074 ± 0.0410.115 ± 0.064
Optimal components55
Field distribution%
Steric54.512.5
Electrostatic45.529.0
Hydrophobic30.3
H-bond donate28.2
r2 pred0.9040.730
Table 2. Progressive scrambling results of the CoMFA model.
ComponentsQ2cSDEPdq2/dr2 yy′
30.4030.5311.391
40.3500.5851.230
50.5400.5421.021
60.3930.5171.427
70.4330.5831.391
Table 3. Results of CoMSIA models using combinations of the four field descriptors.
ModelDescriptorsLOO cross q2/SEPGroup cross q2/SEPBootstrap r2Bootstrapped SEENon-validated r2/SEE
1S and E0.630/0.3960.608/0.4080.953 ± 0.0110.129 ± 0.0700.945/0.153
2S, E and H0.735/0.3100.723/0.3240.873 ± 0.0360.213 ± 0.1270.871/0.221
3S, E and A0.637/0.3860.654/0.3770.942 ± 0.0170.152 ± 0.0840.921/0.181
4S, E and D0.695/0.3590.692/0.3610.952 ± 0.0200.143 ± 0.0900.929/0.173
5S, E, D and A0.657/0.3810.658/0.3810.930 ± 0.0210.175 ± 0.0880.918/0.187
6S, E, D and H0.739/0.3280.740/0.3320.973 ± 0.0070.115 ± 0.0640.923/0.178
7S, E, A and H0.726/0.3340.731/0.3340.960 ± 0.0110.139 ± 0.0700.920/0.185
8S, E, D, A and H0.719/0.3400.709/0.3510.953 ± 0.0180.142 ± 0.0770.910/0.192
Table 4. 2-imino-thiazolidin-4-one derivatives and their experimental and predicted agonistic activity.
NoO

R1R2R3R4R5Exp.CoMFACoMSIA

Pred.Res.Pred.Res.
1dimethyl-minophenylHClOH7.2087.1880.0207.1290.079
2 *methylphenylHClOH6.0056.260−0.2556.280−0.275
3ethylphenylHClOH6.7306.884−0.1546.921−0.191
4n-propylphenylHClOH7.1747.1490.0257.1070.067
5n-butylphenylHClOH6.9517.097−0.1467.143−0.192
6 *isopropylphenylHClOH7.3287.0780.2507.2670.061
7sec-butylphenylHClOH6.9926.9000.0926.9510.041
8tert-butylphenylHClOH6.8336.887−0.0546.939−0.106
9cyclopropylphenylHClOH6.9876.9210.0666.998−0.011
10cyclobutylphenylHClOH6.6956.5580.1376.6010.094
11cyclopentylphenylHClOH6.4606.548−0.0886.564−0.104
12 *cyclohexylphenylHClOH6.2346.265−0.0316.260−0.026
13 *isopropylisopropylHClOH7.2376.8650.3726.8900.347
14isopropyln-hexylHClOH6.5506.555−0.0056.4950.010
15 *isopropylcyclohexylHClOH8.0007.6240.3767.6100.390
16 *isopropylethoxycarbonylethylHClOH6.3206.405−0.0856.346−0.026
17 *isopropylallylHClOH7.2597.1850.0747.1770.082
18isopropyl2-methylphenylHClOH7.4687.2320.2367.0890.379
19isopropyl3-methylphenylHClOH6.9596.9470.0126.997−0.038
20isopropyl4-methylphenylHClOH7.1087.0210.0877.0250.083
21isopropyl2,6-dimethylphenylHClOH6.8136.929−0.1166.987−0.174
22isopropyl2,3-dimethylphenylHClOH7.1437.321−0.1787.163−0.020
23 *isopropyl2,4-dimethylphenylHClOH6.7477.394−0.6477.202−0.455
24isopropyl2-ethylphenylHClOH6.9077.045−0.1387.226−0.319
25isopropyl2-chlorophenylHClOH7.2687.1780.0907.2180.050
26isopropyl3-chlorophenylHClOH7.4567.3770.0797.3760.080
27isopropyl3-chloro-2-methylphenylHClOH7.5097.3990.1107.4720.037
28isopropyl3-chloro-4-methylphenylHClOH7.3287.448−0.1207.481−0.153
29isopropyl2-methoxylphenylHClOH6.9756.9330.0427.019−0.044
30*isopropyl3-methoxylphenylHClOH6.5877.015−0.4286.839−0.252
31isopropyl4-methoxylphenylHClOH6.6006.5740.0266.707−0.107
32 *isopropyl2,4-dimethoxyphenylHClOH6.0586.182−0.1246.321−0.263
33 *isopropyl3-pyridylHClOH6.4496.613−0.1646.623−0.174
34isopropylbenzylHClOH6.2016.268−0.0676.1950.006
35isopropylphenethylHClOH6.0346.077−0.0436.0130.021
36 *isopropyl4-phenylbutylHClOH5.7415.952−0.2116.053−0.312
37isopropylphenylHHH5.9085.7260.1825.7530.155
38 *isopropylphenylHHOH6.9146.6530.2616.7940.120
39isopropylphenylHFOH6.6486.719−0.0716.726−0.078
40 *isopropylphenylHCH3OH7.4327.674−0.2426.928−0.496
41isopropylphenylHOCH3OH6.6996.6540.0456.5970.102
42isopropylphenylHHOCH36.6976.6960.0016.731−0.034
43isopropylphenylHOCH3OCH36.6506.739−0.0896.695−0.045
44isopropylphenylHHNH(CH3)26.8306.914−0.0846.6690.161
45isopropylphenylHHBr5.9846.112−0.1285.8290.155
46 *isopropylphenylHOCH3H6.7336.5210.2126.2990.434
47 *isopropylphenylHOHH6.1246.0080.1166.0870.037
48isopropylphenylHOHOCH36.3536.2830.0706.471−0.118
49isopropylphenylCH3HH5.1905.196−0.0065.609−0.419
50isopropylphenylHHCH2OH6.3896.433−0.0446.2330.156
51 *isopropylphenylHH(CH2)2OH6.9916.5720.4196.4310.560
52 *isopropylphenylHH(CH2)3OH7.0096.8480.1626.9750.034
53isopropylphenylHHO(CH2)2OH7.0227.031−0.0096.9050.117
54 *isopropylphenylHHO(CH2)3 OH7.2376.9790.2586.8590.378
55 *isopropylphenylHHOCH (CH2OH)25.0645.607−0.5435.438−0.374
56isopropylphenylHO(CH2)2OHH5.8505.7620.0885.8150.035
57isopropylphenylHHO(CH2)3N (CH3)26.4656.512−0.0476.535−0.070
58n-propyl2-methylphenylHClOH7.7217.5380.1837.2790.442
59n-propyl2-methylphenylHClO(CH2)2 OH7.9597.9330.0268.154−0.195
60isopropyl2-methylphenylHCl(R)-OCH2 CH(CH3) CH2OH8.0418.0260.0158.0310.010
61isopropyl2-methylphenylHCl(S)-OCH2 CH(CH3) CH2OH8.0138.061−0.0487.9070.106
*Test set.

