Identification of Tillering Node Proteins Differentially Accumulated in Barley Recombinant Inbred Lines with Different Juvenile Growth Habits

Abstract
:1. Introduction
2. Results and Discussion
3. Experimental Section
4. Conclusions
Supplementary Materials
ijms-13-10410-s001.pdfReferences
- Zhang, J.; Zhang, W.X. Tracing sources of dwarfing genes in barley breeding in China. Euphytica 2003, 131, 285–192. [Google Scholar]
- Cloupek, O.; Forster, B.P.; Thomas, W.T.B. The effect of semi-dwarf genes on root system size in field-grown barley. Theor. Appl. Genet 2006, 112, 779–786. [Google Scholar]
- Saisho, D.; Tanno, K.; Chono, M.; Honda, I.; Kitano, H.; Takeda, K. Spontaneous brassinolide-insensitive barley mutants “uzu”adapted to east Asia. Breed. Sci 2004, 54, 409–416. [Google Scholar]
- Hellewell, K.B.; Rasmusson, D.C.; Meagher, M.G. Enhancing yield of semidwarf barley. Crop Sci 2000, 40, 352–358. [Google Scholar]
- Sears, R.G.; Kronsztad, W.E.; Metzger, R.J. Inheritance of dwarf and semidwarf plant height in barley. Crop Sci 1981, 21, 828–833. [Google Scholar]
- Barua, U.M.; Chalmers, K.J.; Thomas, W.T.B.; Hackett, C.A.; Lea, V.; Jack, P.; Forster, B.P.; Waugh, R.; Powell, W. Molecular mapping of genes determining height; time to heading; and growth habit in barley (Hordeum vulgare). Genome 1993, 36, 1080–1087. [Google Scholar]
- Jia, Q.; Zhang, J.; Westcott, S.; Zhang, X.Q.; Bellgard, M.; Lance, R.; Li, C. GA-20 oxidase as a candidate for the semidwarf gene sdw1/denso in barley. Funct. Integr. Genomics 2009, 9, 255–262. [Google Scholar]
- Ren, X.; Sun, D.; Guan, W.; Sun, G.; Li, C. Inheritance and identification of molecular markers associated with a novel dwarfing gene in barley. Genetics 2010, 11, 89. [Google Scholar]
- Wang, J.; Yang, J.; McNeil, D.L.; Zhou, M. Identification and molecular mapping of a dwarfing gene in barley (Hordeum vulgare L.) and its correlation with other agronomic traits. Euphytica 2010, 175, 331–342. [Google Scholar]
- Thomas, W.T.B.; Powell, W.; Swanston, J.S. The effects of major genes on quantitatively varying characters in barley. 4. The GPert and denso loci and quality characters. Heredity 1991, 66, 381–389. [Google Scholar]
- Thomas, W.T.B.; Newton, A.C.; Wilson, A.; Meyer, R.C.; Young, G.R.; Lawrence, P.E. QTLs for Disease Resistance Mapped in Derkado x B83-12/21/5. Barley genetics VIII, Proceedings of the 8th International Barley Genetics Symposium, Adelaide, Australia, 22–27 October 2010; pp. 186–188.
- Saville, R.J.; Gosman, N.; Burt, C.J.; Makepeace, J.; Steed, A.; Corbitt, M.; Chandler, E.; Brown, J.K.; Boulton, M.I.; Nicholson, P. The “Green Revolution” dwarfing genes play a role in disease resistance in Triticum aestivum and Hordeum vulgare. J. Exp. Bot 2011, 63, 1271–1283. [Google Scholar]
- Yin, X.; Stam, P.; Dourleijn, C.J.; Kropff, M.J. AFLP mapping of quantitative trait loci for yield-determining physiological characters inspring barley. Theor. Appl. Genetics 1999, 99, 244–253. [Google Scholar]
- Kuczynska, A.; Wyka, T. The effect of the denso dwarfing gene on morpho-anatomical characters in barley recombinant inbred lines. Breed. Sci 2011, 61, 275–280. [Google Scholar]
- Lande, R. The genetic correlation between characters maintained by selection, linkage and inbreeding. Genetic Res 1984, 44, 309–320. [Google Scholar]
- Rabilloud, T. Two-dimensional gel electrophoresis in proteomics: Old; old fashioned; but it still climbs up the mountains. Proteomics 2002, 2, 3–10. [Google Scholar]
- Consoli, L.; Lefèvre, A.; Zivy, M.; de Viennie, D.; Damerval, C. QTL analysis of proteome and transcriptome variations for dissecting the genetic architecture of complex traits in maize. Plant Mol. Biol 2002, 48, 575–581. [Google Scholar]
- Witzel, K.; Pietsch, C.; Strickert, M.; Matros, A.; Röder, M.S.; Weschke, W.; Wobus, U.; Mock, H.P. Mapping of quantitative trait loci associated with protein expression variation in barley grains. Mol. Breed 2011, 27, 301–314. [Google Scholar]
- Lahesranta, S.J.; Davies, H.V.; Shepherd, L.V.T.; Numan, N.; McNicol, J.W.; Auriola, S.; Koistinen, K.M.; Suomalainen, S.; Kokko, H.I.; Karenlampi, S.O. Comparison of tuber proteomes of potato varieties; landraces; and genetically modified lines. Plant Physiol 2005, 138, 1690–1699. [Google Scholar]
- Ruebelt, M.C.; Lipp, M.; Reynolds, T.M.; Astwood, J.D.; Engel, K.H.; Jany, K.D. Application of two-dimensional gel electrophoresis to interrogate alterations in the proteome of genetically altered crops. 2. Assessing natural variability. J. Agric. Food Chem 2006, 54, 2162–2168. [Google Scholar]
- Görg, A.; Postel, W.; Weiss, W. Detection of polypeptides and amylase isoenzyme modifications related to malting quality during malting process of barley by 2-dimensional electrophoresis and isoelectric-focussing with immobilized pH gradients. Electrophoresis 1992, 13, 759–770. [Google Scholar]
- Devaux, P.; Zivy, M. Protein markers for anther culturability in barley. Theor. Appl. Genetics 1994, 88, 701–706. [Google Scholar]
- Kristoffersen, H.E.; Flengsrud, R. Separation and characterization of basic barley seed proteins. Electrophoresis 2000, 21, 3693–3700. [Google Scholar]
- Finnie, C.; Svensson, B. Feasibility study of a tissue-specific approach to barley proteome analysis: Aleurone layer; endosperm; embryo and single seeds. J. Cereal Sci 2003, 38, 217–227. [Google Scholar]
- Finnie, C.; Bagge, M.; Steenholdt, T.; Østergaard, O.; Bak-Jensen, K.S.; Backes, G.; Jensen, A.; Giese, H.; Larsen, J.; Roepstorff, P.; et al. Integration of the barley genetic and seed proteome maps for chromosome 1H; 2H; 3H; 5H and 7 H. Funct. Integr. Genomics 2009, 9, 135–143. [Google Scholar]
- Østergaard, O.; Finnie, C.; Laugesen, S.; Roepstorff, P.; Svensson, B. Proteome analysis of barley seeds: Identification of major proteins from two-dimensional gels (pI 4–7). Proteomics 2004, 4, 2437–2447. [Google Scholar]
- Süle, A.; Vanrobaeys, F.; Hajós, Gy.; van Beeumen, J.; Devreese, B. Proteomic analysis of small heat shock protein isoforms in barley shoots. Phytochemistry 2004, 65, 1853–1863. [Google Scholar]
- Leone, A.; Piro, G.; Leucci, M.R.; Zacheo, G.; Dalessandro, G. Embrane-cell wall-associated heat shock proteins in two genotypes of barley seedlings. Plant Biosyst 2000, 134, 171–178. [Google Scholar]
- Sabehat, A.; Lurie, S.; Weiss, D. Expression of small heat-shock proteins at low temperatures. Plant Physiol 1998, 117, 651–658. [Google Scholar]
- Ecochard, R.; Cavalie, G.; Nicco, C.; Piquemal, M.; Sarrafi, A. Rubisco content and specific activity in barley (Hordeum vulgare L.). J. Exp. Bot 1991, 42, 39–43. [Google Scholar]
- Stitt, M.; Schulze, D. Does Rubisco control the rate of photosynthesis and plant growth? An exercise in molecular ecophysiology. Plant Cell Environ 2006, 17, 465–487. [Google Scholar]
- Speulman, E.; Salamini, F. GA3-regulated cDNAs from Hordeum vulgare leaves. Plant Mol. Biol 1995, 28, 915–926. [Google Scholar]
- Gubler, F.; Chandler, P.M.; White, R.G.; Llewellyn, D.J.; Jacobsen, J.V. Gibberellin signaling in barley aleurone cells. Control of SLN1 and GAMYB expression. Plant Physiol 2002, 129, 191–200. [Google Scholar]
- Franckowiak, J.D.; Pecio, A. Coordinator’s report: A listing of genetic stocks. Barley Genet. Newsl 1992, 21, 116–126. [Google Scholar]
- Sasaki, A.; Ashikari, M.; Ueguchi-Tanaka, M.; Itoh, H.; Nishimura, A.; Swapan, D.; Ishiyama, K.; Saito, T.; Kobayashi, M.; Khush, G.S. Green revolution: A mutant gibberellin-synthesis gene in rice. Nature 2002, 416, 701–702. [Google Scholar]
- Spielmeyer, W.; Ellis, M.H.; Chandler, P.M. Semidwarf (sd-1); green revolution rice; contains a defective gibberellin 20-oxidase gene. Proc. Natl. Acad. Sci. USA 2002, 99, 9043–9048. [Google Scholar]
- Sakamoto, T.; Miura, K.; Itoh, H.; Tatsumi, T.; Ueguchi-Tanaka, M.; Ishiyama, K.; Kobayashi, M.; Agrawal, G.K.; Takeda, S.; Abe, K.; et al. An overview of gibberellin metabolism enzyme genes and their related mutants in rice. Plant Physiol 2004, 134, 1–12. [Google Scholar]
- Spielmeyer, W.; Ellis, M.; Robertson, M.; Ali, S.; Lenton, J.R.; Chandler, P.M. Isolation of gibberelic metabolic pathway genes from barley and comparative mapping in barley; wheat and rice. Theor. Appl. Genetics 2004, 109, 847–855. [Google Scholar]
- Jia, Q.; Zhang, X.Q.; Westcott, S.; Broughton, S.; Cakir, M.; Yang, J.; Lance, R.; Li, C. Expression level of a gibberellin 20-oxidase gene is associated with multiple agronomic and quality traits in barley. Theor. Appl. Genet 2011, 122, 1451–1460. [Google Scholar]
- Manosalva, P.M.; Davidson, R.M.; Liu, B.; Zhu, X.; Hulbert, S.H.; Leung, H.; Leach, J.E. A germin-like protein gene family functions as a complex quantitative trait locus conferring broad-spectrum disease resistance in rice. Plant Physiol 2009, 149, 286–296. [Google Scholar]
- Canovas, F.M.; Dumas-Gaudot, E.; Recorbet, G.; Jorrin, J.; Mock, H.P.; Rossignol, M. Plant proteome analysis. Proteomics 2004, 4, 285–298. [Google Scholar]
- Kasha, K.J.; Kao, K.N. High frequency haploid production in barley (Horedeum vulgare L.). Nature 1970, 225, 874–876. [Google Scholar]
- Large, E.C. Growth stages in cereals illustration of the Feekes scale. Plant Pathol 1954, 3, 128–129. [Google Scholar]
- Kosmala, A.; Bocian, A.; Rapacz, M.; Jurczyk, B.; Zwierzykowski, Z. Identification of leaf proteins differentially accumulated during cold acclimation between Festuca pratensis plants with distinct levels of frost tolerance. J. Exp. Bot 2009, 60, 3595–3609. [Google Scholar]
- Bocian, A.; Kosmala, A.; Rapacz, M.; Jurczyk, B.; Marczak, Ł.; Zwierzykowski, Z. Differences in leaf proteome response to cold acclimation between Lolium perenne plants with distinct levels of frost tolerance. J. Plant Physiol. 2011, 168, 1271–1279. [Google Scholar]
- Hurkman, W.J.; Tanaka, C.K. Solubilization of plant membrane proteins for analysis by two-dimensional gel electrophoresis. Plant Physiol 1986, 81, 802–806. [Google Scholar]
- Neuhoff, V.; Arold, N.; Taube, D.; Ehrhardt, W. Improved staining of proteins in polyacrylamide gels including isoelectric focusing gels with clear background at nanogram sensitivity using Coomassie Brilliant Blue G-250 and R-250. Electrophoresis 1988, 9, 255–262. [Google Scholar]


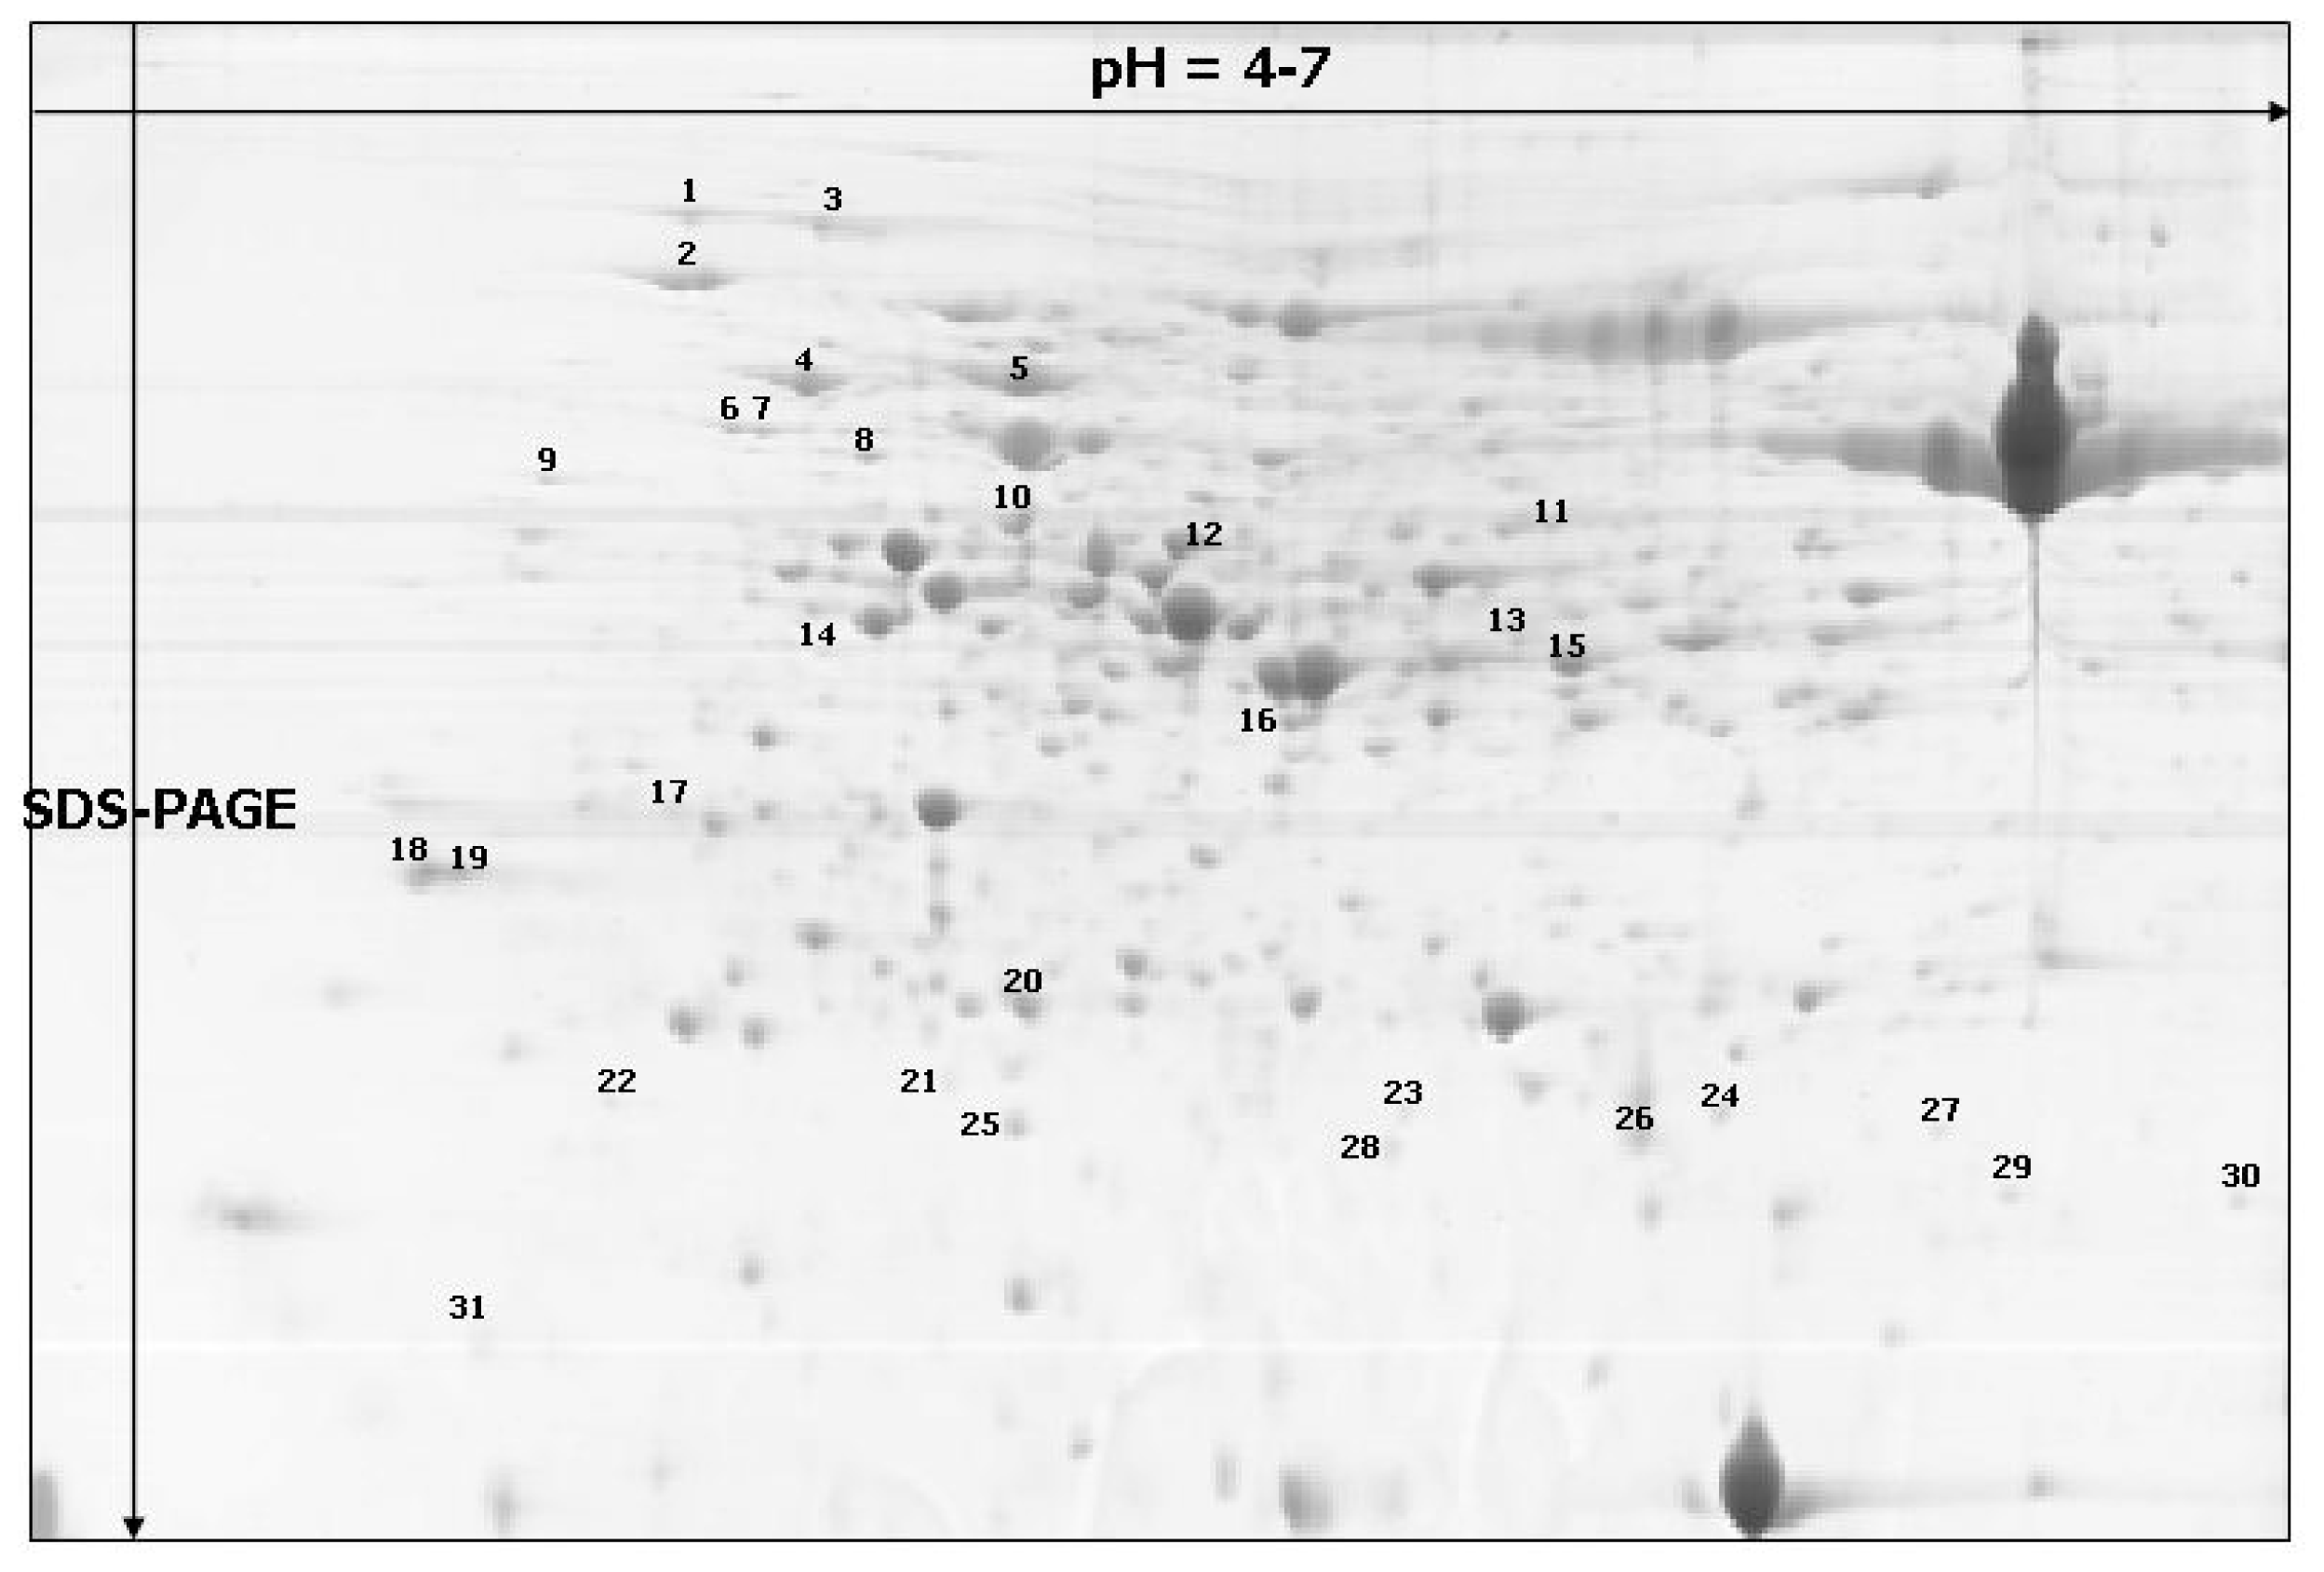
| Spot no. a | % Vol | Accession f | Identified protein g | Score h | Coverage (%) i | Classification | |||
|---|---|---|---|---|---|---|---|---|---|
| 1.3 p b | 3 p c | 1.3 e d | 3 e e | ||||||
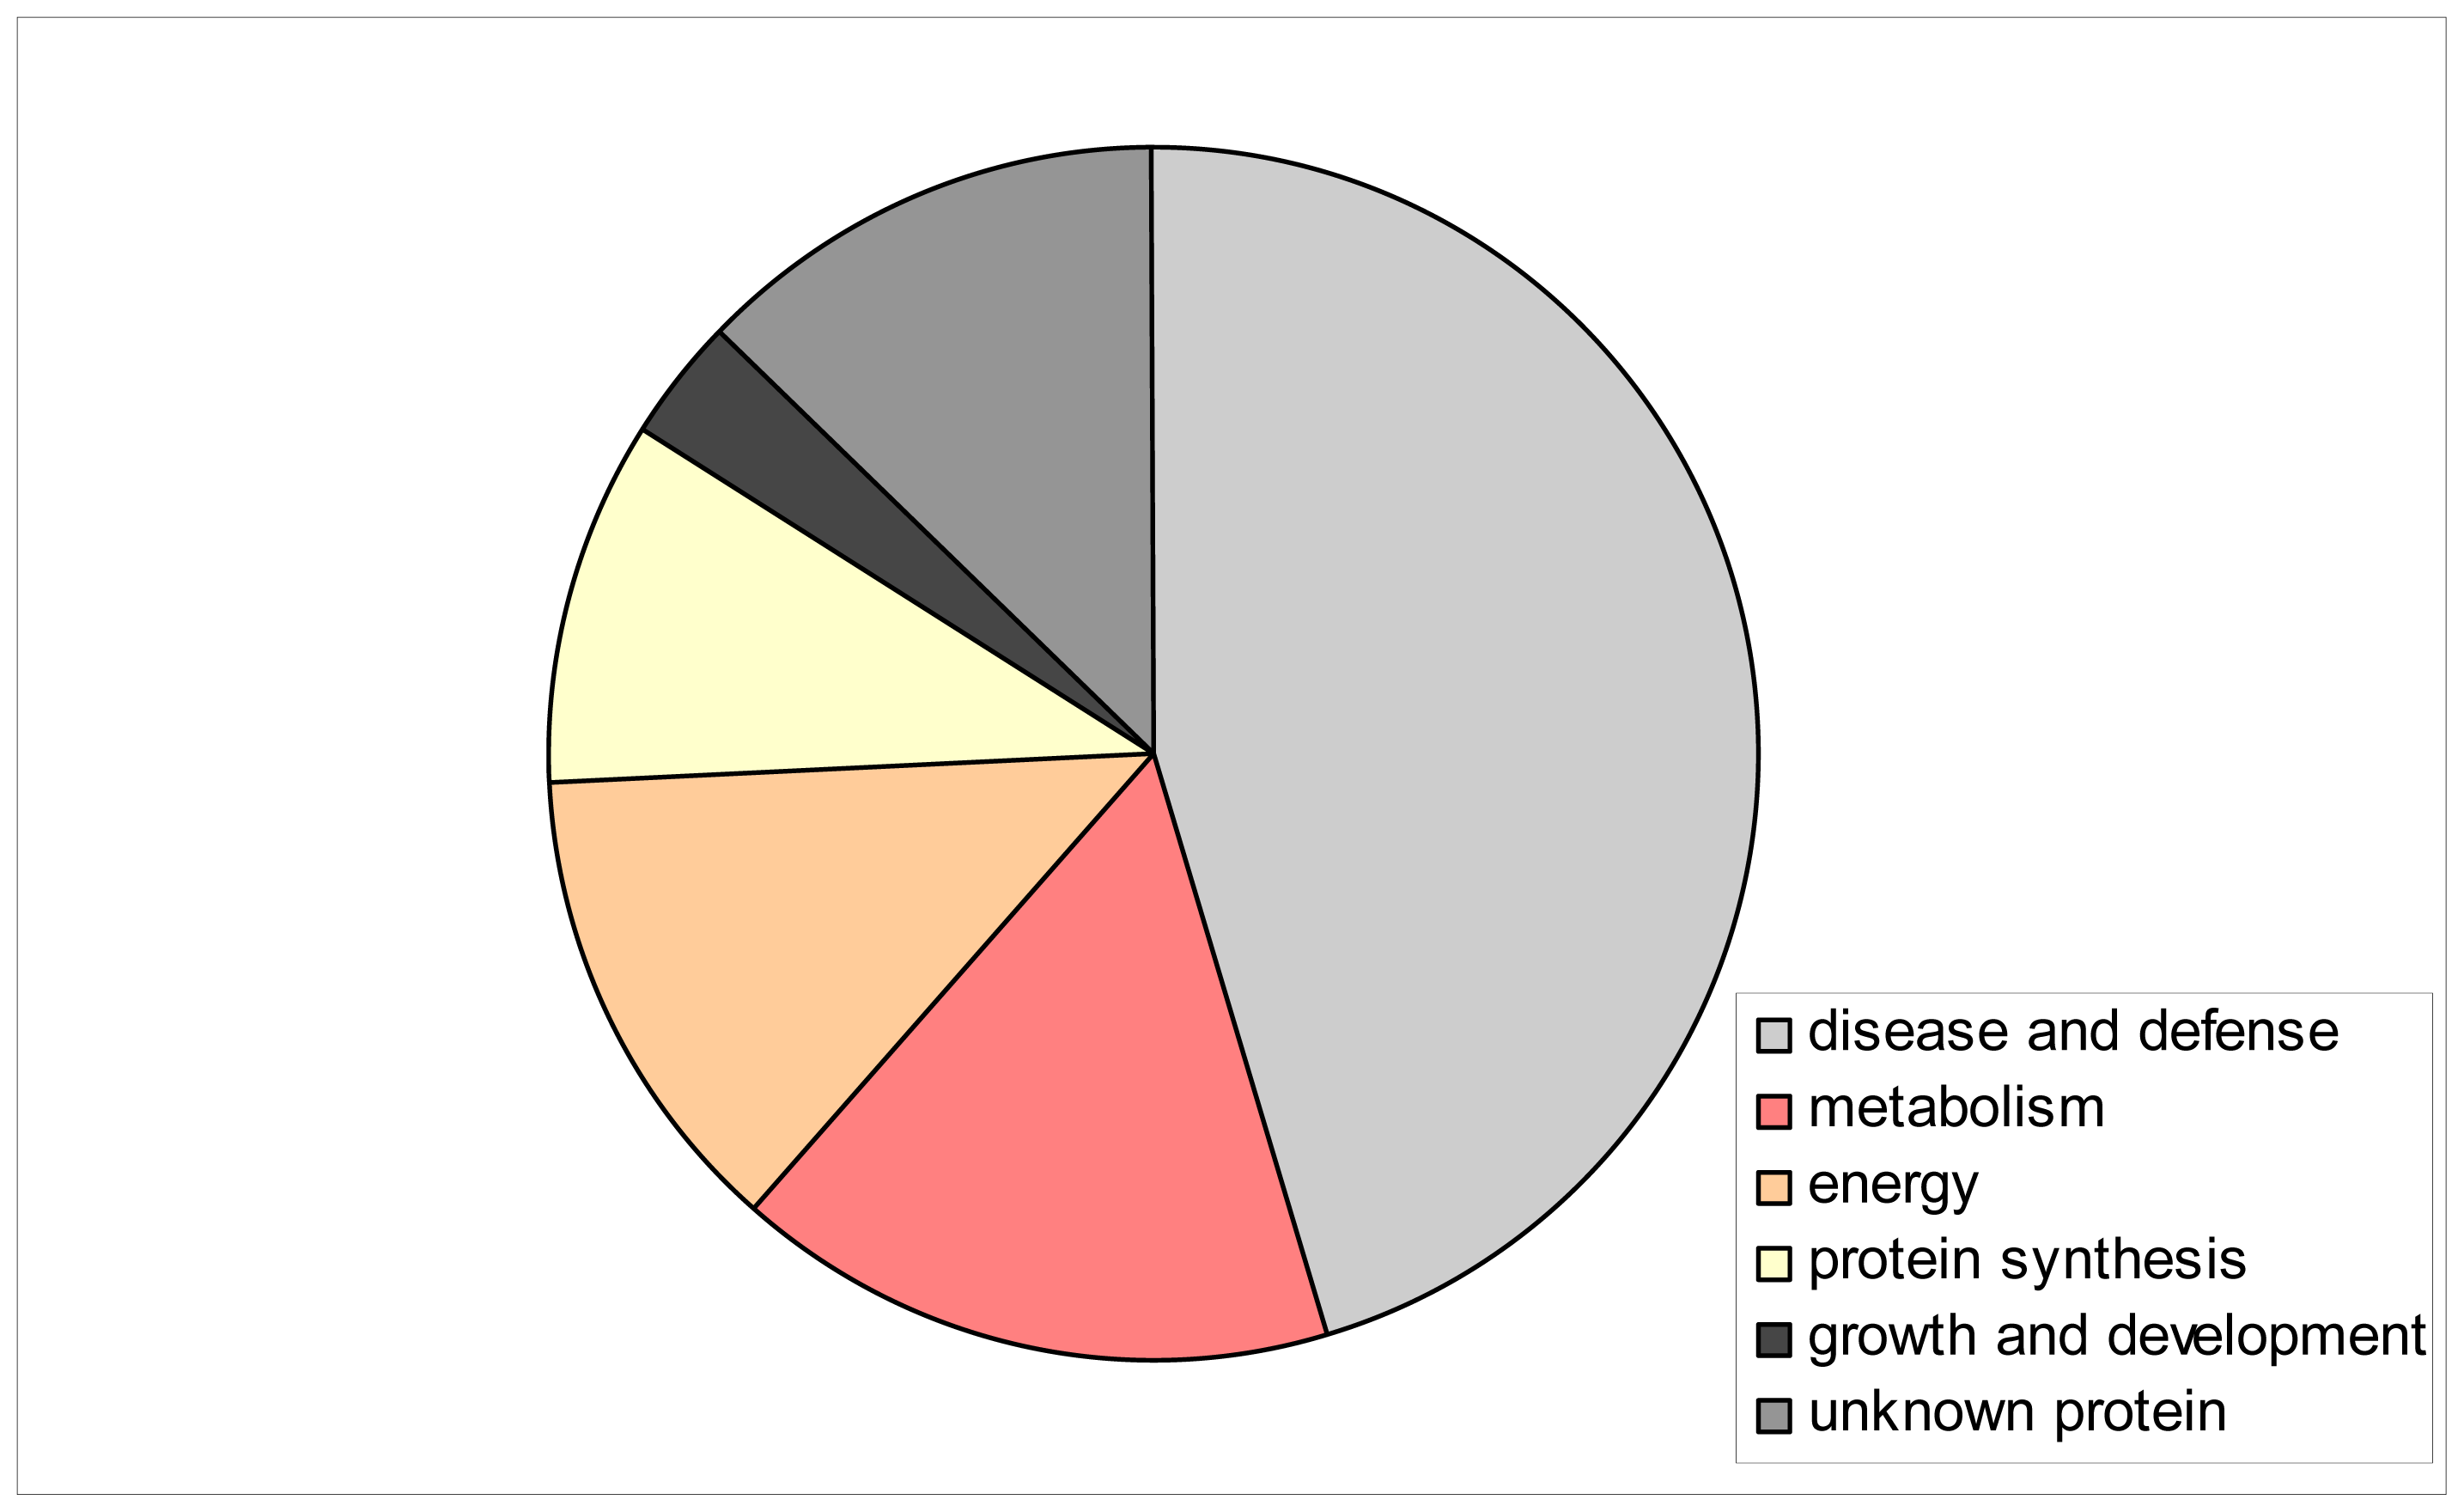
| 1 * | 0.1203 | 0.4296 | 0.1818 | 0.1977 | CAA82945 | Heat-shock protein, S. cereal | 3526 | 47 | disease and defense |
| 2 * | 0.5020 | 1.0492 | 0.5464 | 0.7669 | ACT65562 | 70 kDa heat shock protein, T. aestivum | 2581 | 38 | disease and defense |
| 3 * | 0.3994 | 0.5682 | 0.6887 | 0.8340 | CAA47948 | Heat shock protein 70, O. sativa | 5974 | 58 | disease and defense |
| 4 | 0.1899 | 0.5595 | 0.4675 | 1.0772 | PO8823 | RuBisCO large subunit-binding protein subunit alfa, chloroplastic (60 kDa chaperonin subunit alfa), T.aestivum | 15416 | 58 | disease and defense |
| 5 | 0.5488 | 1.1695 | 0.8930 | 1.3915 | Q43831 | RuBisCO large subunit-binding protein subunit beta, chloroplastic (60 kDa chaperonin subunit beta), S. cereal | 11239 | 65 | disease and defense |
| 6 | 0.0487 | 0.1235 | 0.1173 | 0.1244 | Q43831 | RuBisCO large subunit-binding protein subunit beta, chloroplastic (60 kDa chaperonin subunit beta), S. cereal | 4325 | 55 | disease and defense |
| 7 | 0.0577 | 0.0970 | 0.1091 | 0.1279 | Q43831 | RuBisCO large subunit-binding protein subunit beta, chloroplastic (60 kDa chaperonin subunit beta), S. cereal | 2326 | 37 | disease and defense |
| 8 * | 0.0474 | 0.0878 | 0.0676 | 0.1043 | Unknown | Unknown | 2492 | 28 | - |
| 9 | 0.0243 | 0.0706 | 0.0465 | 0.0469 | NP_001056601 | Os06go114000–hypothetical protein similar to 60 kDa chaperonin (Protein Cpn60), O. sativa | 2136 | 20 | disease and defense |
| 10 | 0.2498 | 0.3715 | 0.1788 | 0.2889 | Q40073 | Ribulase bisphosphate carboxylase/oxygenase activase A, chloroplastic; (RuBisCO activase A), H. vulgare | 4802 | 49 | metabolism |
| 11 | 0.0359 | 0.0984 | 0.0654 | 0.0511 | Q43831 | RuBisCO large subunit-binding protein subunit beta, chloroplastic; (60 kDa chaperonin subunit beta), S. cereale | 1048 | 26 | disease and defense |
| 12 | 0.2444 | 0.5373 | 0.2588 | 0.5118 | AAF15312 | Chloroplast translational elongation factor Tu, O. sativa | 1269 | 22 | protein synthesis |
| 13 | 0.0888 | 0.1296 | 0.0531 | 0.0681 | AAF71272 | Ribulose bisphosphate carboxylase activase B, T. aestivum | 1735 | 29 | metabolism |
| 14 | 0.0280 | 0.0582 | 0.0183 | 0.0477 | Q43831 | RuBisCO large subunit-binding protein subunit beta, chloroplastic (60 kDa chaperonin subunit beta), S. cereale | 1075 | 19 | disease and defense |
| 15 * | 0.6958 | 1.0498 | 0.5114 | 0.5135 | Unknown | Unknown | 3733 | 44 | - |
| 16 | 0.0787 | 0.1996 | 0.0753 | 0.0834 | CAD30025 | Ferredoxin-NADP (H) oxidoreductase B, T. aestivum | 1976 | 33 | energy |
| 17 * | 0.0726 | 0.1294 | 0.0472 | 0.0697 | Unknown | Unknown | 1011 | 36 | - |
| 18 | 0.1338 | 0.2438 | 0.0697 | 0.2215 | CAA11893 | cp31BHv (nucleic acid-binding protein), H. vulgare | 1081 | 29 | metabolism |
| 19 | 0.1001 | 0.2228 | 0.1023 | 0.1851 | CAA11893 | cp31BHv (nucleic acid-binding protein), H. vulgare | 1170 | 36 | metabolism |
| 20 * | 0.1431 | 0.2969 | 0.1893 | 0.2896 | ACG41110.1 | chaperonin, Z. mays | 3114 | 85 | disease and defense |
| 21 * | 0.1516 | 0.0367 | 0.0957 | 0.0683 | Unknown | Unknown | 348 | 29 | - |
| 22 | 0.1540 | 0.0357 | 0.0207 | 0.0720 | CAA55976 | ES2A (gibberellic acid (GA3) inducible), H. vulgare | 987 | 74 | growth and development |
| 23 * | 0.0456 | 0.0386 | 0.0141 | 0.0352 | ACG41110.1 | Chaperonin, Z. mays | 230 | 22 | disease and defense |
| 24 * | 0.0321 | 0.0706 | 0.0309 | 0.0465 | BAD22518.1 | glycolipid transfer protein-like, O. sativa | 113 | 14 | energy |
| 25 * | 0.0974 | 0.1335 | 0.0580 | 0.0311 | YP_874661.1 | ribulose 1,5-bisphosphate carboxylase/oxygenase large subunit, H. vulgare | 708 | 10 | energy |
| 26 | 0.5010 | 0.4965 | 0.7231 | 0.3582 | BAA74702 | Germin-like protein 1, O. sativa | 2249 | 15 | disease and defense |
| 27 | 0.0109 | 0.0421 | 0.0114 | 0.0260 | AAT40531.1 | ATP synthase D chain, mitochondrial, putative, S. demissum | 161 | 20 | metabolism |
| 28 | 0.1267 | 0.0516 | 0.0519 | 0.0479 | AAZ95171 | Eukaryotic translation initiation factor 5A1 | 447 | 26 | protein synthesis |
| 29 | 0.1315 | 0.0455 | 0.0455 | 0.0695 | Q43831 | RuBisCO large subunit-binding protein subunit beta, chloroplastic; (60 kDa chaperonin subunit beta), S. cereale | 1069 | 14 | disease and defense |
| 30 * | 0.0650 | 0.0589 | 0.0351 | 0.0929 | AAP44537.1 | cyclophilin-like protein, T. aestivum | 567 | 30 | protein synthesis |
| 31 | 0.0373 | 0.1243 | 0.0530 | 0.1459 | ACG36699 | Huntingtin interacting protein K, Z. mays | 142 | 22 | energy |
© 2012 by the authors; licensee Molecular Diversity Preservation International, Basel, Switzerland. This article is an open-access article distributed under the terms and conditions of the Creative Commons Attribution license (http://creativecommons.org/licenses/by/3.0/).
Share and Cite
Kuczyńska, A.; Kosmala, A.; Surma, M.; Adamski, T. Identification of Tillering Node Proteins Differentially Accumulated in Barley Recombinant Inbred Lines with Different Juvenile Growth Habits. Int. J. Mol. Sci. 2012, 13, 10410-10423. https://doi.org/10.3390/ijms130810410
Kuczyńska A, Kosmala A, Surma M, Adamski T. Identification of Tillering Node Proteins Differentially Accumulated in Barley Recombinant Inbred Lines with Different Juvenile Growth Habits. International Journal of Molecular Sciences. 2012; 13(8):10410-10423. https://doi.org/10.3390/ijms130810410
Chicago/Turabian StyleKuczyńska, Anetta, Arkadiusz Kosmala, Maria Surma, and Tadeusz Adamski. 2012. "Identification of Tillering Node Proteins Differentially Accumulated in Barley Recombinant Inbred Lines with Different Juvenile Growth Habits" International Journal of Molecular Sciences 13, no. 8: 10410-10423. https://doi.org/10.3390/ijms130810410