
Functional Studies and In Silico Analyses to Evaluate Non-Coding Variants in Inherited Cardiomyopathies

 , , ,
, , ,
Abstract
: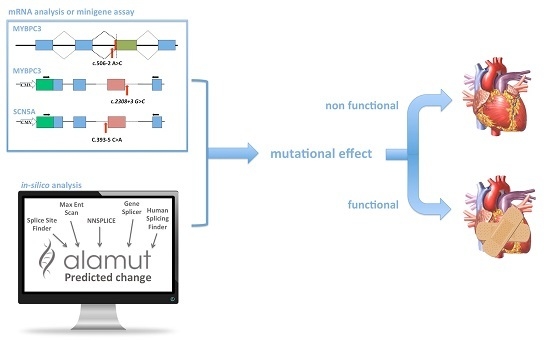
1. Introduction
2. Results
2.1. Clinical Molecular Genetics
2.2. In Silico Analysis
- (1)
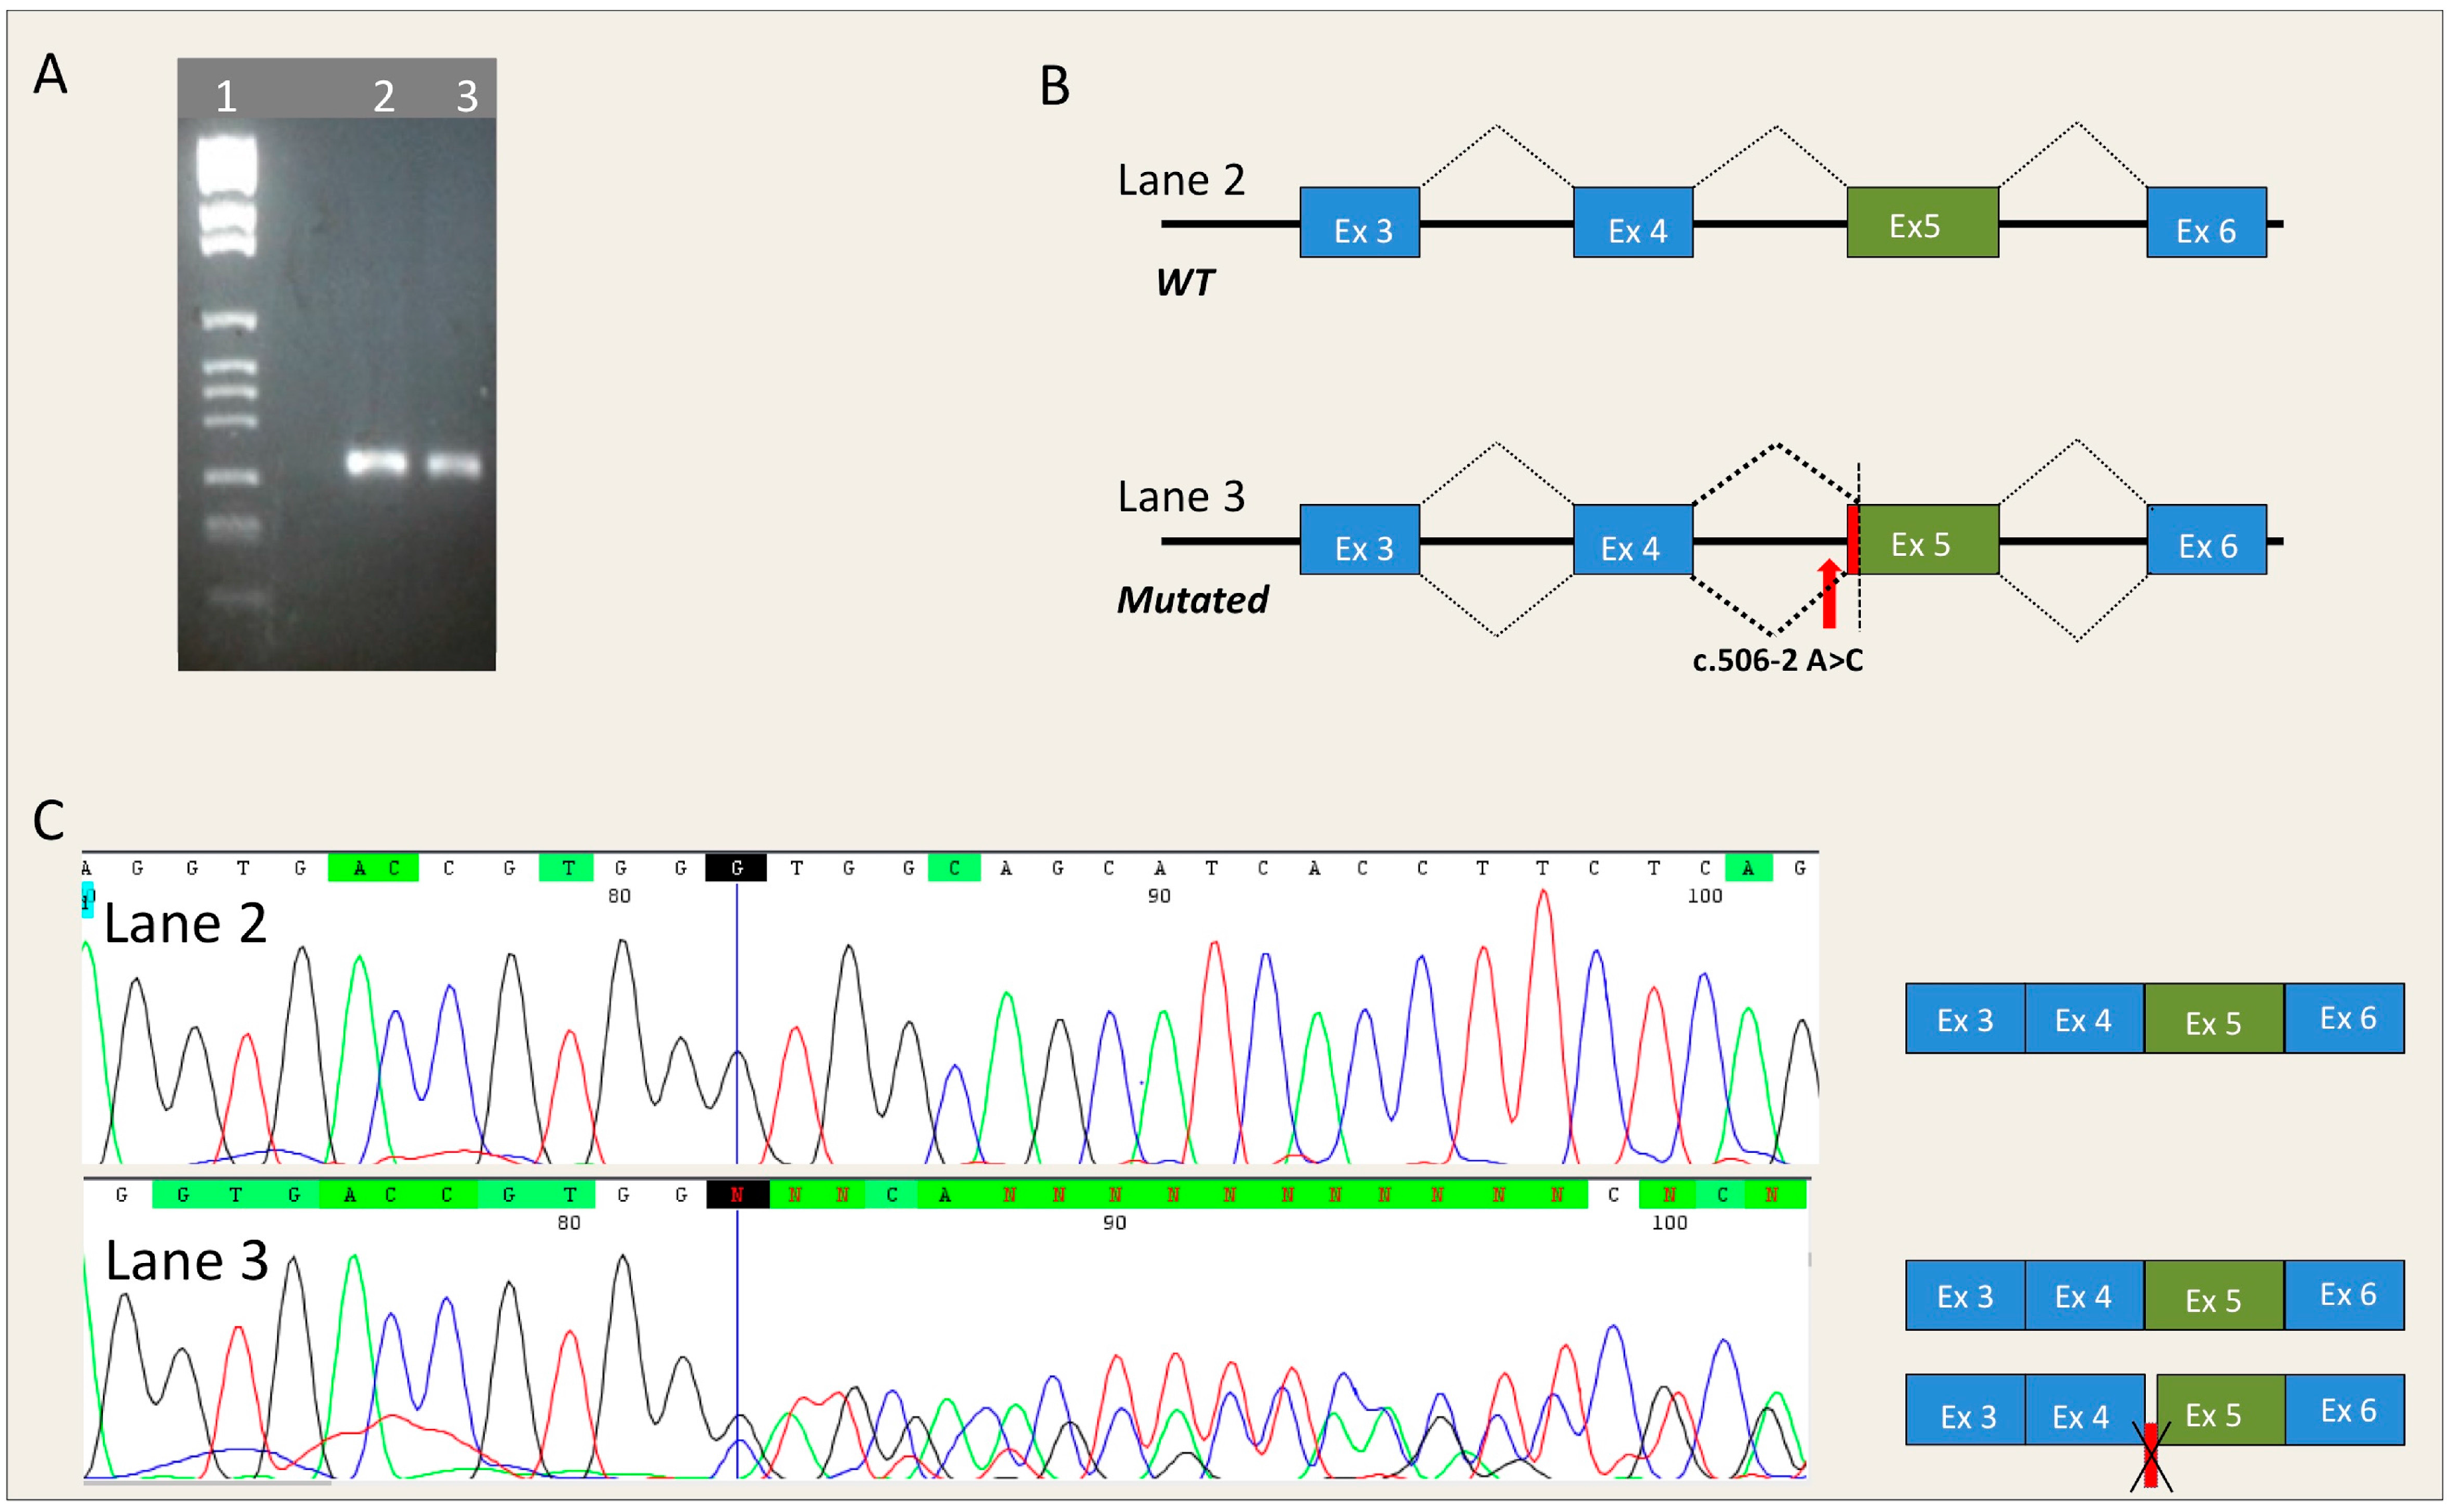
- MYBPC3-c.506-2A>C is located in the acceptor splice site of intron 4 of the MYBPC3 gene. All five algorithms run by Alamut showed that MYBPC3-c.506-2A>C severely affected the splicing process. In fact, it caused the loss of the natural acceptor splice site. It also resulted in a cryptic splice site at position MYBPC3-c.513.
- (2)
- MYBPC3-c.906-7G>T is located in intron 9 of the MYBPC3 gene. Four algorithms (Splice Site Finder, MaxEnt, GeneSplicer and Human Site Finder) of the Alamut software predicted a small increase in the efficiency of the splicing acceptor site.
- (3)
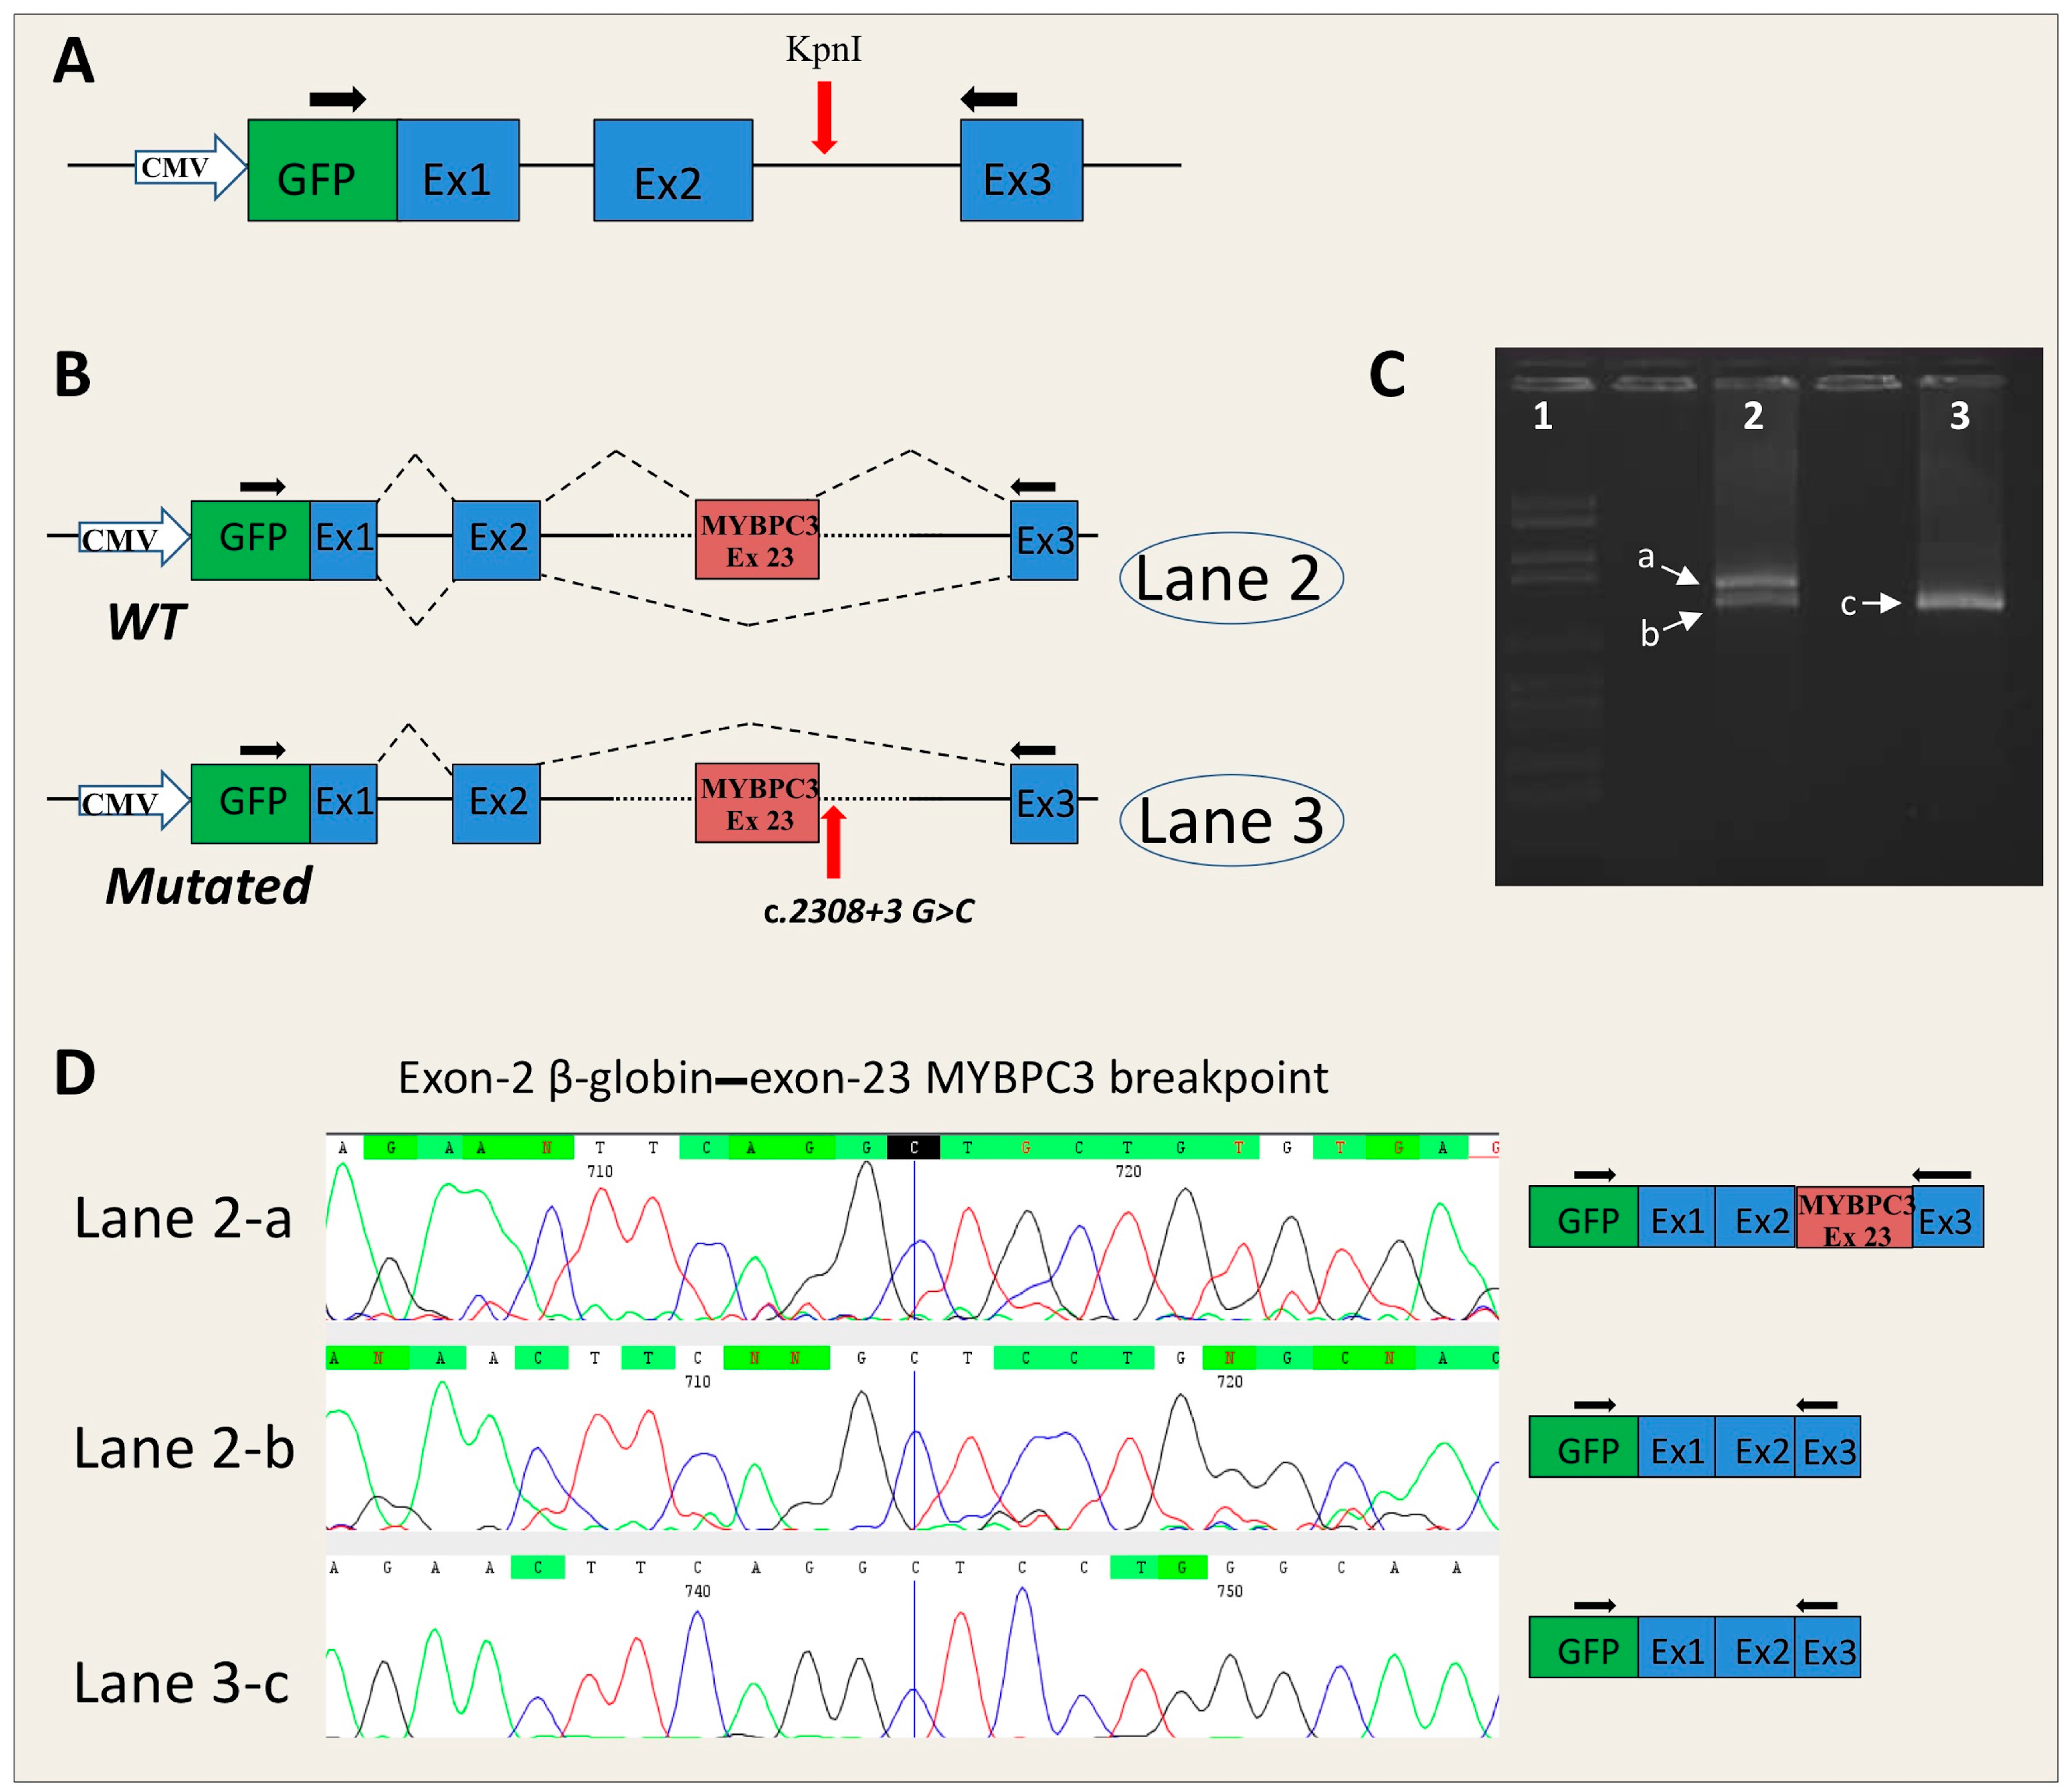
- MYBPC3-c.2308+3G>C: this novel mutation is located in the donor splice site of intron 23 of the MYBPC3 gene. Two algorithms (MaxEnt and NN Splice) of the Alamut software predicted a consistent alteration with a strength reduction (above 50%) of the natural donor site. The other three algorithms also predicted a donor site alteration, but the percentage of variation induced by the mutation was less than 33% (SSF ≥ −7.1%, GeneSplicer ≥ −32.8%; HSF ≥ −8%). The effect of this change was not predictable by Alamut.
- (4)
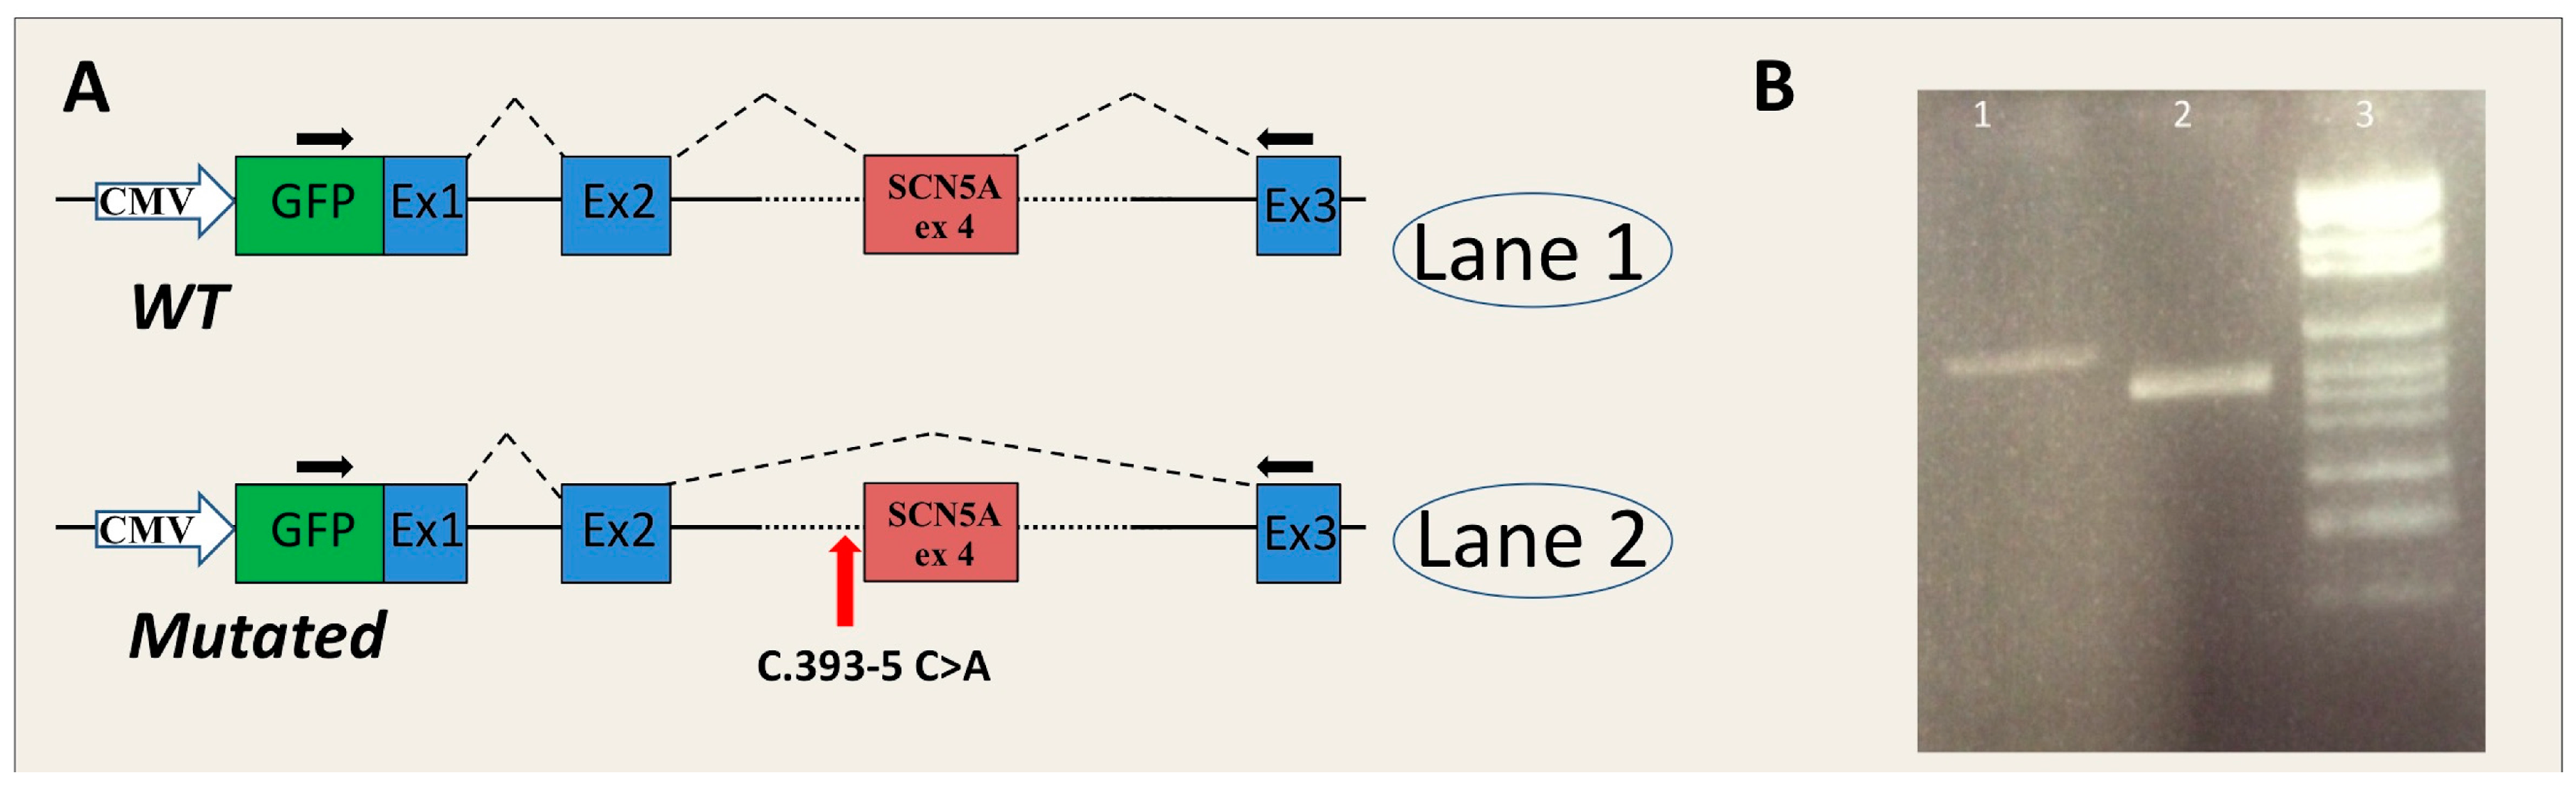
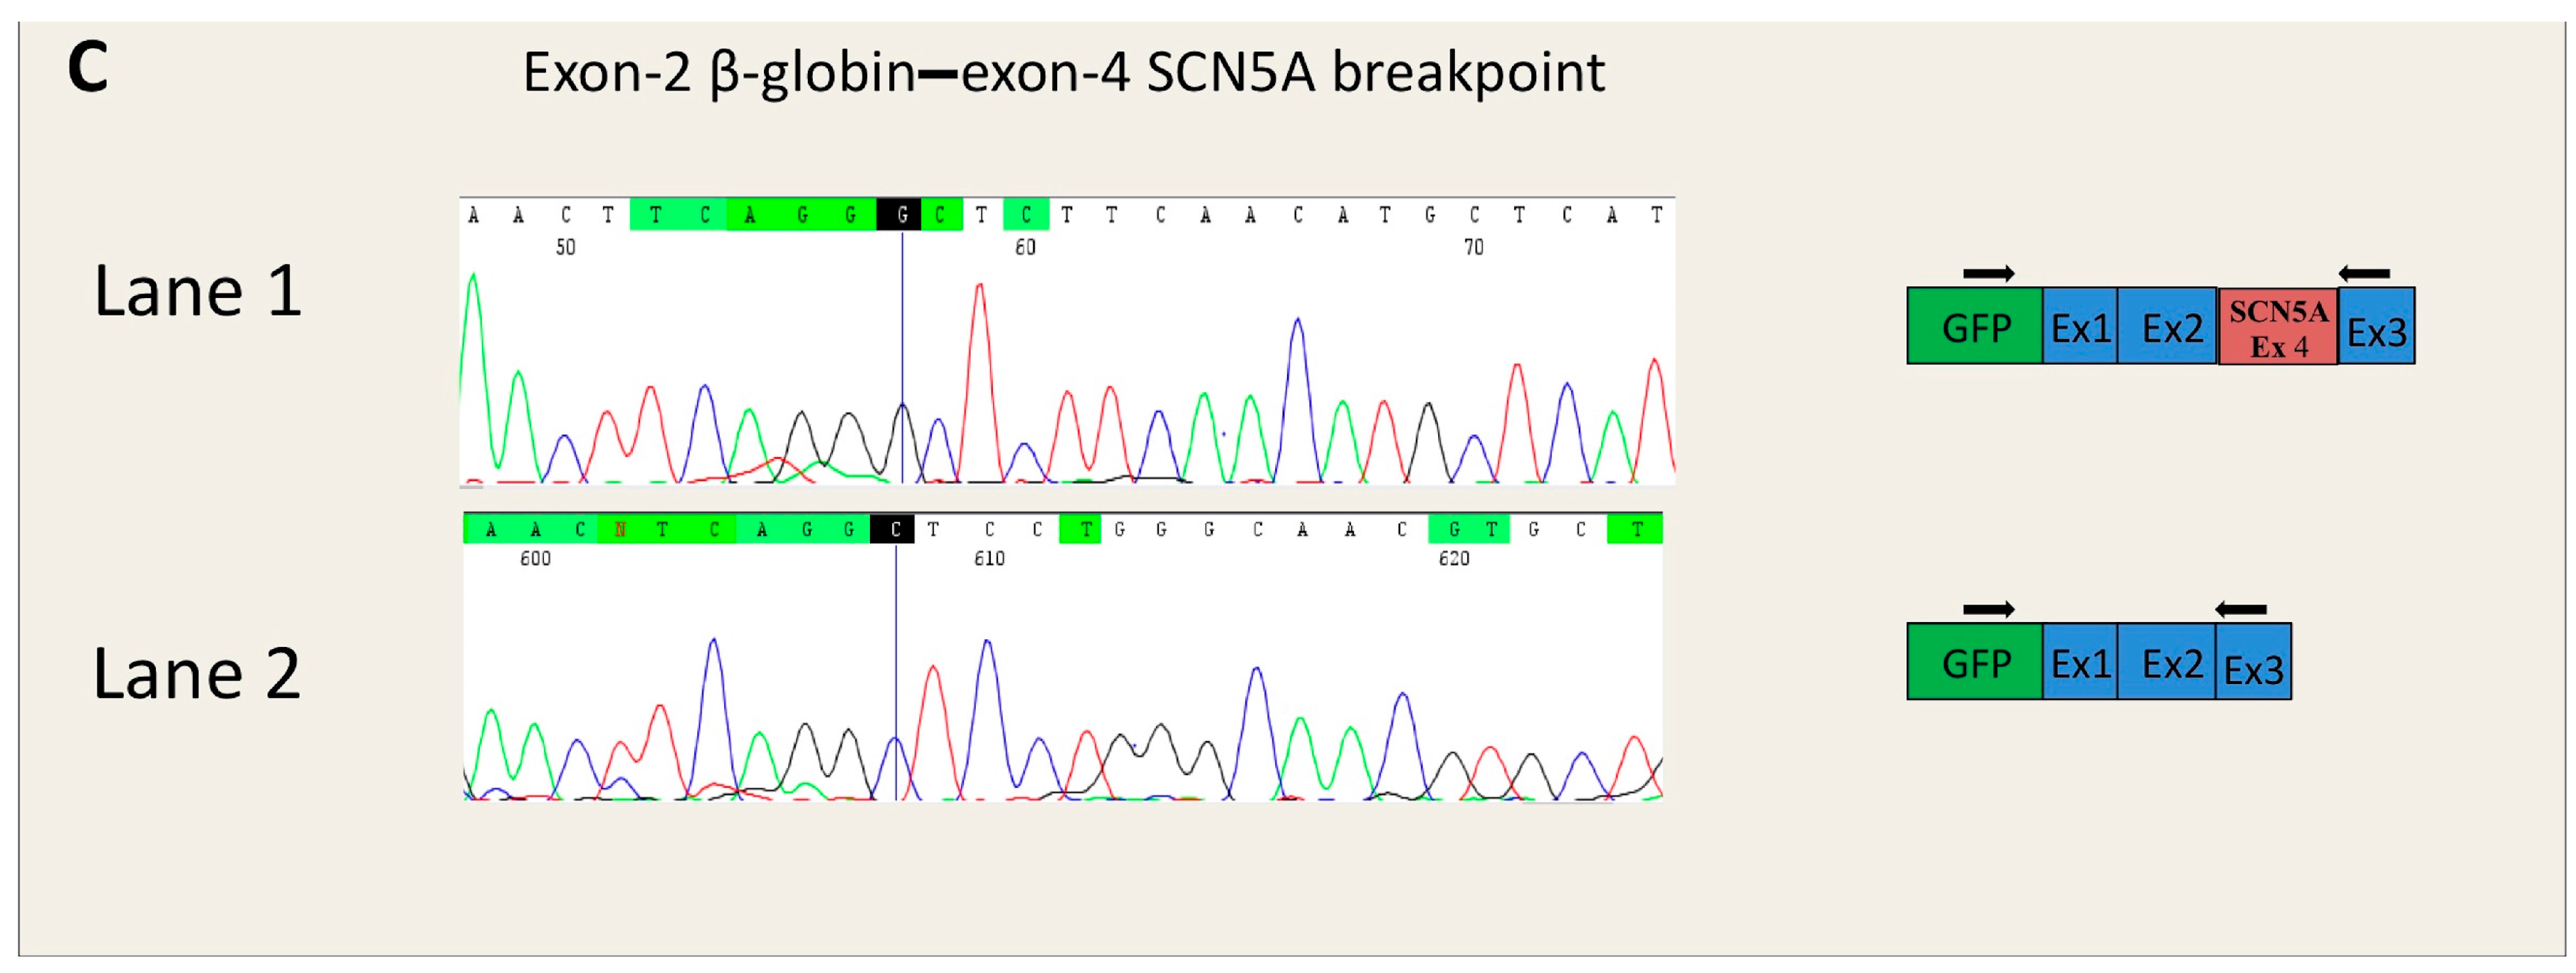
- SCN5A-c.393-5C>A is located in intron 3 of the SCN5A gene. Two tools of the Alamut software (SSF and HSF) predicted the creation of a novel acceptor site (score increase of more than 70%), although the other three algorithms did not reveal any differences between wild type (WT) and mutated sequences. No algorithm scored the wild-type consensus site.
- (5)
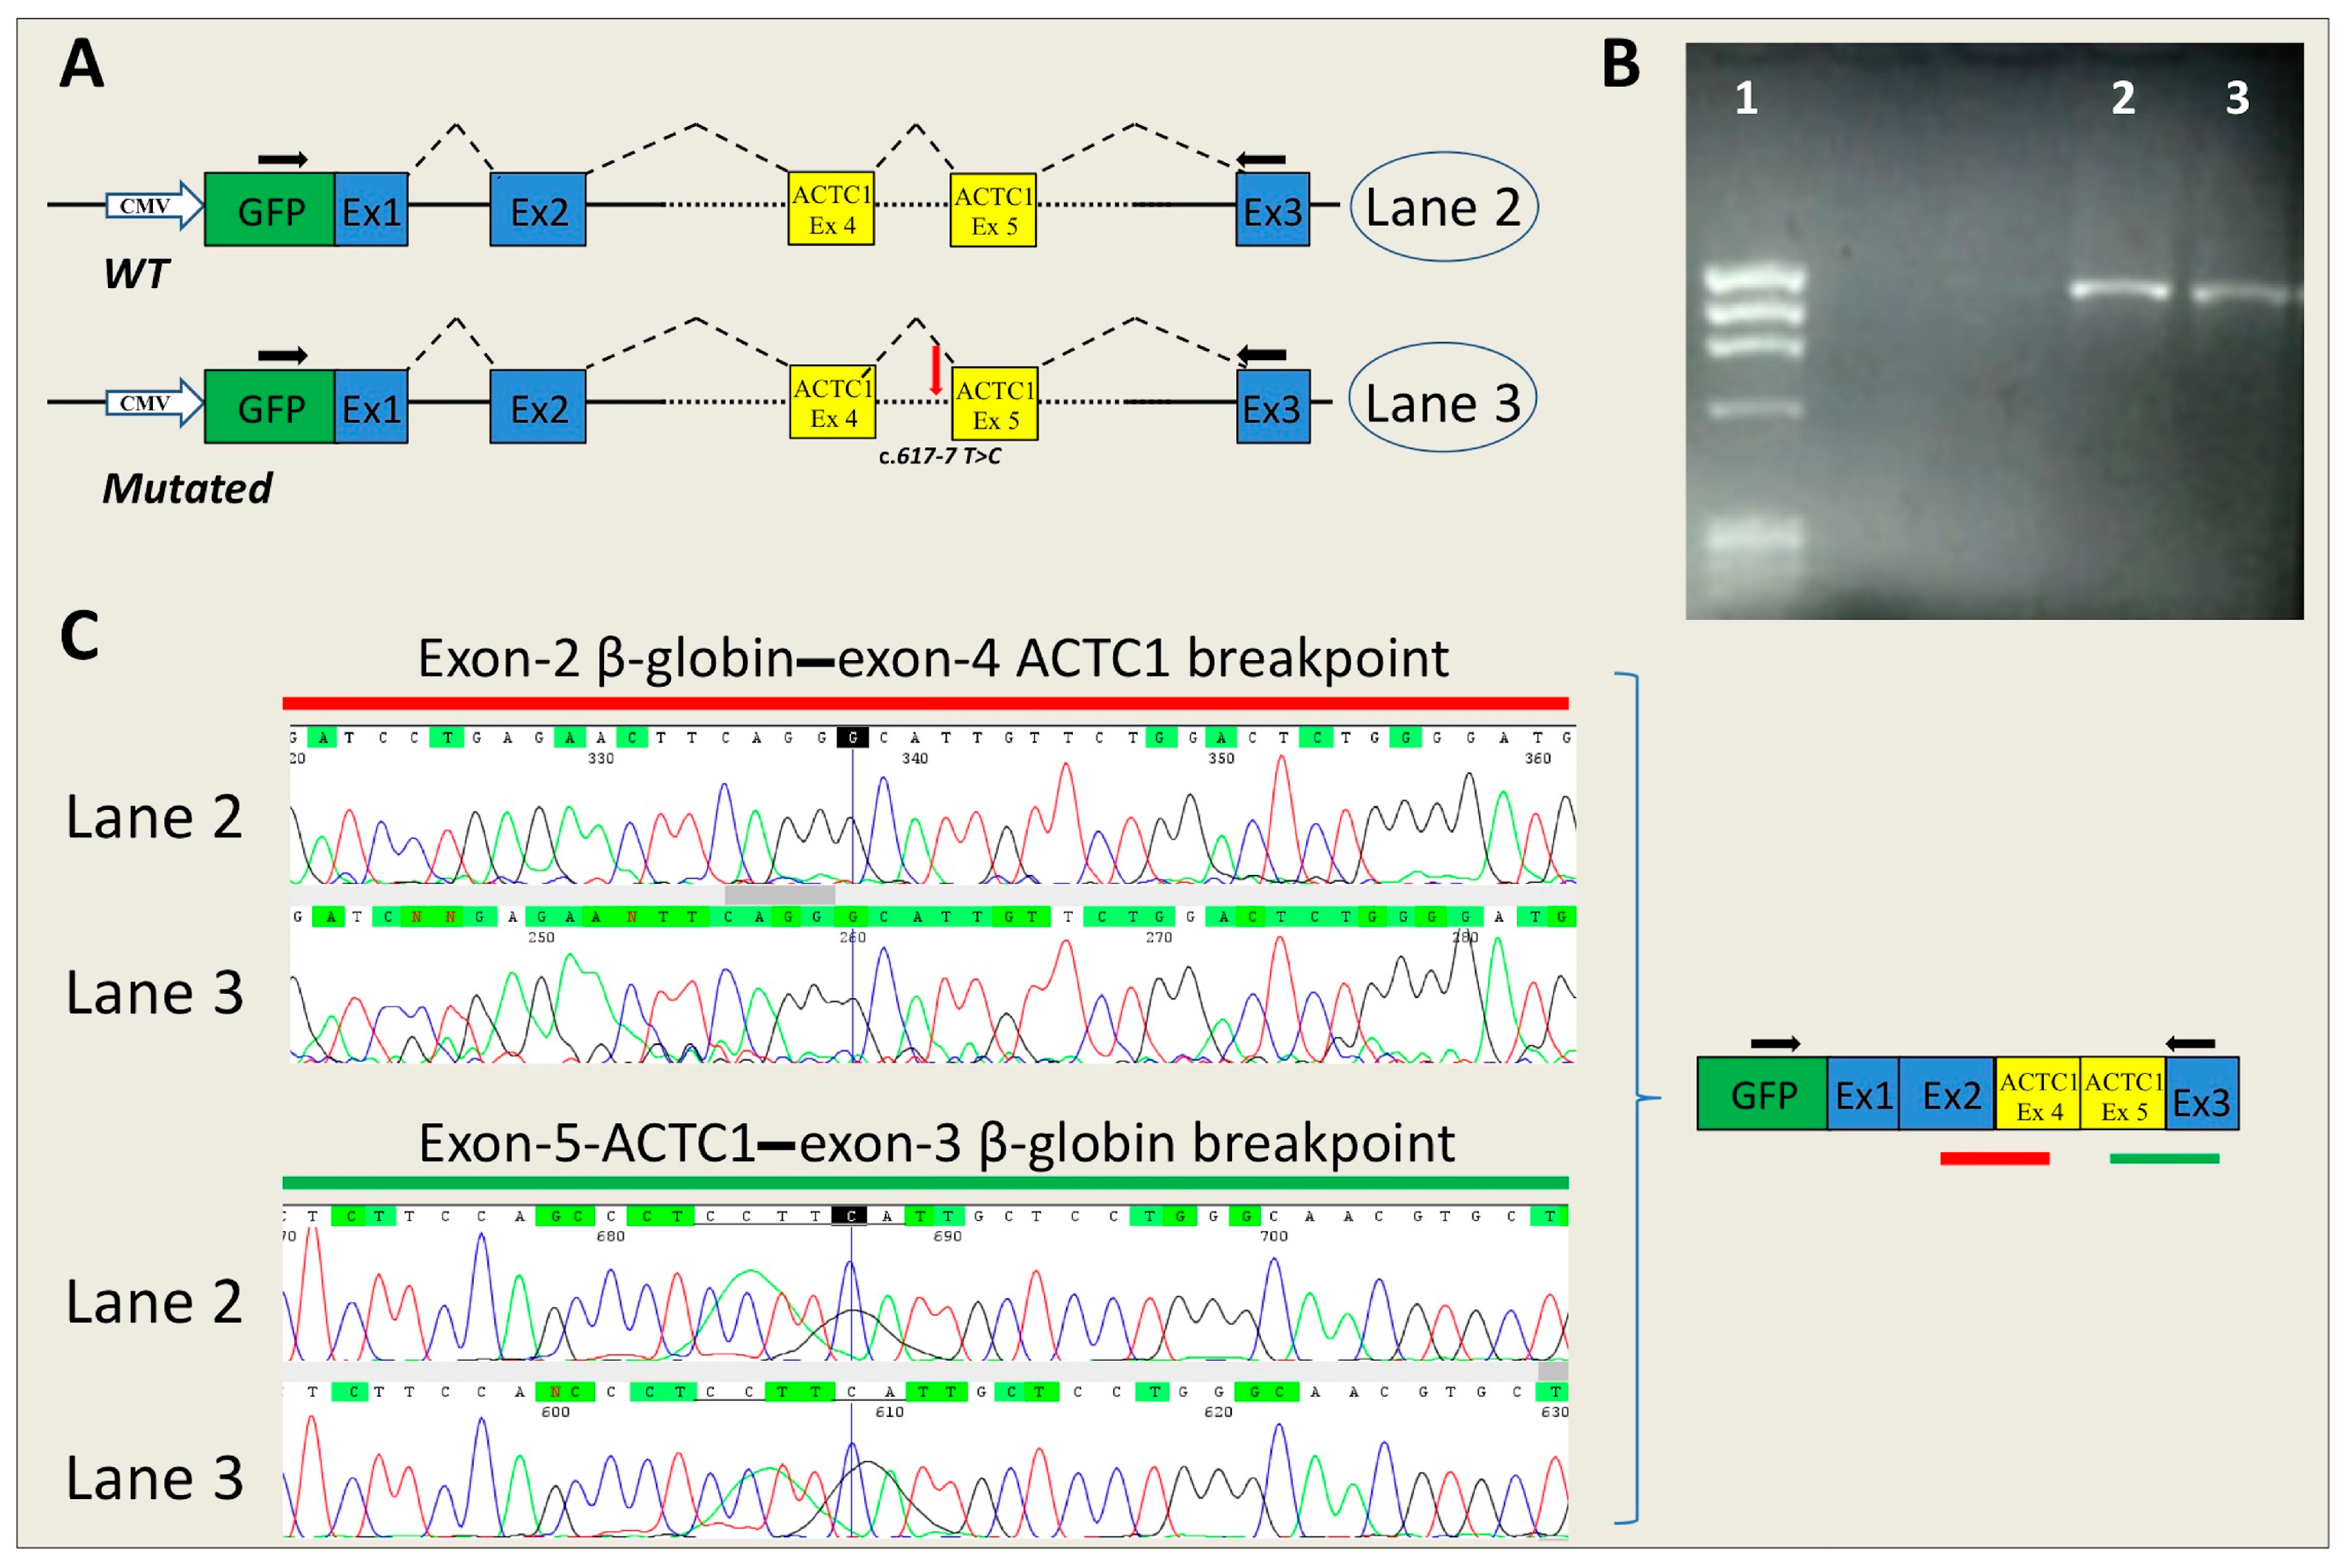
- ACTC1-c.617-7T>C: this novel mutation is located in the polypyrimidine tract of the acceptor site of intron 4 in the ACTC1 gene. Three algorithms (MaxEnt, GeneSplicer and HSF) predicted no differences between WT and mutant; the other two revealed minimal differences.
2.3. In Vitro Analysis
3. Discussion
4. Materials and Methods
4.1. Molecular Genetics
4.2. Splice-Site Prediction Analysis
4.3. In Vitro RNA Splicing Analysis of MYBPC3-c.506-2A>C
4.4. In Vitro RNA Splicing Analysis by Minigene
4.4.1. Insert Generation (MYBPC3-c.906-7G>T, MYBPC3-c.2308+3G>C, SCN5A-c.393-5C>A, ACTC1-c.617-7T>C)
4.4.2. Minigene Plasmid Construction, Expression, and Transcripts Analysis
5. Conclusions
Supplementary Materials
Acknowledgments
Author Contributions
Conflicts of Interest
References
- Lopez-Bigas, N.; Audit, B.; Ouzounis, C.; Parra, G.; Guigo, R. Are splicing mutations the most frequent cause of hereditary disease? FEBS Lett. 2005, 579, 1900–1903. [Google Scholar] [CrossRef] [PubMed]
- Baralle, D.; Baralle, M. Splicing in action: Assessing disease causing sequence changes. J. Med. Genet. 2005, 42, 737–748. [Google Scholar] [CrossRef] [PubMed]
- Amendola, L.M.; Dorschner, M.O.; Robertson, P.D.; Salama, J.S.; Hart, R.; Shirts, B.H.; Murray, M.L.; Tokita, M.J.; Gallego, C.J.; Kim, D.S.; et al. Actionable exomic incidental findings in 6503 participants: Challenges of variant classification. Genome Res. 2015, 25, 305–315. [Google Scholar] [CrossRef] [PubMed]
- Dong, C.L.; Wei, P.; Jian, X.Q.; Gibbs, R.; Boerwinkle, E.; Wang, K.; Liu, X.M. Comparison and integration of deleteriousness prediction methods for nonsynonymous snvs in whole exome sequencing studies. Hum. Mol. Genet. 2015, 24, 2125–2137. [Google Scholar] [CrossRef] [PubMed]
- Spurdle, A.B.; Couch, F.J.; Hogervorst, F.B.L.; Radice, P.; Sinilnikova, O.M.; Variants, I.U.G. Prediction and assessment of splicing alterations: Implications for clinical testing. Hum. Mutat. 2008, 29, 1304–1313. [Google Scholar] [CrossRef] [PubMed]
- Petersen, S.M.; Dandanell, M.; Rasmussen, L.J.; Gerdes, A.M.; Krogh, L.N.; Bernstein, I.; Okkels, H.; Wikman, F.; Nielsen, F.C.; Hansen, T.V. Functional examination of MLH1, MSH2, and MSH6 intronic mutations identified in danish colorectal cancer patients. BMC Med. Genet. 2013, 14, 103. [Google Scholar] [CrossRef] [PubMed] [Green Version]
- Lewandowska, M.A. The missing puzzle piece: Splicing mutations. Int. J. Clin. Exp. Pathol. 2013, 6, 2675–2682. [Google Scholar] [PubMed]
- Cooper, T.A.; Wan, L.; Dreyfuss, G. RNA and disease. Cell 2009, 136, 777–793. [Google Scholar] [CrossRef] [PubMed]
- Frisso, G.; Limongelli, G.; Pacileo, G.; del Giudice, A.; Forgione, L.; Calabro, P.; Iacomino, M.; Detta, N.; di Fonzo, L.M.; Maddaloni, V.; et al. A child cohort study from southern italy enlarges the genetic spectrum of hypertrophic cardiomyopathy. Clin. Genet. 2009, 76, 91–101. [Google Scholar] [CrossRef] [PubMed]
- Gong, Q.; Stump, M.R.; Zhou, Z. Position of premature termination codons determines susceptibility of herg mutations to nonsense-mediated mrna decay in long qt syndrome. Gene 2014, 539, 190–197. [Google Scholar] [CrossRef] [PubMed]
- Amato, F.; Bellia, C.; Cardillo, G.; Castaldo, G.; Ciaccio, M.; Elce, A.; Lembo, F.; Tomaiuolo, R. Extensive molecular analysis of patients bearing cftr-related disorders. J. Mol. Diagn. 2012, 14, 81–89. [Google Scholar] [CrossRef] [PubMed]
- Dujardin, G.; Commandeur, D.; Le Jossic-Corcos, C.; Ferec, C.; Corcos, L. Splicing defects in the CFTR gene: Minigene analysis of two mutations, 1811+1G>C and 1898+3A>G. J. Cyst. Fibros. 2011, 10, 212–216. [Google Scholar] [CrossRef] [PubMed]
- Bonnet, C.; Krieger, S.; Vezain, M.; Rousselin, A.; Tournier, I.; Martins, A.; Berthet, P.; Chevrier, A.; Dugast, C.; Layet, V.; et al. Screening BRCA1 and BRCA2 unclassified variants for splicing mutations using reverse transcription PCR on patient RNA and an ex vivo assay based on a splicing reporter minigene. J. Med. Genet. 2008, 45, 438–446. [Google Scholar] [CrossRef] [PubMed]
- Steffensen, A.Y.; Dandanell, M.; Jonson, L.; Ejlertsen, B.; Gerdes, A.M.; Nielsen, F.C.; Hansen, T. Functional characterization of BRCA1 gene variants by mini-gene splicing assay. Eur. J. Hum. Genet. 2014, 22, 1362–1368. [Google Scholar] [CrossRef] [PubMed]
- Hedley, P.L.; Jorgensen, P.; Schlamowitz, S.; Wangari, R.; Moolman-Smook, J.; Brink, P.A.; Kanters, J.K.; Corfield, V.A.; Christiansen, M. The genetic basis of long QT and short QT syndromes: A mutation update. Hum. Mutat. 2009, 30, 1486–1511. [Google Scholar] [CrossRef] [PubMed]
- National Center for Biotechnology Information. Available online: http://www.ncbi.nlm.nih.gov/snp/ (accessed on 8 July 2016).
- Exome Aggregatium Consortium. Available online: http://exac.broadinstitute.org/ (accessed on 8 July 2016).
- Exome Variant Server. Available online: http://evs.gs.washington.edu/evs/ (accessed on 8 July 2016).
- Flavigny, J.; Souchet, M.; Sebillon, P.; Berrebi-Bertrand, I.; Hainque, B.; Mallet, A.; Bril, A.; Schwartz, K.; Carrier, L. COOH-terminal truncated cardiac myosin-binding protein C mutants resulting from familial hypertrophic cardiomyopathy mutations exhibit altered expression and/or incorporation in fetal rat cardiomyocytes. J. Mol. Biol. 1999, 294, 443–456. [Google Scholar] [CrossRef] [PubMed]
- Crehalet, H.; Millat, G.; Albuisson, J.; Bonnet, V.; Rouvet, I.; Rousson, R.; Bozon, D. Combined use of in silico and in vitro splicing assays for interpretation of genomic variants of unknown significance in cardiomyopathies and channelopathies. Cardiogenetics 2012, 2, e6. [Google Scholar] [CrossRef]
- Helms, A.S.; Davis, F.M.; Coleman, D.; Bartolone, S.N.; Glazier, A.A.; Pagani, F.; Yob, J.M.; Sadayappan, S.; Pedersen, E.; Lyons, R.; et al. Sarcomere mutation-specific expression patterns in human hypertrophic cardiomyopathy. Circ. Cardiovasc. Genet. 2014, 7, 434–443. [Google Scholar] [CrossRef] [PubMed]
- Di Resta, C.; Manzoni, M.; Berisso, M.Z.; Siciliano, G.; Benedetti, S.; Ferrari, M. Evaluation of damaging effects of splicing mutations: Validation of an in vitro method for diagnostic laboratories. Clin. Chim. Acta Int. J. Clin. Chem. 2014, 436, 276–282. [Google Scholar] [CrossRef] [PubMed]
- Zhang, M.; D’Aniello, C.; Verkerk, A.O.; Wrobel, E.; Frank, S.; Ward-van Oostwaard, D.; Piccini, I.; Freund, C.; Rao, J.; Seebohm, G.; et al. Recessive cardiac phenotypes in induced pluripotent stem cell models of jervell and lange-nielsen syndrome: Disease mechanisms and pharmacological rescue. Proc. Natl. Acad. Sci. USA 2014, 111, E5383–E5392. [Google Scholar] [CrossRef] [PubMed]
- Messer, A.E.; Bayliss, C.R.; El-Mezgueldi, M.; Redwood, C.S.; Ward, D.G.; Leung, M.C.; Papadaki, M.; Dos Remedios, C.; Marston, S.B. Mutations in troponin T associated with hypertrophic cardiomyopathy increase Ca2+-sensitivity and suppress the modulation of Ca2+-sensitivity by troponin I phosphorylation. Arch. Biochem. Biophys. 2016, 601, 113–120. [Google Scholar] [CrossRef] [PubMed]
- Detta, N.; Frisso, G.; Salvatore, F. The multi-faceted aspects of the complex cardiac nav1.5 protein in membrane function and pathophysiology. Biochim. Biophys. Acta 2015, 1854, 1502–1509. [Google Scholar] [CrossRef] [PubMed]
- Human Gene Mutation Database. Available online: http://www.hgmd.cf.ac.uk/ac/index.php (accessed on 8 July 2016).
- Ormondroyd, E.; Oates, S.; Parker, M.; Blair, E.; Watkins, H. Pre-symptomatic genetic testing for inherited cardiac conditions: A qualitative exploration of psychosocial and ethical implications. Eur. J. Hum. Genet. 2014, 22, 88–93. [Google Scholar] [CrossRef] [PubMed]
- Wallis, Y.; Payne, S.; McAnulty, C.; Bodmer, D.; Sistermans, E.; Robertson, K.; Moore, D.; Abbs, S.; Deans, Z.; Devereau, A. Practice guidelines for the evaluation of pathogenicity and the reporting of sequence variants in clinical molecular genetics. ACGS/VGKL. Available online: http://www.ukcgg.org/media/774853/evaluation_and_reporting_of_sequence_variants_bpgs_june_2013_-_finalpdf.pdf (accessed on 8 July 2016).
- Gourraud, J.B.; Barc, J.; Thollet, A.; Le Scouarnec, S.; Le Marec, H.; Schott, J.J.; Redon, R.; Probst, V. The brugada syndrome: A rare arrhythmia disorder with complex inheritance. Front. Cardiovasc. Med. 2016, 3, 9. [Google Scholar] [CrossRef] [PubMed]
- Calore, C.; de Bortoli, M.; Romualdi, C.; Lorenzon, A.; Angelini, A.; Basso, C.; Thiene, G.; Iliceto, S.; Rampazzo, A.; Melacini, P. A founder MYBPC3 mutation results in HCM with a high risk of sudden death after the fourth decade of life. J. Med. Genet. 2015, 52, 338–347. [Google Scholar] [CrossRef] [PubMed]
- Moreau, A.; Gosselin-Badaroudine, P.; Delemotte, L.; Klein, M.L.; Chahine, M. Gating pore currents are defects in common with two Nav1.5 mutations in patients with mixed arrhythmias and dilated cardiomyopathy. J. Gen. Physiol. 2015, 145, 93–106. [Google Scholar] [CrossRef] [PubMed]
- Biagini, E.; Olivotto, I.; Iascone, M.; Parodi, M.I.; Girolami, F.; Frisso, G.; Autore, C.; Limongelli, G.; Cecconi, M.; Maron, B.J.; et al. Significance of sarcomere gene mutations analysis in the end-stage phase of hypertrophic cardiomyopathy. Am. J. Cardiol. 2014, 114, 769–776. [Google Scholar] [CrossRef] [PubMed]
- D’Argenio, V.; Frisso, G.; Precone, V.; Boccia, A.; Fienga, A.; Pacileo, G.; Limongelli, G.; Paolella, G.; Calabro, R.; Salvatore, F. DNA sequence capture and next-generation sequencing for the molecular diagnosis of genetic cardiomyopathies. J. Mol. Diagn. 2014, 16, 32–44. [Google Scholar] [CrossRef] [PubMed]
- WMA Declaration of Helsinki—Ethical Principles for Medical Research Involving Human Subjects. JAMA 2013, 310, 2191–2194.
- Alamut Interactive Biosciences. Available online: http://www.interactive-biosoftware.com/ (accessed on 8 July 2016).


| Gene | Protein | Pathological Phenotype |
|---|---|---|
| MYH7 | Myosin, heavy chain 7 | HCM, DCM |
| MYBPC3 | Myosin binding protein C | HCM, DCM |
| TNNT2 | Troponin T2, cardiac type | HCM, DCM |
| TNNI3 | Troponin I3, cardiac type | HCM |
| TPM1 | Tropomyosin 1 | HCM |
| MYL2 | Myosin, light polypeptide 2 | HCM |
| MYL3 | Myosin, light polypeptide 3 | HCM |
| ACTC1 | Actin, alpha, cardiac muscle 1 | HCM |
| LMNA A/C | Lamin A/C | DCM |
| SCN5A | Voltage-gated sodium channel α-subunit | BrS, LQTS, DCM |
| KCNQ1 | Voltage-gated potassium channel α-subunit | LQTS |
| KCNH2 | Voltage-gated potassium channel α-subunit | LQTS |
| KNCE1 | Potassium voltage-gated channel subfamily E member 1 (β subunit) | LQTS |
| KCNE2 | Potassium voltage-gated channel subfamily E member 2 (β subunit) | LQTS |
| DSP | Desmoplakin | ARVC |
| PKP2 | Plakophilin 2 | ARVC |
| DSG2 | Desmoglein 2 | ARVC |
| DSC2 | Desmocollin 2 | ARVC |
| JUP | Junction plakoglobin | ARVC |
| RYR2 | Ryanodine receptor 2 | CPVT |
| Gene | Nucleotide Variation | cDNA Position § | Splice Site Finder (0–100) | Max Ent Scan (0–16) | NNSPLICE (0–1) | Gene Splicer (0–15) | Human Splicing Finder (0–100) | Alamut Predicted Change | |||||
|---|---|---|---|---|---|---|---|---|---|---|---|---|---|
| WT | MUT | WT | MUT | WT | MUT | WT | MUT | WT | MUT | ||||
| MYBPC3 | c.506-2A>C | c.506 * | 87.86 | ― | 12.9 | ― | 0.96 | ― | 10.25 | ― | 92.79 | ― | Acceptor splice site: −100% |
| c.513 ** | ― | 75.34 | ― | 4.64 | NE | NE | ― | 3.65 | 77.42 | 79.45 | |||
| MYBPC3 | c.906-7G>T | c.906 * | 73.61 | 78.66 | 3.82 | 4.44 | NE | NE | __ | 2.29 | 80.55 | 82.75 | Acceptor splice site: +223% |
| MYBPC3 | c.2308+3G>C | c.2308 * | 77.58 | 72.06 | 8.99 | 3.77 | 0.87 | ― | 12.67 | 8.52 | 85.13 | 78.32 | Donor splice site: −52% |
| ACTC1 | c.617-7T>C | c.617 * | 84.72 | 83.21 | 6.55 | 6.71 | 0.92 | 0.83 | 8.24 | 8.54 | 83.31 | 83.73 | Acceptor splice site: −2% |
| SCN5A | c.393-5C>A | c.393-3 | ― | 70.16 | ― | 0.85 | NE | NE | NE | NE | ― | 77.83 | Acceptor splice site: 0% |
© 2016 by the authors; licensee MDPI, Basel, Switzerland. This article is an open access article distributed under the terms and conditions of the Creative Commons Attribution (CC-BY) license (http://creativecommons.org/licenses/by/4.0/).
Share and Cite
Frisso, G.; Detta, N.; Coppola, P.; Mazzaccara, C.; Pricolo, M.R.; D’Onofrio, A.; Limongelli, G.; Calabrò, R.; Salvatore, F. Functional Studies and In Silico Analyses to Evaluate Non-Coding Variants in Inherited Cardiomyopathies. Int. J. Mol. Sci. 2016, 17, 1883. https://doi.org/10.3390/ijms17111883
Frisso G, Detta N, Coppola P, Mazzaccara C, Pricolo MR, D’Onofrio A, Limongelli G, Calabrò R, Salvatore F. Functional Studies and In Silico Analyses to Evaluate Non-Coding Variants in Inherited Cardiomyopathies. International Journal of Molecular Sciences. 2016; 17(11):1883. https://doi.org/10.3390/ijms17111883
Chicago/Turabian StyleFrisso, Giulia, Nicola Detta, Pamela Coppola, Cristina Mazzaccara, Maria Rosaria Pricolo, Antonio D’Onofrio, Giuseppe Limongelli, Raffaele Calabrò, and Francesco Salvatore. 2016. "Functional Studies and In Silico Analyses to Evaluate Non-Coding Variants in Inherited Cardiomyopathies" International Journal of Molecular Sciences 17, no. 11: 1883. https://doi.org/10.3390/ijms17111883