Article

Specific Effects of Chronic Dietary Exposure to Chlorpyrifos on Brain Gene Expression—A Mouse Study

by
Maria Michela Pallotta
1,†,
Raffaele Ronca
1,†,
Rosa Carotenuto
1,
Immacolata Porreca
2,
Mimmo Turano
1,
Concetta Ambrosino
2,3 and
Teresa Capriglione
1,*
1
Dipartimento di Biologia, Università di Napoli Federico II, Via Cinthia 21, 80126 Napoli, Italy
2
IRGS, Biogem, Via Camporeale, Ariano Irpino, 83031 Avellino, Italy
3
Dipartimento di Scienze e Tecnologie, Università del Sannio, Via Port’Arsa 11, 82100 Benevento, Italy
*
Author to whom correspondence should be addressed.
These authors contributed equally to this work.
Int. J. Mol. Sci. 2017, 18(11), 2467; https://doi.org/10.3390/ijms18112467
Submission received: 14 September 2017 / Revised: 4 November 2017 / Accepted: 7 November 2017 / Published: 20 November 2017
(This article belongs to the Section Molecular Toxicology)

Abstract

:
Chlorpyrifos (CPF) is an organophosphate insecticide used to control pests on a variety of food and feed crops. In mammals, maternal exposure to CPF has been reported to induce cerebral cortex thinning, alteration of long-term brain cognitive function, and Parkinson-like symptoms, but the mechanisms of these processes are not fully understood. In this study, we aimed to gain a deeper understanding of the alterations induced in the brains of mice chronically exposed to CPF by dietary intake. For our purpose, we analysed F1 offspring (sacrificed at 3 and 8 months) of Mus musculus, treated in utero and postnatally with 3 different doses of CPF (0.1-1-10 mg/kg/day). Using RT2 Profiler PCR Arrays, we evaluated the alterations in the expression of 84 genes associated with neurodegenerative diseases. In the brains of exposed mice, we evidenced a clear dose–response relationship for AChE inhibition and alterations of gene expression. Some of the genes that were steadily down-regulated, such as Pink1, Park 2, Sv2b, Gabbr2, Sept5 and Atxn2, were directly related to Parkinson’s onset. Our experimental results shed light on the possibility that long-term CPF exposure may exert membrane signalling alterations which make brain cells more susceptible to develop neurodegenerative diseases.

Graphical Abstract

1. Introduction

Developmental exposure to OP (organophosphate) insecticides has been suggested to have long-lasting negative impacts, including decreased motor skills and cognitive abilities, increased signs of attention deficit/hyperactivity disorder (ADHD), and also altered brain morphology [1,2,3,4,5].
Despite the restrictions on their use, human exposure to OPs pesticides through food or the use of products containing chemicals is frequent. This is particularly harmful to children, who eat and breathe more in relation to their body weight. Consequently, the same exposure results in higher concentrations of pesticides in their bodies than in the adults [6].
A report published in January 2015 by the Swedish Environmental Research Institute [7] clearly showed that some pesticides are commonly absorbed into the body through food, such as the widely used OP insecticide chlorpyrifos, the levels of which were measured by the concentration of its metabolite TCP (3,5,6-trichloro pyridine-2-phenol).
Chlorpyrifos (CPF) is, among the organophosphorus insecticides, one of the most commonly employed in the cultivation of fruit and vegetables. In a study of pesticide residues in urine samples from 128 women conducted in Skåne, Sweden in 2010, TCP was found in all samples and in higher concentrations in vegetarians than in non-vegetarians [7].
Although a number of studies carried out both in vivo and in vitro have ratified the neurotoxic effects of CPF—even at low concentrations—and have suggested its association with the neurodegenerative diseases, the compound is still used, because it controls a broad spectrum of insects in both the agricultural and human settings [8,9,10]. In June 2000, the EPA banned almost all household uses of CPF, and in 2006 it limited the variety of crops on which it can be applied, with the final aim being to revoke all chlorpyrifos permissions on 30 October 2015, but the final decision was postponed to 31 March 2017.
The main mechanism of CPF action is similar to that of the other organophosphates: inhibition of acetylcholinesterase (AChE), which results in accumulation of the acetylcholine and subsequent hyperactivity in the cholinergic system. However, multiple developmental studies on animal models have reported that chronic CPF exposure can alter brain development and neuronal morphogenesis even in the absence of significant AChE inhibition [11,12,13,14,15,16,17]. Research data on the CPF neurotoxic effects in young animals are of particular interest, because the pesticide seems to elicit alterations in the levels of genes promoting neural differentiation. Betancourt et al. [18], found that the expression of two factors critical to brain development, NGF (Neural growth factor), and RLN (Reelin), was significantly reduced in the brains of neonatal rats that are exposed to both low and high CPF concentrations. NGF and Reelin protein are known to be important for the establishment of normal neuronal processes and synaptic plasticity. Furthermore, Reelin triggers nerve cells to migrate to their proper locations.
A comparative histological study of the brain has highlighted the effects of CPF on the cleavage plane orientation of neural progenitors in the cerebral cortex; exposure to the pesticide causes unnatural horizontal mitotic figures, associated with cell shrinkage and apoptosis [19]. Moreover, a growing number of the studies have associated increased Parkinson’s disease (PD) risk with insecticide exposure, especially chlorpyrifos [20].
Recently, several genes associated with familial PD have been shown to be sensitive targets of environmental factors, and both genetic and environmental factors are believed to contribute to the development of sporadic PD [21]. Notably, chlorpyrifos is among the pesticides associated with greater SNCA (α-Synuclein) expression, a protein critically involved in Parkinson’s, in cell line models of dopaminergic neurons [13,21,22]. In addition, a significant reduction of the dopaminergic neurons at 16d and 46d were evidenced in the CPF-postnatally treated rats, suggesting that the exposure of CPF may induce dopaminergic neuronal injury [23].
The present study aimed to evaluate the effects of a chronical exposure to the environmental detected concentrations of CPF in mice exposed in utero and postnatally to the pesticide. The pregnant females were fed for all the pregnancy and the nursing period [24] with three different concentrations of CPF (0.1 mg/kg/day, 1 mg/kg/day, 10 mg/kg/day), that are commonly found in fruits and vegetables. Afterwards, weaned mice were fed in the same manner until the time of sacrifice. Mice of the exposed and control groups were sacrificed at 3 and 8 months, corresponding respectively to the young-adult and adult. Analysis was performed to evaluate the alterations in the expression level of genes known to be involved in neurodegeneration.

2. Results

No significant brain ChE inhibition was seen following 0.1–1 mg/kg CPF exposure in any of the mice analyzed at 3 and 8 months, whereas a reduction in brain cholinesterase activity was reported only at the highest dosage (10 mg/kg CPF) at both stages (80–30% inhibition, respectively) (Figure 1).

2.1. PCR Array and Data Validation by qRT-PCR

Using 84 gene plates, we assayed the expression of genes directly or potentially involved in Parkinson’s as well as in other neurodegenerative diseases. The threshold of gene expression to select genes altered by CPF exposure was 2.0-fold. We selected and analyzed all the genes that exceeded the threshold value.
At three months, qRT-PCR-array analysis did not show any significant gene alteration at 0.1 mg/kg/day, a slight gene down-regulation was present at 1 mg/kg/day, while a general down-regulation of the transcript levels was present for most of the genes at 10 mg/kg/day (Figure 2A–C).
The greatest number of deregulated genes were associated with the highest dosage (10 mg/kg CPF). Based on the cut-off criteria of (2−ΔCt) > 2, p-value < 0.05 we screened 48 differently expressed transcripts (DETs), as reported in Table 1.
The majority of the down-regulated transcripts belonged to proteins involved in synaptic transmission and plasticity, gabaergic and dopaminergic signaling.
The only exception to the decreasing trend was represented by the Ubiquitin C (UBC) gene, whose level of transcripts, albeit within the threshold values, increased gradually (from 0.35 to 0.50) with increasing CPF concentration, as shown by the three graphs reporting the values at the three concentrations (Figure 2A–C).

2.1.1. qRT-PCR Validation at Three Months

A subset consisting of six genes (Park2, Pink1, SV2B, SEPT5, GABBR2 and UBC), deregulated at 10 mg/kg/day and involved in different networks, was sampled for verification using real-time PCR. Results from RT-PCR generally agreed with the microarray analysis, although the absolute degree of change could differ between the methods.
UBC confirmed the increasing level of the transcript, +0.30, at the higher concentration when compared to the control group. The expression of Pink1, Sept5, Park2, Gabbr2 and Sv2b was instead down-regulated, ranging from −0.5 to −0.3 (Figure 3A).
The Venn diagram (Figure 4A) shows overlap of gene expression changes with the three CPF dosing conditions in three-month-old mice. Only genes whose range of variation from the control was <0.5 or >0.5, and whose p-values < 0.05, were chosen for the analysis.
As shown in Figure 4A, there was relatively little overlap among deregulated genes across all three dosages. Only four genes were deregulated at all three concentrations. Two of these down-regulated genes are attributed to dopaminergic signaling, Park2 and Nr4a2, one to GABAergic signaling, Gabbr2, and the last one, Sv2b, is involved in transmembrane transport activity (Table 2).

2.1.2. PCR Array and qRT-PCR Validation at Eight Months

The landscape of gene alterations after the CPF exposure appeared quite different in the 8-month-old mice. Again, no genes beyond the threshold values were reported at the lowest CP concentrations, 0.1 × 101 mg/kg/day; while at 10 mg/kg/day, there was a general recovery of the values of gene transcripts reported as deregulated at 3 months. Nevertheless, Park2, Ataxin 2, DRD2 and UBC values were still altered (Figure 2A’–C’).
Applying the same criteria used for analyzing the three-month-old mice, we reported only 14 differently expressed transcripts (DETs) (Table 3).
In particular, at 8 months, down-regulated transcripts were significantly enriched for proteins involved in dopaminergic signaling, whereas the transcripts of genes involved in ubiquitination, parkin complex and cell signaling were reported as up-regulated.
A subset of five genes (Park2, Atxn2, Rgs4, Chgb and UBC), deregulated at 10 mg/kg/day, involved in the different networks was sampled for verification using real-time PCR. Results from RT-PCR (Figure 3B) confirmed microarray analysis.
qRT-PCR validated the results reporting a decrease for Park2 (−0.30) and Atxn2 (−0.10), and increases of +0.66 for Rgs4, +1.64 for Chgb, and +1.96 for Ubc, which reports a further increase of the transcript level (from +1.30 at 3 months, to +1.96 at 8 months) (Figure 3B).
Also at 8 months, Venn diagram analysis was performed on the genes, whose range of variation compared to the control group was >0.5 and <0.5, p-value < 0.05 (Figure 4B). In this range of values, only two genes were commonly deregulated at the three concentrations, both showing increasing levels of transcripts: Ubc and Casp9 (Table 4).

3. Discussion

In this study, an analysis was made of the putative changes in the expression of PD-related genes in the brains of 3- and 8-month-old mouse groups exposed chronically, in utero and postnatally, to three different CPF concentrations (0.1, 1, 10 mg/kg/day). The results showed direct evidence that long-lasting exposure to CPF targets the expression of the several genes known to be related to the emergence of PD and other neurodegenerative disorders in humans [13].
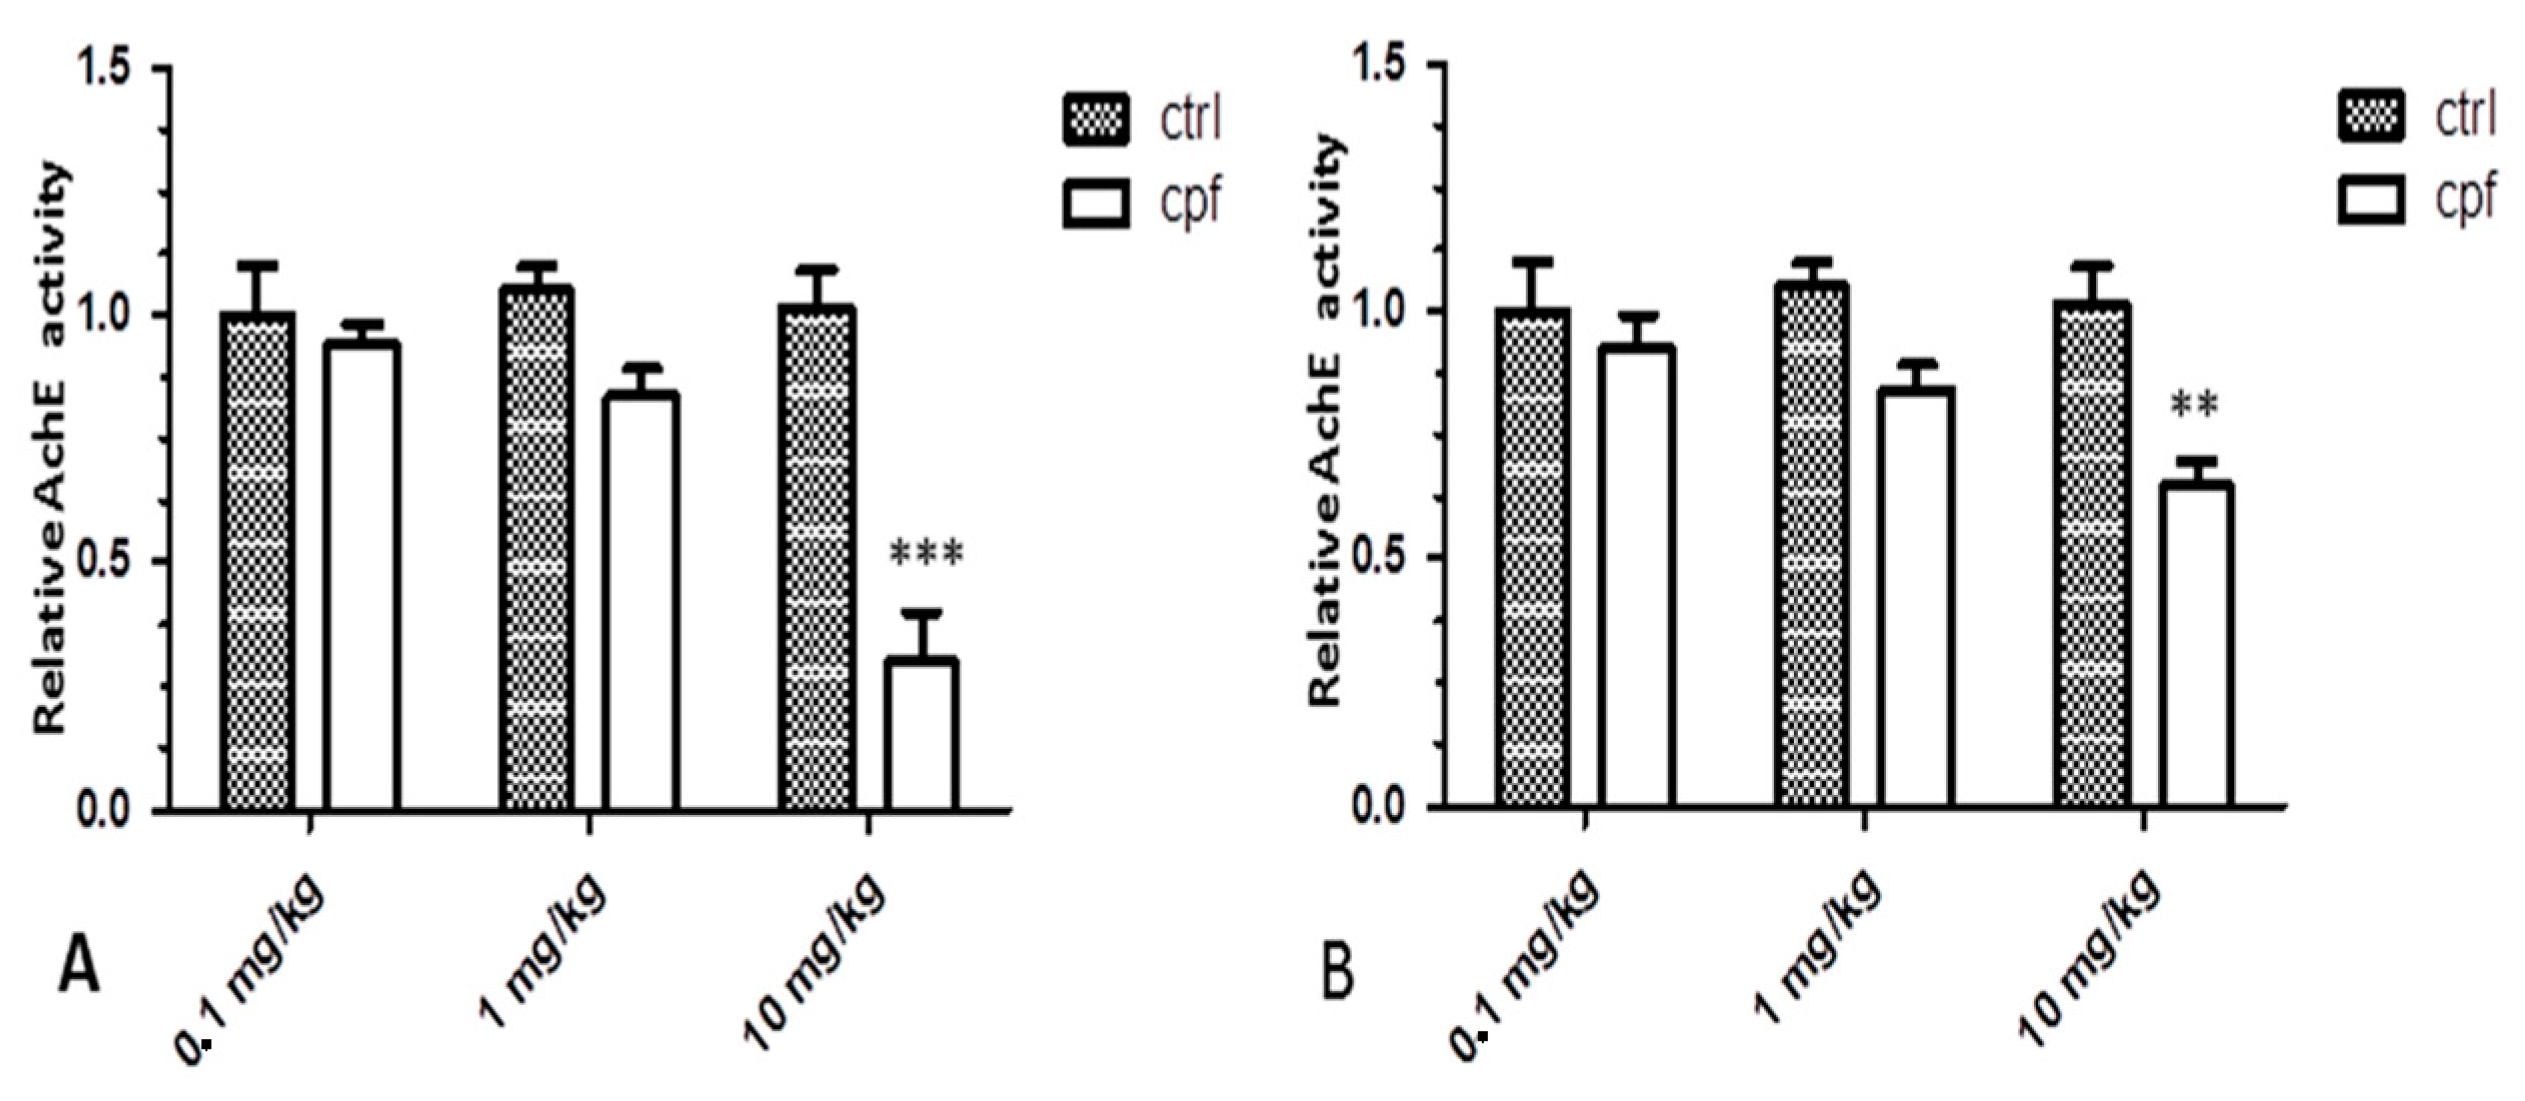
Initially, we evidenced a clear dose–response relationship in the brains of 3- and 8-month-old mice exposed to the pesticide both for AChE inhibition and for alterations of gene expression, although the panel of altered genes differed between the two age groups.
Overall, exposed chlorpyrifos produced a mixed pattern of up- and down-regulation, which is more evident in the groups treated with a higher CPF concentration (10 mg/kg/day).
However, while there was still a dose–response relationship, appreciable worsening was not detectable with increased exposure time; rather, the brains of the eldest mice showed a general recovery of gene functionality with ageing.
The total number of gene networks affected sharply reduced at 8 months, and AchE values shifted from highly inhibited—approximately 80% in 3-month-old mice—to 30% in the eldest mice.
Physiological cholinergic neuronal activity is important to correctly modulate the expression of genes involved in proliferation, differentiation and in the apoptotic events necessary to shape the embryo’s different brain regions. In addition, it is known that cholinergic circuit control is important for correct postnatal neurogenesis [25].
Altered production of AchE has been shown to affect the regulation of critical genes involved in neurogenesis, such as the NGF (Neurotrophin nerve growth factor) and several neuropeptides [18,26]. Furthermore, in adult rats, immunohistochemistry studies have demonstrated that Ach levels, reduced by exposure at 10 mg/kg/day subcutaneous injection of CPF for 21 days, resulted in the up-regulation of CRHBP (corticotropin releasing hormone binding protein), and NPY (neuropeptide Y) transcription in the CA1 (Cornu Ammonis) region of the hippocampus [26].
However, Zhang et al. [27], studying the effect of AchE alterations on Parkinson’s disease using acetylcholinesterase-deficient mice, found that these mice have reduced dopaminergic neuron loss and lower expression levels of apoptotic proteins. They conclude that a deficiency or inhibition of acetylcholinesterase can decrease apoptosis and protect dopaminergic neurons in the neurotoxin model of Parkinson’s [27].
In the 3-month-old mice, our data confirm this trend; in utero and postnatally, long-lasting CPF exposure dramatically alters ACh levels in the brains of mice, putatively interfering with the signaling of the genes enrolled in PD that we analyzed. The genes most affected are those regulating synaptic transmission and ubiquitination, therefore impairing GABA (Gamma-aminobutyric acid), and DOPA (Dopamine) neurotransmitter pathways.
In particular, the transcript levels of the GABBR2 receptor, one of the master genes in GABA signaling, are clearly reduced in the 10 mg/kg/day CPF-treated group. This is of importance because GABAB receptors play a crucial role in maintaining excitatory/inhibitory balance in the brain synapsis. Recently, in a paper of 2016, Błaszczyk formulated the “GABA collapse” hypothesis, in which the GABA decline is proposed to play a prominent role in the development and progression of PD and other neurodegenerative diseases [28,29,30,31].
As reported by several studies, individuals with autism can show reduced levels of GAB(B) receptors in the cingulate cortex and fusiform gyrus. GABBR2, in particular, was significantly reduced in the cerebellum of these patients [32].
Similarly, we could consider the reduction of several transcripts involved in synaptic functionality, such as Sv2b, Lrrk2, Sept5, Syngr3, Syt1, Nsf and Nsg1. These all play a role in synaptic transmission, modulating correct maintenance and release of neurotransmitter vesicles. Alteration of the endo- and exocytotic mechanism, and the impairment of intracellular trafficking, which are recurrent in both patients of Parkinson’s and experimental models of the disease [33]. This specificity may result from the particular anatomy of dopaminergic neurons (DA) neurons. DA cells have an enormous axonal field, with the number of synaptic terminals far exceeding the number of neurons [34], and loss of DA nerve terminals seems to precede DA cell body loss in PD [35]. Possibly, the morphology of these neurons makes them rely more on local SV cycling, and mechanisms that affect these processes make this system more vulnerable.
These putative changes in neurotransmitters may impact and impair the functionality of the three-month-old mice’s DA cells, in particular due to the peculiar morphology of these neurons, which have a number of synaptic terminals greatly exceeding the number of cells [34,35]. Four of the currently known genes involved in DOPA signaling, park2, pink1, DRD2 and slc6a3, whose monogenic mutations are found in early or juvenile onset PD patients [36]—were decreased in the 10 mg/kg/day group of 3-month-old mice, while synuclein levels were not altered, as happens in Parkinsonians. Some PD genes, such as Parkin and Pink1, share roles in mitochondrial functionality. Parkin and Pink1, together with Park7, regulate the autophagic degradation of damaged mitochondria. Inactivating mutations in these genes cause autosomal recessively inherited PD.
In the general landscape of down-regulation found at three months, the rising level of Ubc is even more interesting. Ubiquitin C (UbC) has been described as the most responsive gene to cellular stress, even though little is known about the molecular mechanisms modulating its expression [37]. The Ubc1 homologue was found to be highly induced in the brains of patients with Alzheimer’s disease, and was upregulated in neuronal cells after exposure to the amyloid-β peptide. Moreover, in a recent transcriptome analysis, upregulated levels of UBC transcripts were reported in the cerebrospinal fluid of PD patients and were considered, together with other deregulated transcripts, as potential PD diagnosis and treatment RNA biomarkers [38]. Here, we suggest that, in the 3- to 8-month-old mice, the impaired transcripts of these genes might temporarily mimic a condition of early-onset of Parkinson’s.
At eight months, the general putative recovery of the down-regulated transcripts correlates with the decrease of the brain cholinesterase inhibition (approximately 30%). We hypothesize that this might result from the better detoxifying capacity of the eldest mice, as reported by several studies. Individual differences in detoxification capacities for specific organophosphorus (OP) compounds have been reported to be largely due to either the differences in catalytic efficiency or the abundance of the high-density lipoprotein (HDL)-associated enzyme paraoxonase (PON1). Studies on rats of different ages highlighted increased PON1 activity in adults, which may justify the variation between 3- and 8-month-old mice [39,40]. Contrastingly, recent studies have shown that, after repeated CPF treatment, the mice seemed to develop some tolerance to CPF-induced effects, suggesting that the detoxifying mechanisms are possibly involved in the induction of tolerance. Compensatory mechanisms were not active in thyroids of mice treated with the same CPF concentrations [24].
Anyway, our data does not allow the exclusion of the hypothesis that other unknown esterases, besides acetylcholinesterase, might be potential targets of CPF, as has also been suggested previously [9,17]. Neverthless, the general improvement in the number of gene transcripts back within the threshold of variability in the 8-month-old mice does not apply to ATXN2 (a Park2 substrate) and DRD2, whose transcript levels instead remain low. We hypothesize that, although the apparent general recovery in the transcript numbers of the Parkinson’s genes studied, a certain cellular alteration is still conceivable.
In particular, low levels of DRD2 in the 8-month-old mice treated with 10 mg/kg/day, seem to confirm a standing altered functionality of the DOPA cells. In addition, putative problems in neuronal communication are confirmed by the increasing levels of the transcripts of CHGB and RGS4, two proteins that are implicated in the onset of several neurodegenerative disorders. RGS4 is a negative regulator of G protein signaling expressed in the nervous system [41]. Usually regulated by the dopaminergic agents, RGS4 is up-regulated in PD patients in whom the DOPA level decreases [41]. RGS4 up-regulation, together with a DRD2 reduction, in transcript numbers seems to be further evidence of DOPA-signaling alteration. Interestingly, recent studies have suggested direct RGS4 inhibition as a new target for Parkinson’s care [42,43].
Decreased levels of CHGB-derived peptides have been discovered in the cerebrospinal fluid of multiple sclerosis (MS) patients by Mo et al., who showed that, within a model of multiple sclerosis for mice, CGB levels were elevated in the neurons prior to the onset of MS symptoms. Additionally, they suggested that the initial elevation of CHGB, prior to symptom onset, is due to inflammatory processes. It is conceivable to hypothesize that long-lasting CPF exposure at 8 months gives rise to a similar state.
With the exception of Park2 (whose down-regulation level does not vary with ageing), the genes involved in the Ubiquitination Pathway, UBC and Ube2k, return to their physiological values (or become higher in a number of RNA transcripts) in the 8-month-old mice. Interestingly, UBC and Ube2k values almost progressively doubled compared to 3 months, mimicking what happens during PD progression [38].
Increased levels of Park7 and HSPA4, listed in the Parkin complex, may, instead, be explained as an adaptive response to the chronic stress induced by exposure to the pesticide. Both genes are considered neuroprotectors, and we hypothesize that, during aging, higher expression of Park7 and HSPA4 might have been required by neurons to stabilize Pink1 and protect cells from oxidative stress and apoptosis [44,45]. Moreover, the HSPA4 protein, a member of the HSP70 family, has a role in the degradation of misfolded proteins.
The findings at 8 months shed light on a possible mechanism by which CPF, at environmental doses, may exert a long-term cell signaling alteration that may induce neurodegenerative disorders with aging.
Data present in the literature suggest different reasons for the behavioral alterations after CPF exposure. Williams et al. (2014) [46] performed an analysis of rodent model studies involving CPF/CPO exposure and concluded that gestational and/or perinatal CPF exposure is not likely to be associated with the development of autism-like behaviors in humans. Contrastingly, spatial learning impairment was shown in prepubertal guinea pigs prenatally exposed to a single chlorpyrifos dose [47]. In this case, while acute AChE inhibition was not displayed, neurotoxic effects such as persistent aberrant behavior and cognitive function in adults, as well as altered levels of neuroproteins in the developing brain, were reported. Other studies have suggested different ways, including oxidative stress, by which CPF exposure could be linked to behavioral alterations [48,49].
Because the data are contrasting and examine only shorter exposure periods or different experimental design, further histological studies comparing protein expression levels in dopaminergic neurons, as well as behavioral observations would help to assess the role of CPF in neurodegenerative disease development and will be the focus of future studies.

4. Materials and Methods

4.1. Animals and Treatments

Animal experiments (Progetto MODO 6 February 2015) were performed in compliance with the European Council Directive 86/609/EEC and the Italian Legislation on Animal Experimentation (D.Lvo 116/92), and the procedures were approved (ID number 21-2009) by the Ethical Committee named CESA (Committee for the Ethics of the Experimentations on Animals) of the Biogem Institute of Genetics Research “Gaetano Salvatore” (IRGS). The project was communicated to the employee office of the Ministry of Health following the rules of the D.Lvo 116/92.
Mice were kept under standard facility conditions (22 ± 2 °C, 55 + 10% humidity, 12:12 h light-dark cycle) in a specific pathogen-free facility. Animals kept under standard facility conditions received water and standard diet (4RF21 form Mucedola, Settimo Milanese, Italy) ad libitum. The mice were fed for the entire duration of the pregnancy and lactation with a contaminate feed to which was added clorpyrifos at different concentrations, 44, 4.4 and 0.44 mg/kg (Mucedola) to allow dosages of 10 mg/kg/day, 1 mg/kg/day, 0.1 mg/kg/day respectively. A group of mice without treatment was used as control. CD1 dams (outbred strain, 8 mice/treatment group) were exposed, 7 days before the mating, to pesticides dosed at 10 mg/kg/day, 1 mg/kg/day, 0.1 mg/kg/day, and the combinations of higher and lower doses, administrating CPF by food at 44, 4.4 and 0.44 mg/kg (Mucedola) until weaning. Therefore, the offspring were exposed through the mothers from gestational day 0 (GD0) until weaning. Then, at weaning, the offspring were divided into groups of 10 mice, and subjected to the same diet as their parents until the time of sacrifice. Animals were sacrificed by carbon dioxide inhalation at 3 and 8 months in order to observe the effects over the time of the administration of the pesticide. The brains were rapidly collected, and transferred into RNAlater® Solution (Invitrogen, Carlsbad, CA, USA) for molecular analysis.

4.2. Protein Extraction and AchE Assay

After removal, three brains of each group were homogenized with 600 μL of lysis buffer containing PBS, 0.5% NP-40 and protease inhibitors, 1 mM PMSF (Roche, Basilea, Switzerland). Thirty micrograms of proteins were used for assessing AchE activity. 4 μL of DTNB (5,5′-dithiobis-(2-nitrobenzoic acid), dissolved in 10 mM absolute ethanol, brought to the final volume of 200 μL with 0.2 M phosphate buffer pH 7.4, were added to each sample.
Optical densities were measured at a wavelength of 412 nm. The enzymatic reaction was quantified against a blank without substrate. The AChE assay had three replicates for each sample. Activity data were analyzed using the one-way analysis of variance followed by the Tukey-Kramer test and expressed as mean ± standard error. The differences between the treatments and controls were tested (p < 0.05).

4.3. RNA Isolation and cDNA

Total RNA was extracted from the brains of three mice of each experimental group, according to the TRI-Reagent protocol (Sigma Aldrich, Saint Louis, MO, USA). RNA quality was assessed using the 2100 Bioanalizer (Agilent Technologies, Palo Alto, CA, USA). First-strand cDNA, used for all amplification reactions, was synthesized from 2 μg of pooled RNAs from three brains of each group of mice using the RT2 First Strand Kit (QIAGEN, Hilden, Germany) following the manufacturer’s instructions.

4.4. Quantification Assay (PCR-Array)

qPCR was performed using ready-to-use mouse Parkinson’s disease RT2 Profiler PCR Array (QIAGEN, Hilden, Germany) containing primers for 84 tested (Table S1) and 5 housekeeping genes, and controls for RT and PCR reactions. The whole volume of cDNA synthesized was used for the preparation of reaction mixture. To each 96-well plate, 25 μL reaction mixture based on RT2 SYBR Green qPCR Mastermix (QIAGEN, Hilden, Germany), was added. Thermal cycling was performed as recommended by plate manufacturers for IQ5 (10 min initial denaturation at 95 °C followed by 40 cycles: 15 s in 95 °C, with 1 min amplification in 60 °C). All plates had positive PCR controls and reverse transcription controls. The calculations of contamination with mouse genomic DNA were performed according to the manufacturer’s instructions, and showed the presence of genomic DNA in an acceptable range, not influencing the experiment performance. Values of cycle threshold (Ct) obtained in quantification were used for the calculations of fold changes in mRNA abundance accordingly to 2−ΔΔCt method. β2 microglobulin was chosen from the group of five housekeeping genes as the best. Changes in the mRNA level of the evaluated genes were assessed in all groups in relation to the control group of animals with mRNA abundance set up arbitrarily as 1.

4.5. Data Analysis

Data were expressed as fold change. Fold change (2−ΔΔCt method) is the normalized gene expression (2−ΔCt) in the test sample divided by the normalized gene expression (2−ΔCt) in the control sample. The differences between the experimental groups and the control group were analyzed by Student’s t-test and used for comparisons with RT2 Profiler PCR Array data analysis software version 3.5 (SABiosciences, Frederick, MD, USA). p < 0.05 was considered to be statistically significant.

4.6. Validation by qRT-PCR

The first-strand cDNA, used for all quantitative validation reactions, was synthesized from 2 μg of the pooled RNAs previously used for PCR-array, using SuperScript III Reverse Transcriptase (Invitrogen, Carlsbad, CA, USA) and used for the validation.
Primers used for qRT_PCR validation were designed using software Primer 3Plus (http://www.bioinformatics.nl/cgi-bin/primer3plus/primer3plus.cgi/) on sequences found in Genbank (Table 5).
Real-time PCR was performed using Power SYBER Green Master Mix Kits (Invitrogen) using the 96-well optical reaction plate in 20 µL total reaction volume.
For transcript relative quantification, samples were normalized to β2 microglobulin as a housekeeping control to account for possible differences in the quantity and quality of the cDNA used in the experiments. PCR was carried out with the following thermal profile: stage 1—95 °C for 3 min; Stage 2—40 cycles of 95 °C for 15 s and 60 °C for 45 s; Stage 3—95 °C for 15 s, 60 °C for 1 min and 95 °C for 15 s; Stage 4—dissociation curve with 95 °C for 15 s, 60 °C for 1 min and 95 °C for 15 s. A separate dissociation curve assay was performed for each reaction to confirm gene-specific amplification. Reactions were conducted on an Applied Biosystem 7500 (Frederick) Real-Time PCR System. Statistical significance was determined using a t-test analysis with the Holm-Sidak correction for the multiple comparison methods using a GraphPad Prism 6 software (Hilden, Germany).

5. Conclusions

Our findings suggest that dopaminergic neurotransmission and mitochondrial integrity are the main targets of CPF and both can be considered as sensitive biomarkers of exposure, contributing to the overall spectrum of neurotoxicity.

Supplementary Materials

Supplementary materials can be found at www.mdpi.com/1422-0067/18/11/2467/s1.

Acknowledgments

The Italian Workers’ Compensation Authority (grant. no. 12010). The progetto MODO (Model organism) Programma Operativo Regionale (POR) Campania Fondo Sociale Europeo (FSE) 2007/2013 CUP B25B09000030007 provided a research fellowship for Raffaele Ronca.

Author Contributions

Teresa Capriglione and Concetta Ambrosino conceived and designed the experiments; Maria Michela Pallotta and Raffaele Ronca performed the experiments; Maria Michela Pallotta, Raffaele Ronca and Mimmo Turano analyzed the data; Rosa Carotenuto and Immacolata Porreca contributed reagents/materials/analysis tools; Teresa Capriglione wrote the paper.

Conflicts of Interest

The authors declare no conflict of interest.

Abbreviations

CPFChlorpyrifos
DETsDifferently expressed transcripts
PON1Paraoxonase

References

  1. Marks, A.R.; Harley, K.; Bradman, A.; Kogut, K.; Barr, D.B.; Johnson, C.; Calderon, N.; Eskenazi, B. Organophosphate pesticide exposure and attention in young Mexican-American children: The CHAMACOS study. Environ. Health Perspect. 2010, 118, 1768–1774. [Google Scholar] [CrossRef] [PubMed]
  2. Engel, S.M.; Wetmur, J.; Chen, J.; Zhu, C.; Barr, D.B.; Canfield, R.L.; Wolff, M.S. Prenatal exposure to organophosphates, paraoxonase 1, and cognitive development in childhood. Environ. Health Perspect. 2011, 119, 1182–1188. [Google Scholar] [CrossRef] [PubMed]
  3. Bouchard, M.F.; Chevrier, J.; Harley, K.G.; Kogut, K.; Vedar, M.; Calderon, N. Prenatal exposure to organophosphate pesticides and IQ in 7-Year-Old children. Environ. Health Perspect. 2011, 119, 1189–1195. [Google Scholar] [CrossRef] [PubMed]
  4. Rauh, V.A.; Garfinkel, R.; Perera, F.P.; Andrews, H.F.; Hoepner, L.; Barr, D.B. Impact of prenatal chlorpyrifos exposure on neurodevelopment in the first 3 years of life among inner-city children. Pediatrics 2006, 118, e1845–e1859. [Google Scholar] [CrossRef] [PubMed]
  5. Rauh, V.; Arunajadai, S.; Horton, M.; Perera, F.; Hoepner, L.; Barr, D.B.; Whyatt, R. Seven-Year neurodevelopmental scores and prenatal exposure to chlorpyrifos, a common agricultural pesticide. Environ. Health Perspect. 2011, 119, 1196–1201. [Google Scholar] [CrossRef] [PubMed]
  6. Rauh, V.A.; Perera, F.P.; Horton, M.K.; Whyatt, R.M.; Bansal, R.; Hao, X. Brain anomalies in children exposed prenatally to a common organophosphate pesticide. Proc. Natl. Acad. Sci. USA 2012, 109, 7871–7876. [Google Scholar] [CrossRef] [PubMed]
  7. Magnér, J.; Wallberg, P.; Sandberg, J.; Cousins, A.P. Human Exposure to Pesticides. A Pilot Study; Report No. U5080; Swedish Environmental Stockholm Institute: Stockholm, Sweden, 2015; pp. 1–29. [Google Scholar]
  8. Ray, A.; Liu, J.; Ayoubi, P.; Pope, C. Dose-related gene expression changes in forebrain following acute, low-level chlorpyrifos exposure in neonatal rats. Toxicol. Appl. Pharmacol. 2010, 248, 144–155. [Google Scholar] [CrossRef] [PubMed]
  9. Estevan, C.; Vilanova, E.; Sogorb, M.A. Chlorpyrifos and its metabolites alter gene expression at non-cytotoxic concentrations in D3 mouse embryonic stem cells under in vitro differentiation: Considerations for embryotoxic risk assessment. Toxicol. Lett. 2013, 217, 14–22. [Google Scholar] [CrossRef] [PubMed]
  10. Sogorb, M.A.; Fuster, E.; Del Río, E.; Estévez, J.; Vilanova, E. Effects of mipafox, paraoxon, chlorpyrifos and its metabolite chlorpyrifos-oxon on the expression of biomarker genes of differentiation in D3 mouse embryonic stem cells. Chem. Biol. Interact. 2016, 259, 368–373. [Google Scholar] [CrossRef] [PubMed]
  11. Campbell, C.G.; Seidler, F.J.; Slotkin, T.A. Chlorpyrifos interfere with cell development in rat brain regions. Brain Res. 1997, 43, 179–189. [Google Scholar] [CrossRef]
  12. Das, K.P.; Barone, S., Jr. Neuronal differentiation in PC12 cells is inhibited by chlorpyrifos and its metabolites: Is acetylcholinesterase inhibition the site of action? Toxicol. Appl. Pharmacol. 1999, 160, 217–230. [Google Scholar] [CrossRef] [PubMed]
  13. Slotkin, T.A.; Seidler, F.J. Developmental exposure to organophosphates triggers transcriptional changes in genes associated with Parkinson’s disease in vitro and in vivo. Brain Res. Bull. 2011, 86, 340–347. [Google Scholar] [CrossRef] [PubMed]
  14. Slotkin, T.A.; Card, J.; Seidler, F.J. Chlorpyrifos developmental neurotoxicity: Interaction with glucocorticoids in PC12 cells. Neurotoxicol. Teratol. 2012, 34, 505–512. [Google Scholar] [CrossRef] [PubMed]
  15. Timofeeva, O.A.; Sanders, D.; Seemann, K.; Yang, L.; Hermanson, D.; Regenbogen, S. Persistent behavioral alterations in rats neonatally exposed to low doses of the organophosphate pesticide, parathion. Brain Res. Bull. 2008, 77, 404–411. [Google Scholar] [CrossRef] [PubMed]
  16. Tussellino, M.; Ronca, R.; Carotenuto, R.; Pallotta, M.M.; Furia, M.; Capriglione, T. Chlorpyrifos exposure affects fgf8, sox9, and bmp4 expression required for cranial neural crest morphogenesis and chondrogenesis in Xenopus laevis embryos. Environ. Mol. Mutagen. 2016, 57, 630–640. [Google Scholar] [CrossRef] [PubMed]
  17. Viñuela, A.; Snoek, L.B.; Riksen, J.A.G.; Kammenga, J.E. Genome-Wide Gene Expression Analysis in Response to Organophosphorus Pesticide chlorpyrifos and Diazinon in C. elegans. PLoS ONE 2010, 5, e12145. [Google Scholar] [CrossRef] [PubMed]
  18. Betancourt, A.M.; Filipov, N.M.; Carr, R.L. Alteration of neurotrophins in the hippocampus and cerebral cortex of young rats exposed to chlorpyrifos and methyl parathion. Toxicol. Sci. 2007, 100, 445–455. [Google Scholar] [CrossRef] [PubMed]
  19. Chen, X.P.; Chen, W.F.; Wang, D.W. Prenatal organophosphates exposure alternates the cleavage plane orientation of apical neural progenitor in developing neocortex. PLoS ONE 2014, 9, e95343. [Google Scholar] [CrossRef] [PubMed]
  20. Freire, C.; Koifman, S. Pesticide exposure and Parkinson’s disease: Epidemiological evidence of association. Neurotoxicology 2012, 33, 947–971. [Google Scholar] [CrossRef] [PubMed]
  21. Wirdefeldt, K.; Adami, H.O.; Cole, P.; Trichopoulos, D.; Mandel, J. Epidemiology and etiology of Parkinson’s disease: A review of the evidence. Eur. J. Epidemiol. 2011, 26, S1–S58. [Google Scholar] [PubMed]
  22. Chorfa, A.; Bétemps, D.; Morignat, E.; Lazizzera, C.; Hogeveen, K.; Andrieu, T.; Baron, T. Specific pesticide-dependent increases in α-synuclein levels in human neuroblastoma (SH-SY5Y) and melanoma (SK-MEL-2) cell lines. Toxicol. Sci. 2013, 133, 289–297. [Google Scholar] [CrossRef] [PubMed]
  23. Zhang, J.; Dai, H.; Deng, Y.; Tian, J.; Zhang, C.; Hu, Z.; Bing, G.; Zhao, L. Neonatal chlorpyrifos exposure induces loss of dopaminergic neurons in young adult rats. Toxicology 2015, 336, 17–25. [Google Scholar] [CrossRef] [PubMed]
  24. Porreca, I.; D’Angelo, F.; De Franceschi, L.; Mattè, A.; Ceccarelli, M.; Iolascon, A. Pesticide toxicogenomics across scales: In vitro transcriptome predicts mechanisms and outcomes of exposure in vivo. Sci. Rep. 2016, 6, 38131. [Google Scholar] [CrossRef] [PubMed]
  25. Asrican, B.; Paez-Gonzalez, P.; Erb, J.; Kuo, C.T. Cholinergic circuit control of postnatal neurogenesis. Neurogenes Austin 2016, 3, e1127310. [Google Scholar] [CrossRef] [PubMed]
  26. Lee, J.H.; Sung, Y.B.; Jang, S.H. Nerve growth factor expression in stroke induced rats after shock wave. J. Phys. Ther. Sci. 2016, 28, 3451–3453. [Google Scholar] [CrossRef] [PubMed]
  27. Lee, Y.S.; Lewis, J.A.; Ippolito, D.L.; Hussainzada, N.; Lein, P.J.; Jackson, D.A.; Stallings, J.D. Repeated exposure to neurotoxic levels of chlorpyrifos alters hippocampal expression of neurotrophins and neuropeptides. Toxicology 2016, 340, 53–62. [Google Scholar] [CrossRef] [PubMed]
  28. Zhang, X.; Lu, L.; Liu, S.; Ye, W.; Wu, J.; Zhang, X. Acetylcholinesterase deficiency decreases apoptosis in dopaminergic neurons in the neurotoxin model of Parkinson’s disease. Int. J. Biochem. Cell Biol. 2013, 45, 265–272. [Google Scholar] [CrossRef] [PubMed]
  29. Petroff, O.A. GABA and glutamate in the human brain. Neuroscientist 2002, 8, 562–573. [Google Scholar] [CrossRef] [PubMed]
  30. Surmeier, D.J.; Schumacker, P.T. Calcium, bioenergetics, and neuronal vulnerability in Parkinson’s disease. J. Biol. Chem. 2013, 288, 10736–10741. [Google Scholar] [CrossRef] [PubMed]
  31. Błaszczy, J.W. Parkinson’s disease and neurodegeneration: GABA-Collapse hypothesis. Front. Neurosci. 2016, 10, 269. [Google Scholar]
  32. Oblak, A.L.; Gibbs, T.T.; Blatt, G.J. Decreased GABA (B) receptors in the cingulate cortex and fusiform gyrus in autism. J. Neurochem. 2010, 114, 1414–1423. [Google Scholar] [PubMed]
  33. Miller, R.M.; Kiser, G.L.; Kaysser-Kranich, T.M.; Lockner, R.J.; Palaniappan, C.; Federoff, H.J. Robust dysregulation of gene expression in substantia nigra and striatum in Parkinson’s disease. Neurobiol. Dis. 2006, 21, 305–313. [Google Scholar] [CrossRef] [PubMed]
  34. Oorschot, D.E. Total number of neurons in the neostriatal, pallidal, subthalamic, and substantia nigral nuclei of the rat basal ganglia: A stereological study using the cavalieri and optical disector methods. J. Comp. Neurol. 1996, 366, 580–599. [Google Scholar] [CrossRef]
  35. Fahn, S. Description of Parkinson’s disease as a clinical syndrome. Ann. N. Y. Acad. Sci. 2003, 991, 1–14. [Google Scholar] [CrossRef] [PubMed]
  36. Bonifati, V. Genetics of Parkinson’s disease—State of the art, 2013. Parkinsonism Relat. Disord. 2014, 20 (Suppl. 1), S23–S28. [Google Scholar] [CrossRef]
  37. Bianchi, M.; Giacomini, E.; Crinelli, R.; Radici, L.; Carloni, E.; Magnani, M. Dynamic transcription of ubiquitin genes under basal and stressful conditions and new insights into the multiple UBC transcript variants. Gene 2015, 573, 100–109. [Google Scholar] [CrossRef] [PubMed]
  38. Hossein-Nezhad, A.; Fatemi, R.P.; Ahmad, R.; Peskind, E.R.; Zabetian, C.P.H.; Shi, M.; Wahlestedt, C.; Zhang, J.; Faghihi, M.A. Transcriptomic Profiling of Extracellular RNAs Present in Cerebrospinal Fluid Identifies Differentially Expressed Transcripts in Parkinson’s Disease. J. Parkinsons Dis. 2016, 6, 109–117. [Google Scholar] [CrossRef] [PubMed]
  39. Furlong, C.E.; Cole, T.B.; Jarvik, G.P.; Pettan-Brewer, C.; Geiss, G.K.; Richter, R.J.; Shih, D.M.; Tward, A.D.; Lusis, A.J.; Costa, L.G. Role of paraoxonase (PON1) status in pesticide sensitivity: Genetic and temporal determinants. Neurotoxicology 2005, 26, 651–659. [Google Scholar] [CrossRef] [PubMed]
  40. Moser, V.C.; Padilla, S. Age- and gender-related differences in the time course of behavioral and biochemical effects produced by oral chlorpyrifos in rats. Toxicol. Appl. Pharmacol. 1998, 149, 107–119. [Google Scholar] [CrossRef] [PubMed]
  41. Gold, S.J.; Ni, Y.G.; Dohlman, H.G.; Nestler, E.J. Regulators of G-protein signaling (RGS) proteins: Region-specific expression of nine subtypes in rat brain. J. Neurosci. 1997, 17, 8024–8037. [Google Scholar] [PubMed]
  42. Grillet, N.; Pattyn, A.; Contet, C.; Kieffer, B.L.; Goridis, C.; Brunet, J.F. Generation and characterization of Rgs4 mutant mice. Mol. Cell. Biol. 2005, 25, 4221–4228. [Google Scholar] [CrossRef] [PubMed]
  43. Lerner, T.N.; Kreitzer, A.C. RGS4 is required for dopaminergic control of striatal LTD and susceptibility to parkinsonian motor deficits. Neuron 2012, 73, 347–359. [Google Scholar] [CrossRef] [PubMed]
  44. Jaramillo-Gómez, J.; Niño, A.; Arboleda, H.; Arboleda, G. Overexpression of DJ-1 protects against C2-ceramide-induced neuronal death through activation of the PI3K/AKT pathway and inhibition of autophagy. Neurosci. Lett. 2015, 603, 71–76. [Google Scholar] [CrossRef] [PubMed]
  45. Hauser, D.N.; Primiani, C.T.; Cookson, M.R. The effects of variants in the PARK2 (parkin), PINK1, and PARK7 (DJ-1) genes along with evidence for their pathogenicity. Curr. Protein Pept. Sci. 2017, 18, 702–714. [Google Scholar] [CrossRef] [PubMed]
  46. Williams, A.L.; De Sesso, J.M. Gestational/perinatal chlorpyrifos exposure is not associated with autistic-like behaviors in rodents. Crit. Rev. Toxicol. 2014, 44, 523–534. [Google Scholar] [CrossRef] [PubMed]
  47. Mamczarz, J.; Pescrille, J.D.; Gavrushenko, L.; Burke, R.D.; Fawcett, W.P.; DeTolla, L.J., Jr.; Chen, H.; Pereira, E.F.R.; Albuquerque, E.X. Spatial learning impairment in prepubertal guinea pigs prenatally exposed to the organophosphorus pesticide chlorpyrifos: Toxicological implications. Neurotoxicology 2016, 56, 17–28. [Google Scholar] [CrossRef] [PubMed]
  48. Lee, I.; Eriksson, P.; Fredriksson, A.; Buratovic, S.; Viberg, H. Developmental neurotoxic effects of two pesticides: Behavior and biomolecular studies on chlorpyrifos and carbaryl. Toxicol. Appl. Pharmacol. 2015, 288, 429–438. [Google Scholar] [CrossRef] [PubMed]
  49. De Felice, A.; Greco, A.; Calamandrei, G.; Minghetti, L. Prenatal exposure to the organophosphate insecticide chlorpyrifos enhances brain oxidative stress and prostaglandin E2 synthesis in a mouse model of idiopathic autism. J. Neuroinflamm. 2016, 13, 149. [Google Scholar] [CrossRef] [PubMed]
Figure 1. Differences of AchE activity in brains of mice treated with three CPF concentrations (0.1-1-10 mg/kg/day), sacrificed at 3 (A) and 8 (B) months. ** p < 0.01, and *** p < 0.001.
Ijms 18 02467 g001
Figure 2. Scatter plots of all up-regulated and down-regulated genes involved in Parkonson’s disease (PD) that were investigated in 3 ((A) 0.1 mg/kg/day; (B) 1 mg/kg/day; (C) 10 mg/kg/day) and 8 ((A’) 0.1 mg/kg/day; (B’) 1 mg/kg/day; (C’) 10 mg/kg/day) month-old mice exposed to different CPF dosages. The orange line indicates a fold change (2ΔΔCt) of 1. The other two lines indicate a two-fold change in the gene expression threshold.
Ijms 18 02467 g002
Figure 3. Real-time PCR analysis of genes involved in PD in 3-month- (A) and 8-month- (B) old mice. Data are presented as mean with SD. Statistical significance was determined using t-tests with Holm-Sidak correction for multiple comparison, ** p < 0.01, and *** p < 0.001.
Ijms 18 02467 g003
Figure 4. Venn diagram showing the differentially expressed genes across all the dosages (0.1, 1, 10 mg/kg/day) in 3-month- (A) and 8-month- (B) old mice. This diagram illustrates the overlap of mouse brain gene expression changes (p < 0.05) across dosages following CPF exposure.
Ijms 18 02467 g004
Table 1. Relative fold change and functions of DETS in 3-month-old mice.
Gene NameFunctionsFold Change
CASP9Apoptosis−0.35
MAPK9Apoptosis−0.39
NR4A2Apoptosis, Dopaminergic Signaling−0.34
CASP3Apoptosis, Mitochondrial−0.44
OPA1Apoptosis, Mitochondrial−0.29
CDH8Cell Adhesion Molecules−0.35
FN1Cell Adhesion Molecules−0.38
NFASCCell Adhesion Molecules−0.33
NRXN3Cell Adhesion Molecules−0.35
TPBGCell Adhesion Molecules−0.16
PTENCell Adhesion Molecules, Apoptosis, Mitochondrial−1.44
DRD2Dopaminergic Signaling−0.35
SLC6A3Dopaminergic Signaling−0.34
GABBR2GABAergic Signaling−0.13
ATP2B2Ion Transport−0.39
CXXC1Ion Transport−0.41
EGLN1Ion Transport−0.40
GRIA3Ion Transport−0.40
HTR2AIon Transport−0.36
KCNJ6Ion Transport−0.26
NSFIon Transport−0.29
SLIT1Ion Transport−0.34
SRSF7Ion Transport−0.41
ALDH1A1Other Parkinson’s Disease Genes−0.37
BASP1Other Parkinson’s Disease Genes−0.21
CHGBOther Parkinson’s Disease Genes−0.40
NCOA1Other Parkinson’s Disease Genes−0.40
RTN1Other Parkinson’s Disease Genes−0.34
STUB1Parkin Complex, Ubiquitination−0.32
ATXN2Parkin Substrate−0.32
ATXN3Parkin Substrate−0.33
GPR37Parkin Substrate−0.30
SYT11Parkin Substrate, Synaptic Vesicles−0.35
SV2BSynaptic Vesicles−0.22
SYNGR3Synaptic Vesicles−0.22
SYT1Synaptic Vesicles−0.32
SEPT5Synaptic Vesicles, Dopaminergic Signaling−0.23
UBCUbiquitination+0.49
USP34Ubiquitination−0.36
LRRK2Ubiquitination, Mitochondrial, Synaptic Vesicles−0.39
PARK2Ubiquitination, Mitochondrial, Dopaminergic Signaling−0.18
PINK1Ubiquitination, Mitochondrial, Dopaminergic Signaling−0.23
Table 2. Venn diagram summary for the three-month-old mice.
Chlorpyrifos ConcentrationsDETs (Differently Expressed Transcripts)Altered Genes
0.1 mg/kg/day00
0.1–1 mg/kg/day00
0.1–10 mg/kg/day00
1–10 mg/kg/day43Ubc, Aldh1a1, Apc, Atp2b2, Atxn2, Atxn3, Basp1, Bdnf, Casp3, Casp9, Cdc27, Cdh8, Chgb, Cxxc1, Drd2, Egln1, Fbxo9, Fn1, Gabbr2, Gpr37, Htr2a, Kcnj6, Lrrk2, Ncoa1, Nefl, Nfasc, Nrxn3, Nsf, Nsg1, Ntrk2, Opa1, Pan2, Park2, Pink1, Pten, Rgs4, Sept5, Srsf7, Sv2b, Syngr3, Syt1, Ube2k, Usp34
1 mg/kg/day1Gbe1
10 mg/kg/day19App, Cadps, Casp7, Ddc, Dlk1, Gria3, Hspa4, Park7, Psen2, Rtn1, Skp1a, Slc6a3, Slit1, Stub1, Syt11, Tpbg, Uch11, Ywhaz
0.1-1-10 mg/kg/day4Park2, Nr4a2, Gabbr2, Sv2b
Table 3. Relative fold change and functions of DETS in 8-month-old mice.
Gene NameFunctionsFold Change
CASP1Apoptosis+1.13
CASP9Apoptosis+0.55
PSEN2Apoptosis+0.59
DRD2Dopaminergic Signaling−0.38
CHGBMAP Kinase Signaling+0.67
RGS4MAP Kinase Signaling+0.95
HSPA4Parkin Complex, Mitochondrial+0.45
PARK7Parkin Complex, Mitochondrial, Dopaminergic Signaling+0.44
ATXN2Parkin Substrate−0.29
CDC27Ubiquitination+0.57
FBXO9Ubiquitination+0.45
UBCUbiquitination+0.89
UBE2KUbiquitination+0.63
PARK2Ubiquitination, Mitochondrial, Dopaminergic Signaling−0.28
Table 4. Venn diagram summary of the eight-month-old mice.
Chlorpyrifos ConcentrationsDETsAltered Genes
0.1 mg/kg/day0
0.1–1 mg/kg/day0
0.1–10 mg/kg/day0
1–10 mg/kg/day2Ube2k, Park2
1 mg/kg/day10Bdnf, Cul2, Gabbr2, Gbe1, Pan2, Ppid, Snca, Dlk1, Kcnj6, Uchl1
10 mg/kg/day12Cdc27, Chgb, Fbxo9, Hspa4, Park7, Psen2, Rgs4, Ube2l3, Atxn2, Ddc, Drd2, Fn1
0.1-1-10 mg/kg/day2Ubc, Casp9
Table 5. Oligo sequences used for qRT-PCR.
Oligo NameSequence 5′–3′
Gabbr FORTCCGGAACGGGGAAAGAATG
Gabbr REVTCCGACCCCTGGAACCTTAT
Park2 FORACCCACCTACAACAGCTTTTTC
Park2 REVCAGCAAGATGGGCCCTGG
Sept5 FORGACCCCAGAGGACAAACAGG
Sept5 REVACCATGAGCGTGAAGTCGAA
Sv2b FORTGCTGGAGATGGGCAAACAT
Sv2b REVTGAACACCTTTTCCGGGGTC
Atxn FORCCCGGGCGTACAACCTTTAT
Atxn REVTGTCGCTGTTGGGGCATATT
Ubc FORGCCCAGTGTTACCACCAAGA
Ubc REVCCCCATCACACCCAAGAACA
Chgb FORCTCACCAGGAGGCAAACGAT
Chgb REVAGTTCCAGATCCATCGCAGC
Rgs4 FORGCCAGAGGGTAAGCCAAGAA
Rgs4 REVTCCTCGCTGTATTCCGACTTC
Pink1 FORCTGCCTGAGATGCCTGAGTC
Pink1 REVGTGCAGACGGTCTCTTGCT

