Functioning of Fluorescent Proteins in Aggregates in Anthozoa Species and in Recombinant Artificial Models

 and
and
Abstract
:
1. Introduction
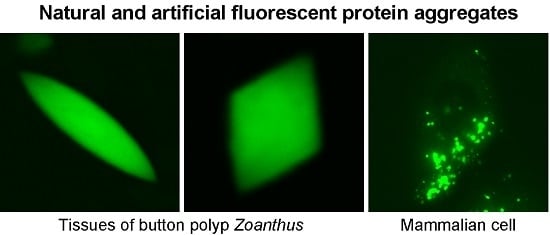
2. Results
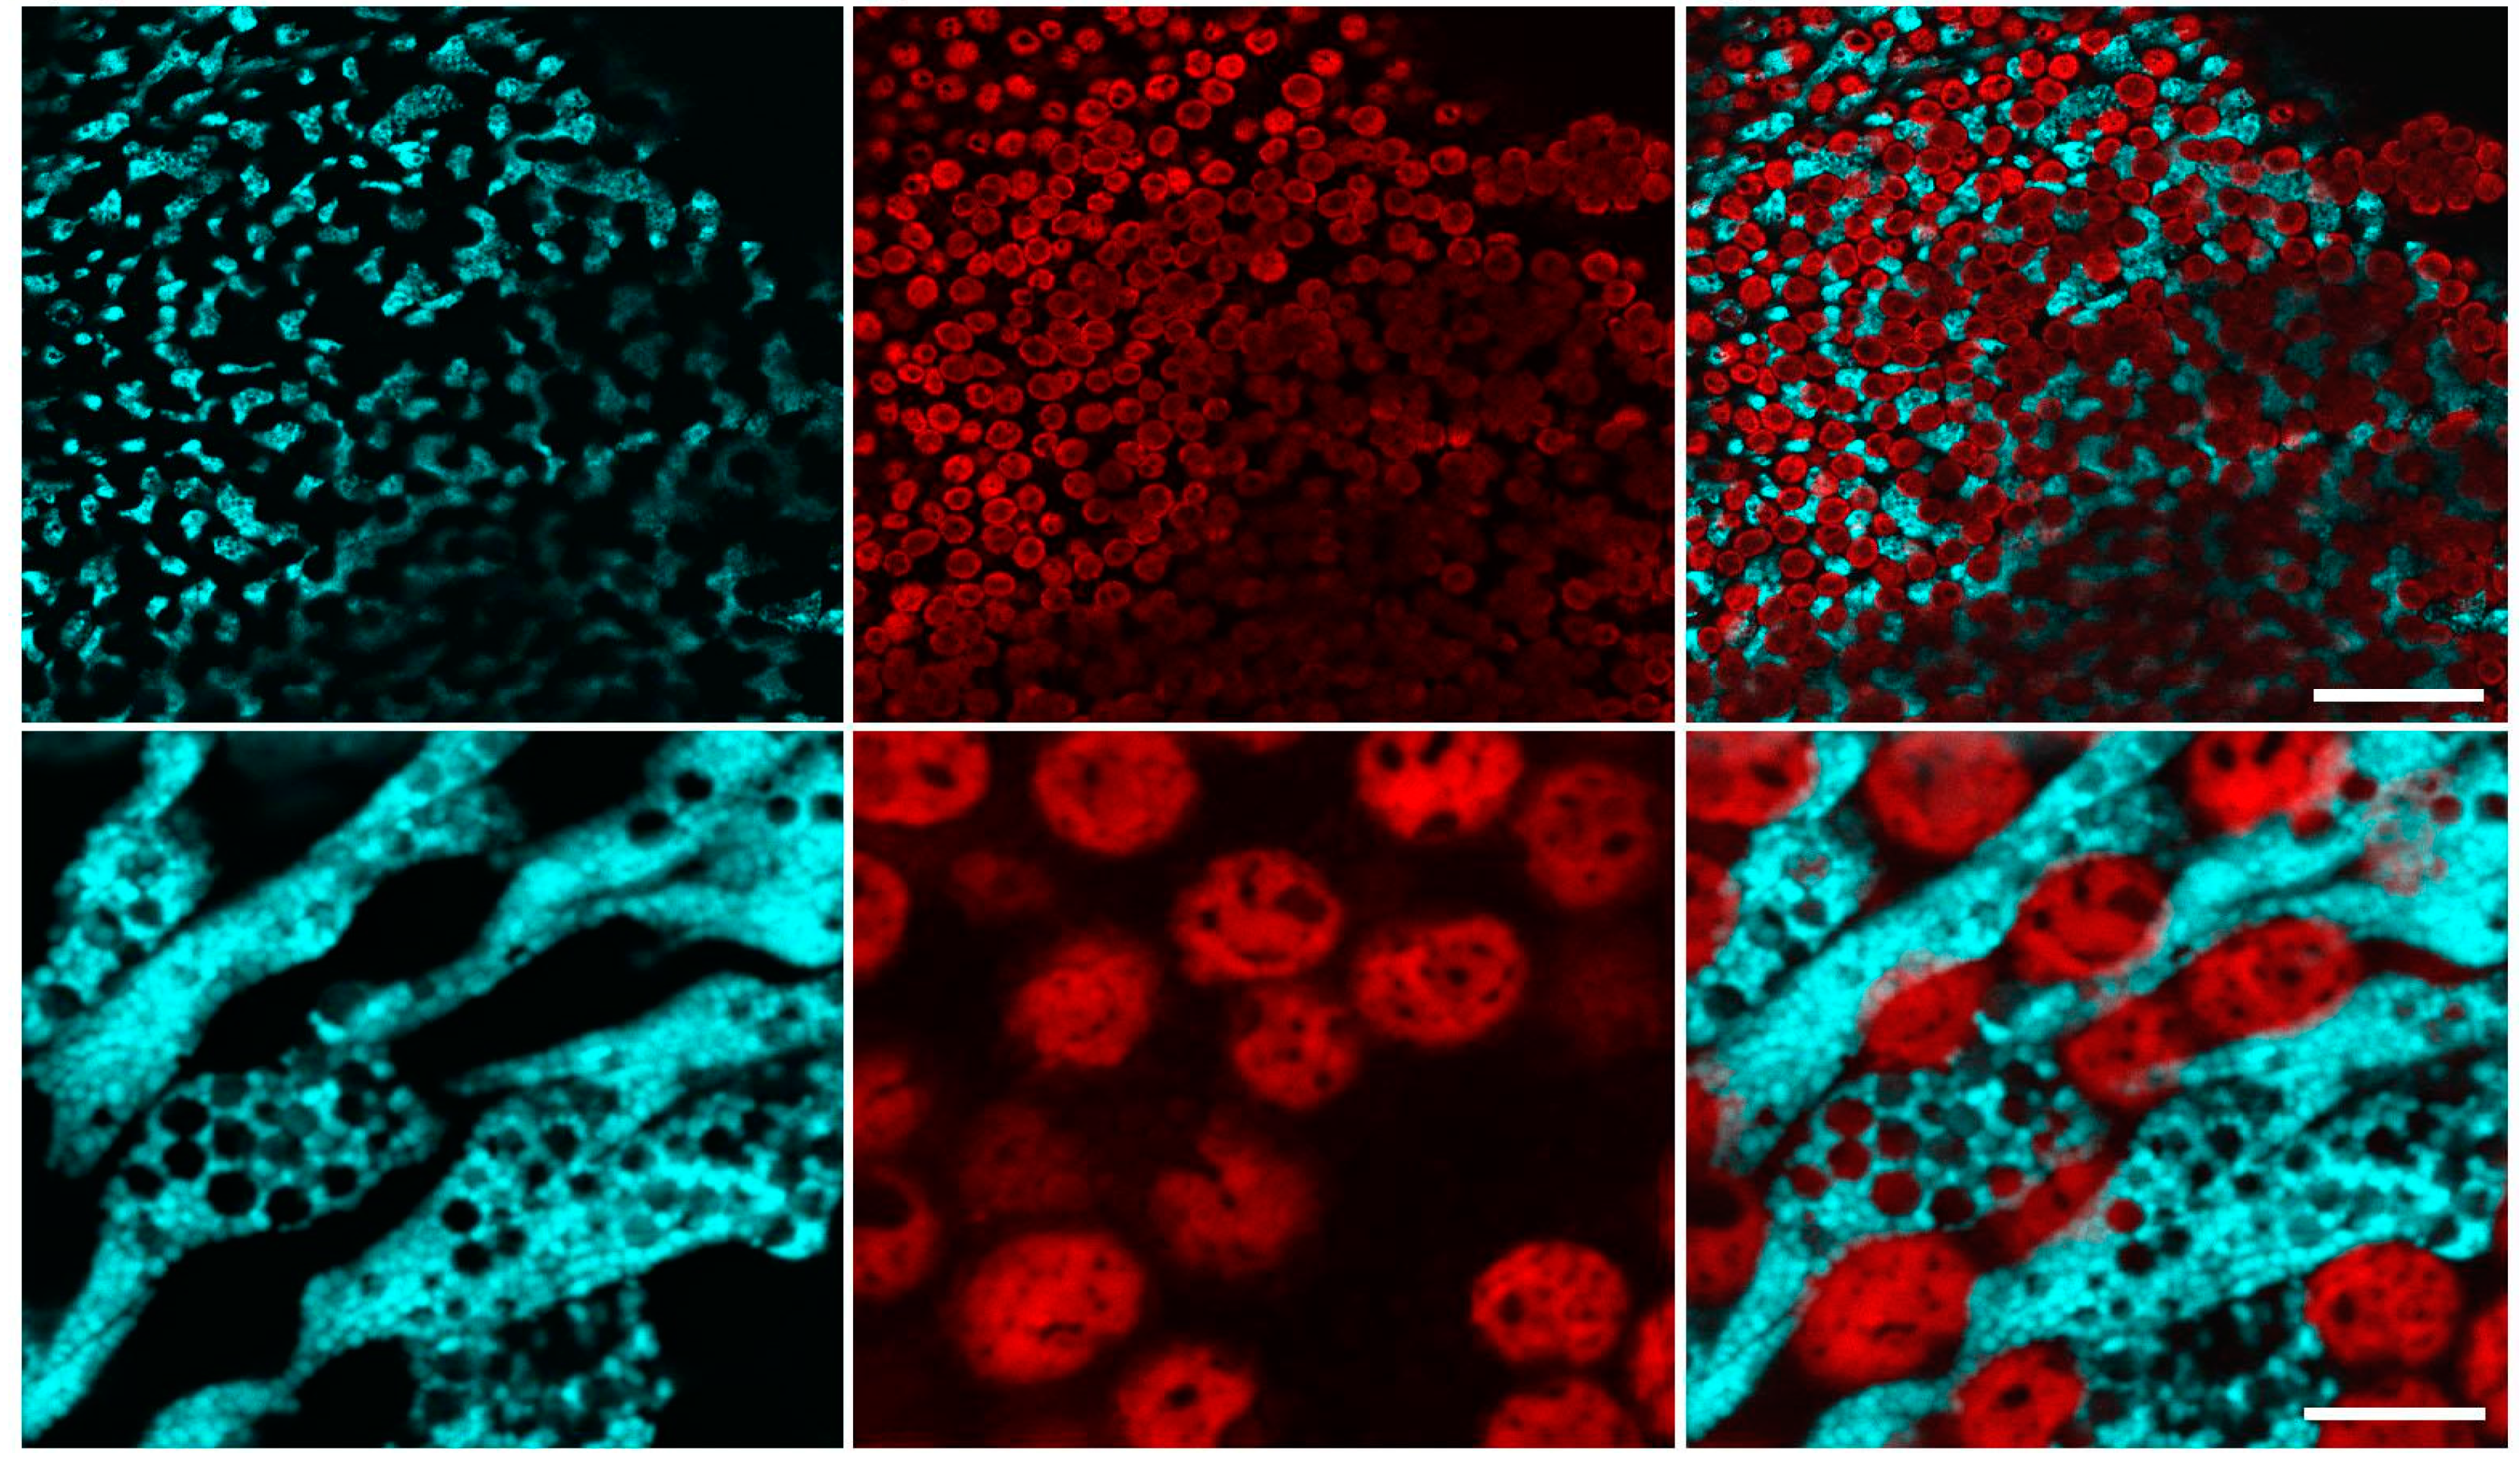
2.1. Confocal Microscopy of Coral Polyps
2.2. Fluorescence Recovery after Photobleaching (FRAP) of Endogenous of Fluorescent Proteins (FPs)
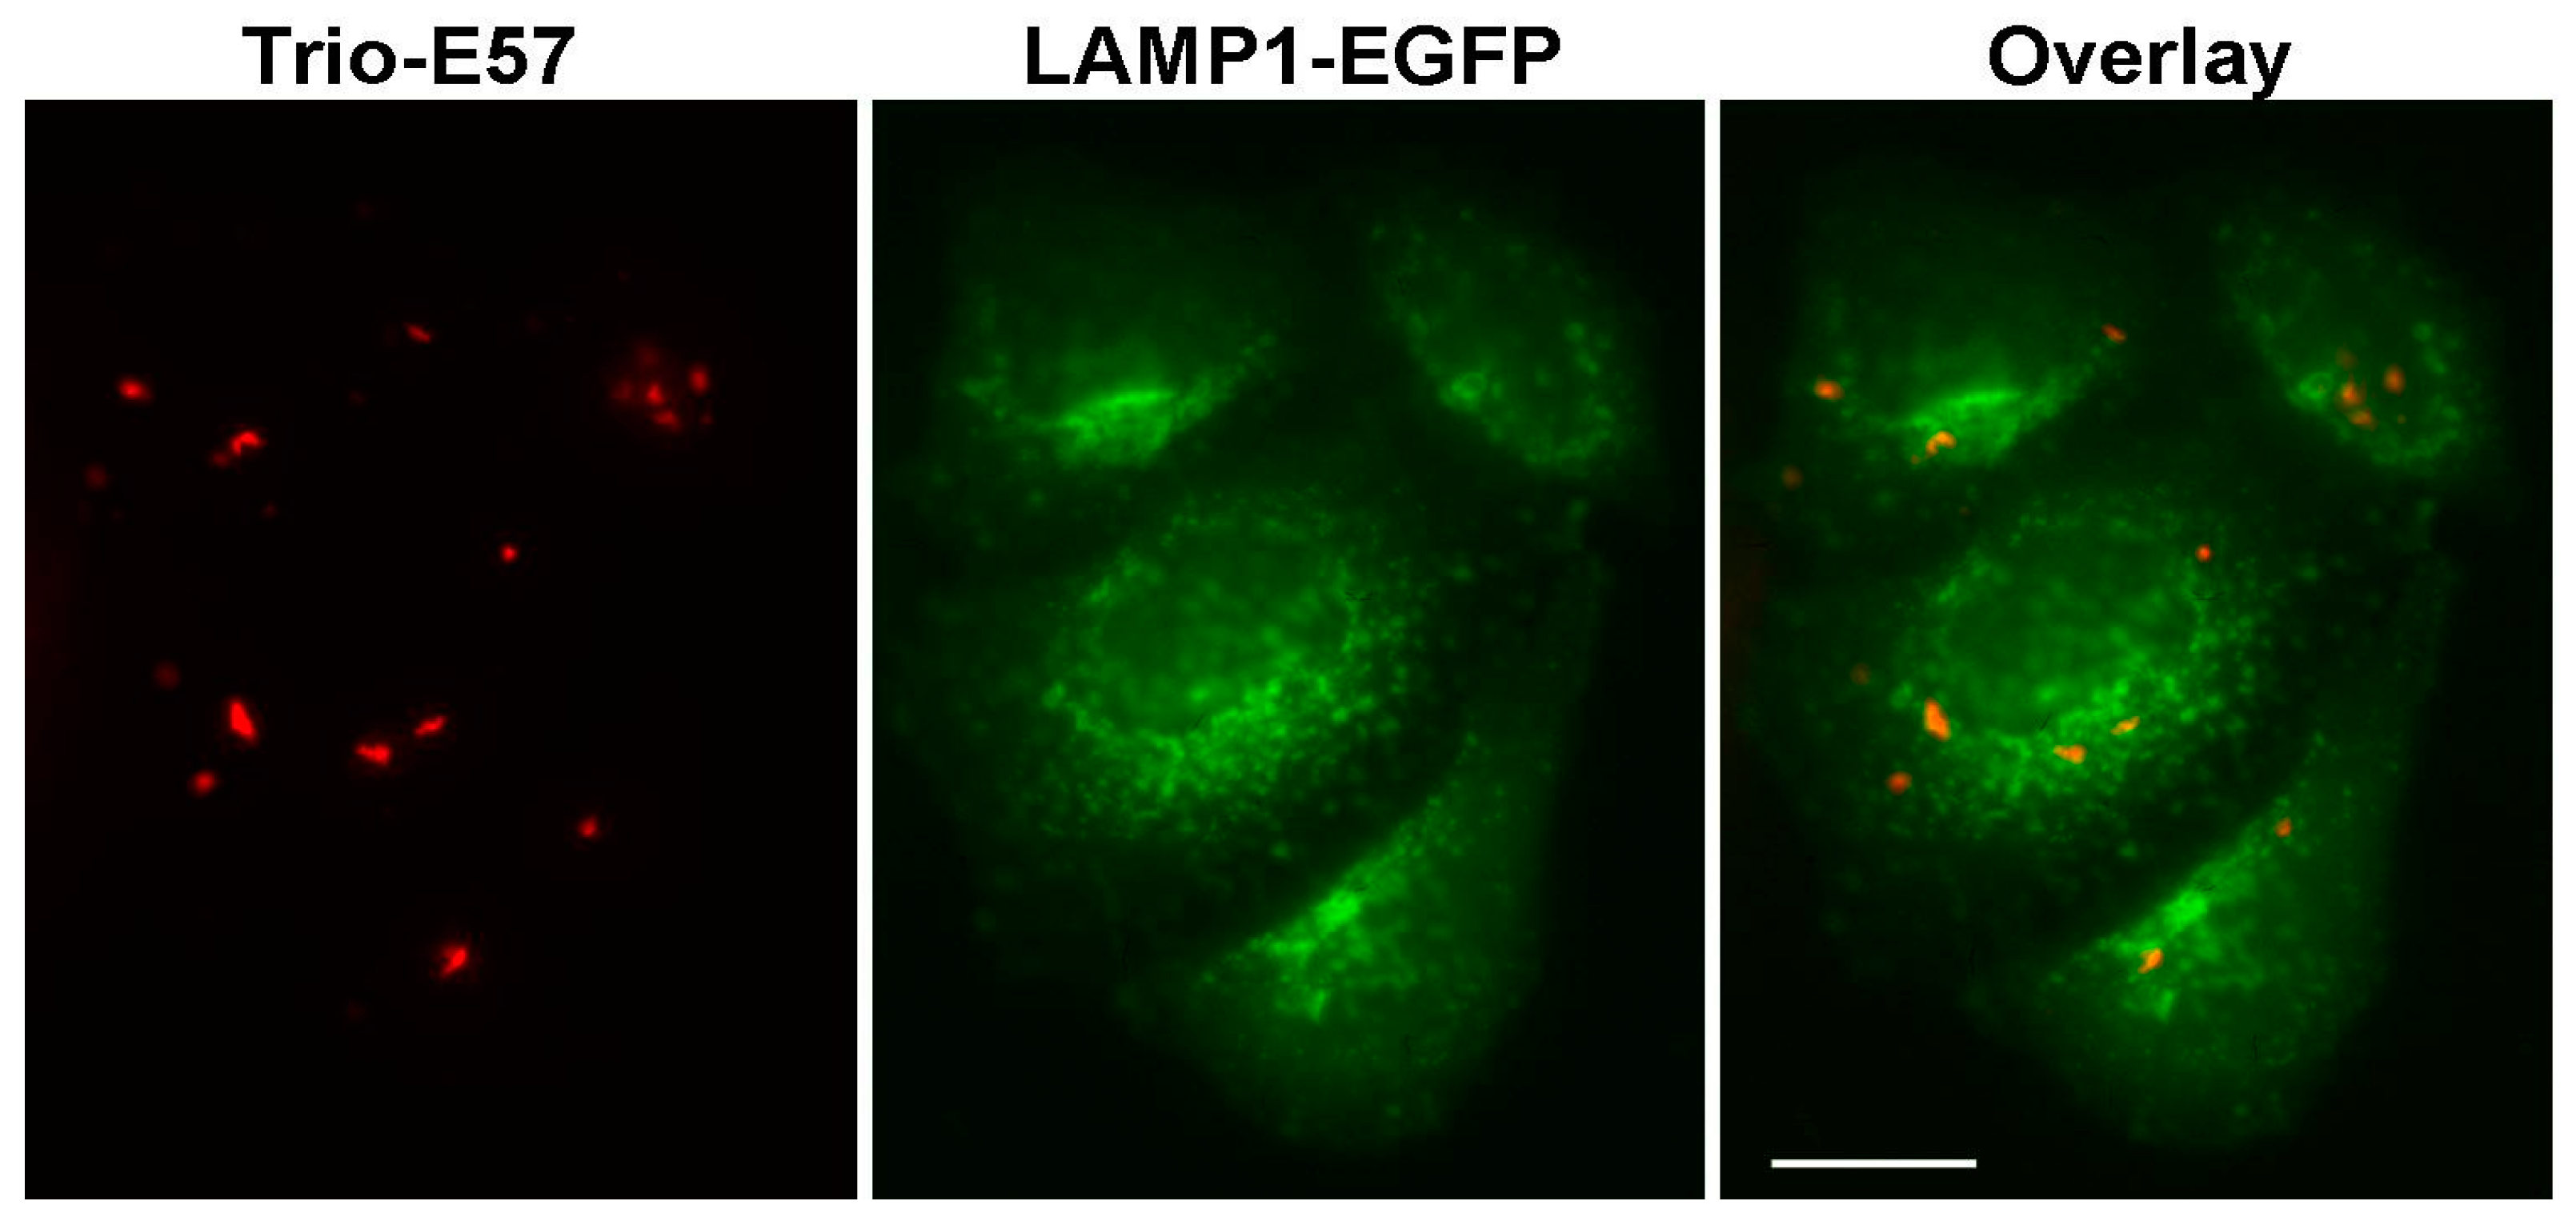
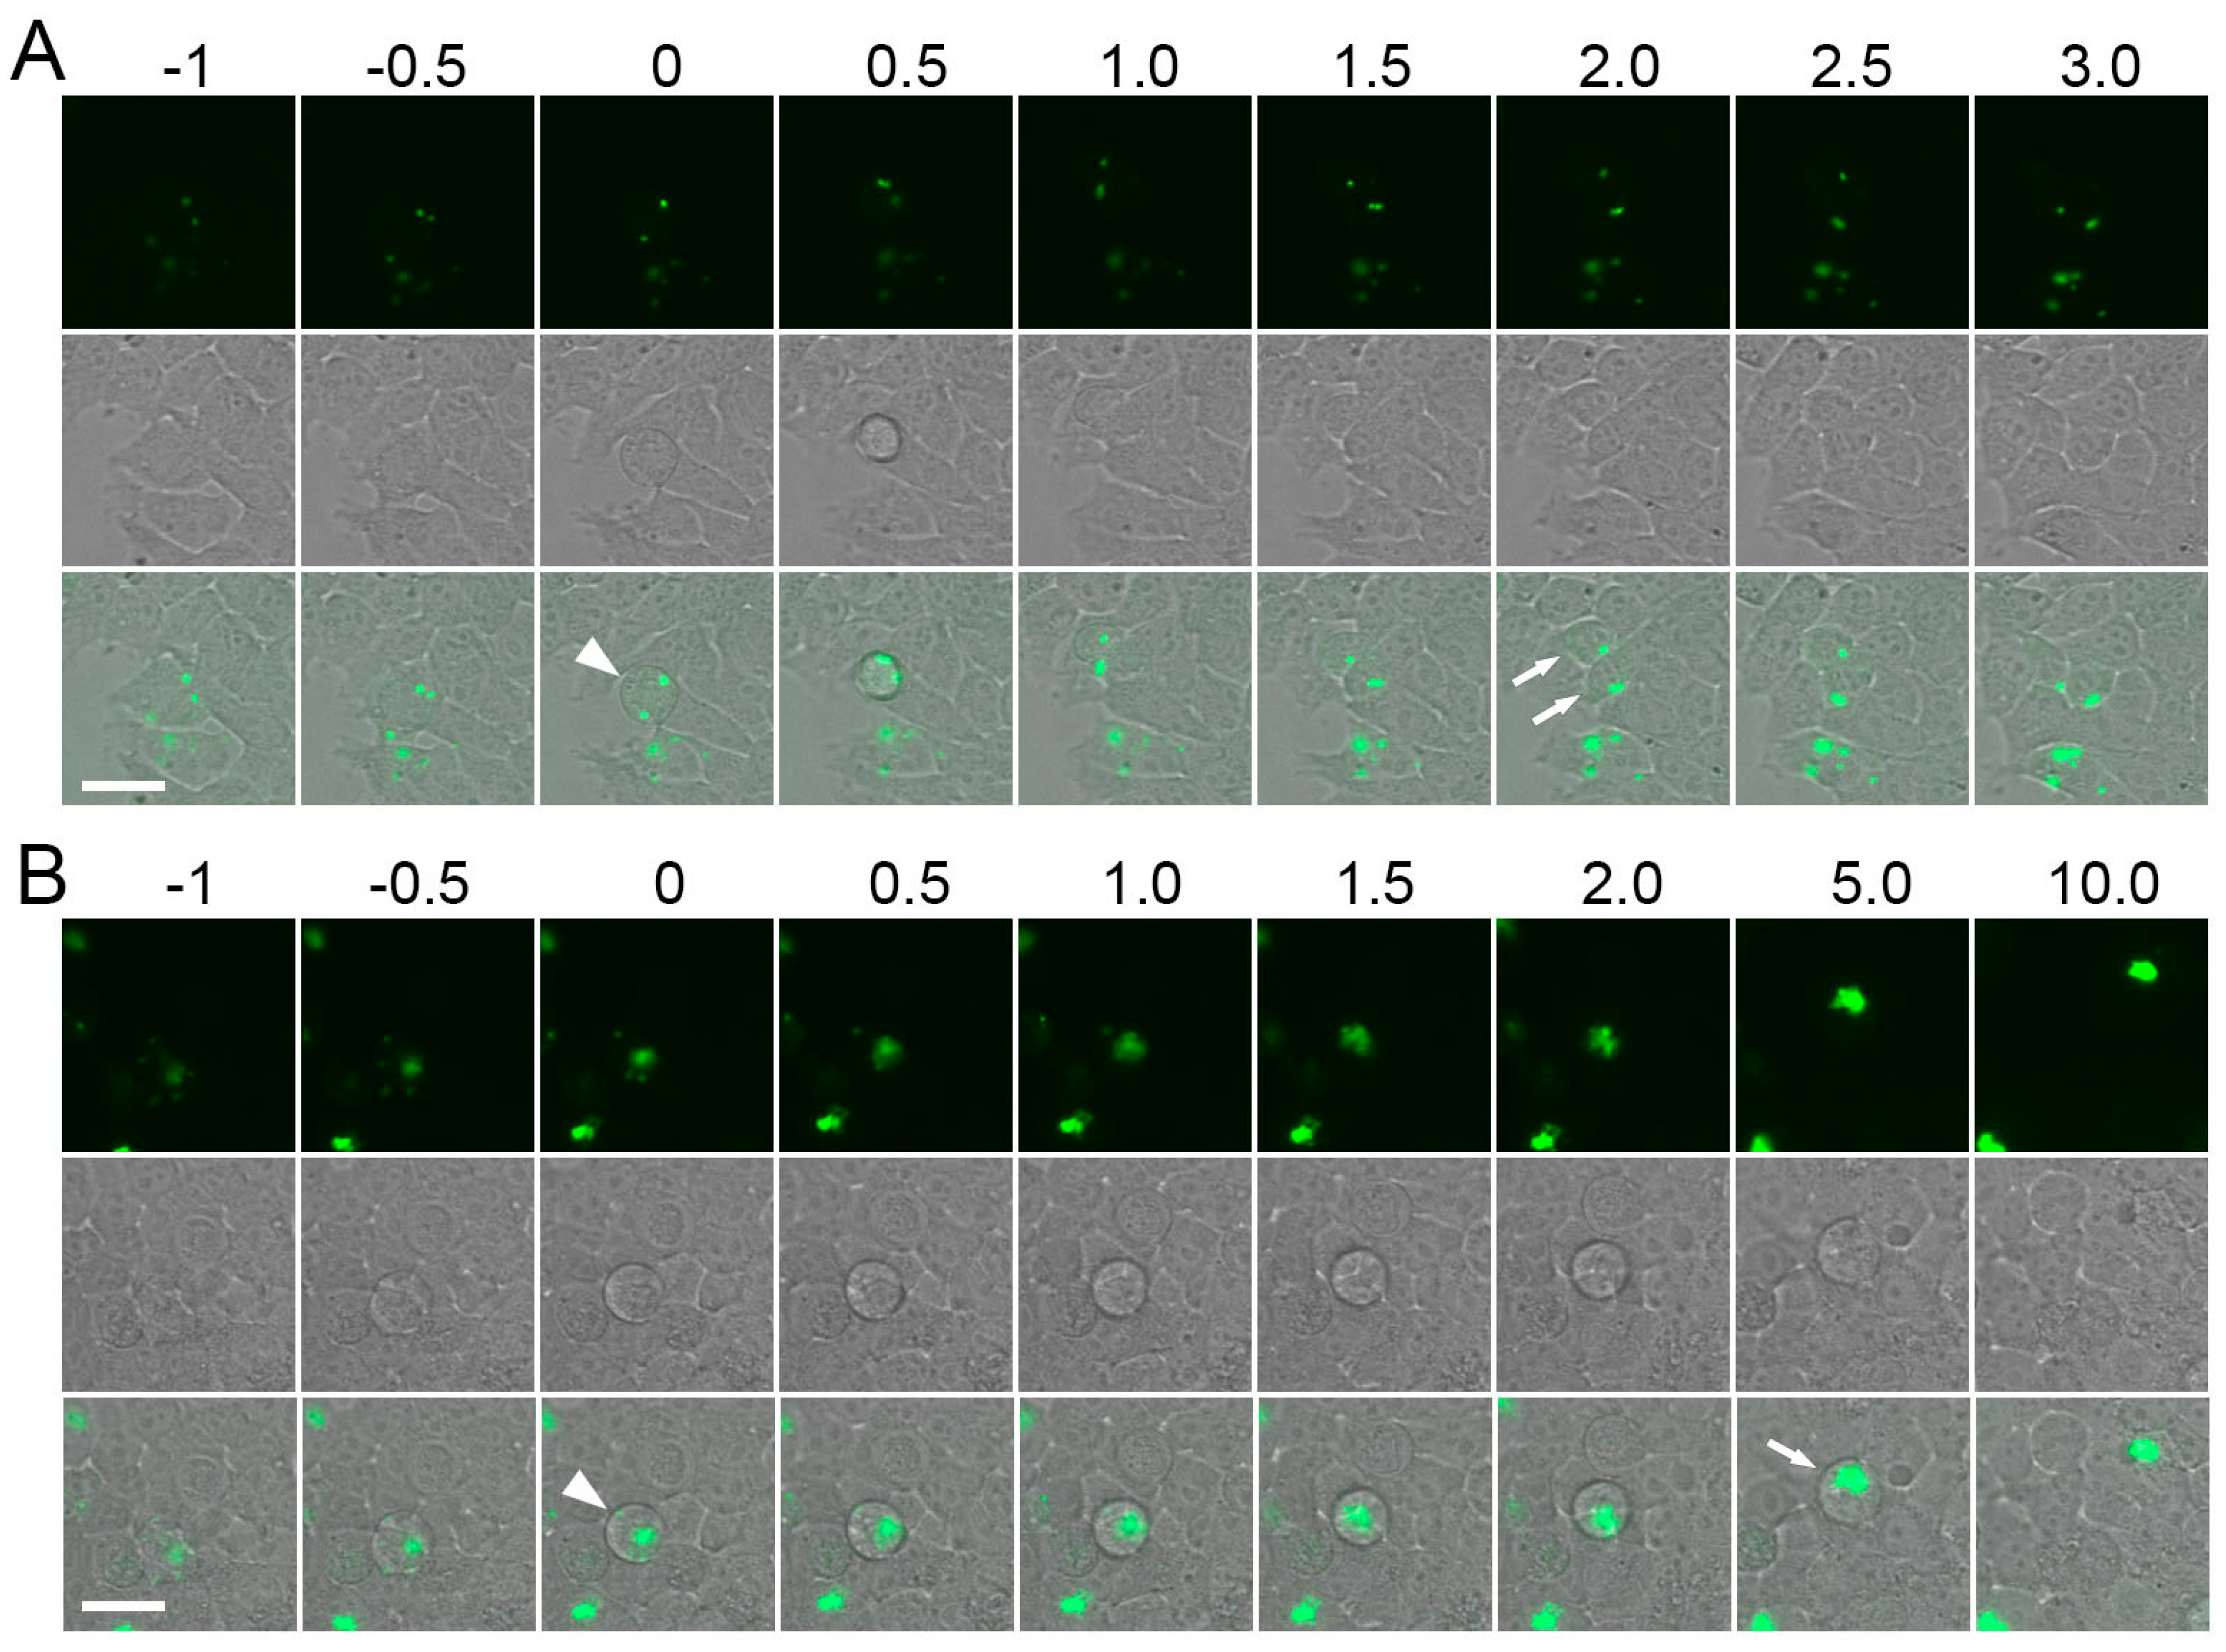
2.3. Construction of Strongly Aggregating FPs
3. Discussion
4. Materials and Methods
4.1. Confocal Microscopy
4.2. Cloning
4.3. Mammalian Cells
4.4. Wide Field Fluorescence Microscopy
4.5. Flow Cytometry
Supplementary Materials
Acknowledgments
Author Contributions
Conflicts of Interest
Abbreviations
| GFP | Green fluorescent protein |
| FP | Fluorescent protein |
| FRAP | Fluorescence recovery after photobleaching |
| RFP | Red fluorescent protein |
References
- Shimomura, O.; Johnson, F.H.; Saiga, Y. Extraction, purification and properties of aequorin, a bioluminescent protein from the luminous hydromedusan, Aequorea. J. Cell. Comp. Physiol. 1962, 59, 223–239. [Google Scholar] [CrossRef] [PubMed]
- Matz, M.V.; Fradkov, A.F.; Labas, Y.A.; Savitsky, A.P.; Zaraisky, A.G.; Markelov, M.L.; Lukyanov, S.A. Fluorescent proteins from nonbioluminescent Anthozoa species. Nat. Biotechnol. 1999, 17, 969–973. [Google Scholar] [CrossRef] [PubMed]
- Shagin, D.A.; Barsova, E.V.; Yanushevich, Y.G.; Fradkov, A.F.; Lukyanov, K.A.; Labas, Y.A.; Semenova, T.N.; Ugalde, J.A.; Meyers, A.; Nunez, J.M.; et al. GFP-like proteins as ubiquitous metazoan superfamily: Evolution of functional features and structural complexity. Mol. Biol. Evol. 2004, 21, 841–850. [Google Scholar] [CrossRef] [PubMed]
- Deheyn, D.D.; Kubokawa, K.; McCarthy, J.K.; Murakami, A.; Porrachia, M.; Rouse, G.W.; Holland, N.D. Endogenous green fluorescent protein (GFP) in amphioxus. Biol. Bull. 2007, 213, 95–100. [Google Scholar] [CrossRef] [PubMed]
- Matz, M.V.; Marshall, N.J.; Vorobyev, M. Are corals colorful? Photochem. Photobiol. 2006, 82, 345–350. [Google Scholar] [CrossRef] [PubMed]
- Alieva, N.O.; Konzen, K.A.; Field, S.F.; Meleshkevitch, E.A.; Hunt, M.E.; Beltran-Ramirez, V.; Miller, D.J.; Wiedenmann, J.; Salih, A.; Matz, M.V. Diversity and evolution of coral fluorescent proteins. PLoS ONE 2008, 3, e2680. [Google Scholar] [CrossRef] [PubMed]
- Chudakov, D.M.; Matz, M.V.; Lukyanov, S.; Lukyanov, K.A. Fluorescent Proteins and Their Applications in Imaging Living Cells and Tissues. Physiol. Rev. 2010, 90, 1103–1163. [Google Scholar] [CrossRef] [PubMed]
- Smith, E.G.; D’Angelo, C.; Salih, A.; Wiedenmann, J. Screening by coral green fluorescent protein (GFP)-like chromoproteins supports a role in photoprotection of zooxanthellae. Coral Reefs 2013, 32, 463–474. [Google Scholar] [CrossRef]
- Gittins, J.R.; D’Angelo, C.; Oswald, F.; Edwards, R.J.; Wiedenmann, J. Fluorescent protein-mediated colour polymorphism in reef corals: Multicopy genes extend the adaptation/acclimatization potential to variable light environments. Mol. Ecol. 2015, 24, 453–465. [Google Scholar] [CrossRef] [PubMed]
- Eyal, G.; Wiedenmann, J.; Grinblat, M.; D’Angelo, C.; Kramarsky-Winter, E.; Treibitz, T.; Ben-Zvi, O.; Shaked, Y.; Smith, T.B.; Harii, S.; et al. Spectral Diversity and Regulation of Coral Fluorescence in a Mesophotic Reef Habitat in the Red Sea. PLoS ONE 2015, 10, e0128697. [Google Scholar] [CrossRef] [PubMed]
- Roth, M.S.; Padilla-Gamiño, J.L.; Pochon, X.; Bidigare, R.R.; Gates, R.D.; Smith, C.M.; Spalding, H.L. Fluorescent proteins in dominant mesophotic reef-building corals. Mar. Ecol. Prog. Ser. 2015, 521, 63–79. [Google Scholar] [CrossRef]
- Oswald, F.; Schmitt, F.; Leutenegger, A.; Ivanchenko, S.; D’Angelo, C.; Salih, A.; Maslakova, S.; Bulina, M.; Schirmbeck, R.; Nienhaus, G.U.; et al. Contributions of host and symbiont pigments to the coloration of reef corals. FEBS J. 2007, 274, 1102–1109. [Google Scholar] [CrossRef] [PubMed]
- Ikmi, A.; Gibson, M.C. Identification and in vivo characterization of NvFP-7R, a developmentally regulated red fluorescent protein of Nematostella vectensis. PLoS ONE 2010, 5, e11807. [Google Scholar] [CrossRef] [PubMed]
- Kenkel, C.D.; Traylor, M.R.; Wiedenmann, J.; Salih, A.; Matz, M.V. Fluorescence of coral larvae predicts their settlement response to crustose coralline algae and reflects stress. Proc. Biol. Sci. 2011, 278, 2691–2697. [Google Scholar] [CrossRef] [PubMed]
- Terskikh, A.V.; Fradkov, A.F.; Zaraisky, A.G.; Kajava, A.V.; Angres, B. Analysis of DsRed mutants Space around the fluorophore accelerates fluorescence development. J. Biol. Chem. 2002, 277, 7633–7636. [Google Scholar] [CrossRef] [PubMed]
- Katayama, H.; Yamamoto, A.; Mizushima, N.; Yoshimori, T.; Miyawaki, A. GFP-like proteins stably accumulate in lysosomes. Cell Struct. Funct. 2008, 33, 1–12. [Google Scholar] [CrossRef] [PubMed]
- Falcón-Pérez, J.M.; Nazarian, R.; Sabatti, C.; Dell’Angelica, E.C. Distribution and dynamics of Lamp1-containing endocytic organelles in fibroblasts deficient in BLOC-3. J. Cell Sci. 2005, 118, 5243–5255. [Google Scholar] [CrossRef] [PubMed]
- Marzluff, W.F.; Wagner, E.J.; Duronio, R.J. Metabolism and regulation of canonical histone mRNAs: Life without a poly(A) tail. Nat. Rev. Genet. 2008, 9, 843–854. [Google Scholar] [CrossRef] [PubMed]
- Yanushevich, Y.G.; Staroverov, D.B.; Savitsky, A.P.; Fradkov, A.F.; Gurskaya, N.G.; Bulina, M.E.; Lukyanov, K.A.; Lukyanov, S.A. A strategy for the generation of non-aggregating mutants of Anthozoa fluorescent proteins. FEBS Lett. 2002, 511, 11–14. [Google Scholar] [CrossRef]
- Zubova, N.N.; Korolenko, V.A.; Astafyev, A.A.; Petrukhin, A.N.; Vinokurov, L.M.; Sarkisov, O.M.; Savitsky, A.P. Brightness of yellow fluorescent protein from coral (zFP538) depends on aggregation. Biochemistry 2005, 44, 3982–3993. [Google Scholar] [CrossRef] [PubMed]
- Tsutsui, H.; Jinno, Y.; Shoda, K.; Tomita, A.; Matsuda, M.; Yamashita, E.; Katayama, H.; Nakagawa, A.; Miyawaki, A. A diffraction-quality protein crystal processed as an autophagic cargo. Mol. Cell 2015, 58, 186–193. [Google Scholar] [CrossRef] [PubMed]
- Lyndby, N.H.; Kühl, M.; Wangpraseurt, D. Heat generation and light scattering of green fluorescent protein-like pigments in coral tissue. Sci. Rep. 2016, 6, 26599. [Google Scholar] [CrossRef] [PubMed]
- Herce, H.D.; Deng, W.; Helma, J.; Leonhardt, H.; Cardoso, M.C. Visualization and targeted disruption of protein interactions in living cells. Nat. Commun. 2013, 4, 2660. [Google Scholar] [CrossRef] [PubMed]
- Watanabe, T.; Seki, T.; Fukano, T.; Sakaue-Sawano, A.; Karasawa, S.; Kubota, M.; Kurokawa, H.; Inoue, K.; Akatsuka, J.; Miyawaki, A. Genetic visualization of protein interactions harnessing liquid phase transitions. Sci. Rep. 2017, 7, 46380. [Google Scholar] [CrossRef] [PubMed]


| Promoter | Fluorescent Protein | Mean (Median) Green Fluorescence Intensity, Arbitrary Units (a.u.) | ||
|---|---|---|---|---|
| 24 h | 48 h | 72 h | ||
| CMV | Trio-AG4 | 86 (47) | 458 (209) | 450 (147) |
| mNeonGreen | 1088 (259) | 800 (146) | 806 (110) | |
| H1 | Trio-AG4 | 57 (20) | 95 (40) | 117 (47) |
| mNeonGreen | 32 (20) | 47 (26) | 50 (29) | |
© 2017 by the authors. Licensee MDPI, Basel, Switzerland. This article is an open access article distributed under the terms and conditions of the Creative Commons Attribution (CC BY) license (http://creativecommons.org/licenses/by/4.0/).
Share and Cite
Povarova, N.V.; Petri, N.D.; Blokhina, A.E.; Bogdanov, A.M.; Gurskaya, N.G.; Lukyanov, K.A. Functioning of Fluorescent Proteins in Aggregates in Anthozoa Species and in Recombinant Artificial Models. Int. J. Mol. Sci. 2017, 18, 1503. https://doi.org/10.3390/ijms18071503
Povarova NV, Petri ND, Blokhina AE, Bogdanov AM, Gurskaya NG, Lukyanov KA. Functioning of Fluorescent Proteins in Aggregates in Anthozoa Species and in Recombinant Artificial Models. International Journal of Molecular Sciences. 2017; 18(7):1503. https://doi.org/10.3390/ijms18071503
Chicago/Turabian StylePovarova, Natalia V., Natalia D. Petri, Anna E. Blokhina, Alexey M. Bogdanov, Nadya G. Gurskaya, and Konstantin A. Lukyanov. 2017. "Functioning of Fluorescent Proteins in Aggregates in Anthozoa Species and in Recombinant Artificial Models" International Journal of Molecular Sciences 18, no. 7: 1503. https://doi.org/10.3390/ijms18071503