Abstract
Low-frequency electron paramagnetic resonance (EPR) is used to extract the EPR parameter A-mid and support the approximate X-band value of g-mid for Ba(CoyZn1/3−yTa2/3)O3. Although the cobalt hyperfine structure for the |±1/2⟩ state is often unresolved at X-band or S-band, it is resolved in measurements on this compound. This allows for detailed analysis of the molecular orbital for the |±1/2⟩ state, which is often the ground state. Moreover, this work shows that the EPR parameters for Co substituted into Zn compounds give important insight into the properties of zinc binding sites.
1. Introduction
The electron paramagnetic resonance (EPR) parameters of high-spin cobalt(II) (Co2+) complexes in small molecules and enzymes consist of g-values, zero field splitting parameters D and E/D, and sometimes resolution of the Co hyperfine for the | ± 3/2〉 doublet; most often, they do not include resolution of the Co hyperfine for the | ± 1/2〉 doublet [1,2,3]. Copper hyperfine and superhyperfine lines, particularly the hyperfine lines about g-parallel, are better resolved at low frequencies due to less g- and A-strain [4,5,6,7]. To the best of our knowledge, this is the first paper to show that the hyperfine lines for high-spin Co for the Co site in Co-doped barium zinc tantalite (BZT) (i.e., Ba(Zn1/3Ta2/3)O3) are resolved for the | ± 1/2〉 doublet at low frequencies. The determination of Co A-mid provides an EPR parameter that is more sensitive to adduct formation and the electron density distribution in the | ± 1/2〉 state. It is anticipated that recording hyperfine values due to the better resolution at low frequency along with a more accurate determination of the geff-mid value would lead to the classification of types of cobalt sites and to identification of nitrogen, oxygen, and sulfur donor atoms, as is done for cupric sites [5]. Then, A-mid for Co could be used to characterize zinc (Zn) sites, where Co is substituted for Zn.
2. Results and Discussion
2.1. No Resolvable Hyperfine Structure at X-Band
EPR spectra were obtained for Ba[(Zn1−yCoy)1/3Ta2/3]O3, where y is 0.03. The X-band spectrum gives a central geff value of 4.76 and possibly exchange-narrowed and/or dipolar-broadened lines for the interaction of the nearest neighbors, but the Co hyperfine structure is unresolved (Figure 1) [8].
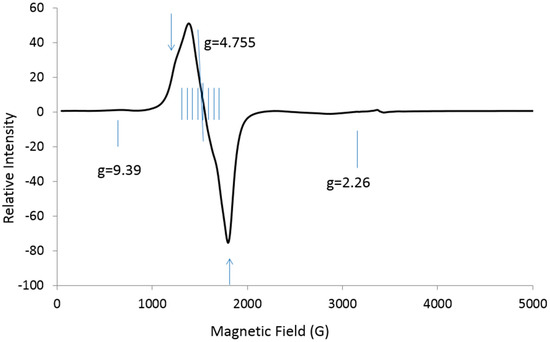
Figure 1.
X-band (9.488 GHz) spectrum at 12 K for Co-doped barium zinc tantalate (BZT); eight short vertical lines for expected but unresolved Co hyperfine lines; vertical lines with arrows may depict exchange-narrowed and/or dipolar-broadened lines for the interaction of the nearest neighbors. Weak lines at g = [9.39 and 2.26] are not assigned.
2.2. Cobalt Hyperfine Lines Resolved at Low Frequencies: S-Band and L-Band
The S-band spectrum (3.216 GHz) has four of eight resolved Co hyperfine lines, for which a geff-mid value of 4.76 and an A-mid of 65 G (432 MHz) are readily apparent (Figure 2). A simulation using EasySpin and a least squares fitting routine gives geff values [4.83, 4.56, 2.14] and A values [432, 402, 130 MHz] (Figure 2). The simulation is consistent with, but not proof of, the parameters for the experimental spectrum, because other parameters such as line width variation, Euler angles, etc., are not included and the simulation may not be unique. The number of variables is underdetermined for three multifrequency spectra. Simulations suggest that the structure is slightly rhombic, but the geff value of 4.76 confirms that E/D falls close to the tetragonal value. Nevertheless, clear values for geff-mid and A-mid are obtained. A geff value of 4.8 suggests that the g-mid and A-mid are for the | ± 1/2〉 state from the rhombogram [9].
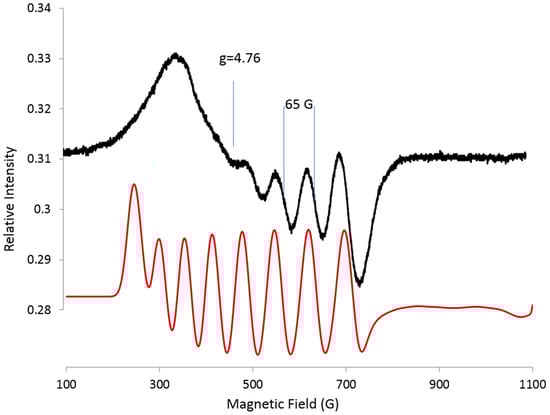
Figure 2.
S-band (3.216 GHz) spectrum (black) for Co-doped BZT at 17 K. Exp: 28 dB, 5 G mod., time constant 0.1285 s. Simulation (red): EasySpin, least squares, simplex, geff = [4.83, 4.56, 2.14], A = [432, 402, 130 (fixed) MHz], HStrain = [200, 200, 200 MHz].
The L-band spectrum is well resolved but complicated (Figure 3). None of the splittings between the resolved lines directly correspond to the 65 G for A-mid obtained at S-band, presumably from the overlap of lines. It is difficult to determine whether the resolved lines are S-shaped, as would be obtained for geff-mid and A-mid, or hills and valleys, as would be obtained for the low- and high-field EPR parameters. The second harmonic of the L-band spectrum was measured to accurately characterize the line shape (Figure 3), as it does very well for sharp lines. Starting with parameters from S-band, a simulation (red spectrum) was obtained using EasySpin with least squares fitting by Monte Carlo (Figure 3). The EPR parameters obtained are geff = [5.04, 4.01, 2.14], where 2.14 is arbitrarily fixed, i.e., set without resolved or even unresolved lines, and A = [472, 393, 130 (fixed) MHz]. A-max from the simulation equals 67 G and A-mid equals 67 G; these are in good agreement with the S-band value of 65 G. The simulation is also consistent with the experimental parameters (Table 1). It is noted that the simulations come with a warning that there are looping transitions and possible discontinuities at the ends of the spectrum. Looping transitions occur when S = 3/2 and pairs of non-crossing levels vary nonlinearly with the magnetic field [10]. A single pair of energy levels is in resonance before and after a crossing or near-crossing [11]. However, the agreement with the experimental spectrum is evidence that the simulated parameters are sensitive to geff and A values.
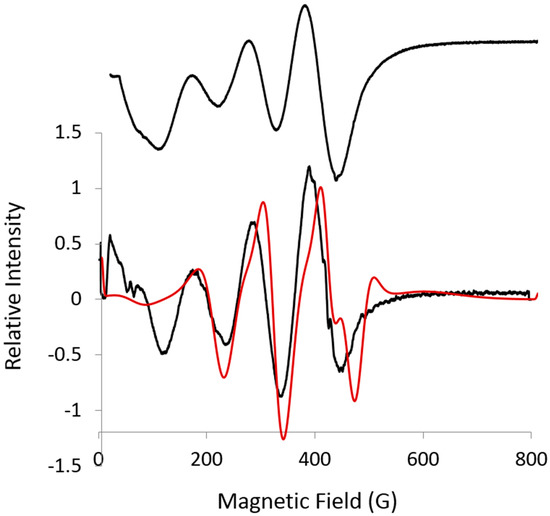
Figure 3.
L-band (1.362 GHz) spectrum (black, top) at 16.7 K. Exp: 28 dB, 5 G mod., time constant 0.128 s; second harmonic (black, bottom) 1% Bessel function using Sumspc, see Section 3.2 for details; Simulation (red), EasySpin, least squares, Monte Carlo: g = [5.04, 4.01, 2.14 (fixed)], A = [472, 393, 130 (fixed) MHz].

Table 1.
Electron paramagnetic resonance A-mid values and geff for Co-doped BZT from spectra and simulations.
2.3. Summary
A-mid and geff-mid from low-frequency spectra for Ba[(Zn1−yCoy)1/3Ta2/3]O3, where y is 0.03, were determined from the experimental S-band spectrum and from simulations of S-band and L-band EPR spectra. It was estimated that E/D from a rhombogram is less than or equal to 0.1, indicating that the crystal field is tetragonal, almost octahedral. This study shows that the Co hyperfine value can be obtained for the | ± 1/2〉 ground state for high-spin Co2+ complexes. This is the first Co site for which we have resolved both S-band and L-band hyperfine spectra. Thus, these spectra for Co-doped BZT serve as a model for Co complexes where the Co hyperfine is resolved at L-band but not S-band, as is usually found in other complexes [12,13]. It is suggested that EPR values for A-mid will be a more sensitive parameter for determining the coordination of and differences in the coordination of high-spin Co complexes. Zn sites outnumber cobalt sites and other metal sites in metalloenzymes [2]. Substitution of cobalt for zinc provides a paramagnetic site using the ligands for a non-paramagnetic zinc site or using the same ligands plus one or two ligands by, for example, expanding a four-coordinate tetrahedral site to a five- or six-coordinate site [2]. Perhaps the most important use of cobalt EPR may be as a substitute to probe zinc sites.
3. Materials and Methods
The methods to obtain the microwave ceramic, Co-doped BZT (Co-doped Ba(Zn1/3Ta2/3)O3), are given in reference [8].
3.1. Molecular Structure
Co2+ ions are substituted for Zn2+ in Ba(Zn1/3Ta2/3)O3 [8]. The Co2+ ions are in a slightly distorted octahedral crystal field, and the ground state has symmetry T1g.
3.2. EPR Spectrometers
Data were obtained from a low-frequency spectrometer station assembled at the National Biomedical EPR Center at the Medical College of Wisconsin (Milwaukee, WI, USA). The station incorporates an in-house-built L-band (1–2 GHz) bridge, Varian V-7200 Electromagnet, Varian V-7700 Magnet Power Supply, and Bruker BH-15 Magnetic Field Controller. The 100 KHz field modulation and signal phase-sensitive detection were provided by a Varian E-109 System EPR console. EPR signals from the phase-sensitive detector were recorded on a PC with Windows 7 running a custom LabVIEW program. The program also controlled the BH-15 Field Controller and performed multiple-scan signal averaging, when needed.
The L-band bridge in the spectrometer utilizes a low-phase-noise, mechanically and electronically tunable fundamental transistor oscillator capable of 50 mW power output to the sample resonator port at 0 dB main power attenuator setting. A loop-gap resonator was used to collect samples [6,7]. The oscillator microwave frequency was locked to the sample resonator frequency by a 70 KHz automatic frequency control system in the bridge, operating through the electronic tuning port of the oscillator. A low-noise amplifier in the microwave signal receiver prior to signal mixing improved the overall bridge sensitivity.
L-band simulations were completed assuming that S = 1/2 using an online version of EasySpin [14]. Starting with parameters from S-band, A-max, A-mid, g-max, and g-mid were varied over a weekend using the Monte Carlo option. The second harmonic was obtained using the SUMSPC program developed by J. Ratke at the National Biomedical EPR Center at the Medical College of Wisconsin (Milwaukee, WI, USA). Sumspec is available at no cost from the National Biomedical EPR Center (Milwaukee, WI, USA).
S-band spectra (3.2 GHz) were acquired using a loop-gap resonator, which is one of the spectrometers housed at the National Biomedical EPR Center at the Medical College of Wisconsin (Milwaukee, WI, USA) [6,7]. The hyperfine constant for Co at S-band was obtained by taking the value from the spectrum assuming an S-shaped line (Figure 2). The g value was obtained by taking the center of the eight-line pattern of which four lines are resolved (Figure 2). The geff values were set at g = [4.76, 4.76, 2.14] and A = [432, 432, 100]. The first Amin and Amid were fit using the Nelder/Med simplex least squares routine from EasySpin; then, gmin and gmid were varied, assuming a spin of S = 1/2.
X-band spectra were obtained at Marquette University (Milwaukee, WI, USA) using an updated EMX spectrometer and a Bruker cryogen-free system. The only parameter taken from the X-band spectrum was the g value at the center of the S-shaped line, g = 4.76 (Figure 1), as calculated from the resonant frequency from the frequency counter and the magnetic field at the center of this line.
Author Contributions
S.Z. synthesized Co-doped Ba(CoyZn1/3−yTa2/3)O3 using conventional ceramic powder processing methods at the Materials Program Lab at Arizona State University (Tempe, AZ, USA) [8]. J.G. and N.N. initiated the EPR studies by sending several transition-metal-ion-doped microwave ceramics. W.A. made the EPR measurements at low microwave frequencies and wrote the original draft of the manuscript. J.G. and N.N. added insight, added details, and completed the writing of the manuscript.
Funding
This research was funded by NIH NIBIB, grant number P41 EB001980.
Acknowledgments
Timothy Thelaner resurrected the low-temperature cryostat for L-band. Theodore Camenisch rebuilt the L-band spectrometer and keeps it operational (see Materials and Methods). The X-band spectra were obtained thanks to Brian Bennett, Marquette University (Milwaukee, WI, USA).
Conflicts of Interest
The authors declare no conflict of interest.
Abbreviations
| BZT | barium zinc tantalate |
| Co | cobalt |
| EPR | electron paramagnetic resonance |
| Zn | zinc |
References
- Krzystek, J.; Zvyagin, S.A.; Ozarowski, A.; Fiedler, A.T.; Brunold, T.C.; Telser, J. Definitive spectroscopic determination of zero-field splitting in high-spin cobalt(II). J. Am. Chem. Soc. 2004, 126, 2148–2155. [Google Scholar] [CrossRef] [PubMed]
- Bennett, B. EPR of cobalt-substituted zinc enzymes, in metals in biology: Applications of high-resolution EPR in metalloenzymes. In Biological Magnetic Resonance; Hanson, G., Berliner, L., Eds.; Springer: New York, NY, USA, 2010; Volume 29, pp. 345–370. ISBN 978–1-4419-1139-1. [Google Scholar]
- Marts, A.R.; Greer, S.M.; Whitehead, D.R.; Woodruff, T.M.; Breece, R.M.; Shim, S.W.; Oseback, S.N.; Papish, E.T.; Jacobsen, F.E.; Cohen, S.M.; et al. Dual mode EPR studies of a Kramers ion: High-spin Co(II) in 4-,5- and 6- coordination. Appl. Magn. Reson. 2011, 40, 501–511. [Google Scholar] [CrossRef]
- Antholine, W.E. Low frequency EPR of Cu2+ in proteins. In Biomedical EPR—Part A: Free Radicals, Metals, Medicine and Physiology; Eaton, S.S., Eaton, G.R., Berliner, L.J., Eds.; Springer: New York, NY, USA, 2005; Volume 23, pp. 417–454. ISBN 978–0-306-48506-0. [Google Scholar]
- Antholine, W.E.; Bennett, B.; Hanson, G. Copper coordination environments. In Multifrequency Electron Paramagnetic Resonance: Theory and Applications; Misra, S., Ed.; Wiley: Weinheim, Germany, 2011; pp. 647–718. ISBN 9783527407798. [Google Scholar]
- Froncisz, W.; Hyde, J.S. The loop-gap resonator: A new microwave lumped circuit ESR sample structure. J. Magn. Reson. 1982, 47, 515–521. [Google Scholar] [CrossRef]
- Froncisz, W.; Hyde, J.S. Broadening by strains of lines in the g-parallel region of Cu2+ EPR spectra. J. Chem. Phys. 1980, 73, 3123–3131. [Google Scholar] [CrossRef]
- Zhang, S.; Devonport, A.; Newman, N. Main source of microwave loss in transition-metal-doped Ba(Zn1/3Ta2/3)O3 and Ba(Zn1/3Nb2/3)O3 at cryogenic temperatures. J. Am. Ceram. Soc. 2015, 98, 1188–1194. [Google Scholar] [CrossRef]
- Hagen, W.R. EPR spectroscopy of iron sulfur proteins. Adv. Inorg. Chem. 1982, 38, 165–222. [Google Scholar] [CrossRef]
- Pilbrow, J.R.; Sinclair, D.R.; Hutton, D.R.; Troup, G.J. Asymmetric lines in field-sweep EPR: Cr3+ looping transitions in ruby. J. Magn. Reson. 1983, 52, 386–399. [Google Scholar] [CrossRef]
- Gaffney, B.J.; Silverstone, H.J. Simulation methods for looping transitions. J. Magn. Reson. 1998, 134, 57–66. [Google Scholar] [CrossRef] [PubMed]
- Antholine, W.E.; Ross, M.O.; Hoffman, B.M.; Rosenzweig, A.C. Better Resolution at Low Frequency: CoEDTA, a Model for Obtaining Co Hyperfine in High Spin Complexes of Biological Interest Like the Transmembrane Metal Binding Site for CzcP. In Proceedings of the American Chemical Society Meeting, Division of Inorganic Chemistry, Section: Bioinorganic Chemistry: Proteins and Enzymes and Model Systems, New Orleans, LA, USA, 18–22 March 2018. [Google Scholar]
- Antholine, W.E.; Mahim, A.; Petering, D.H. Better Resolution of High Spin Co Hyperfine at Low Frequency, L-band: Co-bovine Serum Albumin, A Model for Obtaining Co Hyperfine in High Spin Complexes of Biological Interest. In Proceedings of the 59th Annual Rocky Mountain Conference on Magnetic Resonance, Snowbird, UT, USA, 22–27 July 2018. Abstract Number 203. [Google Scholar]
- Stoll, S.; Schweiger, A. EasySpin, a comprehensive software package for spectral simulation and analysis in EPR. J. Magn. Reson. 2006, 178, 42. [Google Scholar] [CrossRef] [PubMed]
© 2018 by the authors. Licensee MDPI, Basel, Switzerland. This article is an open access article distributed under the terms and conditions of the Creative Commons Attribution (CC BY) license (http://creativecommons.org/licenses/by/4.0/).