Molecular Characterization and Overexpression of SmJMT Increases the Production of Phenolic Acids in Salvia miltiorrhiza

 and
and 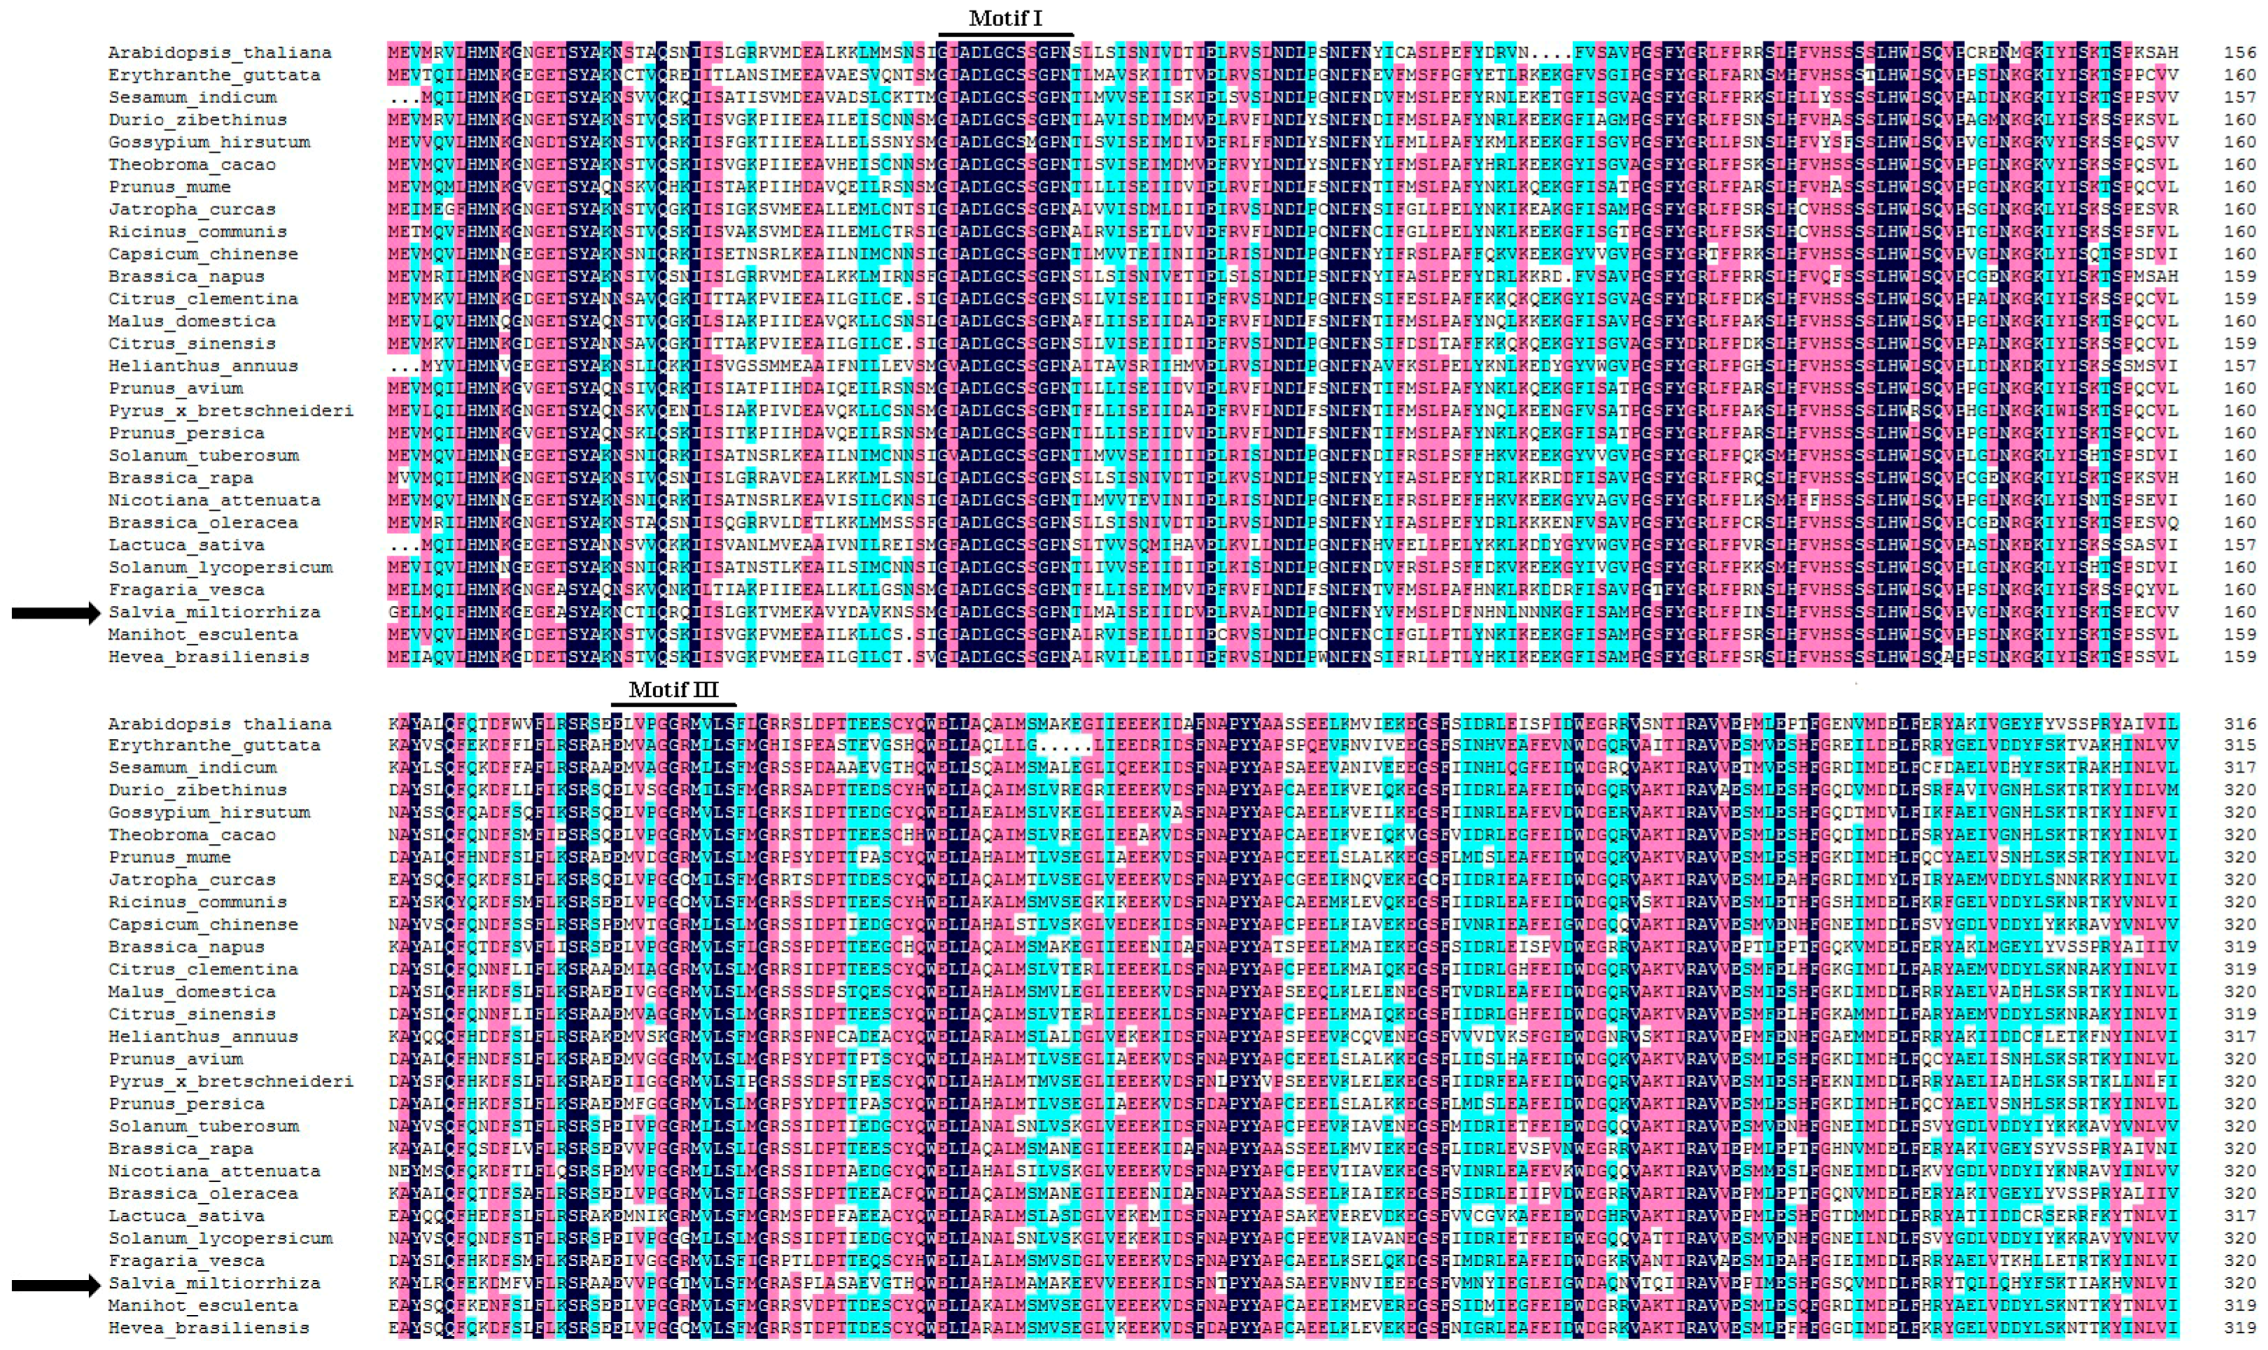
Abstract
:1. Introduction
2. Results
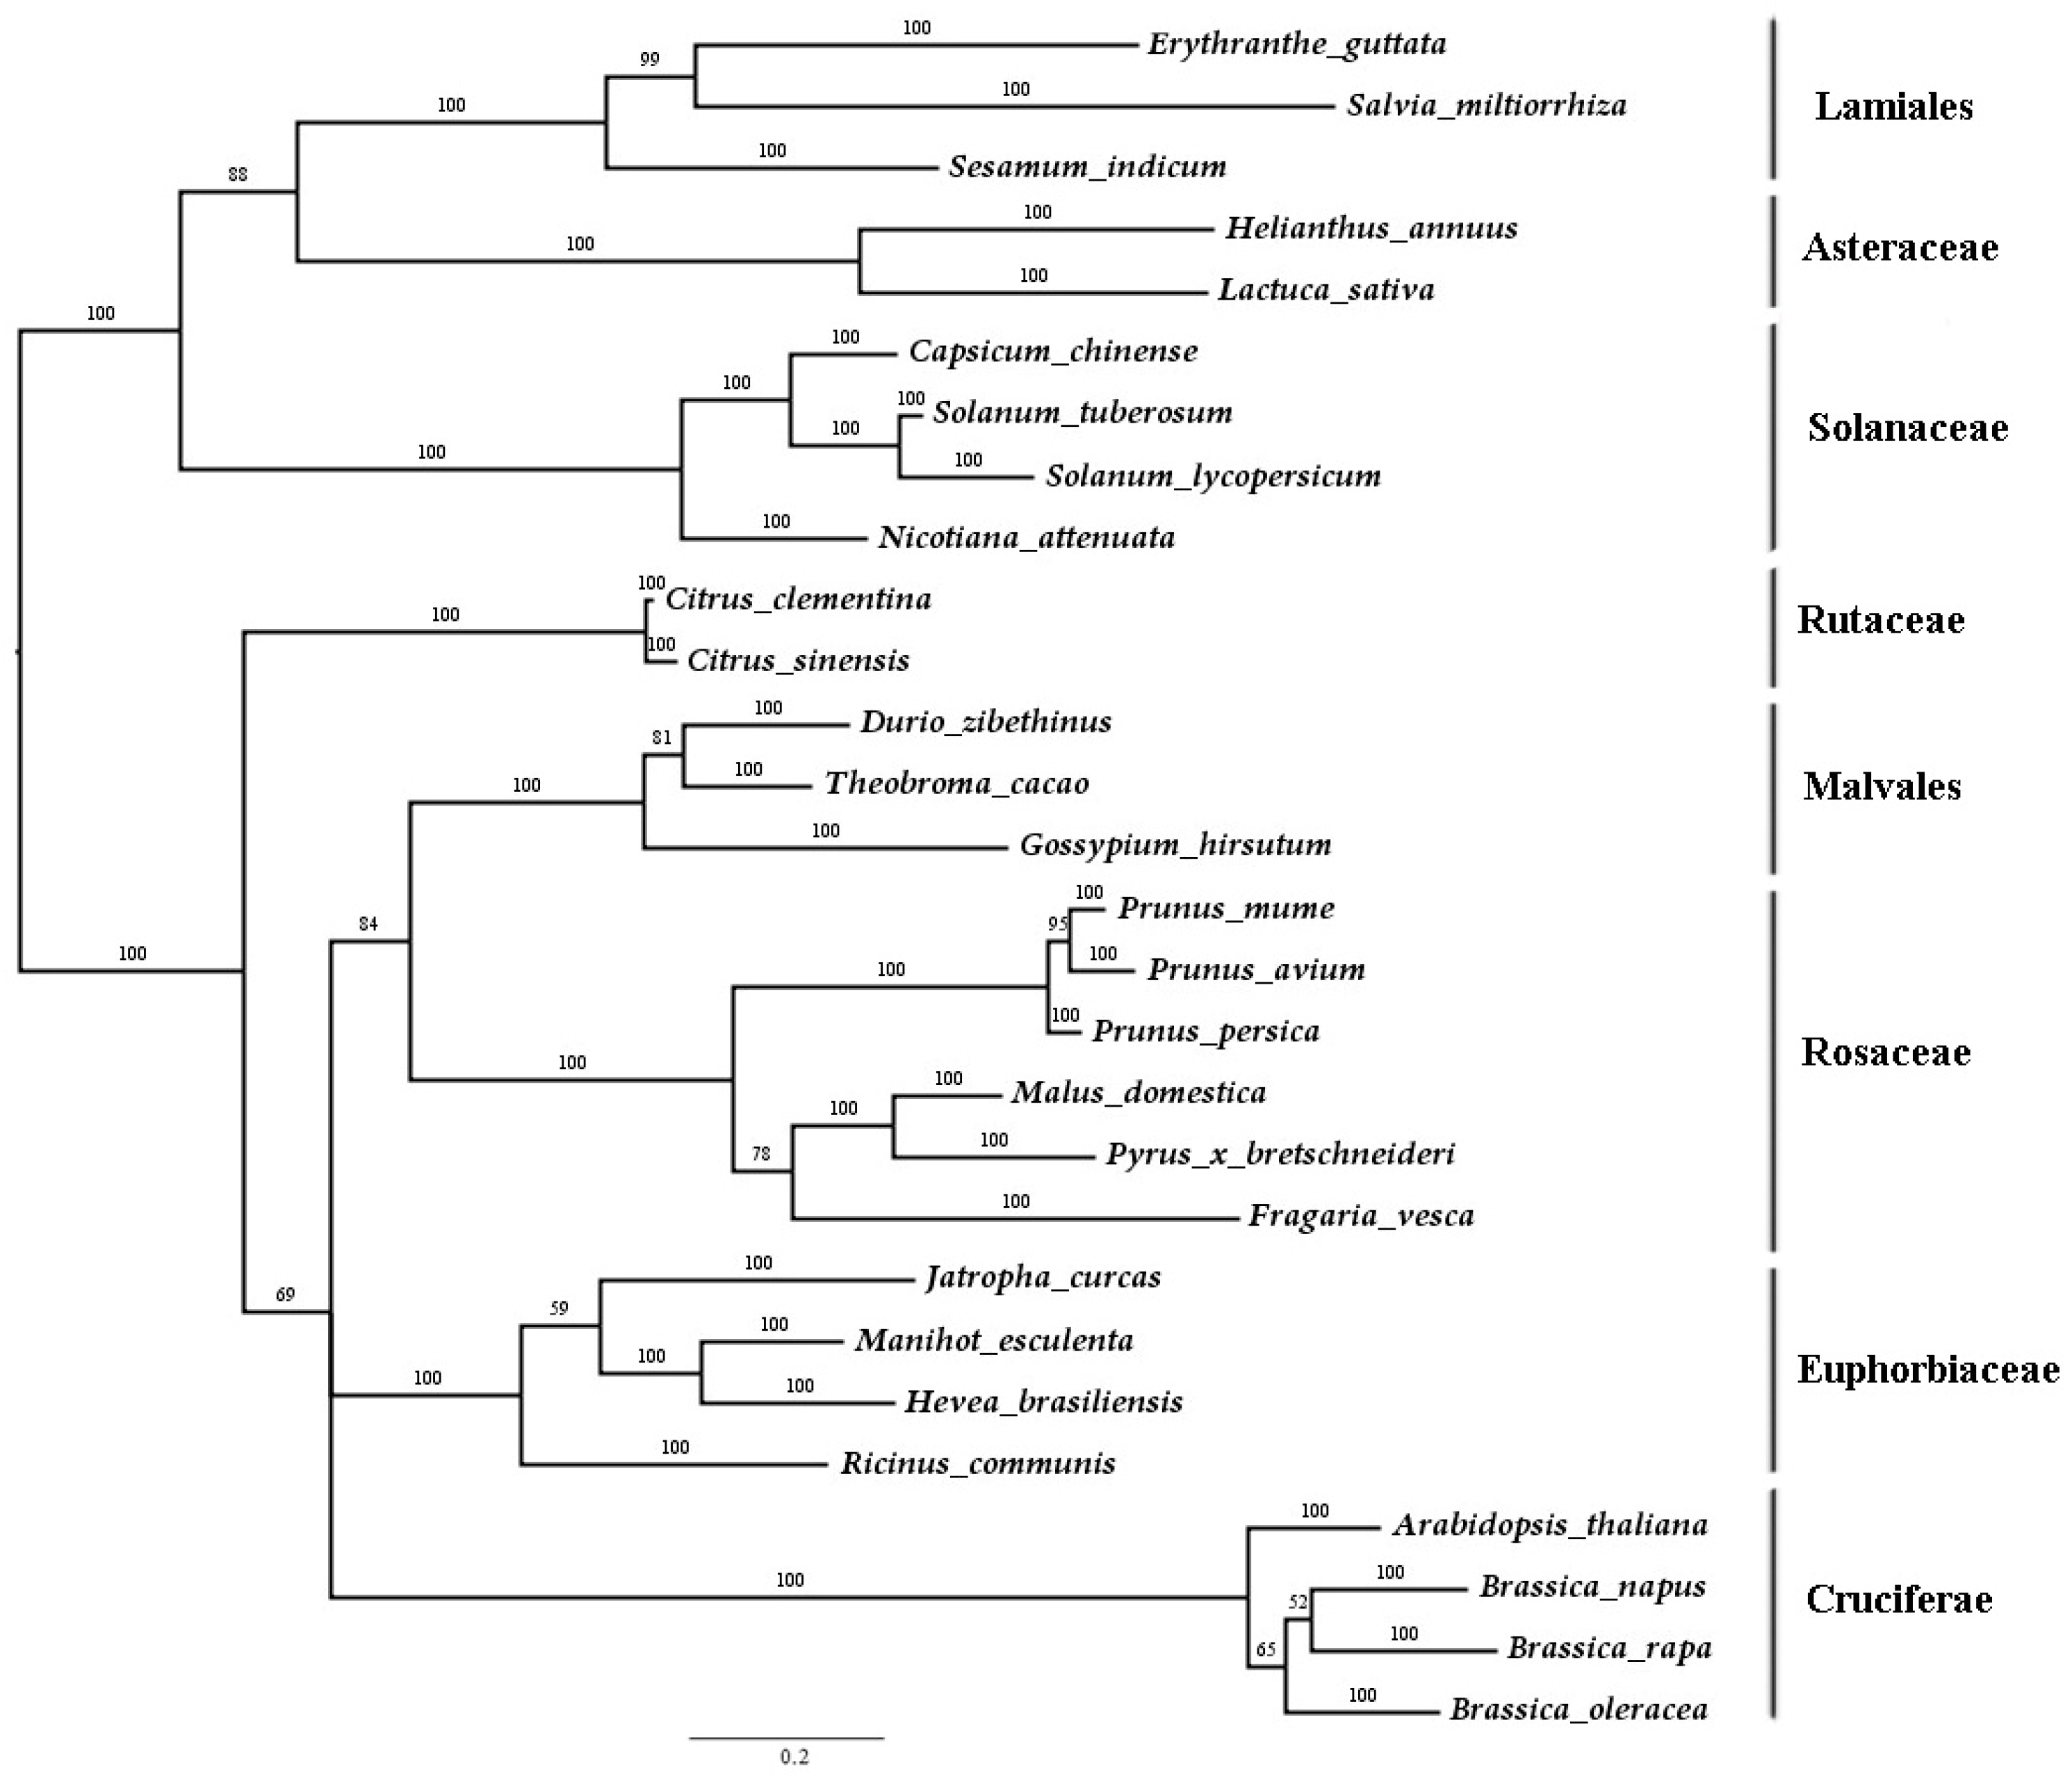
2.1. Isolation and Sequence Analysis of SmJMT
2.2. Generation of Transgenic S. miltiorrhiza Plants
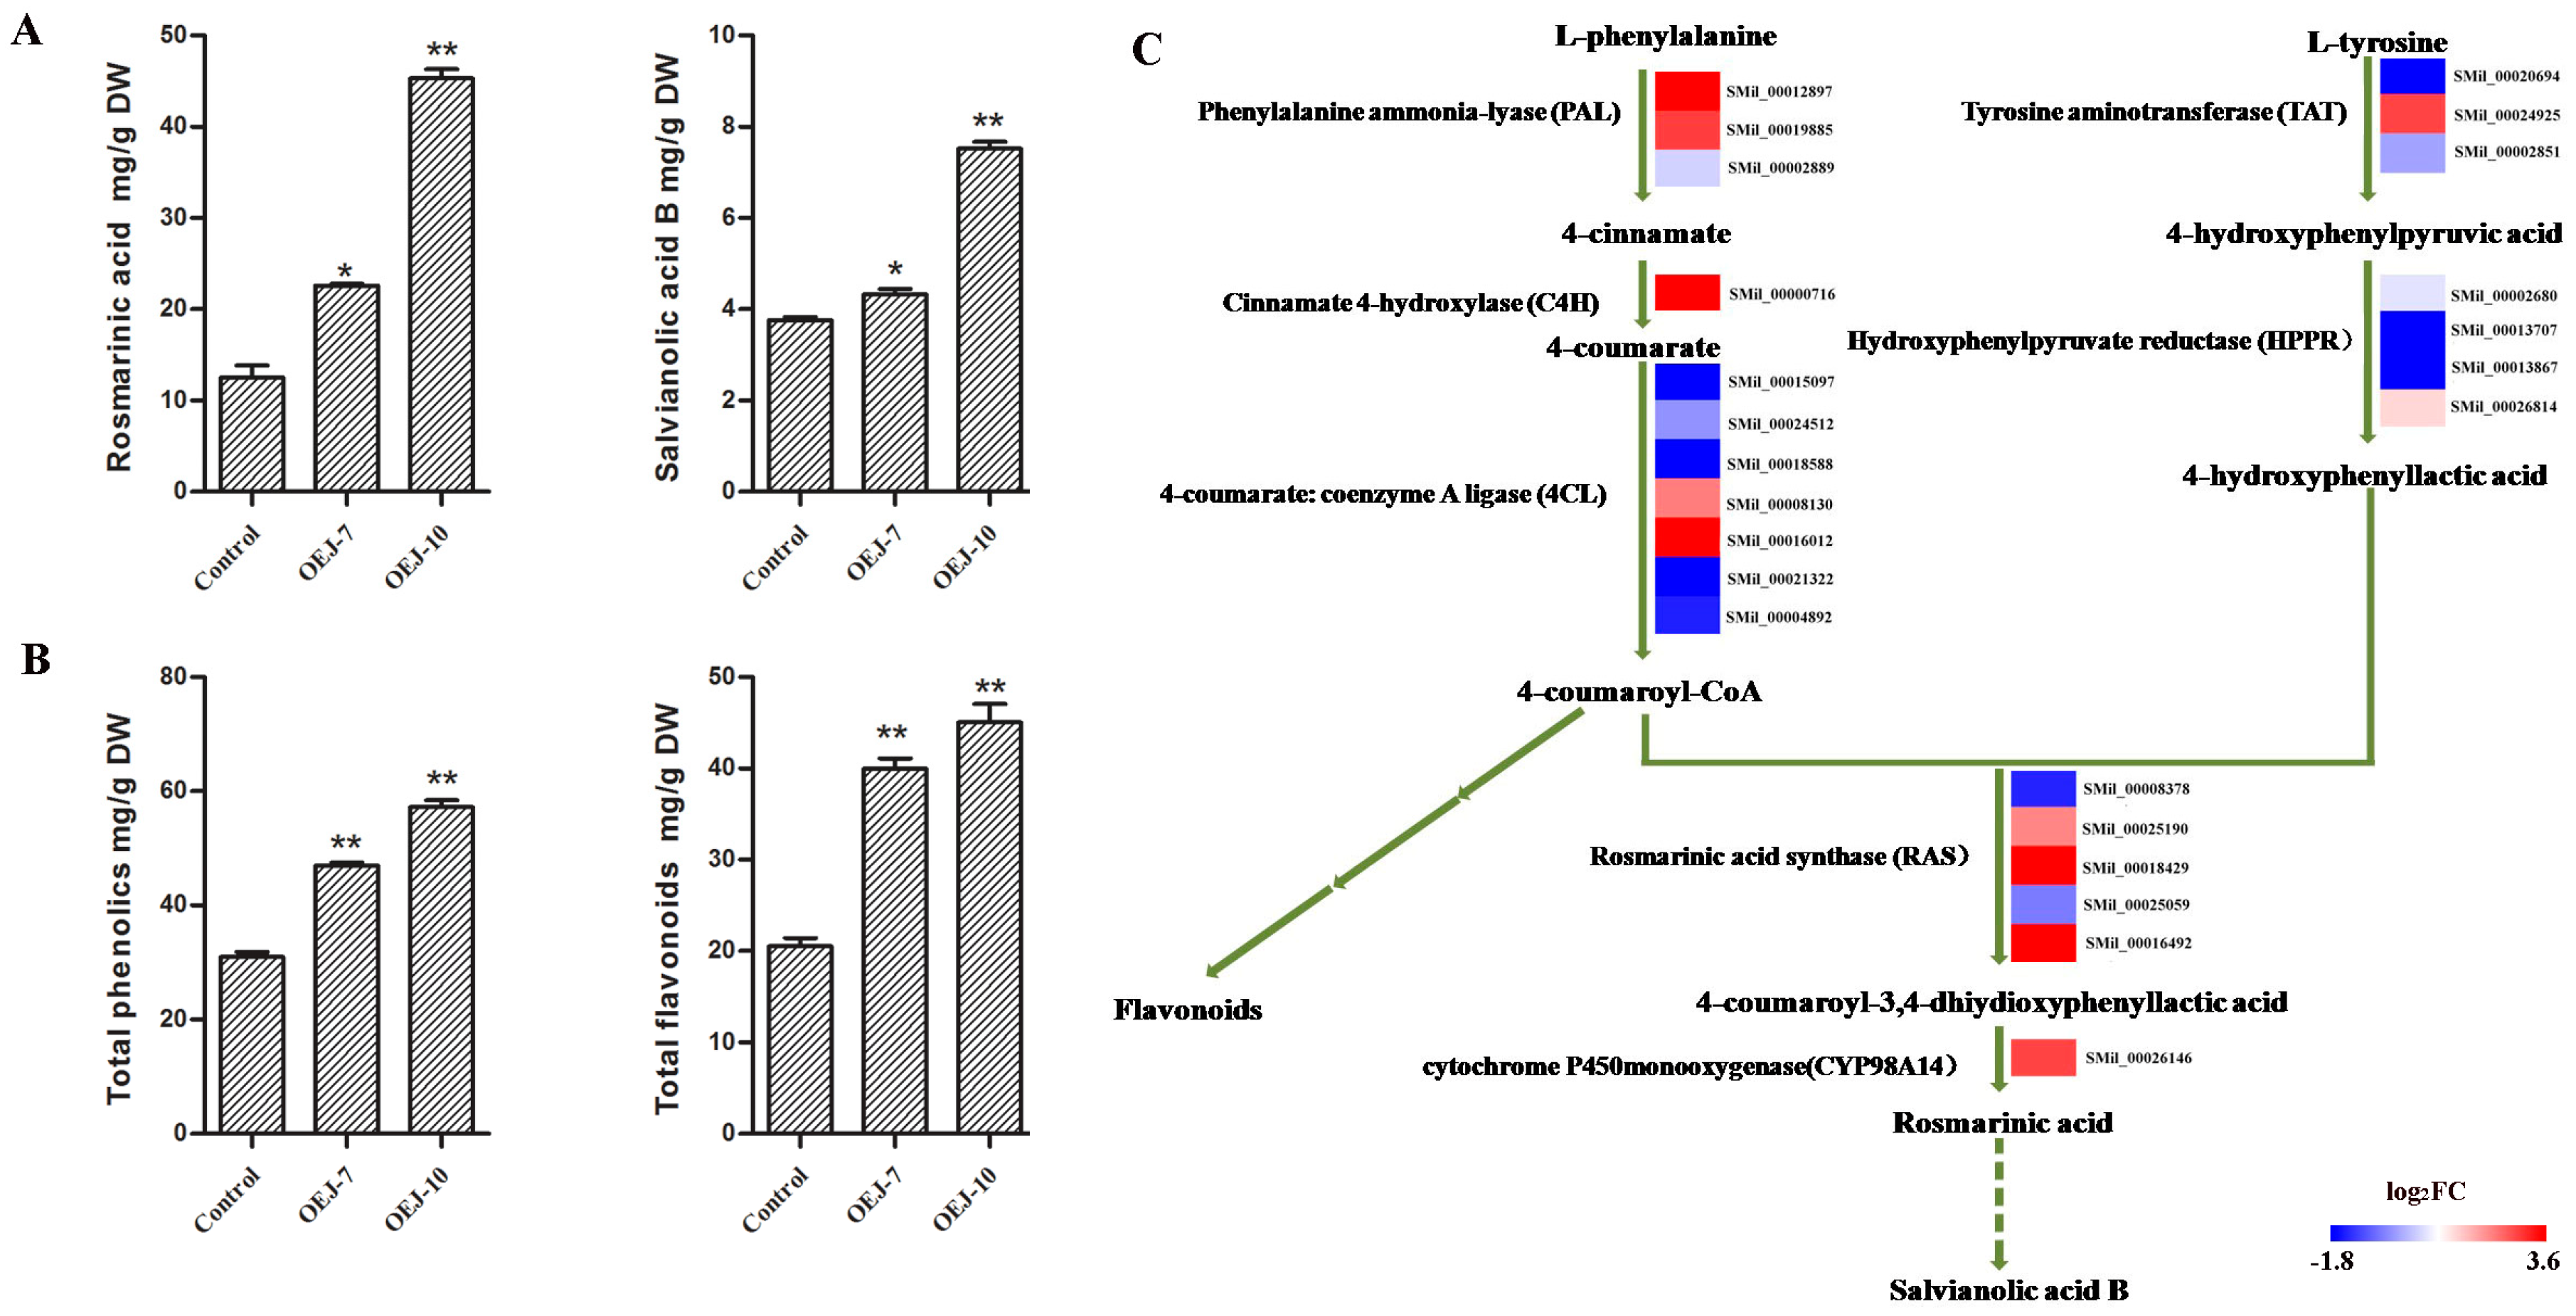
2.3. Overexpression of SmJMT Enhances Production of Salvianolic and Rosmarinic Acids inTransgenic S. miltiorrhiza
2.4. Transgenic Plants Show Higher Levels of Total Phenolics and Total Flavonoids
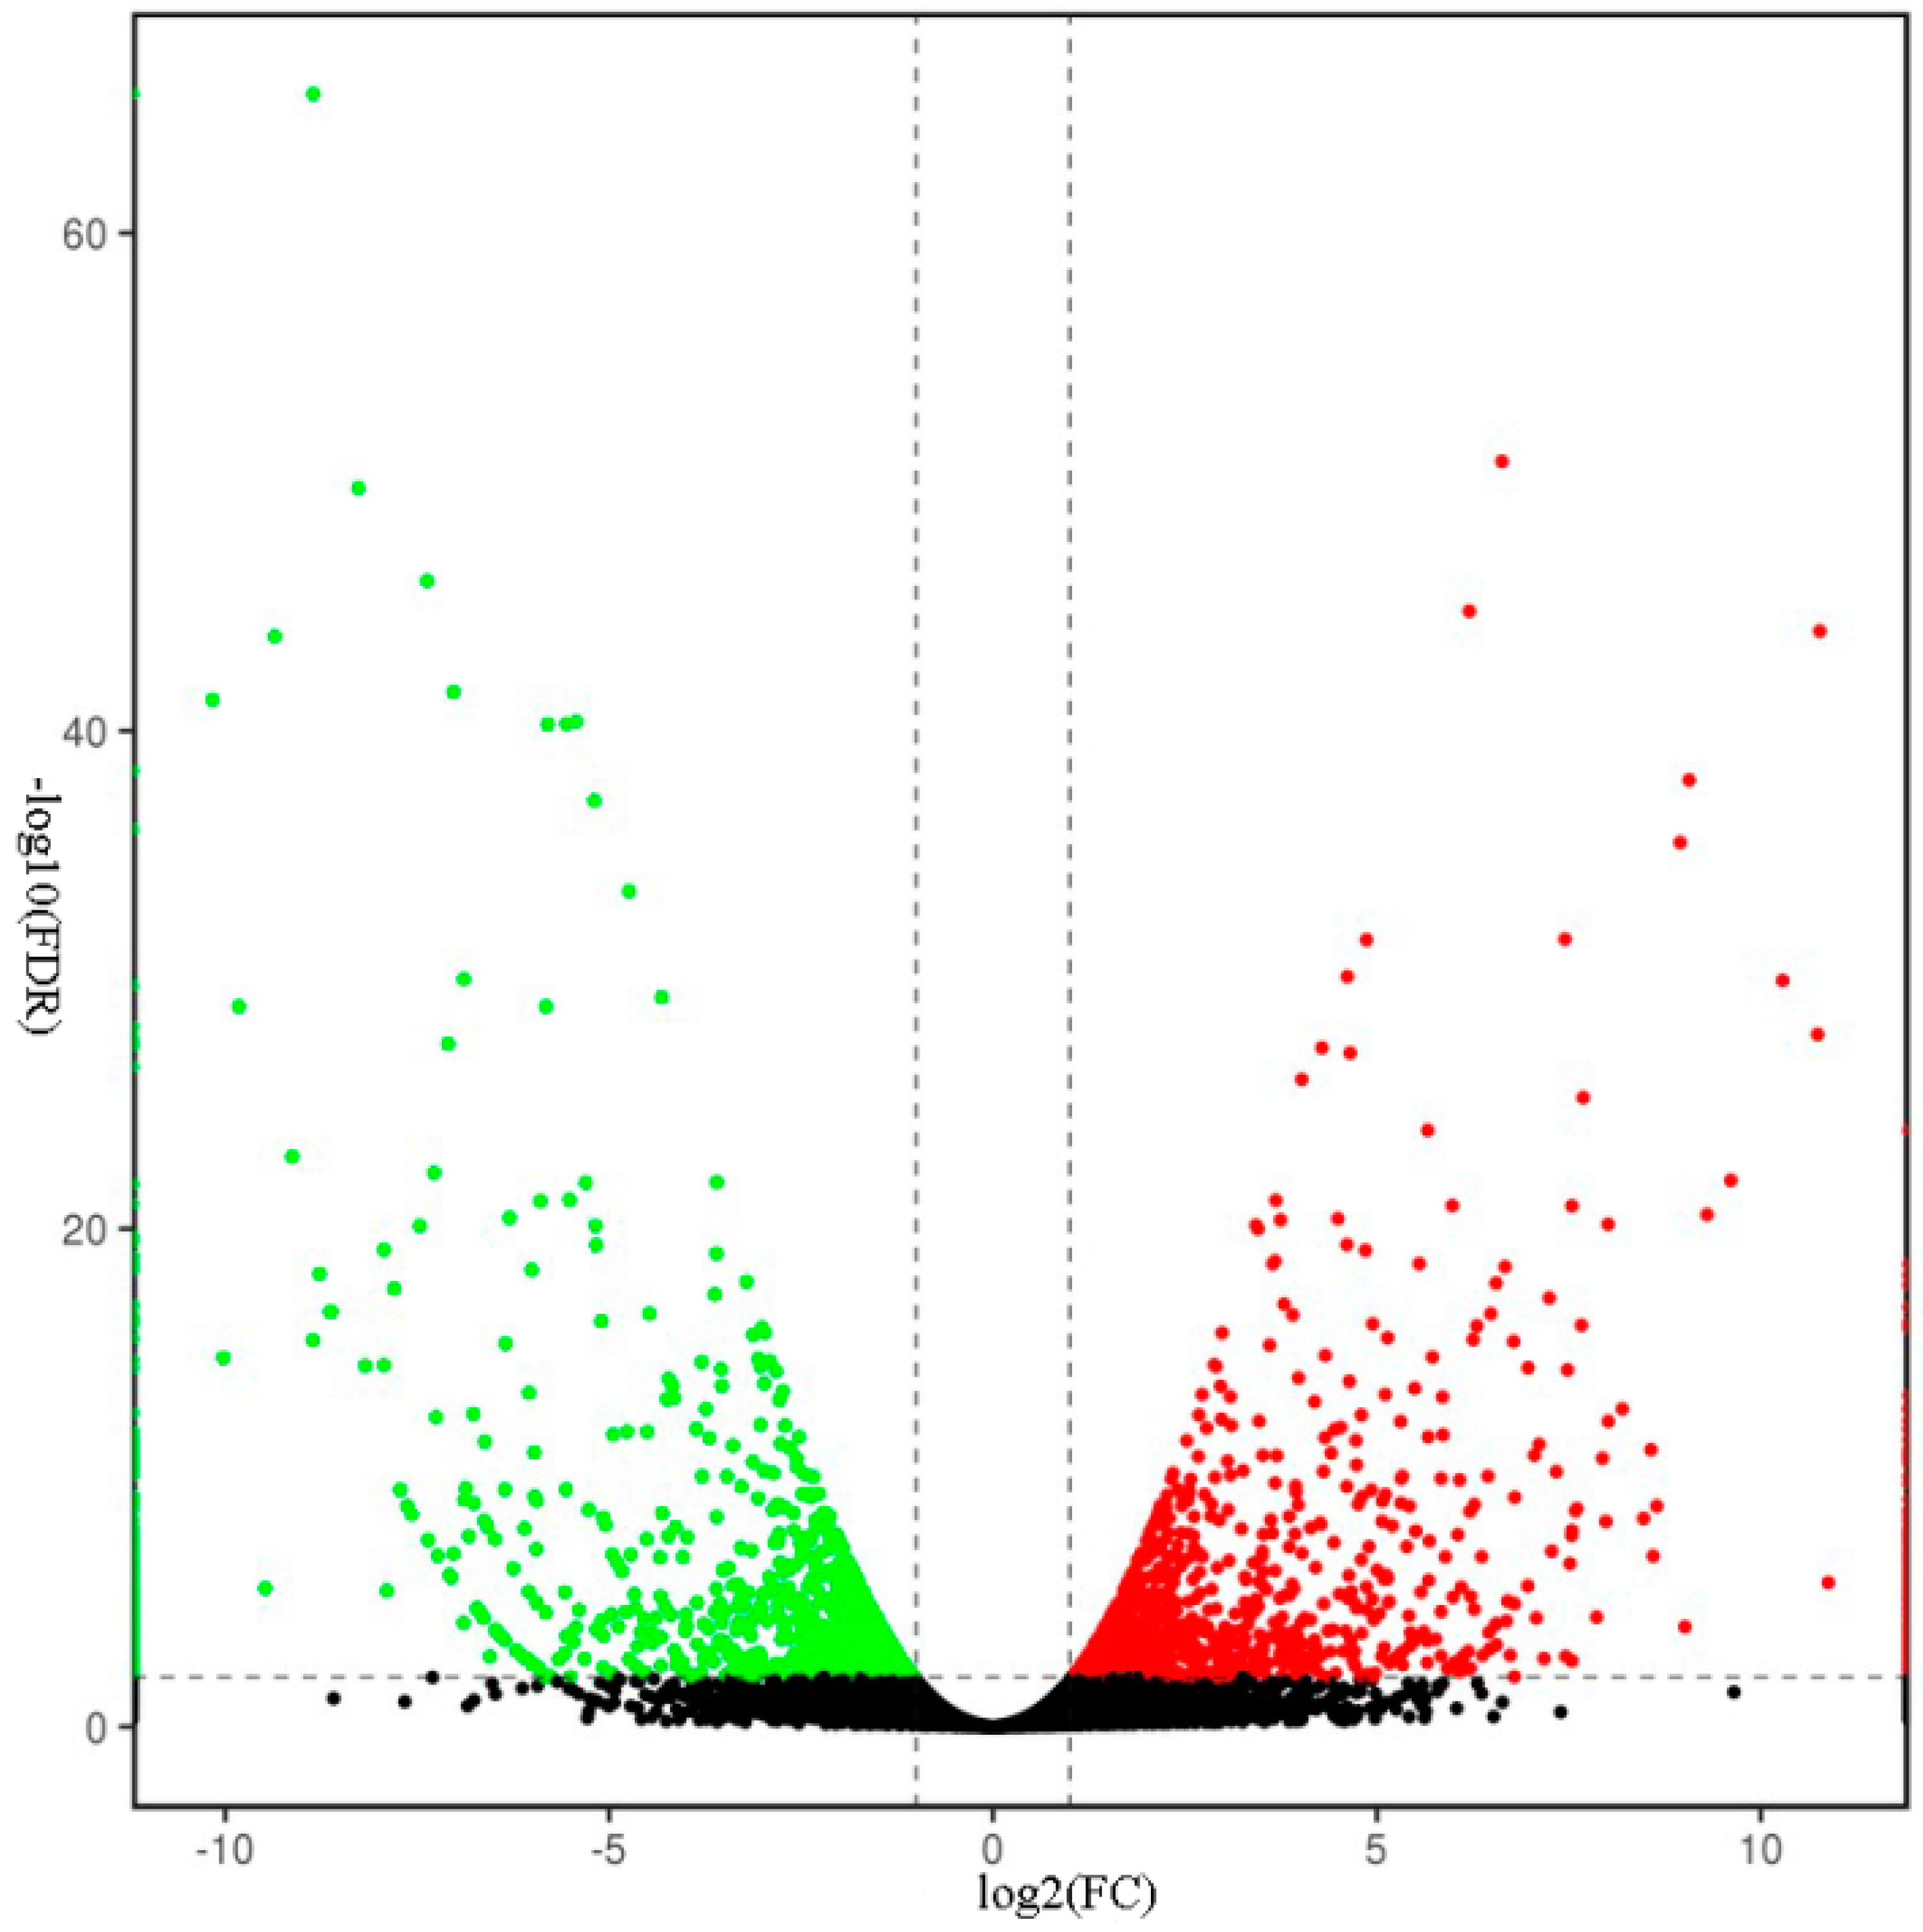
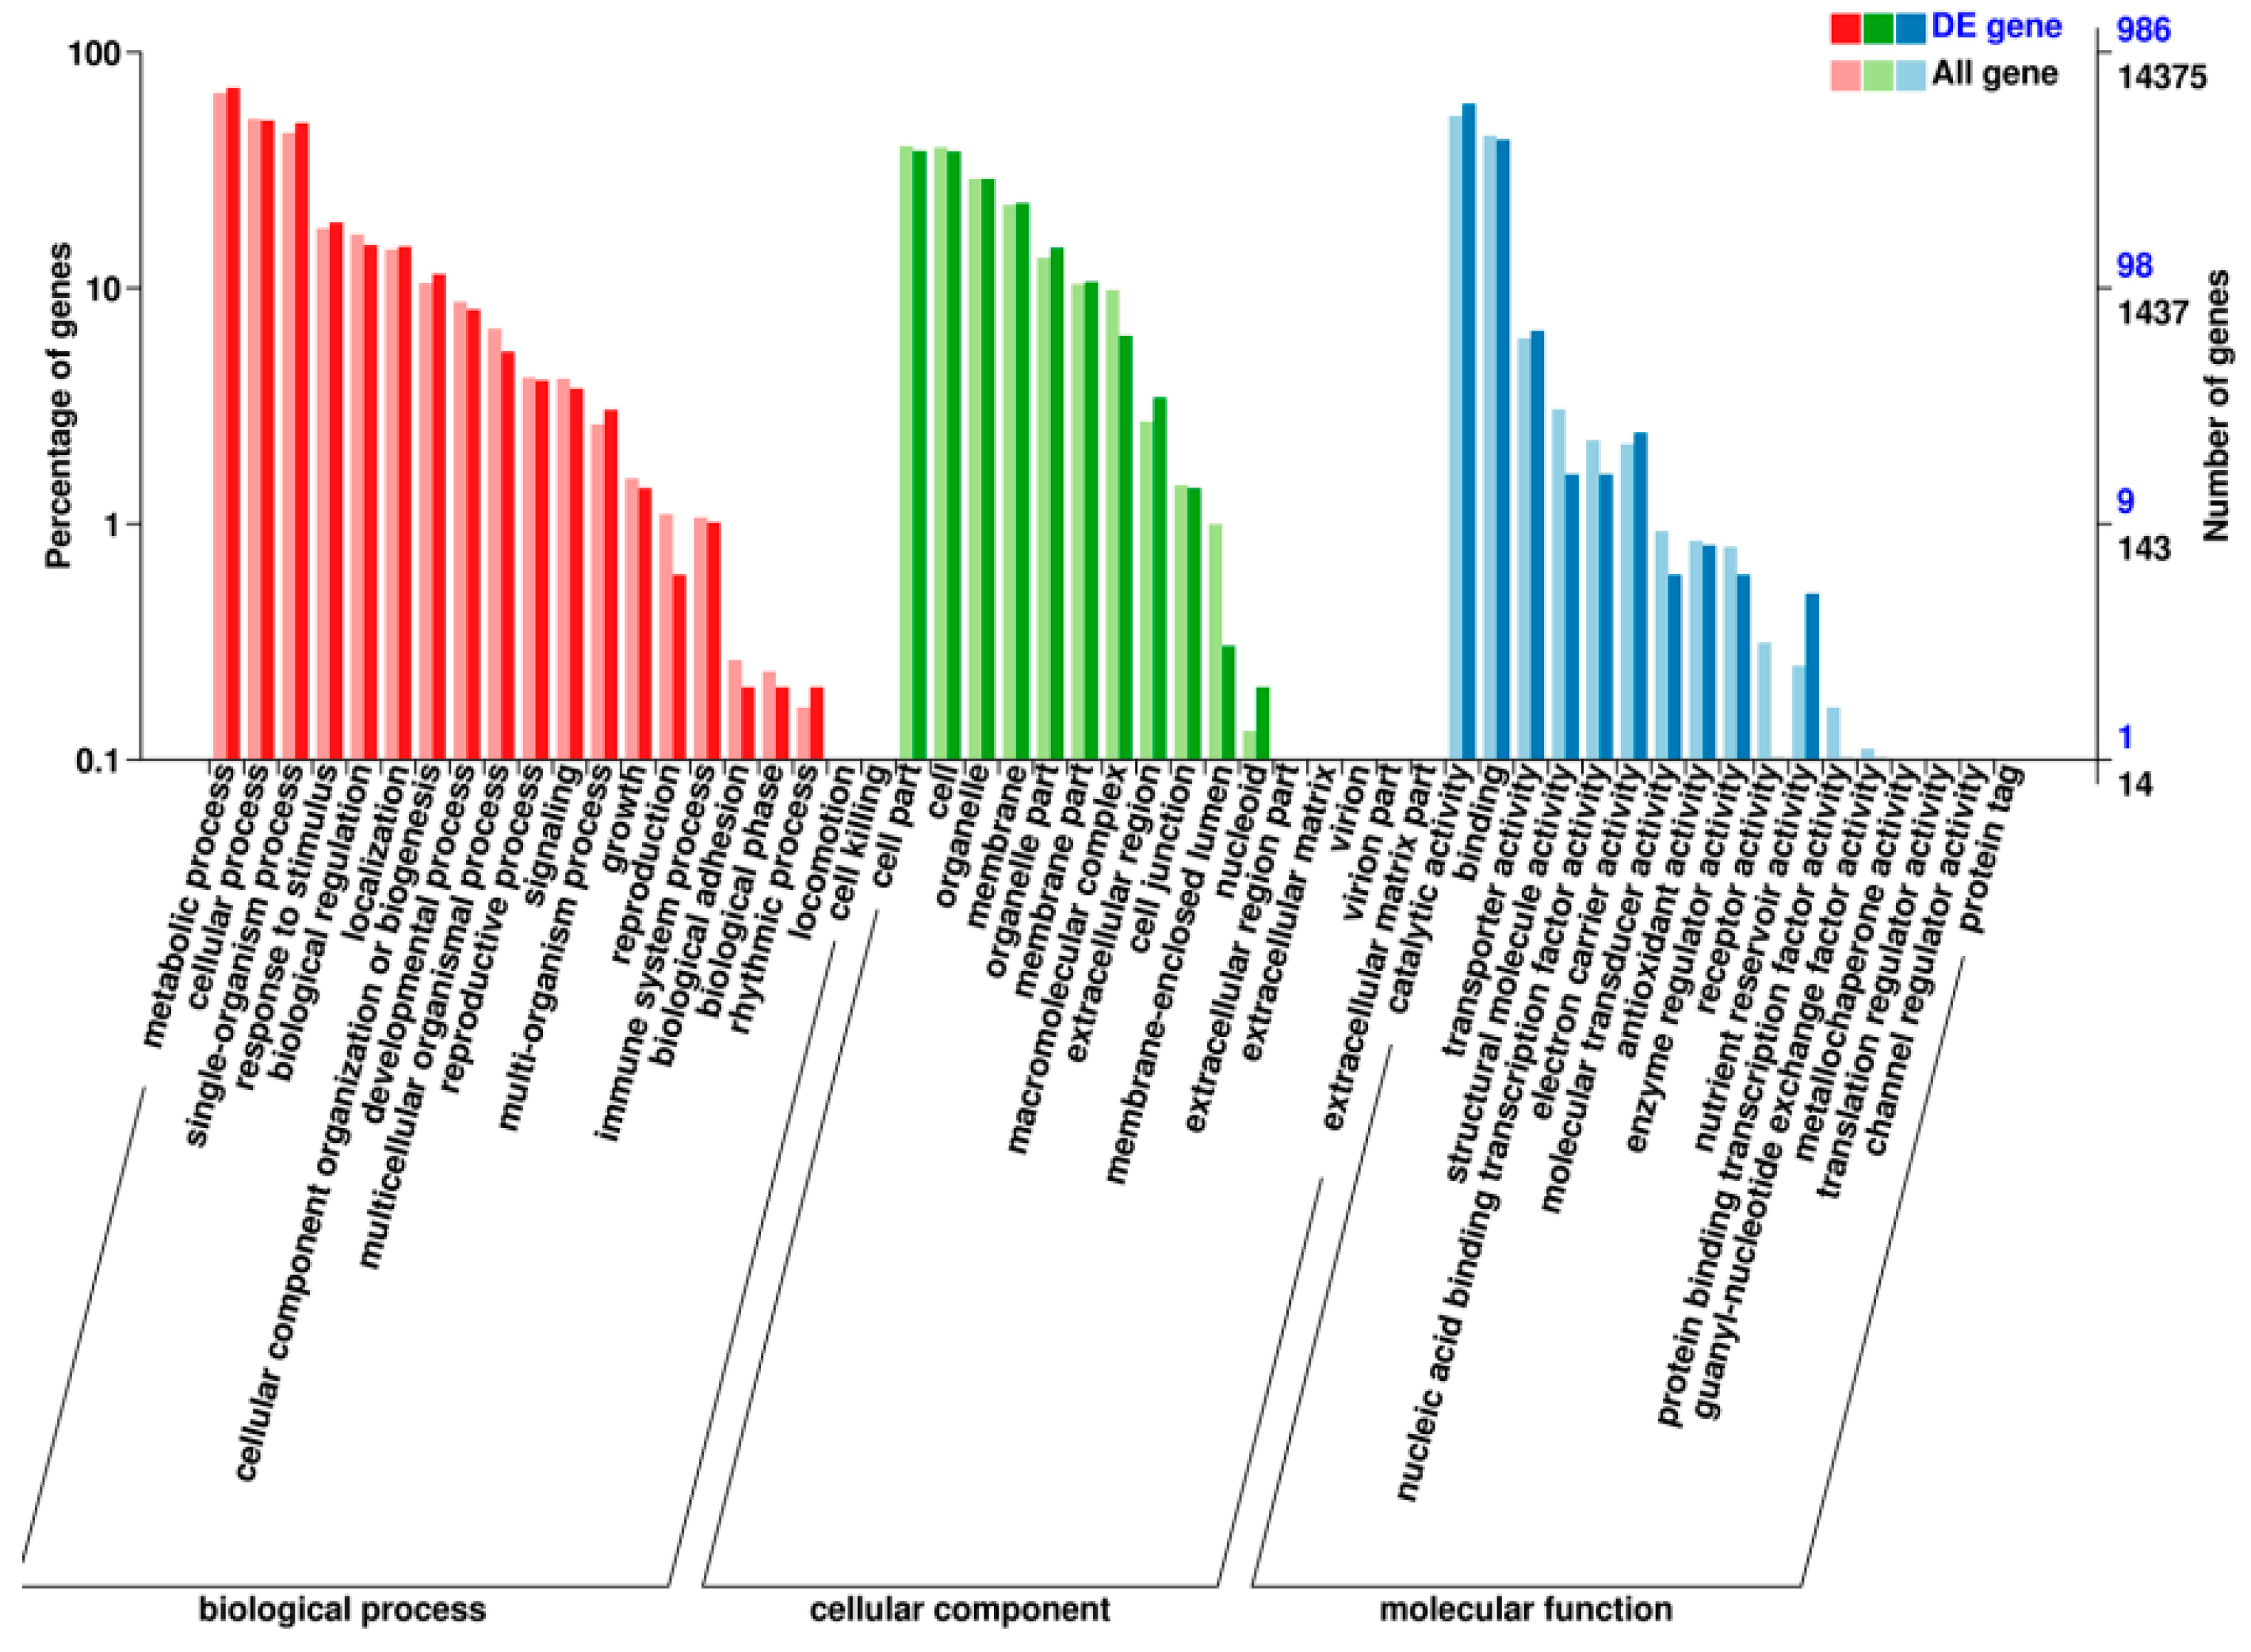
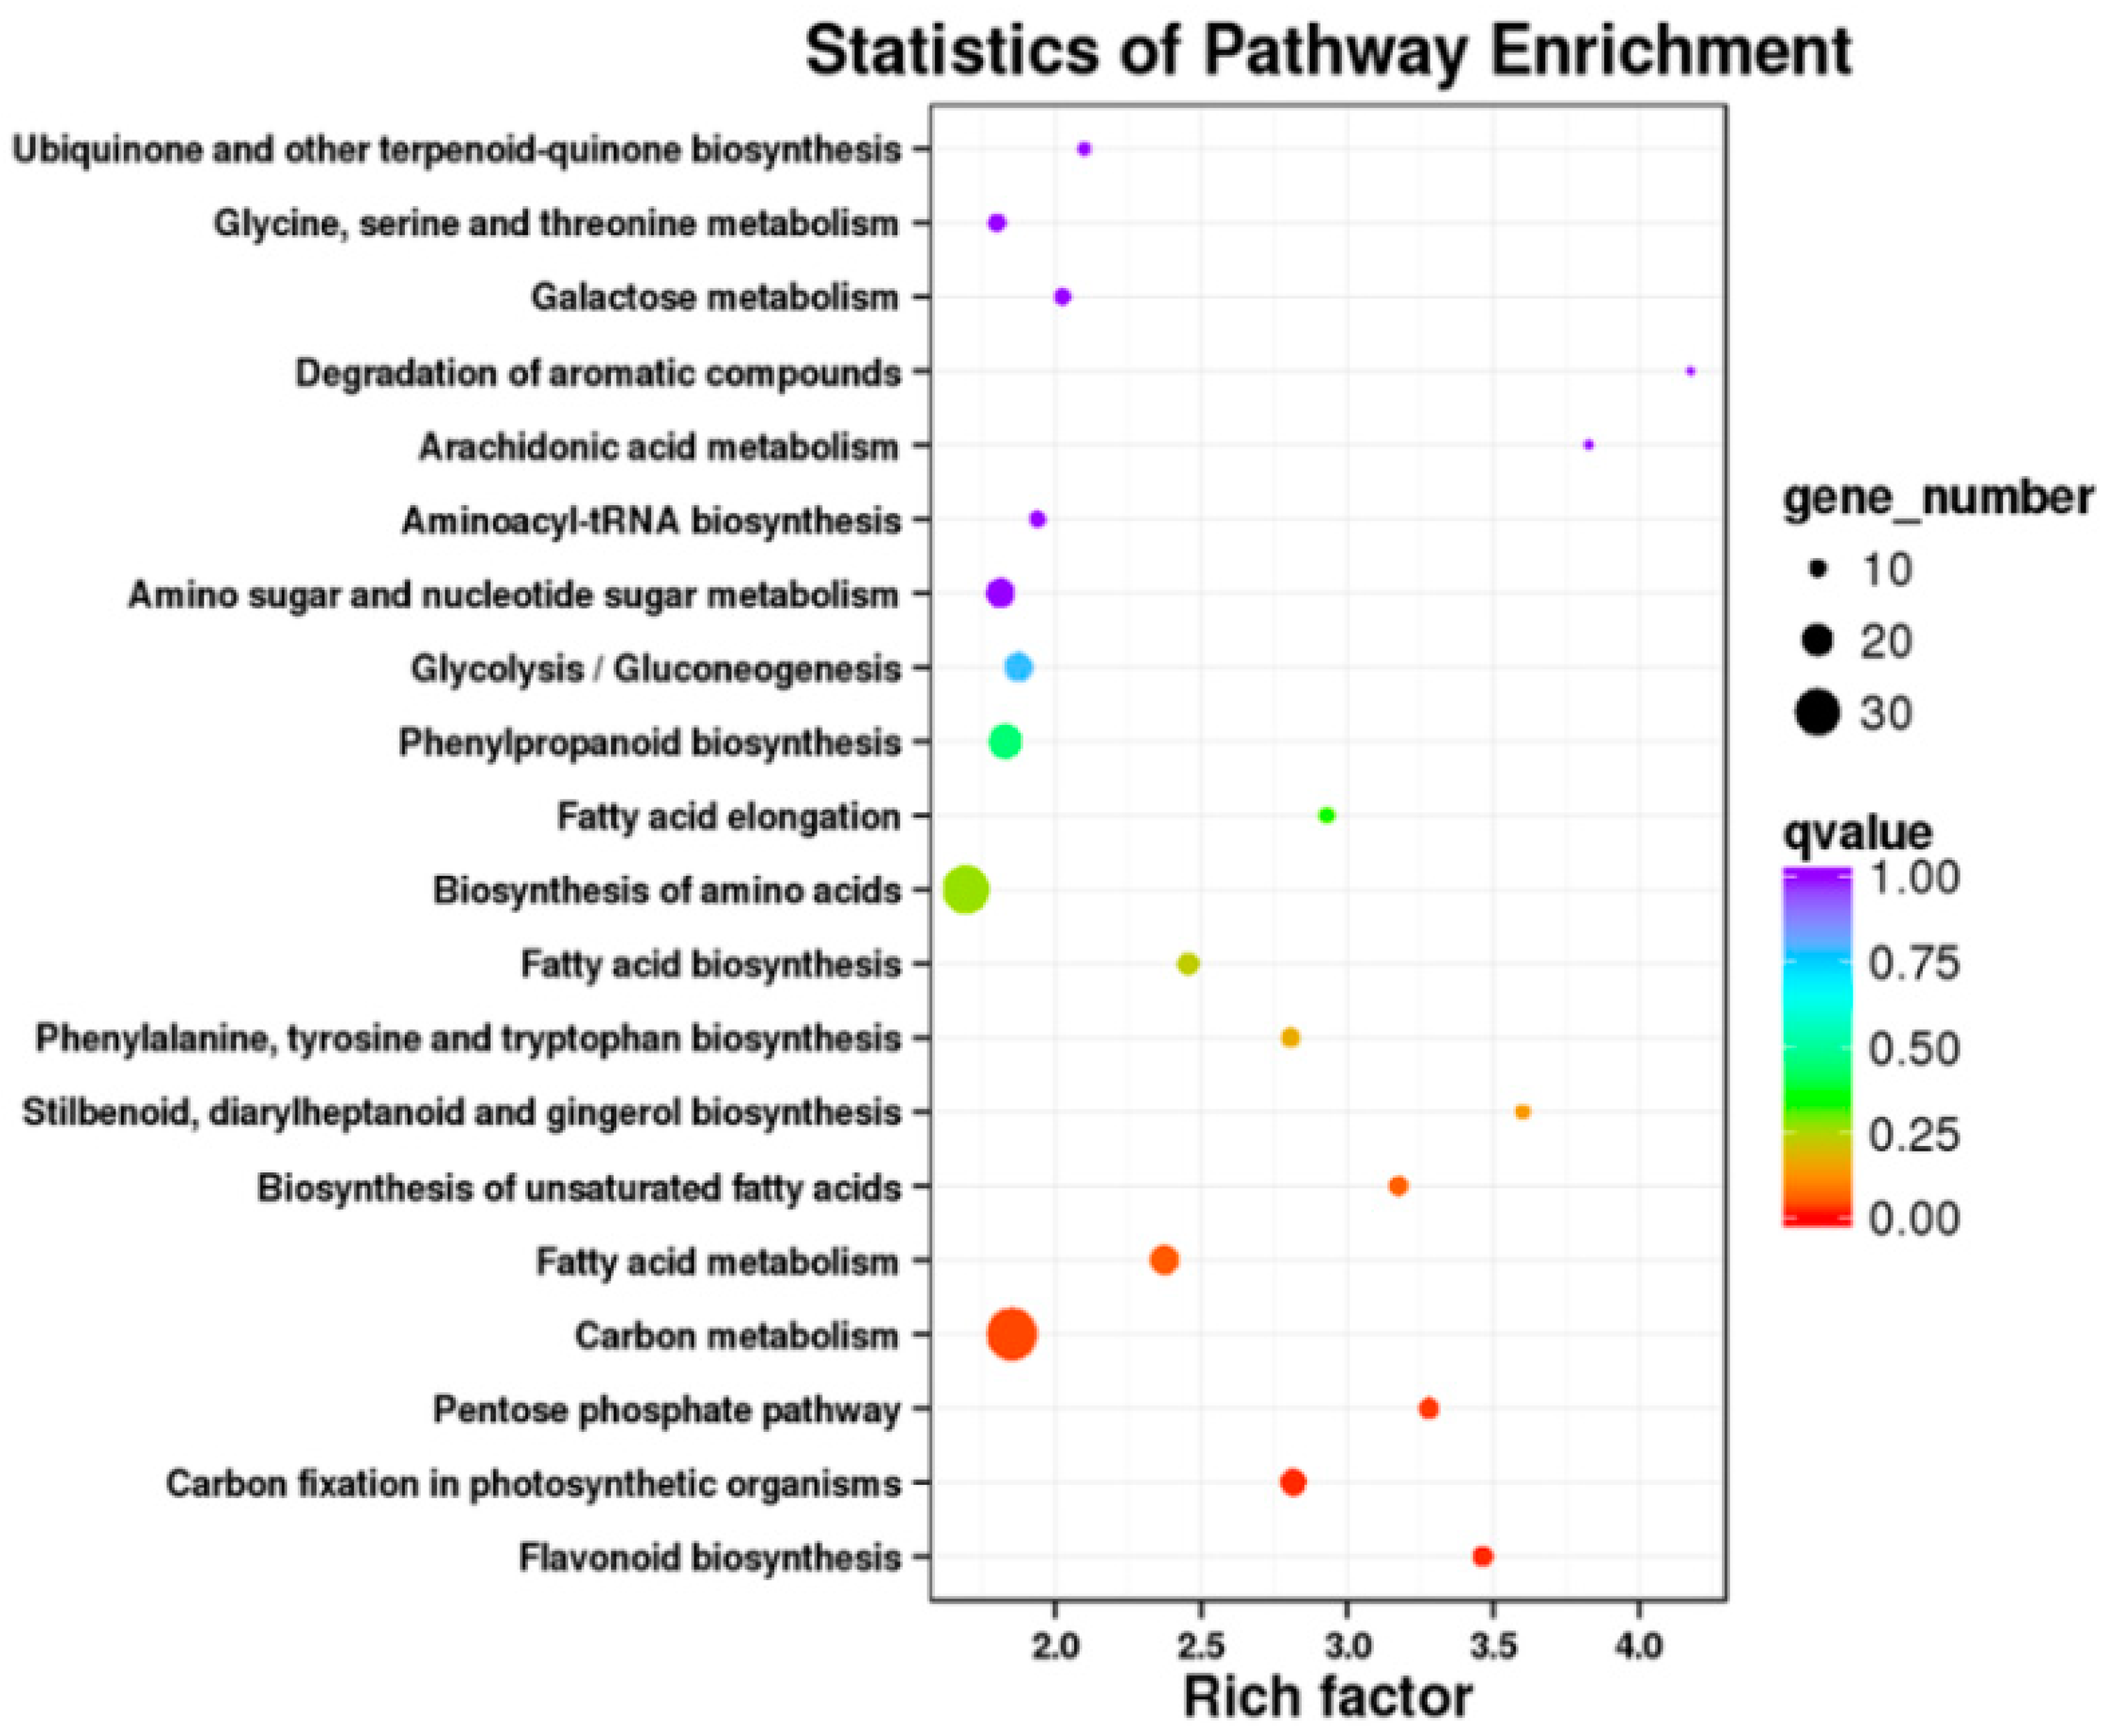
2.5. Transcriptomic Analysis of S. miltiorrhiza SmJMT Overexpression and Control Plants
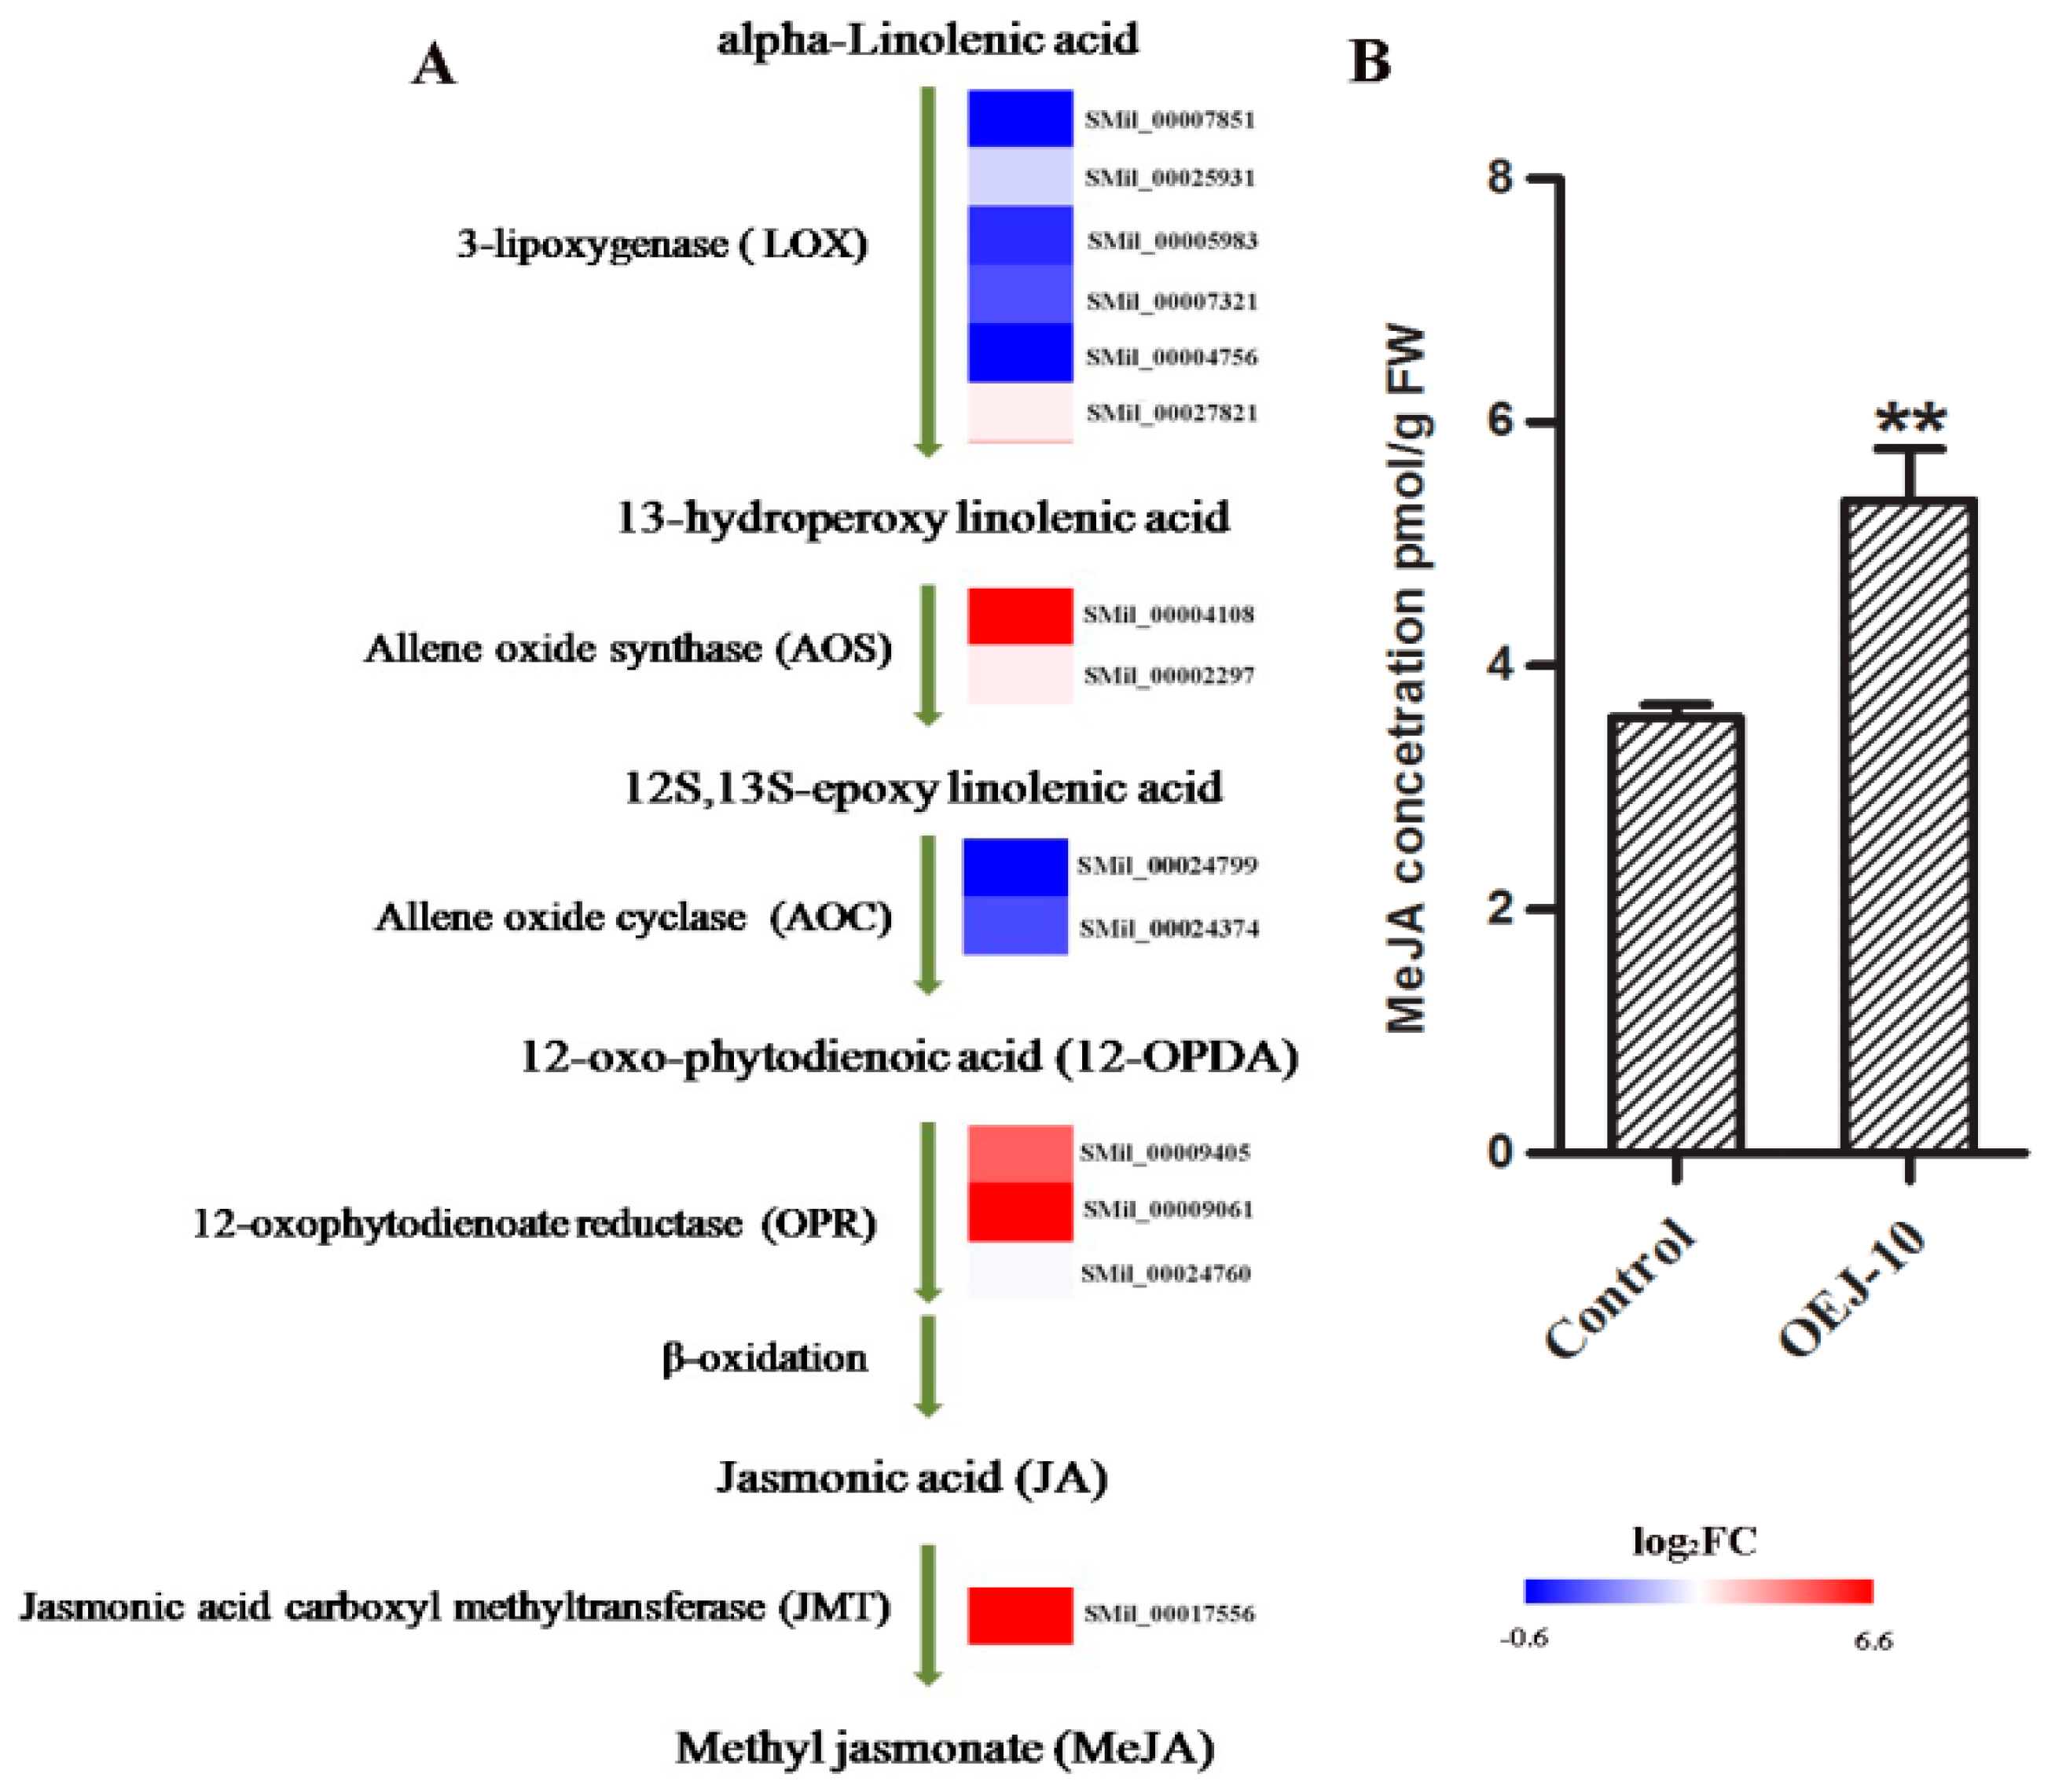
2.6. DEGs Involved in α-Linolenic Acid Metabolism and Determination of Endogenous MeJA Levels
2.7. DEGs Involved in the Pathway for Salvianolic Acid Biosynthesis
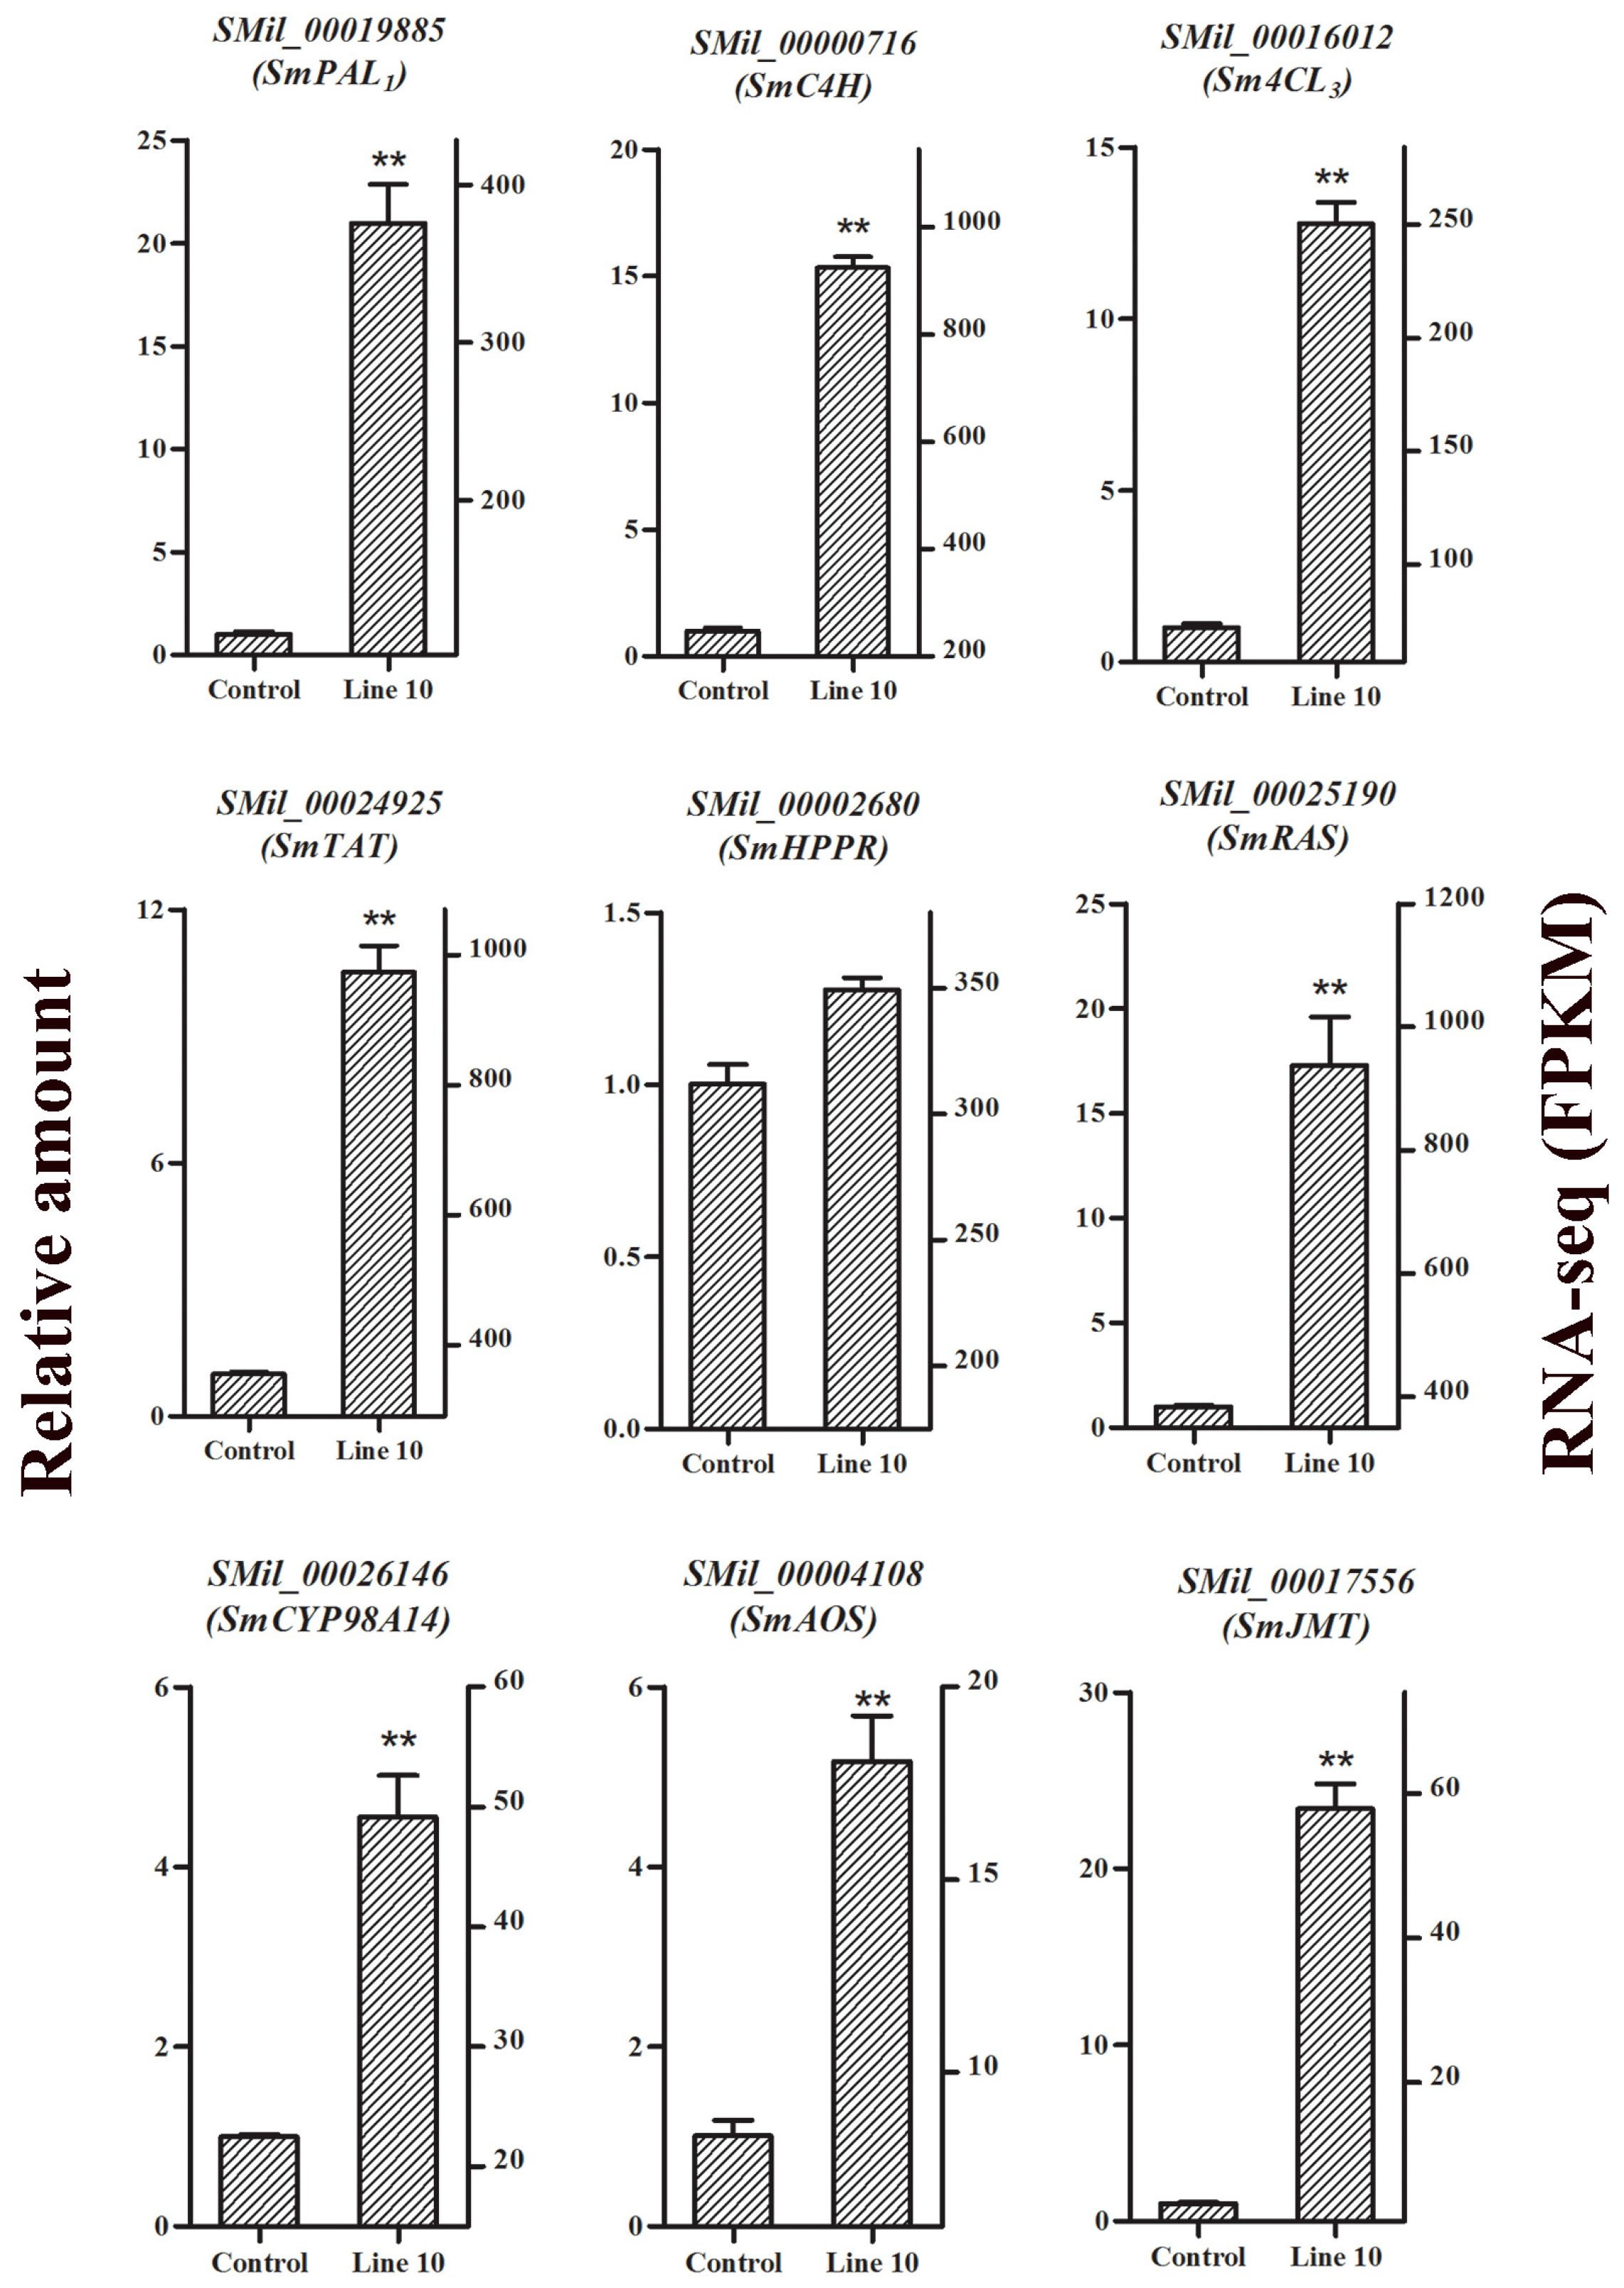
2.8. Confirmation of RNA-Seq Data by qRT-PCR Analysis
3. Discussion
4. Materials and Methods
4.1. Isolation of the SmJMT Gene
4.2. Multiple-Sequence Alignment and Phylogenetic Analysis
4.3. Vector Construction and Transformation
4.4. PCR Detection and qRT-PCR Analysis
4.5. Extraction of MeJA and Determination of Its Concentration
4.6. Extraction of Total Phenolics and Total Flavonoids and Determination of Their Concentrations
4.7. LC/MS Analysis of Phenolic Compounds
4.8. Transcriptome Analysis and Identification of Differentially Expressed Genes (DEGs)
4.9. Verification of RNA-Seq Data by qRT-PCR
Supplementary Materials
Author Contributions
Acknowledgments
Conflicts of Interest
References
- Zhou, L.; Zuo, Z.; Chow, M.S. Danshen: An overview of its chemistry, pharmacology, pharmacokinetics, and clinical use. J. Clin. Pharmacol. 2005, 45, 1345–1359. [Google Scholar] [CrossRef] [PubMed]
- Geng, Z.H.; Huang, L.; Song, M.B.; Song, Y.M. Cardiovascular effects in vitro of a polysaccharide from Salvia miltiorrhiza. Carbohydr. Polym. 2015, 121, 241–247. [Google Scholar] [CrossRef] [PubMed]
- Wang, Q.H.; Chen, A.H. Salviae Miltiorrhiza: A Model Organism for Chinese Traditional Medicine Genomic Studies. Acta Chin. Med. Pharmacol. 2009, 37, 1–4. [Google Scholar]
- Xu, H.; Song, J.; Luo, H.; Zhang, Y.; Li, Q.; Zhu, Y.; Xu, J.; Li, Y.; Song, C.; Wang, B. Analysis of the genome sequence of the medicinal plant Salvia miltiorrhiza. Mol. Plant 2016, 9, 949–952. [Google Scholar] [CrossRef] [PubMed]
- Ma, Y.; Yuan, L.; Wu, B.; Li, X.; Chen, S.; Lu, S. Genome-wide identification and characterization of novel genes involved in terpenoid biosynthesis in Salvia miltiorrhiza. J. Exp. Bot. 2012, 63, 2809–2823. [Google Scholar] [CrossRef] [PubMed] [Green Version]
- Ho, J.H.; Hong, C.Y. Salvianolic acids: Small compounds with multiple mechanisms for cardiovascular protection. J. Biomed. Sci. 2011, 18, 30. [Google Scholar] [CrossRef] [PubMed]
- Zhang, Y.; Yan, Y.-P.; Wu, Y.-C.; Hua, W.-P.; Chen, C.; Ge, Q.; Wang, Z.-Z. Pathway engineering for phenolic acid accumulations in Salvia miltiorrhiza by combinational genetic manipulation. Metab. Eng. 2014, 21, 71–80. [Google Scholar] [CrossRef] [PubMed]
- Wang, B.; Sun, W.; Li, Q.; Li, Y.; Luo, H.; Song, J.; Sun, C.; Qian, J.; Zhu, Y.; Hayward, A.; et al. Genome-wide identification of phenolic acid biosynthetic genes in Salvia miltiorrhiza. Planta 2015, 241, 711–725. [Google Scholar] [CrossRef] [PubMed]
- Xiao, Y.; Gao, S.; Di, P.; Chen, J.; Chen, W.; Zhang, L. Methyl jasmonate dramatically enhances the accumulation of phenolic acids in Salvia miltiorrhiza hairy root cultures. Physiol. Plant. 2009, 137, 1–9. [Google Scholar] [CrossRef] [PubMed]
- Zhou, Y.J.; Gao, W.; Rong, Q.; Jin, G.; Chu, H.; Liu, W.; Yang, W.; Zhu, Z.; Li, G.; Zhu, G.; et al. Modular pathway engineering of diterpenoid synthases and the mevalonic acid pathway for miltiradiene production. J. Am. Chem. Soc. 2012, 134, 3234–3241. [Google Scholar] [CrossRef] [PubMed]
- Avanci, N.C.; Luche, D.D.; Goldman, G.H.; Goldman, M.H. Jasmonates are phytohormones with multiple functions, including plant defense and reproduction. Genet. Mol. Res. 2010, 9, 484–505. [Google Scholar] [CrossRef] [PubMed]
- Cheong, J.J.; Choi, Y.D. Methyl jasmonate as a vital substance in plants. Trends Genet. 2003, 19, 409–413. [Google Scholar] [CrossRef]
- Creelman, R.A.; Mullet, J.E. Jasmonic acid distribution and action in plants: Regulation during development and response to biotic and abiotic stress. Proc. Natl. Acad. Sci. USA 1995, 92, 4114–4119. [Google Scholar] [CrossRef] [PubMed]
- Creelman, R.A.; Mullet, J.E. Biosynthesis and Action of Jasmonates in Plants. Annu. Rev. Plant Physiol. Plant Mol. Biol. 1997, 48, 355–381. [Google Scholar] [CrossRef] [PubMed]
- Creelman, R.A.; Mullet, J.E. Oligosaccharins, brassinolides, and jasmonates: Nontraditional regulators of plant growth, development, and gene expression. Plant Cell 1997, 9, 1211–1223. [Google Scholar] [CrossRef] [PubMed]
- Beale, M.H.; Ward, J.L. Jasmonates: Key players in the plant defence. Nat. Prod. Rep. 1998, 15, 533–548. [Google Scholar] [CrossRef] [PubMed]
- Preuss, A.; Augustin, C.; Figueroa, C.R.; Hoffmann, T.; Valpuesta, V.; Sevilla, J.F.; Schwab, W. Expression of a functional jasmonic acid carboxyl methyltransferase is negatively correlated with strawberry fruit development. J. Plant Physiol. 2014, 171, 1315–1324. [Google Scholar] [CrossRef] [PubMed]
- Sasaki, Y.; Asamizu, E.; Shibata, D.; Nakamura, Y.; Kaneko, T.; Awai, K.; Amagai, M.; Kuwata, C.; Tsugane, T.; Masuda, T. Monitoring of Methyl Jasmonate-responsive Genes in Arabidopsis by cDNA Macroarray: Self-activation of Jasmonic Acid Biosynthesis and Crosstalk with Other Phytohormone Signaling Pathways. DNA Res. 2001, 8, 153–161. [Google Scholar] [CrossRef] [PubMed] [Green Version]
- Delker, C.; Stenzel, I.; Hause, B.; Miersch, O.; Feussner, I.; Wasternack, C. Jasmonate biosynthesis in Arabidopsis thaliana—Enzymes, products, regulation. Plant Biol. 2006, 8, 297–306. [Google Scholar] [CrossRef] [PubMed]
- Wang, B.; Wang, S.; Wang, Z. Genome-Wide Comprehensive Analysis the Molecular Phylogenetic Evaluation and Tissue-Specific Expression of SABATH Gene Family in Salvia miltiorrhiza. Genes 2017, 8, 365. [Google Scholar] [CrossRef] [PubMed]
- Seo, H.S.; Song, J.T.; Cheong, J.J.; Lee, Y.H.; Lee, Y.W.; Hwang, I.; Lee, J.S.; Choi, Y.D. Jasmonic acid carboxyl methyltransferase: A key enzyme for jasmonate-regulated plant responses. Proc. Natl. Acad. Sci. USA 2001, 98, 4788–4793. [Google Scholar] [CrossRef] [PubMed] [Green Version]
- Min, S.S.; Dong, G.K.; Sun, H.L. Isolation and characterization of a jasmonic acid carboxyl methyltransferase gene from hot pepper (Capsicum annuum L.). J. Plant Biol. 2005, 48, 292–297. [Google Scholar]
- Zhao, N.; Yao, J.; Chaiprasongsuk, M.; Li, G.; Guan, J.; Tschaplinski, T.J.; Guo, H.; Chen, F. Molecular and biochemical characterization of the jasmonic acid methyltransferase gene from black cottonwood (Populus trichocarpa). Phytochemistry 2013, 94, 74–81. [Google Scholar] [CrossRef] [PubMed]
- Qi, J.; Li, J.; Han, X.; Li, R.; Wu, J.; Yu, H.; Hu, L.; Xiao, Y.; Lu, J.; Lou, Y. Jasmonic acid carboxyl methyltransferase regulates development and herbivory-induced defense response in rice. J. Integr. Plant Biol. 2016, 58, 564–576. [Google Scholar] [CrossRef] [PubMed]
- Wu, J.; Wang, L.; Baldwin, I.T. Methyl jasmonate-elicited herbivore resistance: Does MeJA function as a signal without being hydrolyzed to JA? Planta 2008, 227, 1161–1168. [Google Scholar] [CrossRef] [PubMed]
- Sohn, H.B.; Lee, H.Y.; Seo, J.S.; Jung, C.; Jeon, J.H.; Kim, J.-H.; Lee, Y.W.; Lee, J.S.; Cheong, J.-J.; Choi, Y.D. Overexpression of jasmonic acid carboxyl methyltransferase increases tuber yield and size in transgenic potato. Plant Biotechnol. Rep. 2010, 5, 27–34. [Google Scholar] [CrossRef]
- Gundlach, H.; Müller, M.J.; Kutchan, T.M.; Zenk, M.H. Jasmonic acid is a signal transducer in elicitor-induced plant cell cultures. Proc. Natl. Acad. Sci. USA 1992, 89, 2389–2393. [Google Scholar] [CrossRef] [PubMed]
- Luo, H.; Zhu, Y.; Song, J.; Xu, L.; Sun, C.; Zhang, X.; Xu, Y.; He, L.; Sun, W.; Xu, H.; et al. Transcriptional data mining of Salvia miltiorrhiza in response to methyl jasmonate to examine the mechanism of bioactive compound biosynthesis and regulation. Physiol. Plant. 2014, 152, 241–255. [Google Scholar] [CrossRef] [PubMed]
- Wasternack, C. Jasmonates: An Update on Biosynthesis, Signal Transduction and Action in Plant Stress Response, Growth and Development. Ann. Bot. 2007, 100, 681–697. [Google Scholar] [CrossRef] [PubMed] [Green Version]
- Ge, Q.; Zhang, Y.; Hua, W.P.; Wu, Y.C.; Jin, X.X.; Song, S.H.; Wang, Z.Z. Combination of transcriptomic and metabolomic analyses reveals a JAZ repressor in the jasmonate signaling pathway of Salvia miltiorrhiza. Sci. Rep. 2015, 5, 14048. [Google Scholar] [CrossRef] [PubMed] [Green Version]
- Gao, W.; Hillwig, M.L.; Huang, L.; Cui, G.; Wang, X.; Kong, J.; Yang, B.; Peters, R. A functional genomics approach to tanshinone biosynthesis provides stereochemical insights. Org. Lett. 2009, 11, 5170–5173. [Google Scholar] [CrossRef] [PubMed]
- Xiao, Y.; Zhang, L.; Gao, S.; Saechao, S.; Di, P.; Chen, J.; Chen, W. The c4h, tat, hppr and hppd Genes Prompted Engineering of Rosmarinic Acid Biosynthetic Pathway in Salvia miltiorrhiza Hairy Root Cultures. PLoS ONE 2011, 6, e29713. [Google Scholar] [CrossRef] [PubMed]
- Peng, D.; Lei, Z.; Chen, J.; Tan, H.; Ying, X.; Xin, D.; Xun, Z.; Chen, W. 13C Tracer Reveals Phenolic Acids Biosynthesis in Hairy Root Cultures of Salvia miltiorrhiza. ACS Chem. Biol. 2013, 8, 1537–1548. [Google Scholar]
- Chen, C.; Zhang, Y.; Qiakefu, K.; Zhang, X.; Han, L.; Hua, W.; Yan, Y.; Wang, Z. Overexpression of tomato Prosystemin (LePS) enhances pest resistance and the production of tanshinones in Salvia miltiorrhiza Bunge. J. Agric. Food Chem. 2016, 64, 7760–7769. [Google Scholar] [CrossRef] [PubMed]
- Attieh, J.; Djiana, R.; Koonjul, P.; Étienne, C.; Sparace, S.A.; Saini, H.S. Cloning and functional expression of two plant thiol methyltransferases: A new class of enzymes involved in the biosynthesis of sulfur volatiles. Plant Mol. Biol. 2002, 50, 511–521. [Google Scholar] [CrossRef] [PubMed]
- Joshi, C.P.; Chiang, V.L. Conserved sequence motifs in plant S-adenosyl-L-methionine-dependent methyltransferases. Plant Mol. Biol. 1998, 37, 663–674. [Google Scholar] [CrossRef] [PubMed]
- Kagan, R.M.; Clarke, S. Widespread occurrence of three sequence motifs in diverse S-adenosylmethionine-dependent methyltransferases suggests a common structure for these enzymes. Arch. Biochem. Biophys. 1994, 310, 417–427. [Google Scholar] [CrossRef] [PubMed]
- Yang, N.; Zhou, W.; Su, J.; Wang, X.; Li, L.; Wang, L.; Cao, X.; Wang, Z. Overexpression of SmMYC2 Increases the Production of Phenolic Acids in Salvia miltiorrhiza. Front. Plant Sci. 2017, 8, 1804. [Google Scholar] [CrossRef] [PubMed]
- Wenping, H.; Yuan, Z.; Jie, S.; Lijun, Z.; Zhezhi, W. De novo transcriptome sequencing in Salvia miltiorrhiza to identify genes involved in the biosynthesis of active ingredients. Genomics 2011, 98, 272–279. [Google Scholar] [CrossRef] [PubMed]
- Kombrink, E. Chemical and genetic exploration of jasmonate biosynthesis and signaling paths. Planta 2012, 236, 1351–1366. [Google Scholar] [CrossRef] [PubMed]
- Wasternack, C.; Hause, B. Jasmonates: Biosynthesis, perception, signal transduction and action in plant stress response, growth and development. An update to the 2007 review in Annals of Botany. Ann. Bot. 2013, 111, 1021–1058. [Google Scholar] [CrossRef] [PubMed]
- Jung, C.K.; Lyou, S.H.; Koo, Y.J.; Song, J.T.; Choi, Y.D.; Cheong, J.J. Constitutive Expression of Defense Genes in Transgenic Arabidopsis Overproducing Methyl Jasmonate. J. Appl. Biol. Chem. 2003, 46, 52–57. [Google Scholar]
- Baldwin, I.T. Jasmonate-induced responses are costly but benefit plants under attack in native populations. Proc. Natl. Acad. Sci. USA 1998, 95, 8113–8118. [Google Scholar] [CrossRef] [PubMed] [Green Version]
- McConn, M.; Creelman, R.A.; Bell, E.; Mullet, J.E.; Browse, J. Jasmonate is essential for insect defense in Arabidopsis. Proc. Natl. Acad. Sci. USA 1997, 94, 5473–5477. [Google Scholar] [CrossRef] [PubMed] [Green Version]
- Li, C.; Williams, M.M.; Loh, Y.T.; Lee, G.I.; Howe, G.A. Resistance of cultivated tomato to cell content-feeding herbivores is regulated by the octadecanoid-signaling pathway. Plant Physiol. 2002, 130, 494–503. [Google Scholar] [CrossRef] [PubMed]
- Harms, K.; Atzorn, R.; Brash, A.; Kuhn, H.; Wasternack, C.; Willmitzer, L.; Penacortes, H. Expression of a Flax Allene Oxide Synthase cDNA Leads to Increased Endogenous Jasmonic Acid (JA) Levels in Transgenic Potato Plants but Not to a Corresponding Activation of JA-Responding Genes. Plant Cell 1995, 7, 1645–1654. [Google Scholar] [CrossRef] [PubMed] [Green Version]
- Heilmann, B.; Hartung, W.; Gimmler, H. The Distribution of Abscisic Acid between Chloroplasts and Cytoplasm of Leaf Cells and the Permeability of the Chloroplast Envelope for Abscisic Acid. Zeitschrift Für Pflanzenphysiologie 1980, 97, 67–78. [Google Scholar] [CrossRef]
- Castresana, J. Selection of conserved blocks from multiple alignments for their use in phylogenetic analysis. Mol. Biol. Evol. 2000, 17, 540–552. [Google Scholar] [CrossRef] [PubMed]
- Huelsenbeck, J.P.; Ronquist, F. MRBAYES: Bayesian inference of phylogenetic trees. Bioinformatics 2001, 17, 754–755. [Google Scholar] [CrossRef] [PubMed] [Green Version]
- Hall, B.G. Comparison of the accuracies of several phylogenetic methods using protein and DNA sequences. Mol. Biol. Evol. 2005, 22, 792–802. [Google Scholar] [CrossRef] [PubMed]
- Abascal, F.; Zardoya, R.; Posada, D. ProtTest: Selection of best-fit models of protein evolution. Bioinformatics 2005, 21, 2104–2105. [Google Scholar] [CrossRef] [PubMed]
- Zhai, Y.; Tchieu, J.; Saier, M.H., Jr. A web-based Tree View (TV) program for the visualization of phylogenetic trees. J. Mol. Microbiol. Biotechnol. 2002, 4, 69–70. [Google Scholar] [PubMed]
- Depicker, A. Transfection and transformation of Agrobacterium tumefaciens. Mol. Gen. Genet. MGG 1978, 163, 181–187. [Google Scholar]
- Yan, Y.P.; Wang, Z.Z. Genetic transformation of the medicinal plant Salvia miltiorrhiza by Agrobacterium tumefaciens -mediated method. Plant Cell Tissue Organ Cult. 2007, 88, 175–184. [Google Scholar] [CrossRef]
- Hua, W.; Song, J.; Li, C.; Wang, Z. Molecular cloning and characterization of the promoter of SmGGPPs and its expression pattern in Salvia miltiorrhiza. Mol. Biol. Rep. 2012, 39, 5775–5783. [Google Scholar] [CrossRef] [PubMed]
- Yang, Y.; Hou, S.; Cui, G.; Chen, S.; Wei, J.; Huang, L. Characterization of reference genes for quantitative real-time PCR analysis in various tissues of Salvia miltiorrhiza. Mol. Biol. Rep. 2010, 37, 507–513. [Google Scholar] [CrossRef] [PubMed]
- Schmittgen, T.D.; Livak, K.J. Analyzing real-time PCR data by the comparative CT method. Nat. Protoc. 2008, 3, 1101–1108. [Google Scholar] [CrossRef] [PubMed]
- Yikling, C.; Jookheng, G.; Yauyan, L. Assessment of in vitro antioxidant capacity and polyphenolic composition of selected medicinal herbs from Leguminosae family in Peninsular Malaysia. Food Chem. 2009, 116, 13–18. [Google Scholar]
- Dewanto, V.; Wu, X.; Adom, K.K.; Liu, R.H. Thermal processing enhances the nutritional value of tomatoes by increasing total antioxidant activity. Food Sci. Technol. 2005, 50, 3010–3014. [Google Scholar] [CrossRef]
- Cao, X.; Guo, X.; Yang, X.; Wang, H.; Hua, W.; He, Y.; Kang, J.; Wang, Z. Transcriptional Responses and Gentiopicroside Biosynthesis in Methyl Jasmonate-Treated Gentiana macrophylla Seedlings. PLoS ONE 2016, 11, e0166493. [Google Scholar] [CrossRef] [PubMed]
- Kim, D.; Pertea, G.; Trapnell, C.; Pimentel, H.; Kelley, R.; Salzberg, S.L. TopHat2: Accurate alignment of transcriptomes in the presence of insertions, deletions and gene fusions. Genome Biol. 2013, 14, R36. [Google Scholar] [CrossRef] [PubMed] [Green Version]
- Schulze, S.K.; Kanwar, R.; Gölzenleuchter, M.; Therneau, T.M.; Beutler, A.S. SERE: Single-parameter quality control and sample comparison for RNA-Seq. BMC Genom. 2012, 13, 524. [Google Scholar] [CrossRef] [PubMed]
- Trapnell, C.; Williams, B.A.; Pertea, G.; Mortazavi, A.; Kwan, G.; Van, M.B.; Salzberg, S.L.; Wold, B.J.; Pachter, L. Transcript assembly and quantification by RNA-Seq reveals unannotated transcripts and isoform switching during cell differentiation. Nat. Biotechnol. 2010, 28, 511–515. [Google Scholar] [CrossRef] [PubMed] [Green Version]
- Florea, L.; Song, L.; Salzberg, S.L. Thousands of exon skipping events differentiate among splicing patterns in sixteen human tissues. F1000Research 2013, 2, 188. [Google Scholar] [CrossRef] [PubMed]
- Anders, S.; Huber, W. Differential expression analysis for sequence count data. Genome Biol. 2010, 11, R106. [Google Scholar] [CrossRef] [PubMed]
- Alexa, A.; Rahnenführer, J.; Lengauer, T. Improved scoring of functional groups from gene expression data by decorrelating GO graph structure. Bioinformatics 2006, 22, 1600–1607. [Google Scholar] [CrossRef] [PubMed] [Green Version]
- Kanehisa, M.; Goto, S.; Kawashima, S.; Okuno, Y.; Hattori, M. The KEGG resource for deciphering the genome. Nucleic Acids Res. 2004, 32, D277–D280. [Google Scholar] [CrossRef] [PubMed]
- Mao, X.; Cai, T.; Olyarchuk, J.G.; Wei, L. Automated genome annotation and pathway identification using the KEGG Orthology (KO) as a controlled vocabulary. Bioinformatics 2005, 21, 3787–3793. [Google Scholar] [CrossRef] [PubMed] [Green Version]


© 2018 by the authors. Licensee MDPI, Basel, Switzerland. This article is an open access article distributed under the terms and conditions of the Creative Commons Attribution (CC BY) license (http://creativecommons.org/licenses/by/4.0/).
Share and Cite
Wang, B.; Niu, J.; Li, B.; Huang, Y.; Han, L.; Liu, Y.; Zhou, W.; Hu, S.; Li, L.; Wang, D.; et al. Molecular Characterization and Overexpression of SmJMT Increases the Production of Phenolic Acids in Salvia miltiorrhiza. Int. J. Mol. Sci. 2018, 19, 3788. https://doi.org/10.3390/ijms19123788
Wang B, Niu J, Li B, Huang Y, Han L, Liu Y, Zhou W, Hu S, Li L, Wang D, et al. Molecular Characterization and Overexpression of SmJMT Increases the Production of Phenolic Acids in Salvia miltiorrhiza. International Journal of Molecular Sciences. 2018; 19(12):3788. https://doi.org/10.3390/ijms19123788
Chicago/Turabian StyleWang, Bin, Junfeng Niu, Bin Li, Yaya Huang, Limin Han, Yuanchu Liu, Wen Zhou, Suying Hu, Lin Li, Donghao Wang, and et al. 2018. "Molecular Characterization and Overexpression of SmJMT Increases the Production of Phenolic Acids in Salvia miltiorrhiza" International Journal of Molecular Sciences 19, no. 12: 3788. https://doi.org/10.3390/ijms19123788