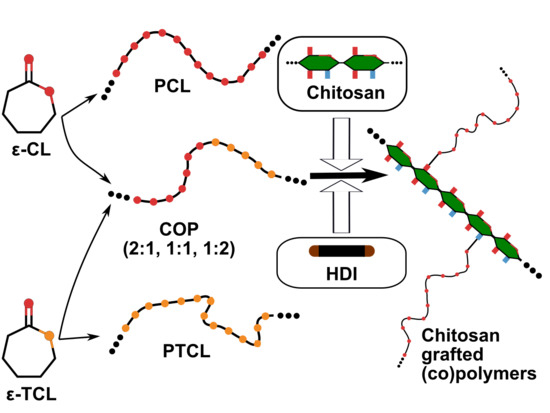
Different preliminary and unsuccessful attempts were made to synthesize chitosan-graft-poly(ε-caprolactone) by initiating CL ROP directly from either the hydroxyl or amino groups of the chitosan backbone. Regardless, the catalyst and reaction conditions (bulk, organic/aqueous solution, metallic/organic catalyst), the obtained material had a very small yield (approximately 15%). This was probably due to strong inter/intra-chain hydrogen bonds. Possibly, these interactions permitted only first few monomers to polymerize onto chitosan, but as polyester chains started to grow longer, the chitosan backbone collapsed, preventing local diffusion of CL monomers as well as its grafting onto chitosan. Thus, another route was followed to obtain chitosan-graft-polyester. In this route the polyesters (PCL, poly(ε-thiocaprolactone) (PTCL), or copolymers) were synthesized separately then they were grafted onto chitosan.
2.1. Analysis of PCL and PTCL Homopolymers
Poly(ε-caprolactone) (PCL) and poly(ε-thiocaprolactone) (PTCL) homopolymers were successfully obtained with a yield of 97 and 75%, respectively. FTIR spectrum of PCL (
Figure 1a) displayed C-H stretching vibrations with a peak position 2950 cm
−1, a distinctive ester carbonyl, O–C=O, stretching signal at 1720 cm
−1, and various C-O stretching and bending vibrations in 1500 and 900 cm
−1 range, while PTCL spectrum (
Figure 1e) displayed thioester carbonyl, S–C=O, stretching at 1677 cm
−1 with other absorption signals at 1358, 1252, 949, 777, and 721 cm
−1, which were related with the crystal structure of the thioester polymer [
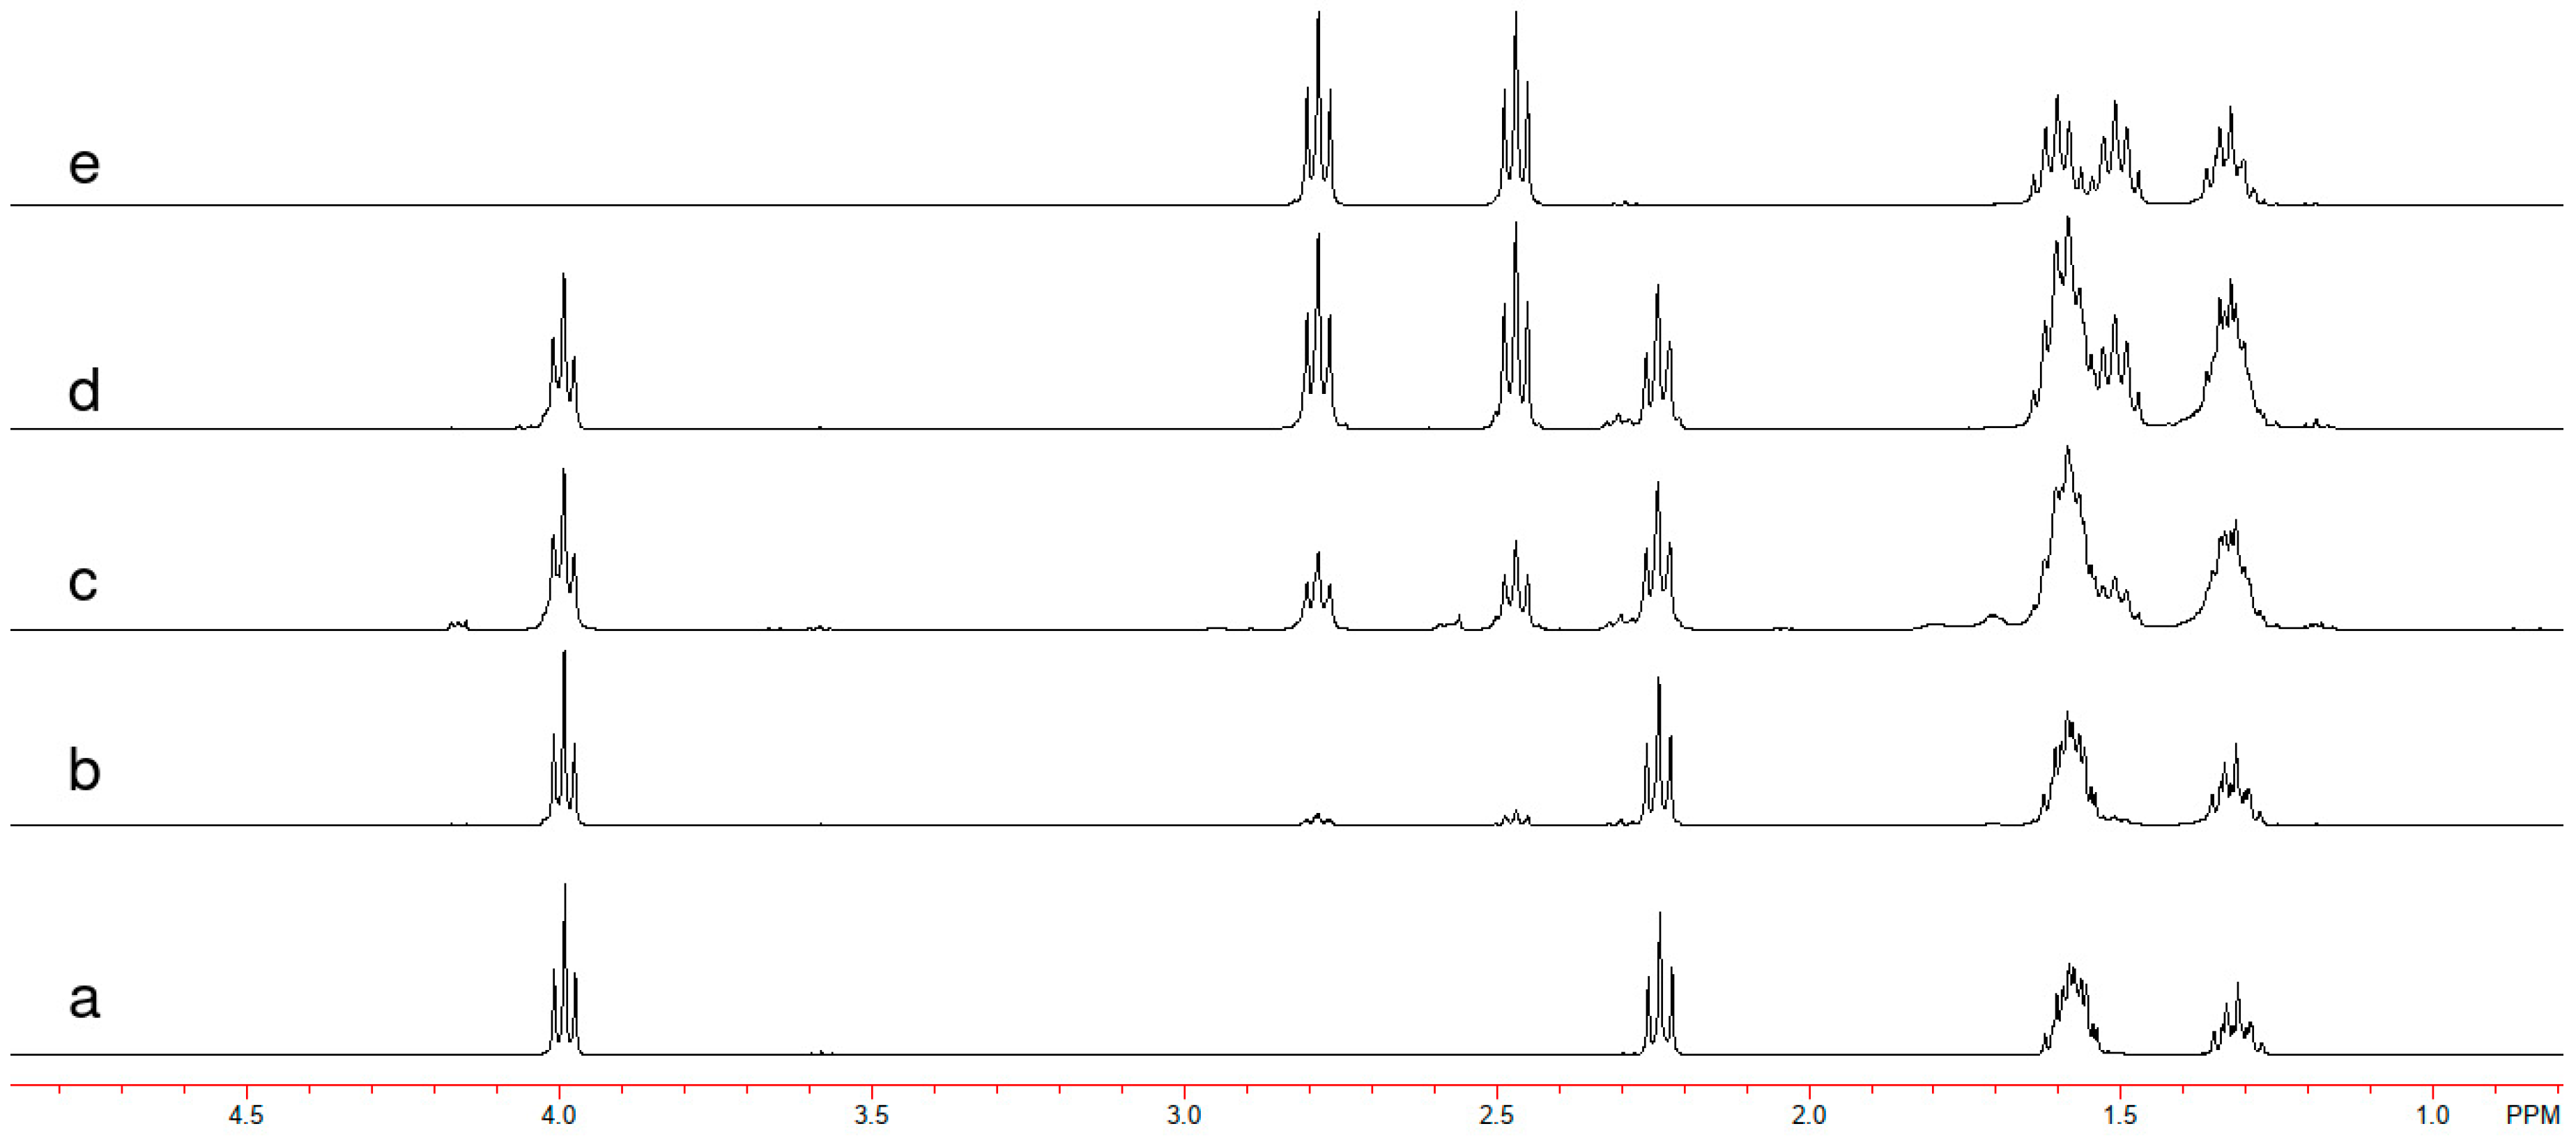
23]. NMR analyses also confirmed the chemical structures of PCL and PTCL. PCL was characterized by
1H NMR as δ = 1.23–1.40 ppm (m, 2H, –
CH2–CH
2–CH
2–CH
2CO), δ = 1.50–1.70 ppm (m, 4H,
CH2–CH2–CH
2–CO), δ = 2.24 ppm (t, 2H, –
CH2–CO), δ = 3.99 ppm (t, 2H,
CH2–O) (
Figure 2a), and PTCL as δ = 1.25–1.41 ppm (m, 2H, –
CH2–CH
2–CH
2COS), δ = 1.43–1.70 ppm (m, 4H,
CH2–CH
2–
CH2–CH
2–COS), δ = 2.47 ppm (t, 2H, –
CH2–COS), δ = 2.78 ppm (t, 2H, COS–
CH2–) (
Figure 2e). Size exclusion chromatography (SEC) results showed that M
n of the PCL and PTCL were 11,000 and 6000 g/mol, with Đ of 1.7 and 2.4, respectively.
2.2. Synthesis and Characterization of the Copolymers
Poly(ε-caprolactone-co-ε-thiocaprolactone) copolymers were synthesized using different molar ratios of the two monomers CL:TCL in the same reaction medium. The resulting copolymers were labeled as COP, associated with the comonomers feed proportions (2:1, 1:1 or 1:2), such as e.g., “COP-2:1”.
FTIR spectra of homo- and copolymers were displayed in
Figure 1b–d. From these spectra, the molar proportions of CL:TCL in the final copolymers could be calculated from the carbonyl stretching intensities. By this method, the ester content could be calculated as 73%, 54%, and 41% for COP-2:1, 1:1 and 1:2, respectively. Nearly the same results could also be obtained from integral areas of corresponding signals after deconvolution of carbonyl region (72%, 58%, and 44%). These results from the FTIR analyses were also supported by the
1H-NMR spectra (
Figure 2b–d). The comparison of integrals corresponding to O=C–O–CH
2 (δ = 3.99) and O=C–S–CH
2 (δ = 2.78) indicated that 87%, 63%, and 43% ester moiety were present in copolymers COP-2:1, 1:1, and 1:2, respectively. From the FTIR spectra of the copolymers, one could also observe a broadening in carbonyl stretching vibrations that is possibly due to various (thio)ester bonds within the polymeric structure. Some shifts in positions of the peak maxima were also observed. This occurrence was attributed to the fact that the component that was higher in proportion forced the other part to a more strained conformation, causing an increase in carbonyl stretching frequency. From the SEC analyses, the M
n of the copolymers were determined as 4700, 3500, and 3400 g/mol with Dispersity (Đ) of 1.8, 1.7, and 1.6 for COP-2:1, 1:1, and 1:2, respectively.
These results show that, under these reaction conditions, the ε-caprolactone monomers were more eager to polymerize than ε-thiocaprolactone. A possible explanation for this behavior rests on the size and polarizability of the oxygen and sulfur atoms. Indeed, having a smaller radius and lower polarizability, oxygen forms a seven-membered ring with a higher strain and it is thus more reactive. The bulkier sulfur atom reduces the ring tension in ε-thiocaprolactone, leading to a reactivity reduction. Thus, the ROP more likely occurred on oxygen instead of sulfur-bearing cycles, resulting in a higher content of ester moiety as compared to thioester, even when thiolactone was in higher feed proportion.
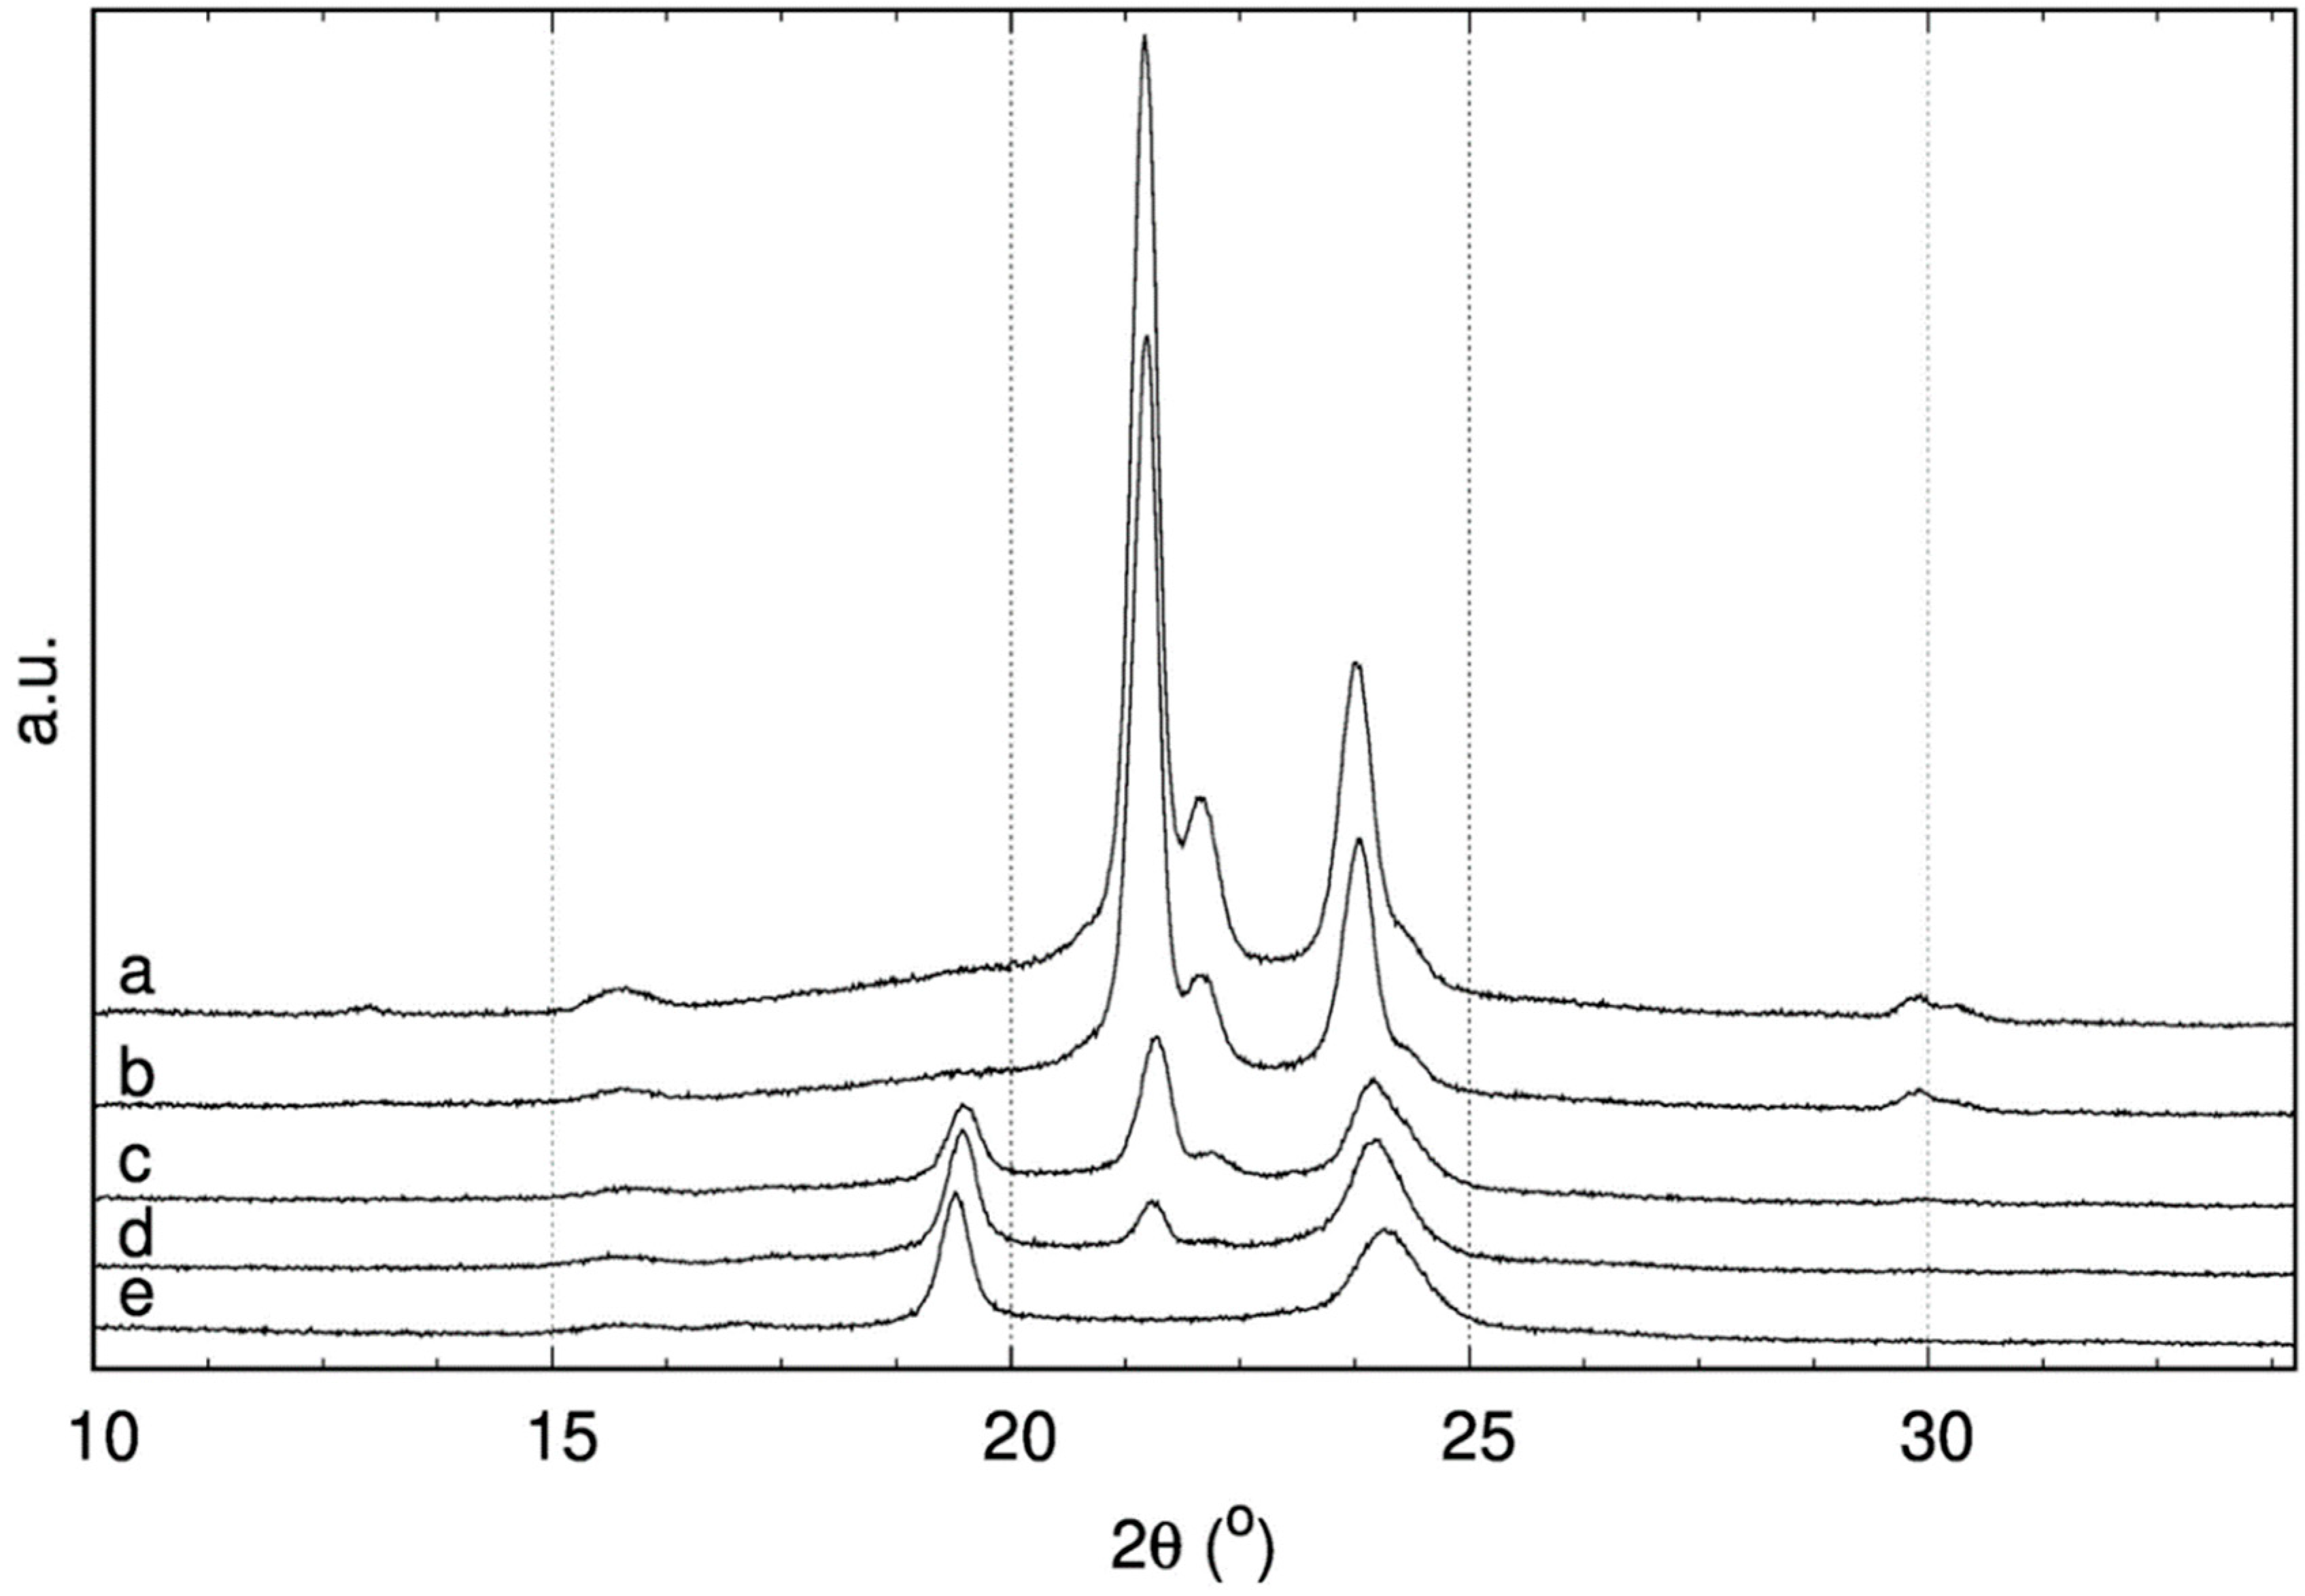
XRD analyses were performed on both homo- (PCL, PTCL) and copolymers (COP-2:1, 1:1, 1:2) (
Figure 3). The results of the measurements were summarized in
Table 1. The XRD peaks at 2θ values of 21.5 and 23.8 degrees in the diffractograms were identified as (110) and (200) planes of pristine PCL [
24]. As the TCL portion increased, the crystallite size and degree of crystallinity decreased. The crystallite size of the PCL was calculated as 4.14 Å and 3.74 Å for (110) and (200) that were planes, respectively. However, when polymerization occurred with a mixture of CL and TCL, peaks related with (110) and (200) planes shifted slightly to lower values in copolymers, resulting in an increase in crystallite size as 4.13, 4.11, and 4.12 Å for (110) plane and 3.74, 3,70, and 3.71 Å for (200) plane in COP-2:1, 1:1, 1:2 copolymers, respectively. Mean distances among chains also became smaller, supporting the decrease in crystallite size. The mean distances that were based on (110) plane were calculated as 5.18 and 5.72 Å for PCL and PTCL, respectively. Increasing TCL content caused a decrease in mean distance (5.17, 5.15, 5.16 Å for COP-2:1, 1:1, 1:2). The crystallinity degrees of the polymers were calculated based on deconvoluted peaks covering amorphous and crystalline regions. The PCL crystallinity was higher than PTCL’s one, 67% vs. 54%. The overall crystallinity of the copolymers (including both PCL and PTCL crystalline regions, where it was possible) was logically found to decrease with the PTCL content, with values of 62%, 55%, and 53% for 2:1, 1:1, and 1:2 copolymers, respectively.
Thermal analyses (DSC and TGA) were also conducted on homo- and copolymers. DSC results were summarized in
Table 1 and
Figure 4. When comparing the melting temperatures (T
m) of homopolymers, one could observe a great difference between PCL (62 °C) and PTCL (101 °C). The exchange of the oxygen atom with sulfur induces great gain in thermal stability. However, as far as copolymers are concerned, a decreasing amount of CL resulted in a decrease in T
m. This behavior could be due to the lower molar masses that were obtained when increasing the TCL content as well as smaller CL sequences in the copolymers.
The crystallinity of the polymers was also determined from DSC analyses. The melting enthalpies of the 100% crystalline polymer that was used to calculate the crystallinity were 139.3 J/g for PCL and 163.3 J/g for PTCL [
15]. Crystallinity values of copolymers that were reported in
Table 1 correspond to the overall crystallinity. The values determined from DSC analyses were consistent with XRD results. The small gap could be due to rearrangement of the polymer chains.
TGA results were summarized in
Table 2. The weight loss curves and their first order derivatives, which were recorded under argon, were shown in
Figure 5. Maximum degradation temperatures (T
max) were determined from the peak positions on derivative weight loss (DTG) plots. Thermal degradation of PCL occurred in two stages. First chain scissions (around 220 °C) took place then depolymerization reactions occurred between 250 and 320 °C [
15,
25,
26,
27]. PCL thus showed two distinct peaks in DTG plot at 212 and 294 °C, which was consistent with the results that are reported in the literature. However, PTCL showed only a broad and less intense peak centered at 262 °C, with a tailing towards 200 °C, on the DTG plot. From this result, one could say that chain scission and depolymerization occurred simultaneously. Assuming that thermal degradation reactions of the polymers were first order and they did not interfere with other reactions, the thermograms could be separated into three zones corresponding to three different thermal events (degradation reactions). Thus, the interpretations of TGA thermograms were done by splitting the measured temperature range into zones that were labelled as I, II, and III for 140–232, 232–310, and 310–400 °C intervals, respectively.
The TGA results for copolymers showed distinct variations in the first degradation stage, with T
max values increasing from 215 to 224, and 228 °C for COP-2:1, 1:1, and 1:2, respectively. In addition, the second stage maximum degradation temperature of the copolymers (298, 303, and 293 °C) were equal to or slightly higher than those of PCL homopolymer (294 °C). T
80% values were also generally higher for the copolymers with 307, 306, and 292 °C for COP-2:1, 1:1, and 1:2 copolymers, respectively, as compared to PCL (297 °C). These results tend to show that the introduction of sulfur into the polyester structure induced an overall gain in thermal stability. However, T
10% showed a decreasing trend with increasing content of TCL in the copolymers with 229, 206, and 205 °C for 2:1, 1:1, and 1:2 copolymers, respectively. These values were generally lower than for the PCL and PTCL homopolymers (229 and 224 °C, respectively). This indicates an earlier starting of the degradation, which is likely due to the lower molar masses of the copolymers as compared to the homopolymers. Estimated activation energy (E
A) values were calculated, based on the Broido method, to support such gained thermal stability [
28]. According to Broido, the estimation of activation energy is possible if the reactions under examination are of first order within the considered temperature range and they should not interfere with other reactions. Provided these requirements, the E
A could be calculated and high activation energy would correspond to high thermal stability as more energy is needed to overcome the energy barrier for degradation. As seen in
Table 2, PCL shows high activation energy (109 kJ/mol) for zone I where expected reactions were mainly chain scissions. Subsequently, in zone II, there was a partial degradation reaction having an E
A of 36 kJ/mol. Finally, unzipping of the polymer chains mainly occurred in zone III with an E
A of 234 kJ/mol. PTCL displayed a different scheme with chain scissions and partial degradation occurring synchronously in zones I and II. Corresponding E
As were estimated as 99 and 142 kJ/mol, respectively. The last part of the PTCL degradation (zone III) required the least E
A, which was related with main chains degradation (60 kJ/mol). These results show that, in zone I, where mainly chain scission reactions occurred, PCL and PTCL had similar behaviors, with the exception of a small difference in E
A of about 10 kJ/mol. However, E
A values for the later zones were completely different. Further analyses would depict the reaction mechanisms in detail.
Copolymers showed a hybrid behavior in between both homopolymers’ one. Indeed, COP-2:1 and 1:1 had EAs quite similar to PTCL in zone I. However, then they resembled to PCL with a slightly higher value for zone II, and finally display drastically different values for zone III, in between the homopolymers values. However, COP-1:2, having a higher TCL content, showed a different profile as compared to other copolymers. It displayed higher EA values in first two zones, especially in zone I. Nonetheless, the EA value for zone III was very close to COP-1:1. In general, and as expected, molar mass had an important effect on the EA. Increasing molar mass caused an increase in EA as there would be more bonds to be broken in long chains (high molar mass) compared to smaller ones. Consequently, EA estimations displayed that TCL amount was directly proportional with thermal stability. As chain scissions needed higher EA for thio derivatives, which are more stable than oxygen-based analogues, increasing TCL portion caused an increase in thermal stability when compared to pristine PCL.
2.3. Grafting of Polyester Chains onto the Chitosan Backbone
FTIR spectra allowed for monitoring the reaction through the formation of carbamate bonds (1618 and 1581 cm−1) and the disappearance of the cyanate bond (2265 cm−1). After removal of the unreacted polyester chains, the remaining compound was determined as graft copolymer. First, experiments were carried out with PCL to determine the best reaction conditions, then the same conditions were used for PTCL homopolymer grafting. These chitosan graft copolymers were labelled as CG-PCL and CG-PTCL, respectively. Because of possible differences in the grafting efficiency between PCL and PTCL homopolymers chains, it might be difficult to control the PCL:PTCL ratio in the final product, which can significantly differ from the feed ratio. On the contrary, grafting copolymers could allow a better control of the CL:TCL proportion in the final material. The corresponding grafted (co)polymers were labeled according to the synthesis method as CG-B (via blending) and CG-P (via copolymers), and they were followed by the PCL:PTCL ratio.
Yields of the CG-B and CG-P samples are given in
Table 3. In the case of homopolymers, the yield was higher for CG-PTCL when compared to CG-PCL. According to these results, one could say that PTCL grafting was slightly easier than PCL chains grafting onto chitosan. When both PCL and PTCL were added as a blend and the proportion was in favor of PCL (CG-B-2:1), the grafting yield (54%) was lower as compared to homopolymers’ grafting (CG-PCL 70%, CG-PTCL 81%). An increasing proportion of PTCL in blend caused an increase in yield, but it remained lower when compared to homopolymer analogues. As far as blend grafting samples are concerned, the low PCL content also confirmed the preferential (easier) grafting of PTCL onto chitosan.
Results on grafted copolymers were consistent with homopolymer blends ones. The yields and grafting efficiencies were similar to those of the equivalent homopolymer that was present in higher proportion. For example, CG-P-2:1, displayed a yield value of 71%, which was very close to CG-PCL (70%). Similarly, CG-P-1:2 showed a 76% yield, while CG-PTCL had 81%. These results indicated that coupling via sulfur atom was more favorable when compared to oxygen analogue as a consequence of the activities difference between -SH and -OH ending groups on the polymer chains.
FTIR spectra of chitosan and chitosan grafted with copolymers (CG) were recorded (
Figure 6).
Characteristic FTIR signals that were related to chitosan were summarized as O-H and N-H stretching vibrations (overlapped) as a broad signal with peak positions at 3357, and 3282 cm−1, various C-H stretching with a peak at 2870 cm−1, amide I and/or adsorbed water vibration at 1648 cm−1, amide II vibration at 1589 cm−1, various C-C-H, C-O-C, C-C-O bending, and C-C, C-O stretching vibrations between 1500–1800 cm−1, and anomeric (C1) related signal at 897 cm−1 indicated β- conformation of the chitosan. Chitosan grafted with copolymers or homopolymers blends displayed the characteristic urethane functional group signals as N-H stretching (3324 cm−1), N–C(=O)–O stretching bands 1615 and 1576 cm−1. In addition, the disappearance of the N=C=O stretching signal at 2266 cm−1 confirmed the formation of urethane bonds.
PCL content of the grafted chitosan materials (for both CG-B and CG-P) were estimated using intensity values of ester and thioester carbonyl stretching vibrations, as for COP samples. For CG-B samples, the PCL content was measured around 28% (by weight) for 2:1 and 1:1 blends. However, it dropped to 15% for 2:1 blend composition. For COP-2:1, 1:1, and 1:2 copolymers, the estimated PCL content was 74%, 49%, and 39% for CG-P-2:1, 1:1, and 1:2, respectively. These results brought another support for the preferential grafting of PTCL over PCL.
The C-O groups’ stretching vibrations of chitosan and polyester samples overlapped in the fingerprint region. Moreover, higher intensity of ester group vibrations completely covered the signals of chitosan and prevented the direct observation and confirmation of grafting onto chitosan backbone. Similarly, urethane bond vibrations also overlapped with amide I and amide II vibrations. In order to detect and classify the differences in these vibration signals, a statistical method, PCA, was applied to the FTIR data. The scores plot of the first three principal components (PC), which together account for 93% of total variance, is shown in
Figure 7. The plot displayed PC1 and PC3 as axes, colors as PC2, with same colors indicating close groups in three-dimensional (3D) space. Output of the PCA gave PCL, PTCL, and chitosan at different positions of the PC1–PC3 plane; PCL located at the far left and PTCL at the far right of PC1 axis, while chitosan was in the middle. However, both PCL and PTCL were fairly below the zero level of PC3, while chitosan was clearly away from them. These points created a triangular shape whose corners were occupied by one component making them clearly distinguishable. In this shape, COP copolymers lined up at the farthest distance from chitosan based on their composition. Chitosan graft copolymers also showed a similar lining up but they were closer to chitosan region. CG-PCL and CG-P-2:1 showed up at lower left part of the triangle, close to PCL position, but slightly shifted upper part towards chitosan; then, CG-P-1:1 were near to the origin of the plot. The other chitosan grafted copolymers and CG-PTCL were very close to the PTCL homopolymer, but also shifted to the chitosan side of the PC3 axis. These results were in accordance with other results, as all CG-B copolymers and CG-P-1:2 copolymer had a higher proportion of thioester component in their compositions. This result also indicated that functional groups were all different in each copolymer and attested that these samples are composed of various covalent bonds between chitosan and (co)polymers instead of a physical mixture. Thus, it could be concluded copolymers chains were effectively grafted onto the chitosan backbone.
XRD diffractograms were recorded and the main results were summarized on
Table 1. In the 2θ angle region corresponding to the (110) plane, grafted copolymers displayed two distinct peaks corresponding, respectively, to PCL and PTCL homopolymers. The presence of these two peaks likely attested that CG copolymers had distinct partially crystalline poly(thio)ester blocks. However, the (200) plane peaks were overlapped, so it was not possible to separate distinct signals. Thus, interchain distances were calculated based on the (200) plane peaks using Equation (4). In general, the interchain distance was nearly constant for chitosan grafted copolymers as compared to their parent samples. For example, PCL, COP-2:1, CG-PCL, and CG-P-2:1 displayed an average interchain distance of 4.67 Å. The introduction of thio- component caused a small decrease in this value by 0.04 Å, with an average value of 4.63 Å. The absence of crystalline peaks on the diffractogram for neat chitosan confirmed that it was an amorphous material. As expected, grafting the copolymers onto chitosan caused a decrease in their crystalline structure. Crystallinity of the samples were calculated using Equation (5); the average crystallinity value was found to be around 30% for chitosan graft samples, while it was around 50% for the corresponding non-grafted homo- and copolymers.
Thermal characterizations of homo- and copolymers, as well as chitosan-grafted copolymers, were carried out by DSC (
Table 4). The thermograms of chitosan grafted with homopolymers of PCL and PTCL (CG-PCL, CG-PTCL) showed T
m values similar to the corresponding pristine homopolymers. However, there was a sharp decrease in crystallinity for the grafted samples. The materials with varying CL:TCL ratios displayed two melting zones each corresponding to PCL and PTCL melting zones. One could also observe that CG-B copolymers thermograms resembled the PTCL one with only small differences. This could be explained by the FTIR results that showed that CG-B copolymers were rich in the PTCL component. Some discrepancies on crystallinity were observed between the χ
DSC and χ
XRD results. According to XRD, the crystallinity values of chitosan grafted with homopolymers blends were estimated around 35%, whereas from DSC the estimated crystallinity of these CG-B samples were calculated as 10%, 46%, and 57% for 2:1, 1:1, and 1:2, respectively. Similarly, lower values were estimated for the CG-P series as 20, 11, 30% for 2:1, 1:1, and 1:2. However, it is very well known that DSC and XRD often give divergent crystallinity values for a same sample.
Thermogravimetric analysis of chitosan displayed 10% weight loss below 100 °C due to water loss. Then, thermal degradation started at 220 °C giving a T
max at 274 °C. After 380 °C, the degradation rate was constant until the end of analysis. TGA results were summarized in
Table 5. An additional thermal decomposition zone (IV) was observed between 400 and 460 °C for grafted samples giving an average T
max value of 410 °C.
When compared to PCL and PTCL homo- and copolymers, chitosan grafted samples generally displayed higher thermal stability with an additional Tmax just above 400 °C, probably related to the chitosan degradation. The polyester chains grafting onto chitosan led to increased temperatures in the first part of thermal degradation, which was related to PCL or PTCL chain scissions, as their coupling to chitosan via urethane bonds likely prevented this reaction. Then, chain unzipping reactions also peaked at higher temperatures as compared to pristine (co)polymers. The temperatures at which 10% weight loss occurred also supported this gain in thermal stability. The initial and final positions of degradations were similar in CG-B and CG-P graft copolymers. However, they differed slightly in CG-PCL and CG-PTCL. The EA for CG-PCL was calculated according to the initial and final points at 180 and 460 °C with two break points around 235 and 322 °C. The last two reaction zones were likely related to urethane bond decomposition and chitosan degradation as evidenced by the similar EA values obtained for all CG-samples regardless their types and composition. Thus, only the first two degradation zones showed differences in the thermal stability of the samples according to the CL:TCL ratio. For CG-B samples, EA values for zone I were 30% and 5% higher when compared to CG-PCL and CG-PTCL, respectively. However, EA values for zone II, which was related to PCL moiety degradation, were nearly 50% lower than for CG-PCL. However, CG-P samples displayed a slightly different scheme with EA values related to the TCL content. In zone I, approximate increases of 30%, 50%, and 60% were observed as the TCL content increased, while EA values in zone II showed a decrease by 20%, 50%, and 60%. These results indicated that the introduction of sulfur atoms into the polyester chains structure induced a gain in thermal stability for the chitosan grafted copolymers as well.


