Article

Genome-Wide Identification and Characterization of NODULE-INCEPTION-Like Protein (NLP) Family Genes in Brassica napus

1
College of Agronomy and Biotechnology, Southwest University, Beibei, Chongqing 400715, China
2
Academy of Agricultural Sciences, Southwest University, Beibei, Chongqing 400715, China
3
Shennong Class, Southwest University, Beibei, Chongqing 400715, China
*
Author to whom correspondence should be addressed.
These authors contributed equally to this paper as first authors.
Int. J. Mol. Sci. 2018, 19(8), 2270; https://doi.org/10.3390/ijms19082270
Submission received: 9 July 2018 / Accepted: 30 July 2018 / Published: 2 August 2018
(This article belongs to the Section Molecular Plant Sciences)

Abstract

:
NODULE-INCEPTION-like proteins (NLPs) are conserved, plant-specific transcription factors that play crucial roles in responses to nitrogen deficiency. However, the evolutionary relationships and characteristics of NLP family genes in Brassica napus are unclear. In this study, we identified 31 NLP genes in B. napus, including 16 genes located in the A subgenome and 15 in the C subgenome. Subcellular localization predictions indicated that most BnaNLP proteins are localized to the nucleus. Phylogenetic analysis suggested that the NLP gene family could be divided into three groups and that at least three ancient copies of NLP genes existed in the ancestor of both monocots and dicots prior to their divergence. The ancestor of group III NLP genes may have experienced duplication more than once in the Brassicaceae species. Three-dimensional structural analysis suggested that 14 amino acids in BnaNLP7-1 protein are involved in DNA binding, whereas no binding sites were identified in the two RWP-RK and PB1 domains conserved in BnaNLP proteins. Expression profile analysis indicated that BnaNLP genes are expressed in most organs but tend to be highly expressed in a single organ. For example, BnaNLP6 subfamily members are primarily expressed in roots, while the four BnaNLP7 subfamily members are highly expressed in leaves. BnaNLP genes also showed different expression patterns in response to nitrogen-deficient conditions. Under nitrogen deficiency, all members of the BnaNLP1/4/5/9 subfamilies were upregulated, all BnaNLP2/6 subfamily members were downregulated, and BnaNLP7/8 subfamily members showed various expression patterns in different organs. These results provide a comprehensive evolutionary history of NLP genes in B. napus, and insight into the biological functions of BnaNLP genes in response to nitrogen deficiency.

1. Introduction

Nitrogen is a primary nutrient that is critical for the survival of all living organisms. The absorption and utilization of nitrogen directly affects plant growth and development, as well as crop yields. During their long evolutionary history, plants have established complex and delicate regulatory mechanisms to adapt to changes in nitrogen conditions in the external environment. The main forms of nitrogen in soil include nitrate nitrogen, ammonium nitrogen, amino acids, proteins, and other nitrogenous substances. Nitrate nitrogen, the major form of nitrogen in soil, plays important physiological and nutritional roles in plant growth and development [1]. Nitrate nitrogen uptake and translocation in plant roots are mainly accomplished by nitrate nitrogen transporters (NRT) [2]. The first transporter identified to sense nitrate was the NRT1.1 in Arabidopsis thaliana, and the CIPK23 (a protein kinase) and CIPK8 can phosphorylate NRT1.1 to regulate the high- or low-affinity nitrate response [3,4]. Meanwhile, several proteins are involved in nitrogen assimilation in plants exposed to changing nitrogen concentrations, such as ammonium transporters (AMTs) and nitrate reductases (NRs) [5,6,7]. Genes and transcription factors (TFs) involved in nitrate-signaling pathways play key roles in nitrate absorption and assimilation [8]. NIN (NODULE INCEPTION) genes were first discovered as being defective in bacterial recognition, infection thread formation, and nodule primordia initiation in the lotus (Lotus japonicus), and the formation of rhizobia in leguminous species was later confirmed to be dependent on the presence of NIN genes [9,10]. NIN genes encode nuclear-targeted DNA binding proteins with bZIP domains and the most obvious feature of the NIN proteins is a strongly conserved 60-amino acid (aa)-long sequence, known as the RWP-RK (also known as the RWPxRK motif) sequence. Moreover, a few genes that possessed high degree homology with NIN were identified in legumes, named NLP (NIN-like proteins) [10,11,12]. Subsequent studies found that NLP genes widely exist among non-nitrogen fixating plants, such as rice (Oryza sativa) and A. thaliana [10], but the NIN proteins seem to be unique in legumes.
The NLP family is a plant-specific TF family, their proteins presented a homology to NIN not only in the RWP-RK domain but also in N-terminal regions [10,13]. NLP proteins contain two major conserved domains, the RWP-RK and PB1 (Phox and Bem1) domains. The RWP-RK domain functions in the DNA binding domain whose activity is unrelated to nitrate signaling, whereas the N-terminal regions of NLPs function as a transcriptional activation domain that mediates this signaling, and the PB1 domain is involved in protein–protein interactions [14,15]. A highly conserved GAF domain (a ubiquitous signaling motif and a new class of cyclic GMP receptor, which ensures the normal functioning of photosensitizing light reversals and optical signal transduction [3]) was also identified in the nitrogen termini of some NLP proteins, and may be related to signal transduction or dimerization [3,16,17]. A. thaliana contains nine NLP genes [8], whereas lotus contains four NLPs with a single NIN [13,18,19]. A number of NLPs have also been identified in maize (Zea mays) (nine), sorghum (Sorghum bicolor) (five), and rice (six) [10,14,20]. Functional studies have shown that AtNLPs play key roles in orchestrating primary nitrogen responses by binding to the nitrogen responsive cis-elements (NREs) in the promoters of target genes [9,21,22]. AtNLP7 functions in nitrate-and nitrogen starvation responses by binding to key nitrogen pathway genes, including ANR1, NRT1.1, NRT2, and LBD37/38, thus moderating nitrogen assimilation and metabolism by transcriptionally activating or suppressing downstream genes [23,24]. AtNLP8 regulates nitrate-promoted seed germination and directly binds to the promoter of an abscisic acid (ABA) catabolic enzyme gene to reduce ABA levels in a nitrate-dependent manner [19]. AtNLP6 and AtNLP7 proteins interact with the key transcriptional regulator TEOSINTE BRANCHED1/CYCLOIDEA/PROLIFERATING CELL FACTOR1-20 under nitrogen starvation and continuous nitrate treatment; these interacting regulators play a central role in controlling the expression of nitrate-responsive genes [25]. Nitrate triggers nitrate-CPK (Ca2+-sensor protein kinases)-NLP signaling and nitrate-coupled CPK signaling to phosphorylate NLPs, which play a crucial role in nutrient-growth networks [26].
Brassica napus is one of the most important oilseed crops in non-nitrogen fixating plants. This species was formed by the hybridization of two progenitor species, Brassica rapa and Brassica oleracea [27,28]. NLP genes play important roles in nitrogen uptake and utilization, which are critical for plant growth and development [10,14,20,29]. However, few studies have focused on identifying NLP genes in B. napus. In this study, we identified 31 BnaNLP genes using nine AtNLP proteins from A. thaliana as query sequences. We investigated the evolutionary relationships among NLP members from nine plant species and evaluated the predicted three-dimensional structures of a representative NLP protein (BnaNLP7-1) in B. napus. We also examined the spatio-temporal expression patterns of BnaNLP genes, as well as their expression under nitrogen deficient conditions, to reveal the relationship between BnaNLPs and nitrogen deficiency responses. Our study provides insight into the evolution of NLP proteins in plants and lays the foundation for elucidating the roles of NLPs in regulating nitrogen responses in B. napus.

2. Results

2.1. Identification of NLP Genes in B. napus

Using the nine AtNLP protein sequences in A. thaliana as queries, 31, 17, and 8 NLP genes were identified from B. napus, B. rapa, and B. oleracea, respectively. All Brassica NLP proteins share two conserved domains: The RWP-RK and PB1 domains. The nomenclature used for Brassica NLP genes was based on the corresponding AtNLP orthologs (Table 1 and Table S2). The number of amino acid residues in the BnaNLP proteins ranged from 681 (BnaNLP3-1) to 978 (BnaNLP7-3), with an average of 845. The relative molecular weights (MWs) ranged from 76.37 (BnaNLP3-1) to 108.05 kDa (BnaNLP7-3). The isoelectric points (pIs) were predicted to range from 4.98 (BnaNLP1-2) to 7.31 (BnaNLP3-1), and only two members had pI values > 7 (BnaNLP2-4 and BnaNLP3-1). No transmembrane helix or signal peptide was found in any BnaNLP protein (Table 1). Most BnaNLP proteins were predicted to localize in the nucleus, while BnaNLP2-4 was predicted to localize on the chloroplast. In addition, BnaNLP2-2 was predicted to be localized to the chloroplast and nucleus (Table 1), which is consistent with the general nuclear localization of TFs.

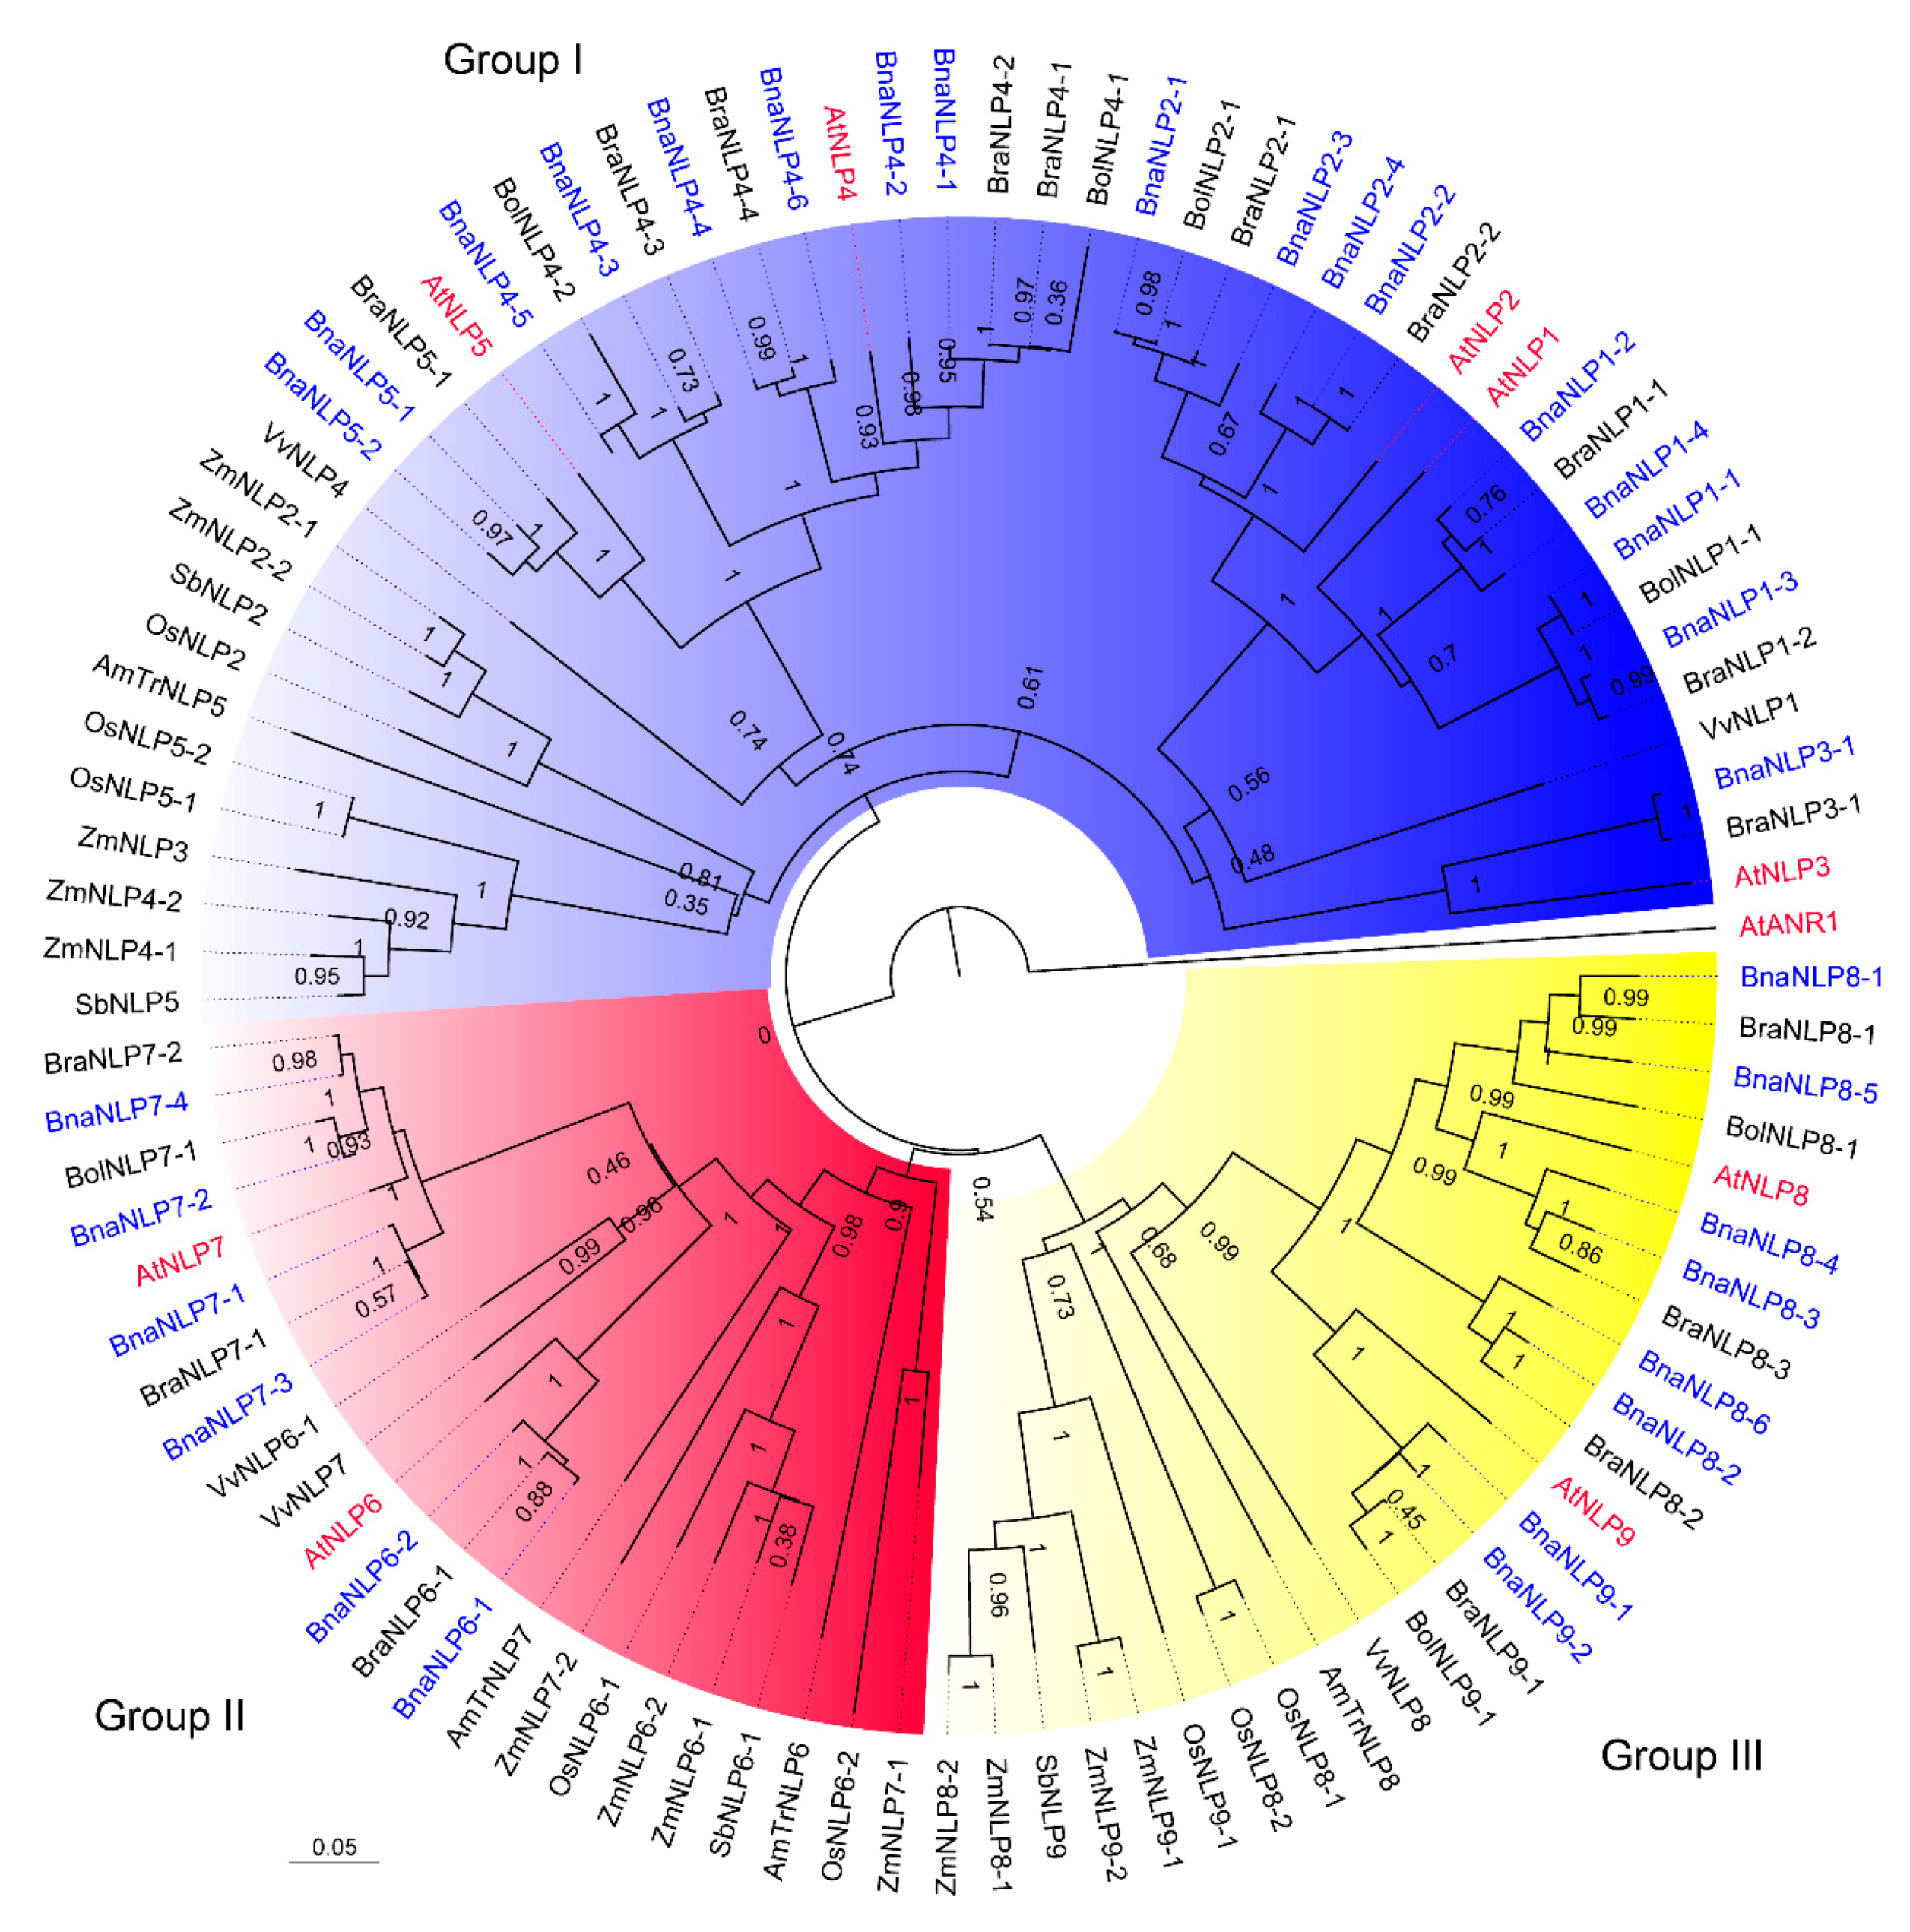
2.2. Phylogenetic Analysis of BnaNLP Proteins

To clarify the evolutionary relationships between NLP proteins from A. thaliana and B. napus, we aligned the sequences of 40 NLP proteins using AtANR1 as an outgroup. Based on previous studies [8,10], NLP proteins were divided into three groups (Figure 1A), including the NLP1/2/3/4/5 clade (group I), the NLP6/7 clade (group II), and the NLP8/9 clade (group III). Group I contained 17 BnaNLPs, while groups II and III contained six and eight BnaNLPs, respectively. Both the BnaNLP4 and BnaNLP8 subfamilies contained six members, with more members compared to the other BnaNLP subfamilies.
To further investigate the evolutionary relationships of NLP proteins in plants, we constructed a larger neighbor-joining (NJ) tree based on the 99 NLP protein sequences from A. thaliana, B. napus, B. rapa, B. oleracea, Amborella trichopoda, rice, grape (Vitis vinifera), maize, and sorghum (Figure 2). The 99 plant NLP proteins were also classified into three groups. Group I was the largest clade, containing 49 NLP members, including 36 NLPs in Brassicaceae. Group II was the smallest clade, containing 23 NLP members, including 12 NLPs in Brassicaceae. Group III contained 26 NLP members, including 16 NLPs in Brassicaceae. BnaNLP members first clustered with NLPs from two progenitors of B. napus, followed by AtNLPs, forming a small Brassicaceae clade, and subsequently further clustered with NLP members in V. vinifera to form a dicot clade. Finally, a large clade could be observed by joining NLP proteins in dicot and monocot plants (Figure 2). In group I, the dicot clade was formed by two subclades, the NLP1/2/3 and NLP4/5 subclades. In the NLP1/2/3 subclade, NLP1/2 members in Brassicaceae first formed a small subclade clustered with VvNLP1 and then clustered with NLP3 members specifically in Brassicaceae. Plant NLP members were divided into three groups, with at least one NLP member present in A. trichopoda, suggesting that at least three ancient NLP copies were present in the ancestor before the monocot and dicot divergence.

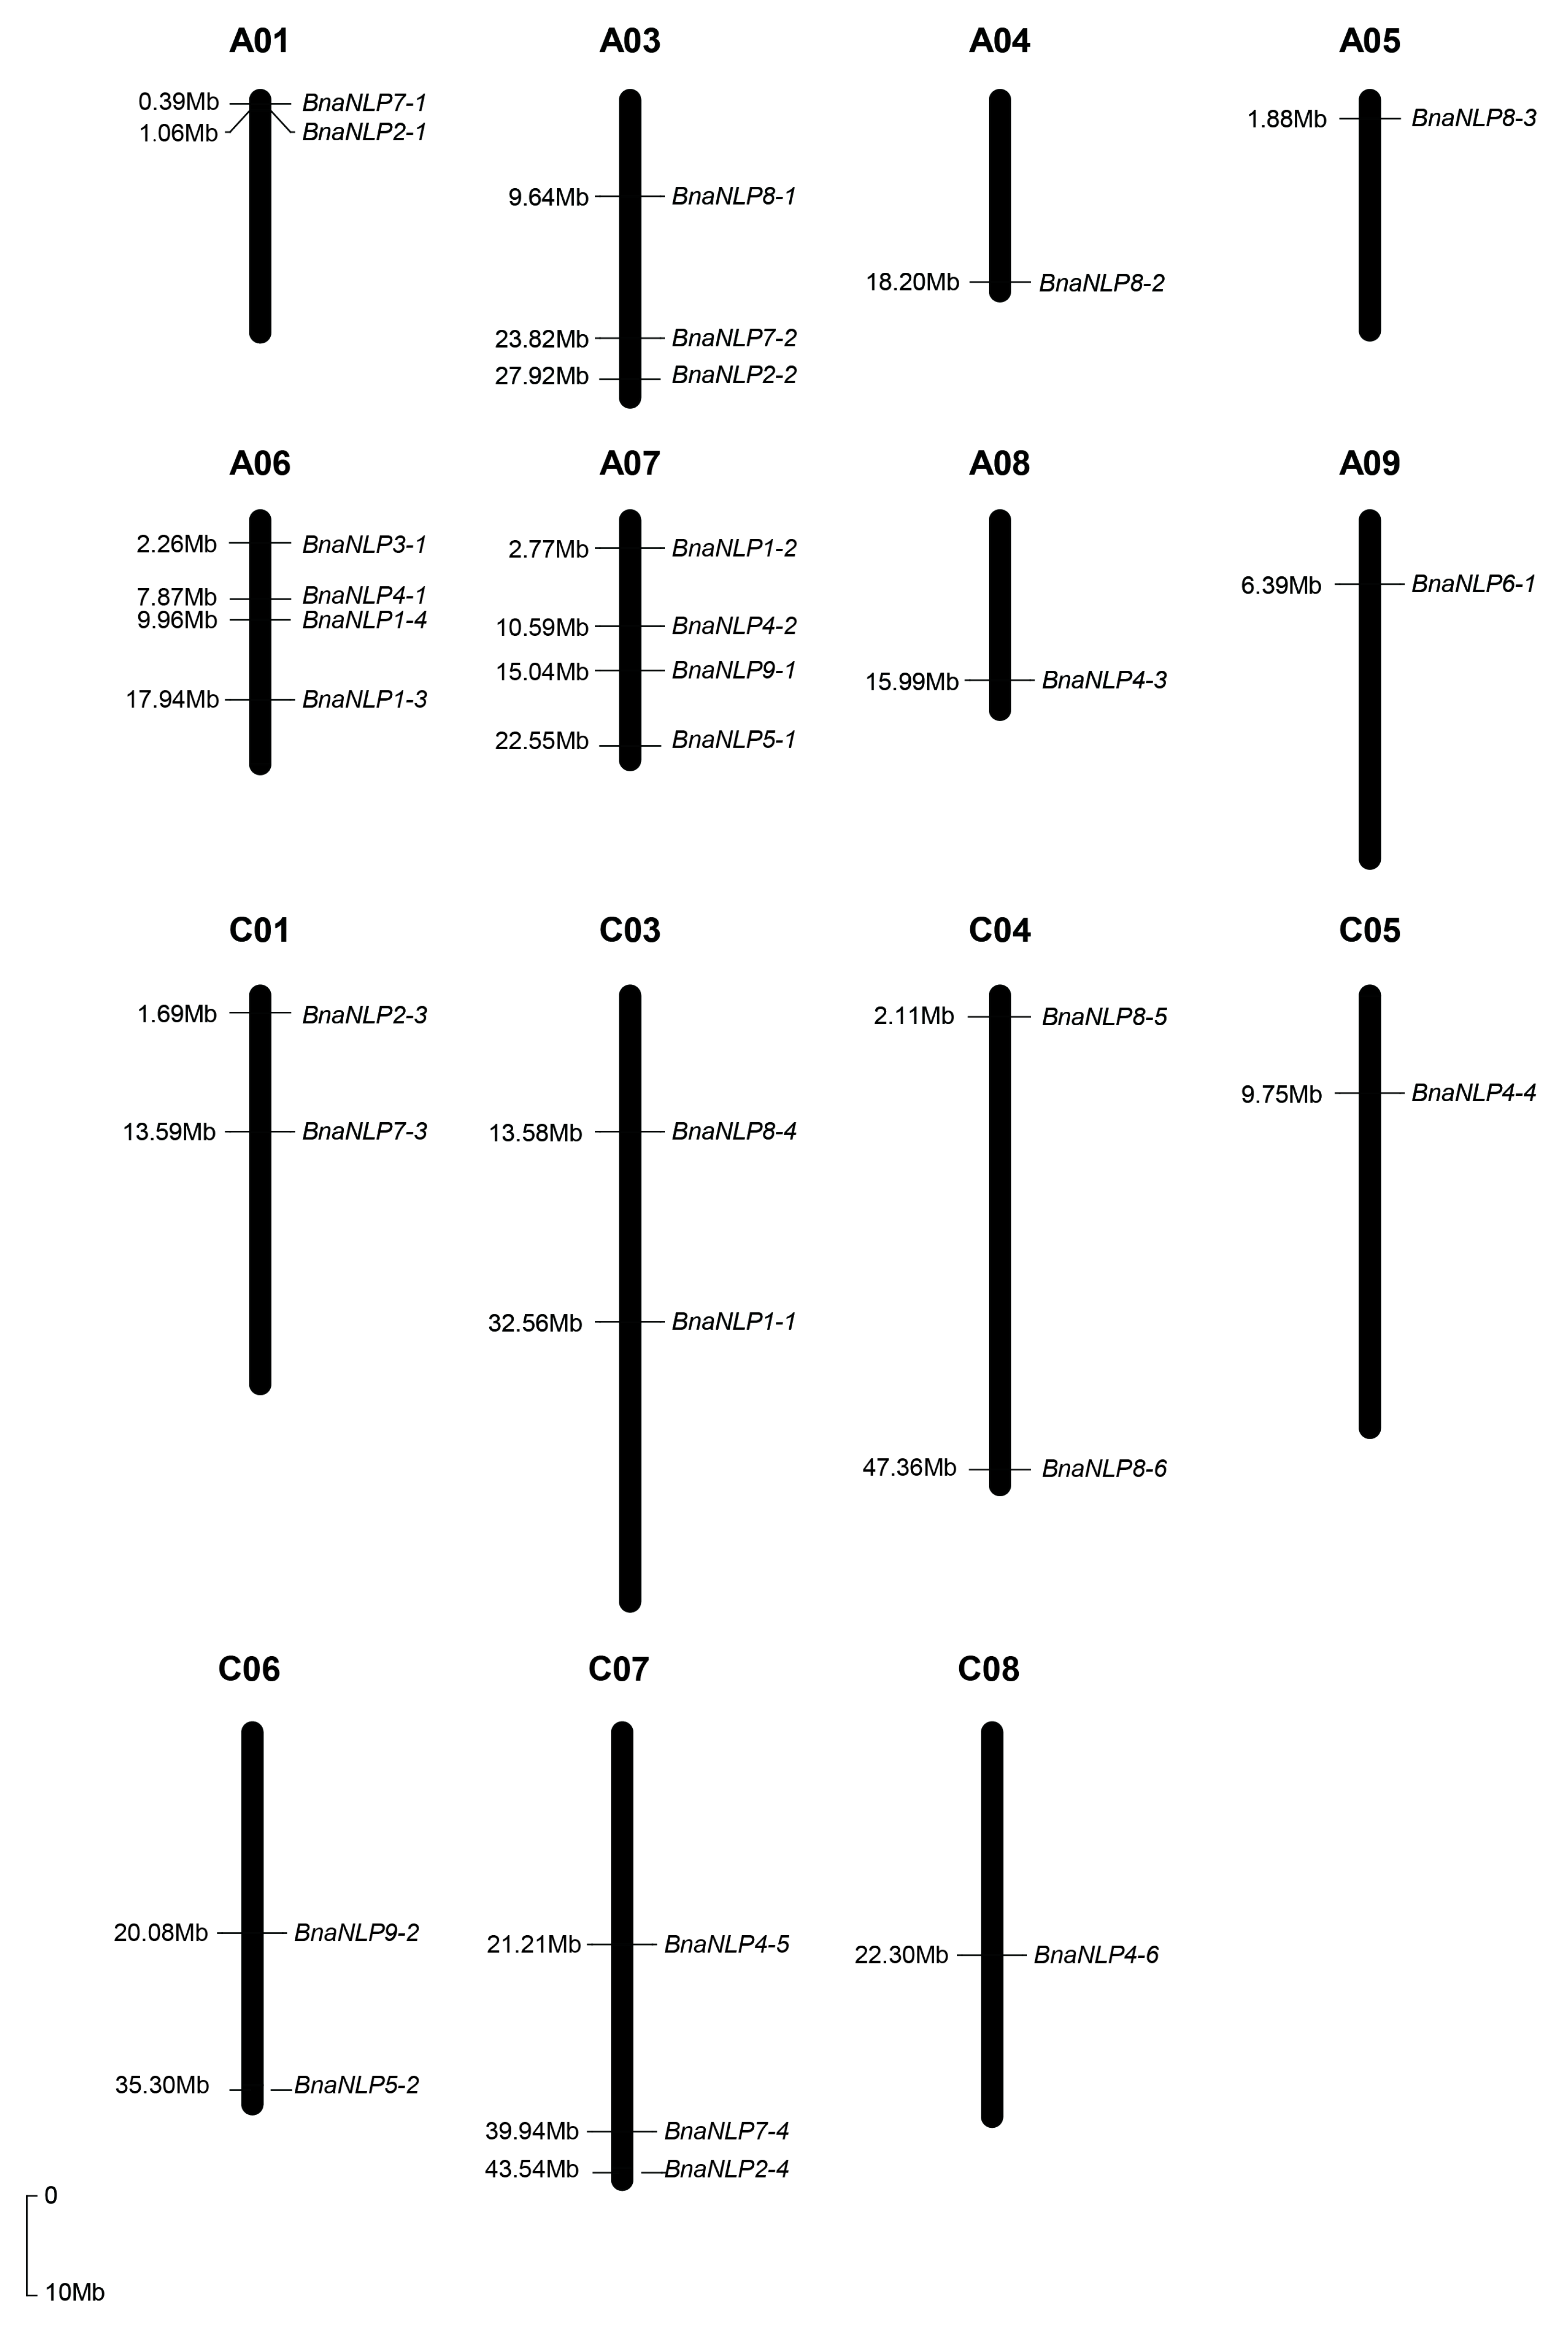
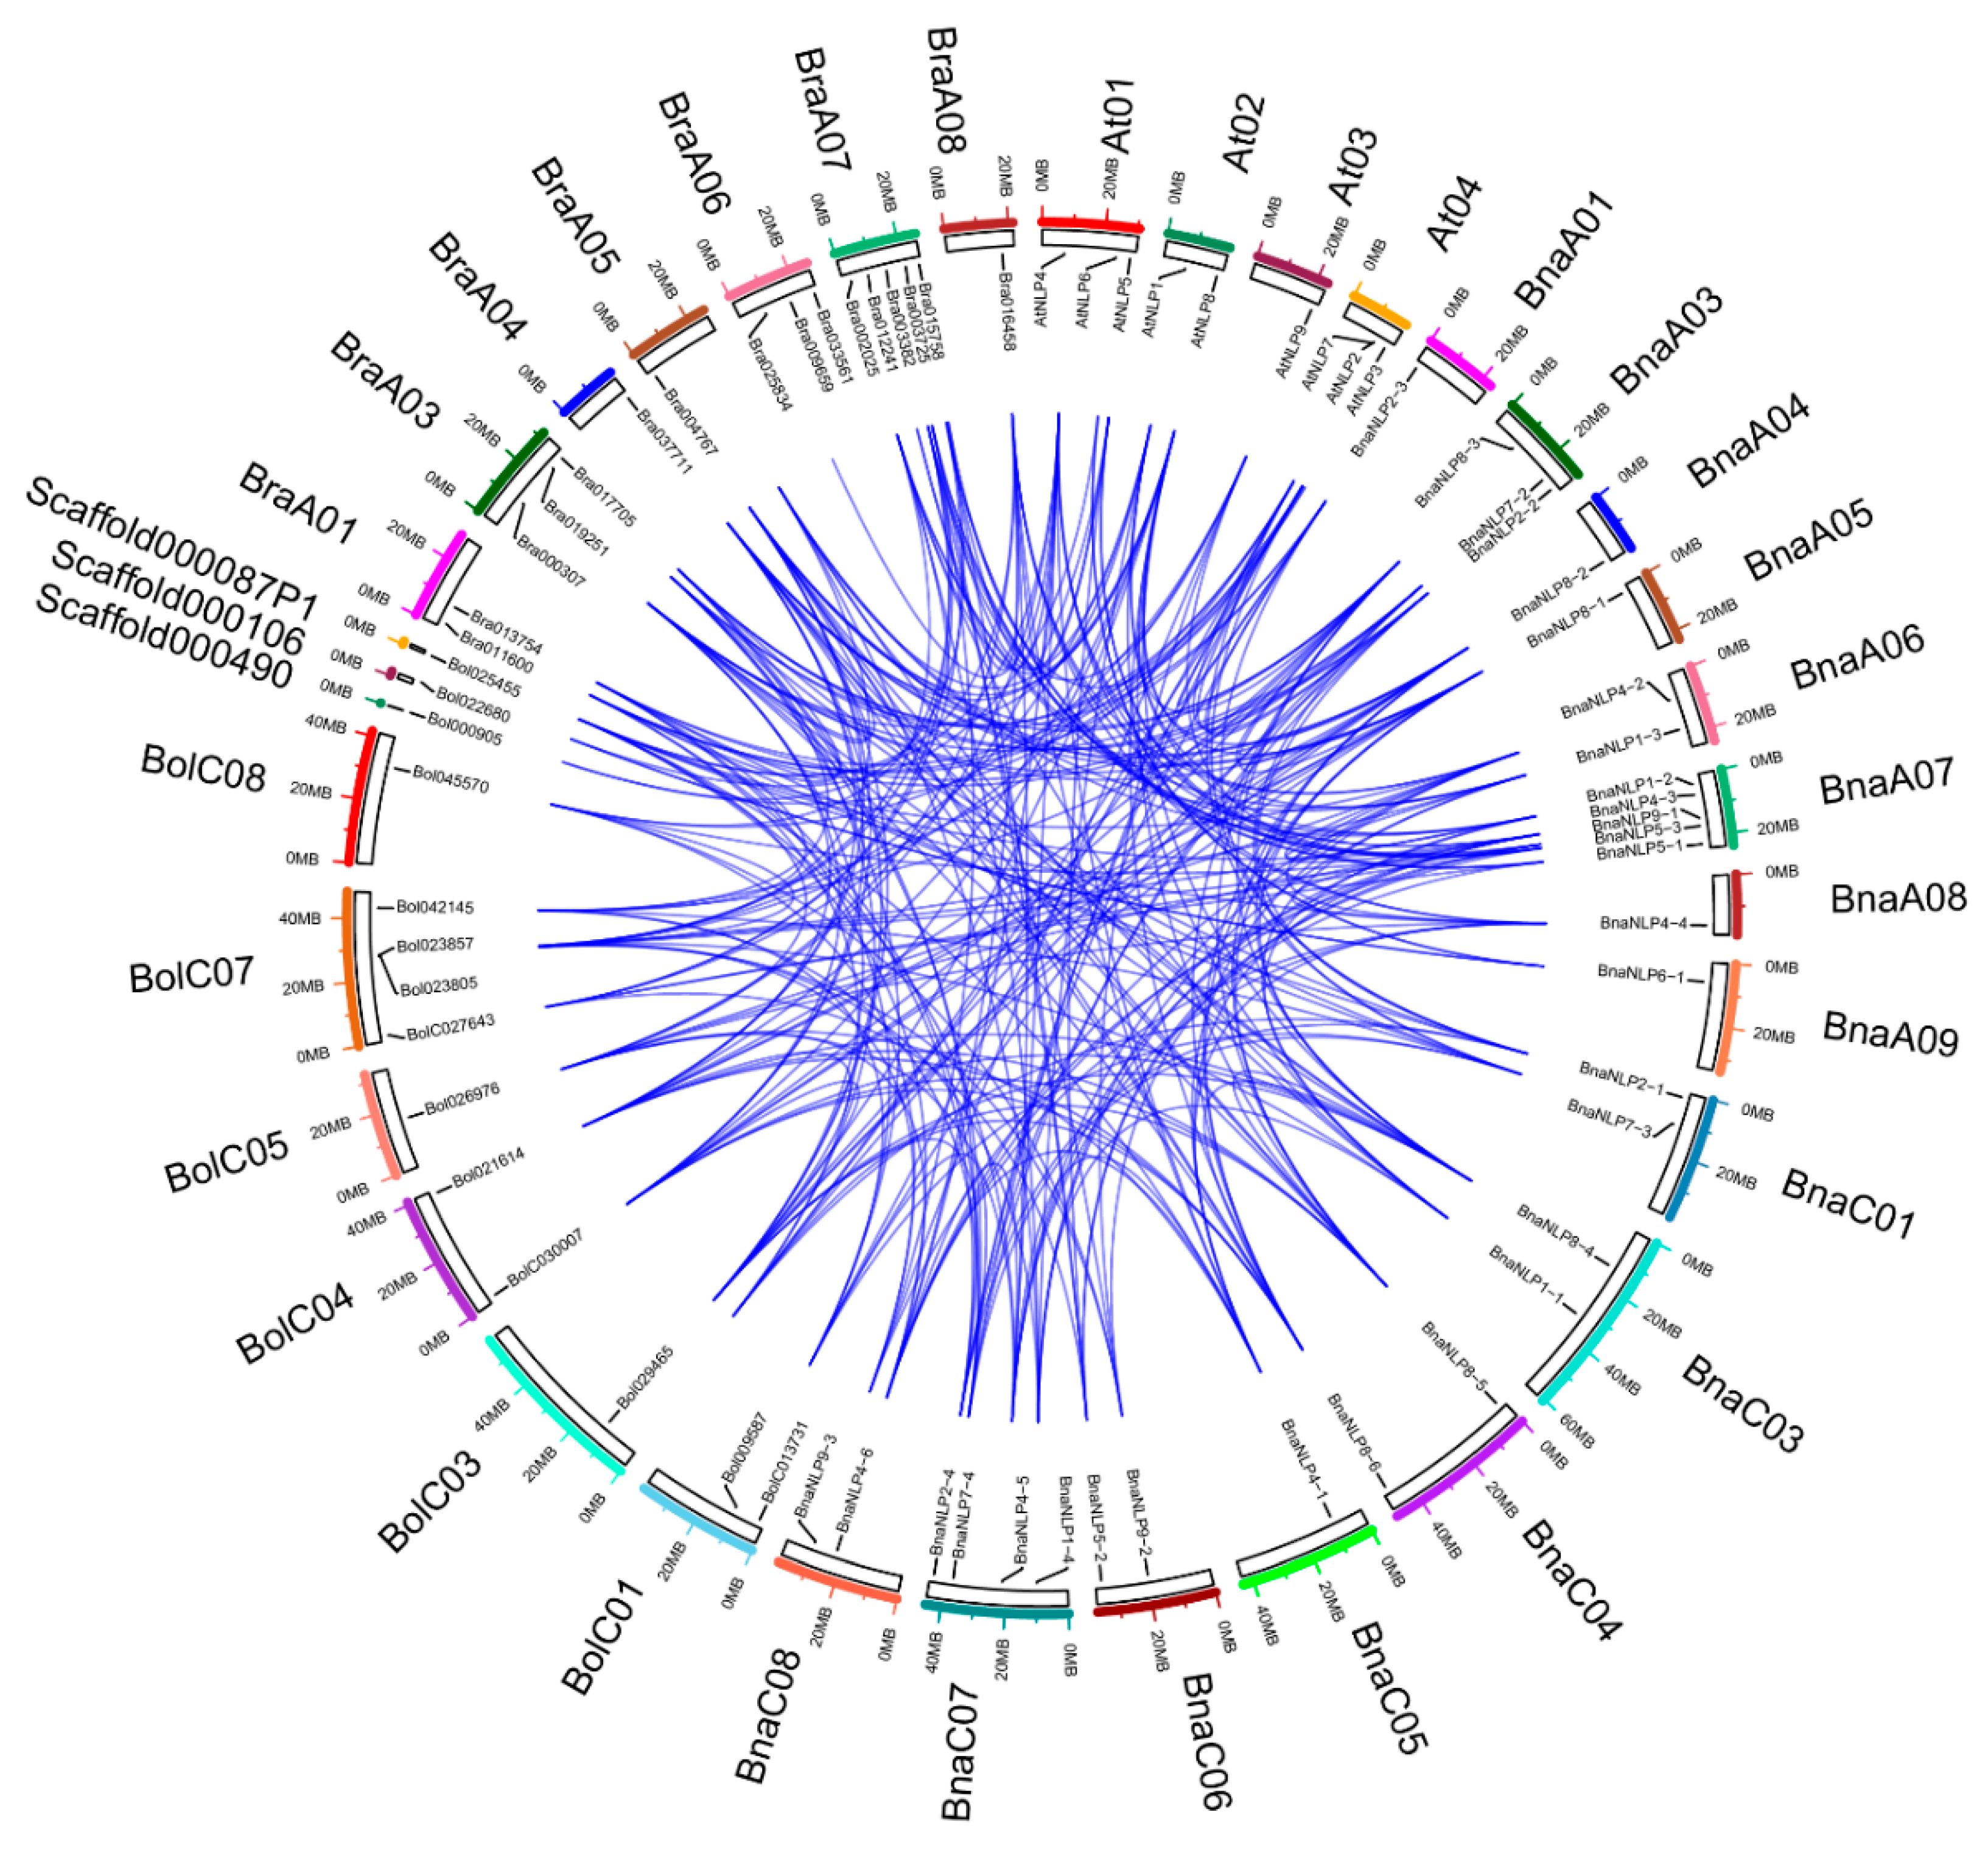
2.3. Chromosome Location and Ka/Ks Ratio Calculation

Chromosome location analysis revealed that 31 BnaNLP genes are located on 16 chromosomes in B. napus, with 16 genes in the A subgenome and 15 in the C subgenome (Figure 3, Table S2). Four BnaNLP genes were identified on chromosomes A06 and A07, and three were found on chromosomes A03 and C07. Two BnaNLP genes each were found on chromosomes A01, C01, C03, C04 and C06, and only one BnaNLP gene was found on chromosomes A04, A05, A08, A09, C05 and C08. No BnaNLP genes were found on chromosomes A01, A010, C01 and C09. In addition, all BnaNLP genes share syntenic relationships with NLP members in A. thaliana, B. rapa, and B. oleracea (Figure 4), and no tandemly duplicated BnaNLP family genes were identified.
To explore the selective pressure on BnaNLP genes, we calculated the non-synonymous/synonymous mutation ratio (Ka/Ks); Ka/Ks > 1 indicates positive selection, Ka/Ks = 1 indicates neutral selection, and Ka/Ks < 1 indicates purifying selection [30]. The Ka/Ks ratio for all BnaNLP genes was <1, ranging from 0.0842 (BnaNLP4-1) to 0.5926 (BnaNLP8-4), indicating that these genes are functionally conserved (Table 2). A comparison of the Ka/Ks ratios of BnaNLP genes between the A and C subgenomes showed that the average Ka/Ks ratio was higher in the C subgenome (0.1901) than in the A subgenome (0.1728), suggesting that BnaNLP genes in the C subgenome experienced higher selection pressure during the evolutionary history of B. napus. A comparison of Ka/Ks ratios among the three groups indicated that the average Ka/Ks ratio in group III was higher than that in groups I and II and that BnaNLP genes in group II had the lowest average Ka/Ks ratio among the three groups (Table 2). Unlike the BnaNLP8 subfamily, most homologous members in the remaining subfamilies possessed similar Ka/Ks ratios, suggesting that the homologous genes in the BnaNLP8 subfamily might have been subjected to different evolutionary pressures after the whole genome triplication (WGT) event in B. napus.

2.4. Gene Structure and Conserved Motif Analyses

To compare the exon/intron structures of AtNLPs and BnaNLP genes, we aligned the coding sequences with their corresponding genomic sequences. Similar gene structures were not only observed in homologous genes in B. napus, but they were also found within NLP homologs in B. napus and A. thaliana (Figure 1B). Most BnaNLP members in groups I and II contain four exons and three introns, while BnaNLP2-1/4-6/4-2 genes contain five exons and four introns. Most members in group III contain at least six exons and five introns, except for BnaNLP8-3 (five exons and four introns) and BnaNLP8-6 and BnaNLP9 (seven exons and six introns each). The similar gene structures observed in the same BnaNLP subfamilies are consistent with their phylogenetic relationships.
To better understand the structural diversity of BnaNLP proteins, we identified 15 putative motifs in the proteins using the MEME/MAST program (Figure 1C,D). Motifs 1/2/3/4/5/7/9 were observed in all 31 BnaNLP proteins, while motifs 6/10/12 were absent in BnaNLP4-4 protein, and motifs 8/11 were not detected in BnaNLP3-1 protein. While motifs 14/15 were detected in most BnaNLP proteins, motif 14 was absent from the BnaNLP8 and BnaNLP9 subfamilies and motif 15 was absent from BnaNLP4-3/4-6 proteins. Motif 13 was only detected in the BnaNLP7 subfamily.
Sequence alignment showed that motif 1 is the conserved GAF domain. InterProScan annotation showed that motif 2 is the RWP-RK domain, which plays a key role in N-mediated control of development. Motif 6 is the PB1 domain, comprising approximately 80 amino acid residues. BnaNLP proteins in the same group share similar motifs, suggesting that similar BnaNLP members share conserved biological functions.

2.5. Prediction of TF Binding Sites in the BnaNLP Promoters

TF binding sites (TFBSs) are short, specific DNA sequences that bind with TFs to regulate the transcription of genes. TFBS identification is a key step in understanding transcriptional regulation mechanisms and establishing transcriptional regulatory networks. To further understand the transcriptional regulation and potential functions of BnaNLPs genes, we screened for TFBSs in the 2000-bp upstream promoter sequences of these genes using PlantPan2.0 [31]. Sixty-three types of TFBSs were detected in the promoters of BnaNLP genes, involving 43 TF families (Table S3). TFBSs for 29 TF families were observed in all of the BnaNLP promoters, such as binding sites for AP2, GATA, NAC, and MADS-box TFs. In addition, BnaNLP9-2 might be associated with physiological processes, such as plant resistance and aging, and thus its promoter contained more binding sites for the WRKY TFs compared with other family members (Table S3).

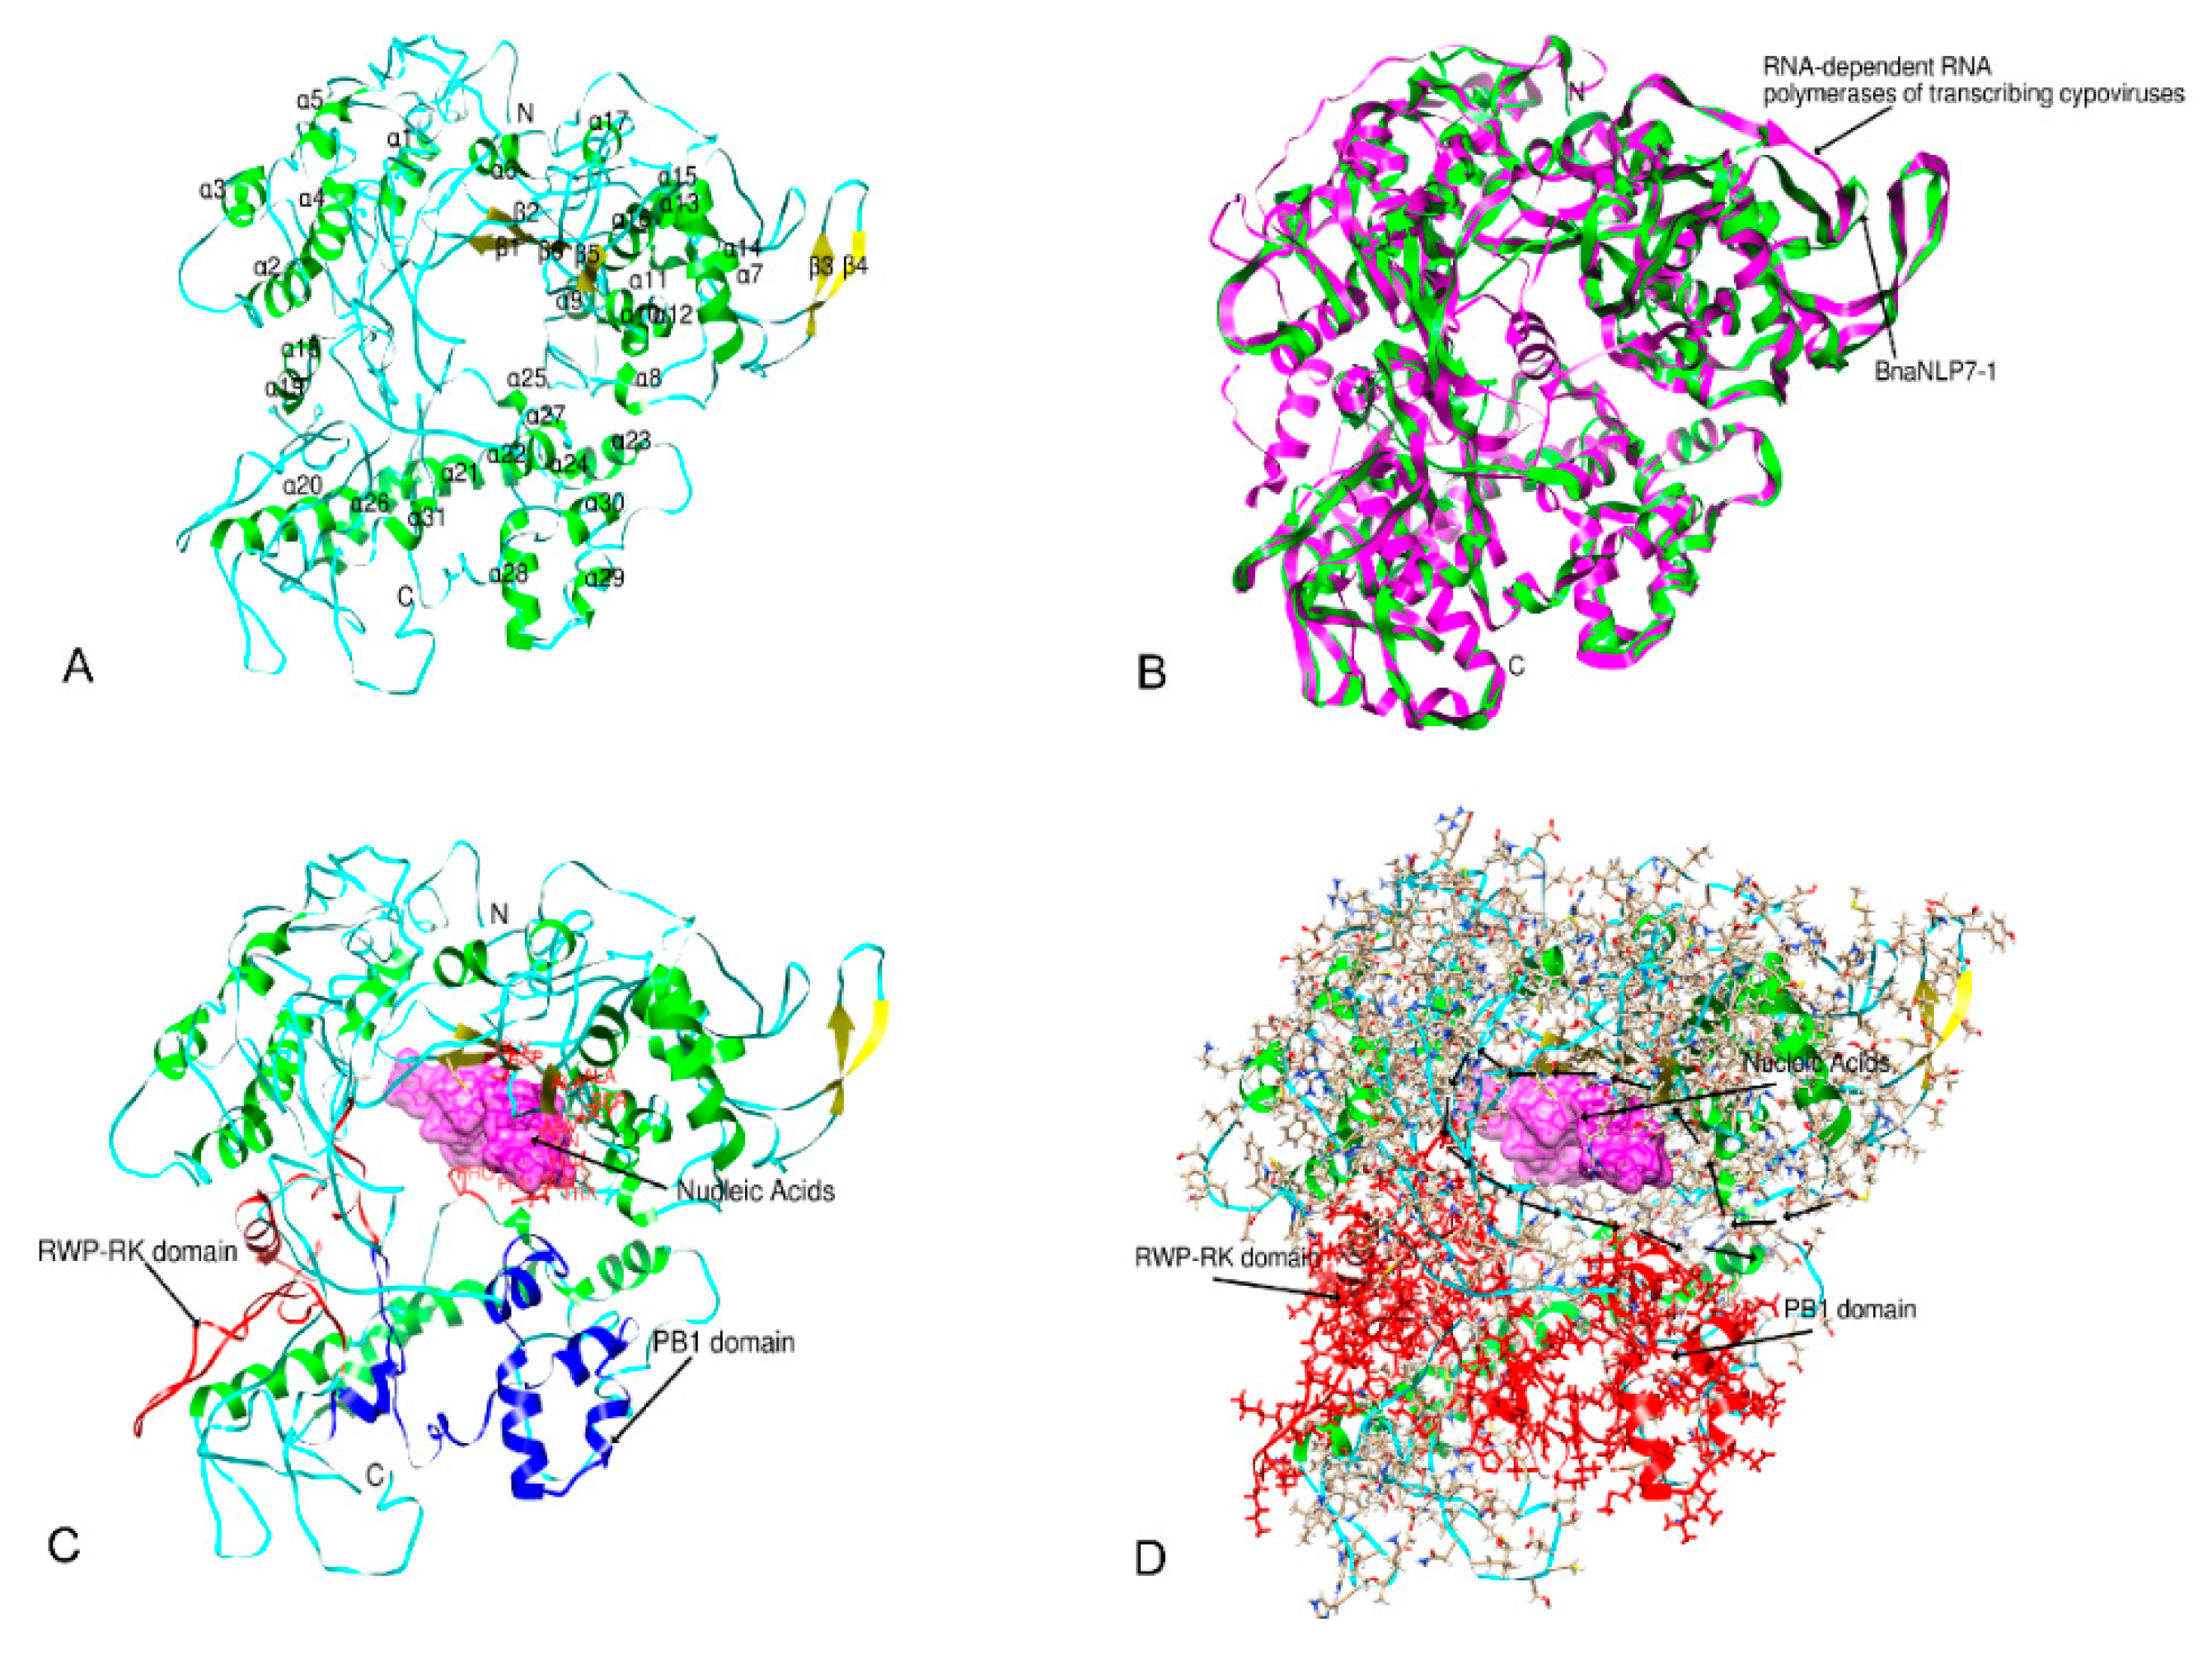
2.6. Three-Dimensional Structure Prediction

We predicted the three-dimensional structure of BnaNLP7-1 protein, a representative BnaNLP proteins, using I-TASSER [32]. The best template used for the 3-D structure prediction was the RNA-dependent RNA polymerases of transcribing cypoviruses [33]. The sequence identity between BnaNLP7-1 and the 3JA4 template was 0.18 across the whole template. The coverage of the threading alignment (equal to the number of aligned residues divided by the length of the query protein) was 0.96. Alignment with a normalized Z-score > 1 indicates good alignment and vice versa. The normalized Z-score of the threading alignments was 2.83, suggesting that good alignment was obtained in our prediction. The modeled structure for BnaNLP7-1 has 31 α-helices and five β-strands (Figure 5A). The RWP-RK domain contains two α-helices (α18 and α19), while the PB1 domain contains five α-helices (α27, α28, α29, α30, and α31). The two conserved domains also possess many loops and lack β-strands.
NLP proteins are plant-specific TFs that play key roles in regulating Nitrogen responses. To gain deeper insight into their biological function, COFACTOR and COACH [33] were used to predict the binding activities of the BnaNLP proteins with the promoters of downstream genes. The 2r7rA ligand (PBD: 2r7rA) [34] was used to bind BnaNLP7-1 protein as the nucleic acid substrate. The docking results showed that Gln320, Ala322, Leu323, Gln343, Thr344, Trp345, Gly369, Asp381, Ala383, Ala499, Ser500, Gly501, Phe767, and Pro768 are involved in ligand binding (Figure 5C). Interestingly, the binding of BnaNLP7-1 and a nitrogen deficiency-responsive cis-element form a ring that associates with polymerase II transcription (Figure 5D). No binding ability was detected for two conserved domains (RWP-RK and PB1) due to the lack of a binding site in their sequences, suggesting that those two conserved domains not function in ligand binding.

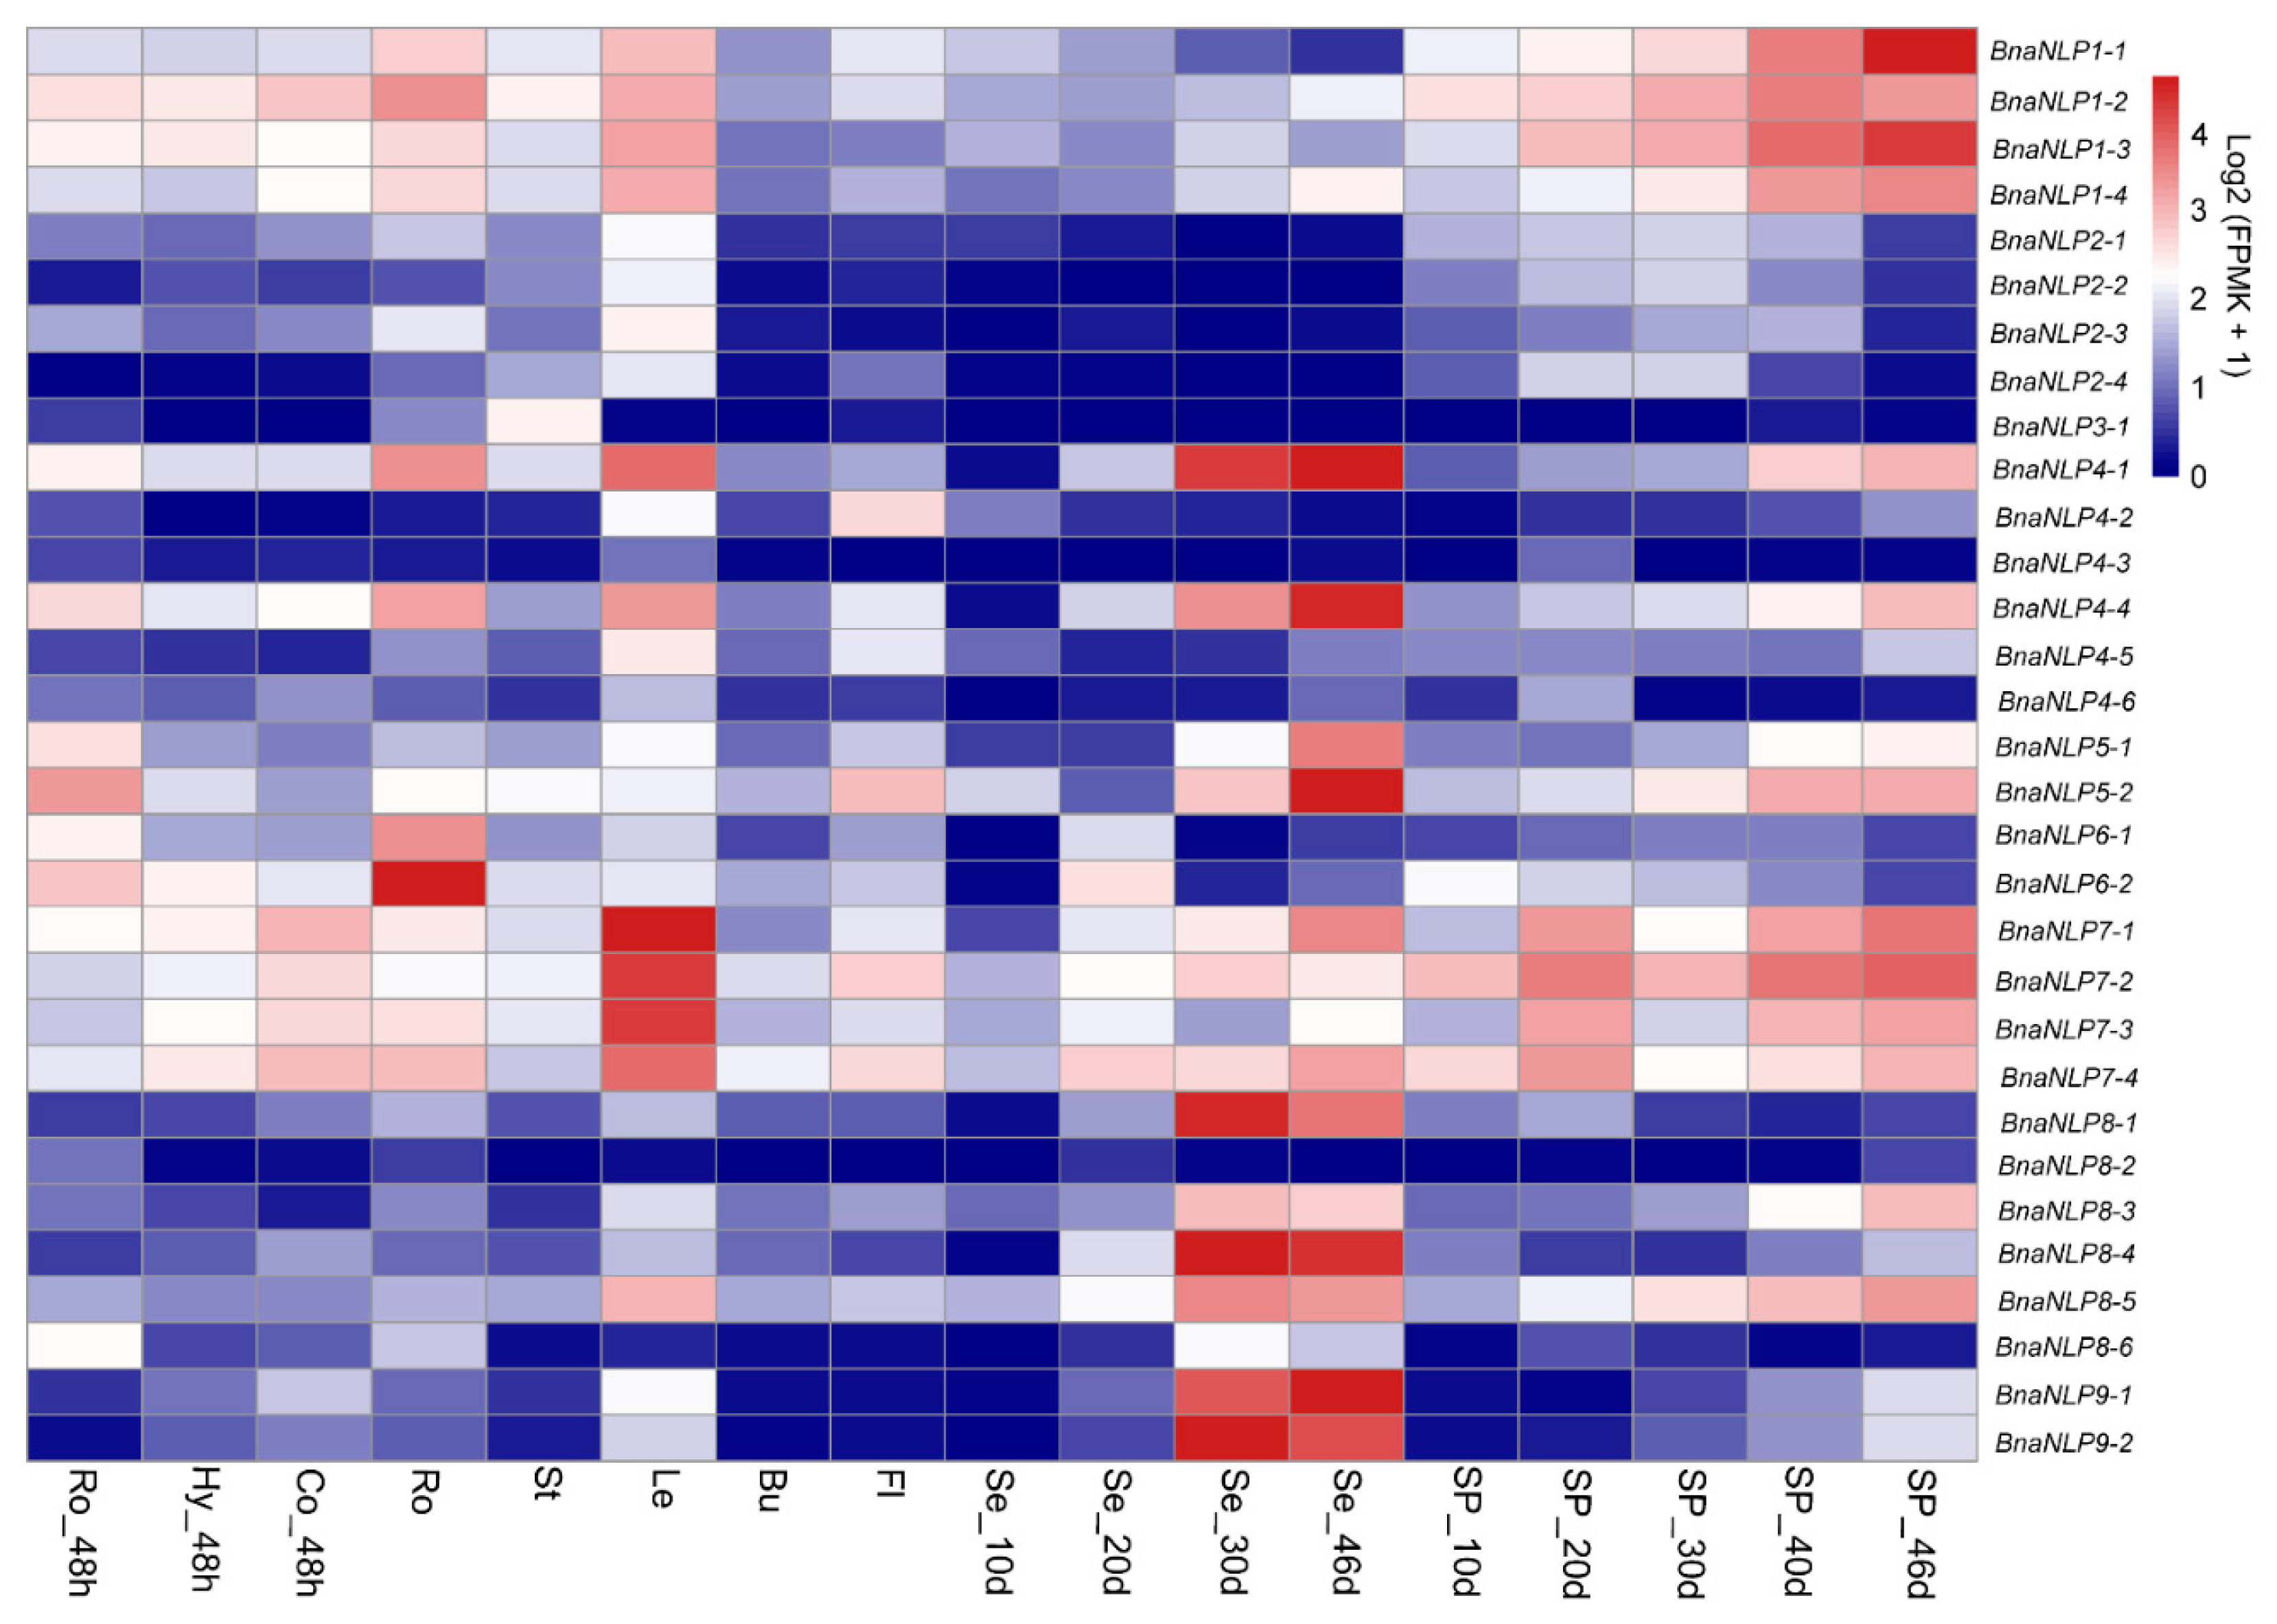
2.7. Organ-Specific Expression Patterns of BnaNLP Genes

To investigate the organ-specific expression profiles of the BnaNLP genes, we subjected 17 types of organ to RNA-seq. Calculation of the expression levels of the BnaNLP genes revealed diverse expression patterns in different subfamilies (Figure 6). Four BnaNLP1 subfamily members were highly expressed in silique pericarps (SP) at 30 days after flowering (DAF), especially BnaNLP1-1 and BnaNLP1-3. Four BnaNLP2 subfamily members and BnaNLP3 were expressed at extremely low levels in all organs examined. BnaNLP4-1, BnaNLP4-4, BnaNLP8-1, BnaNLP8-4, BnaNLP9-1 and BnaNLP9-2 were expressed at high levels in seeds at 40 and 3 DAF. Two BnaNLP5 genes were strongly expressed only in seeds at 46 DAF. Unlike the abovementioned subfamilies, two BnaNLP6 subfamily members were mainly expressed in roots, and four BnaNLP7 subfamily members were highly expressed in leaves. These results indicate that most BnaNLP genes were expressed at different levels in different organs and were preferentially expressed in specific organs.

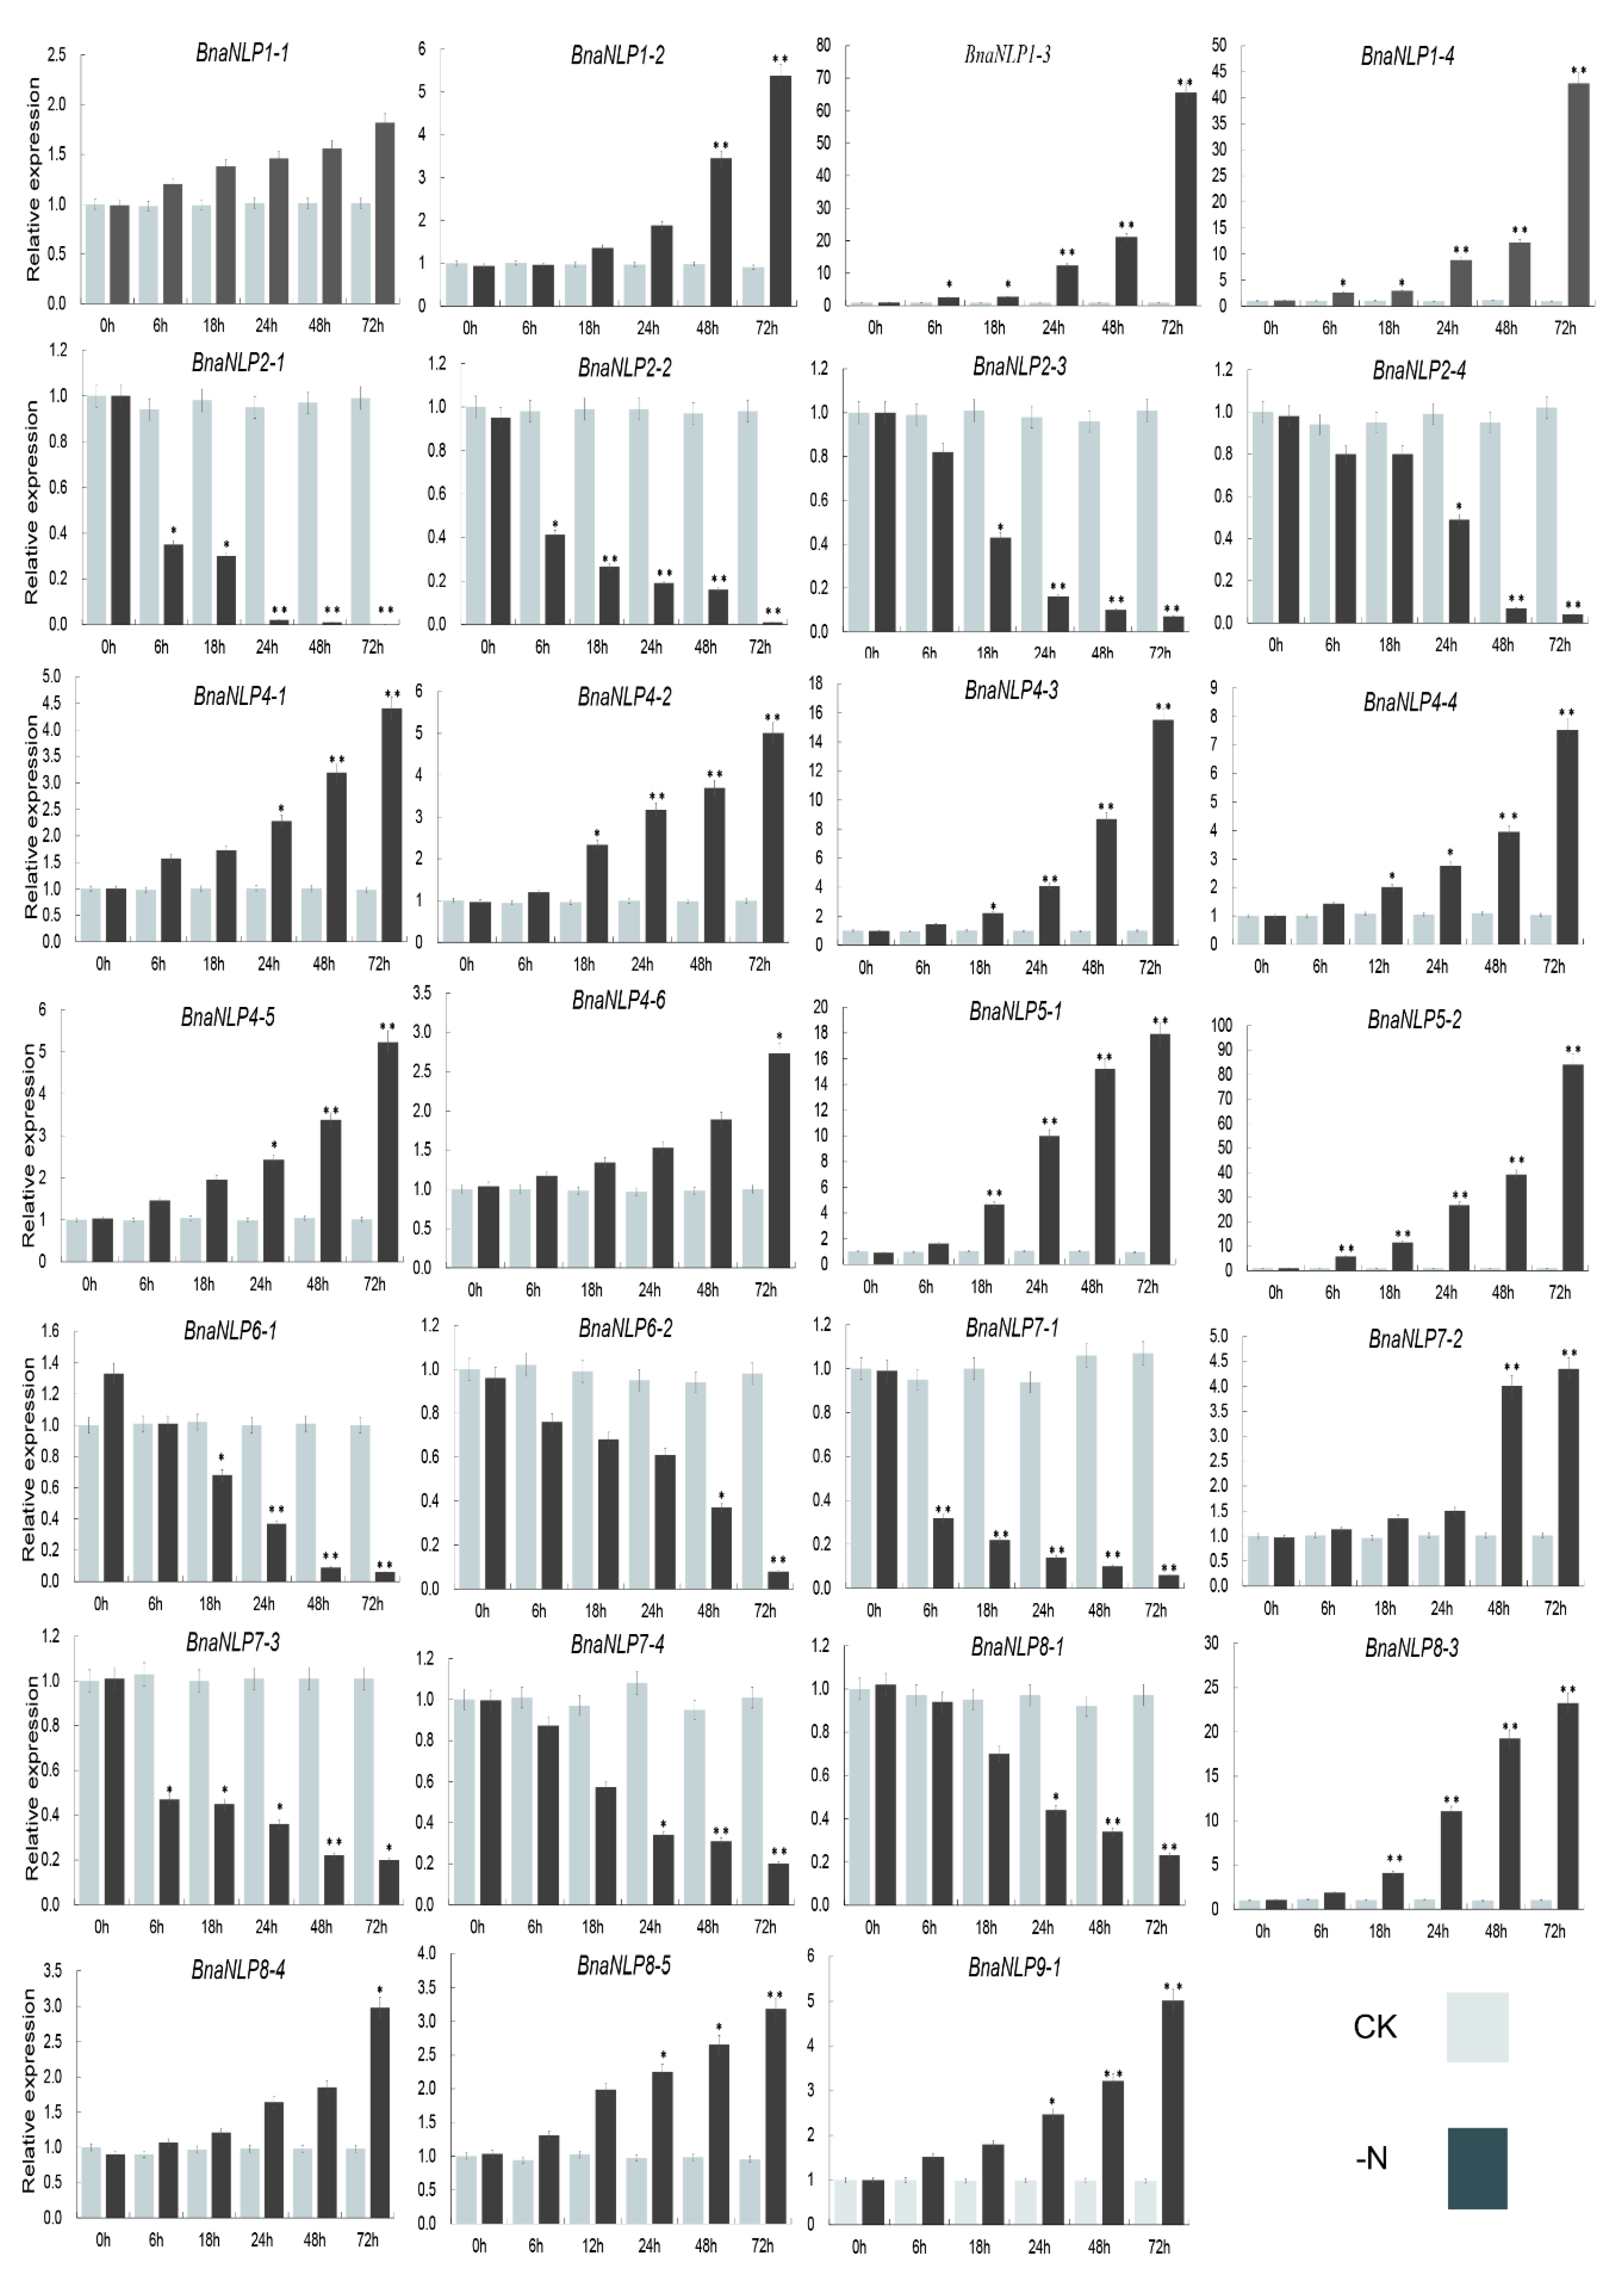
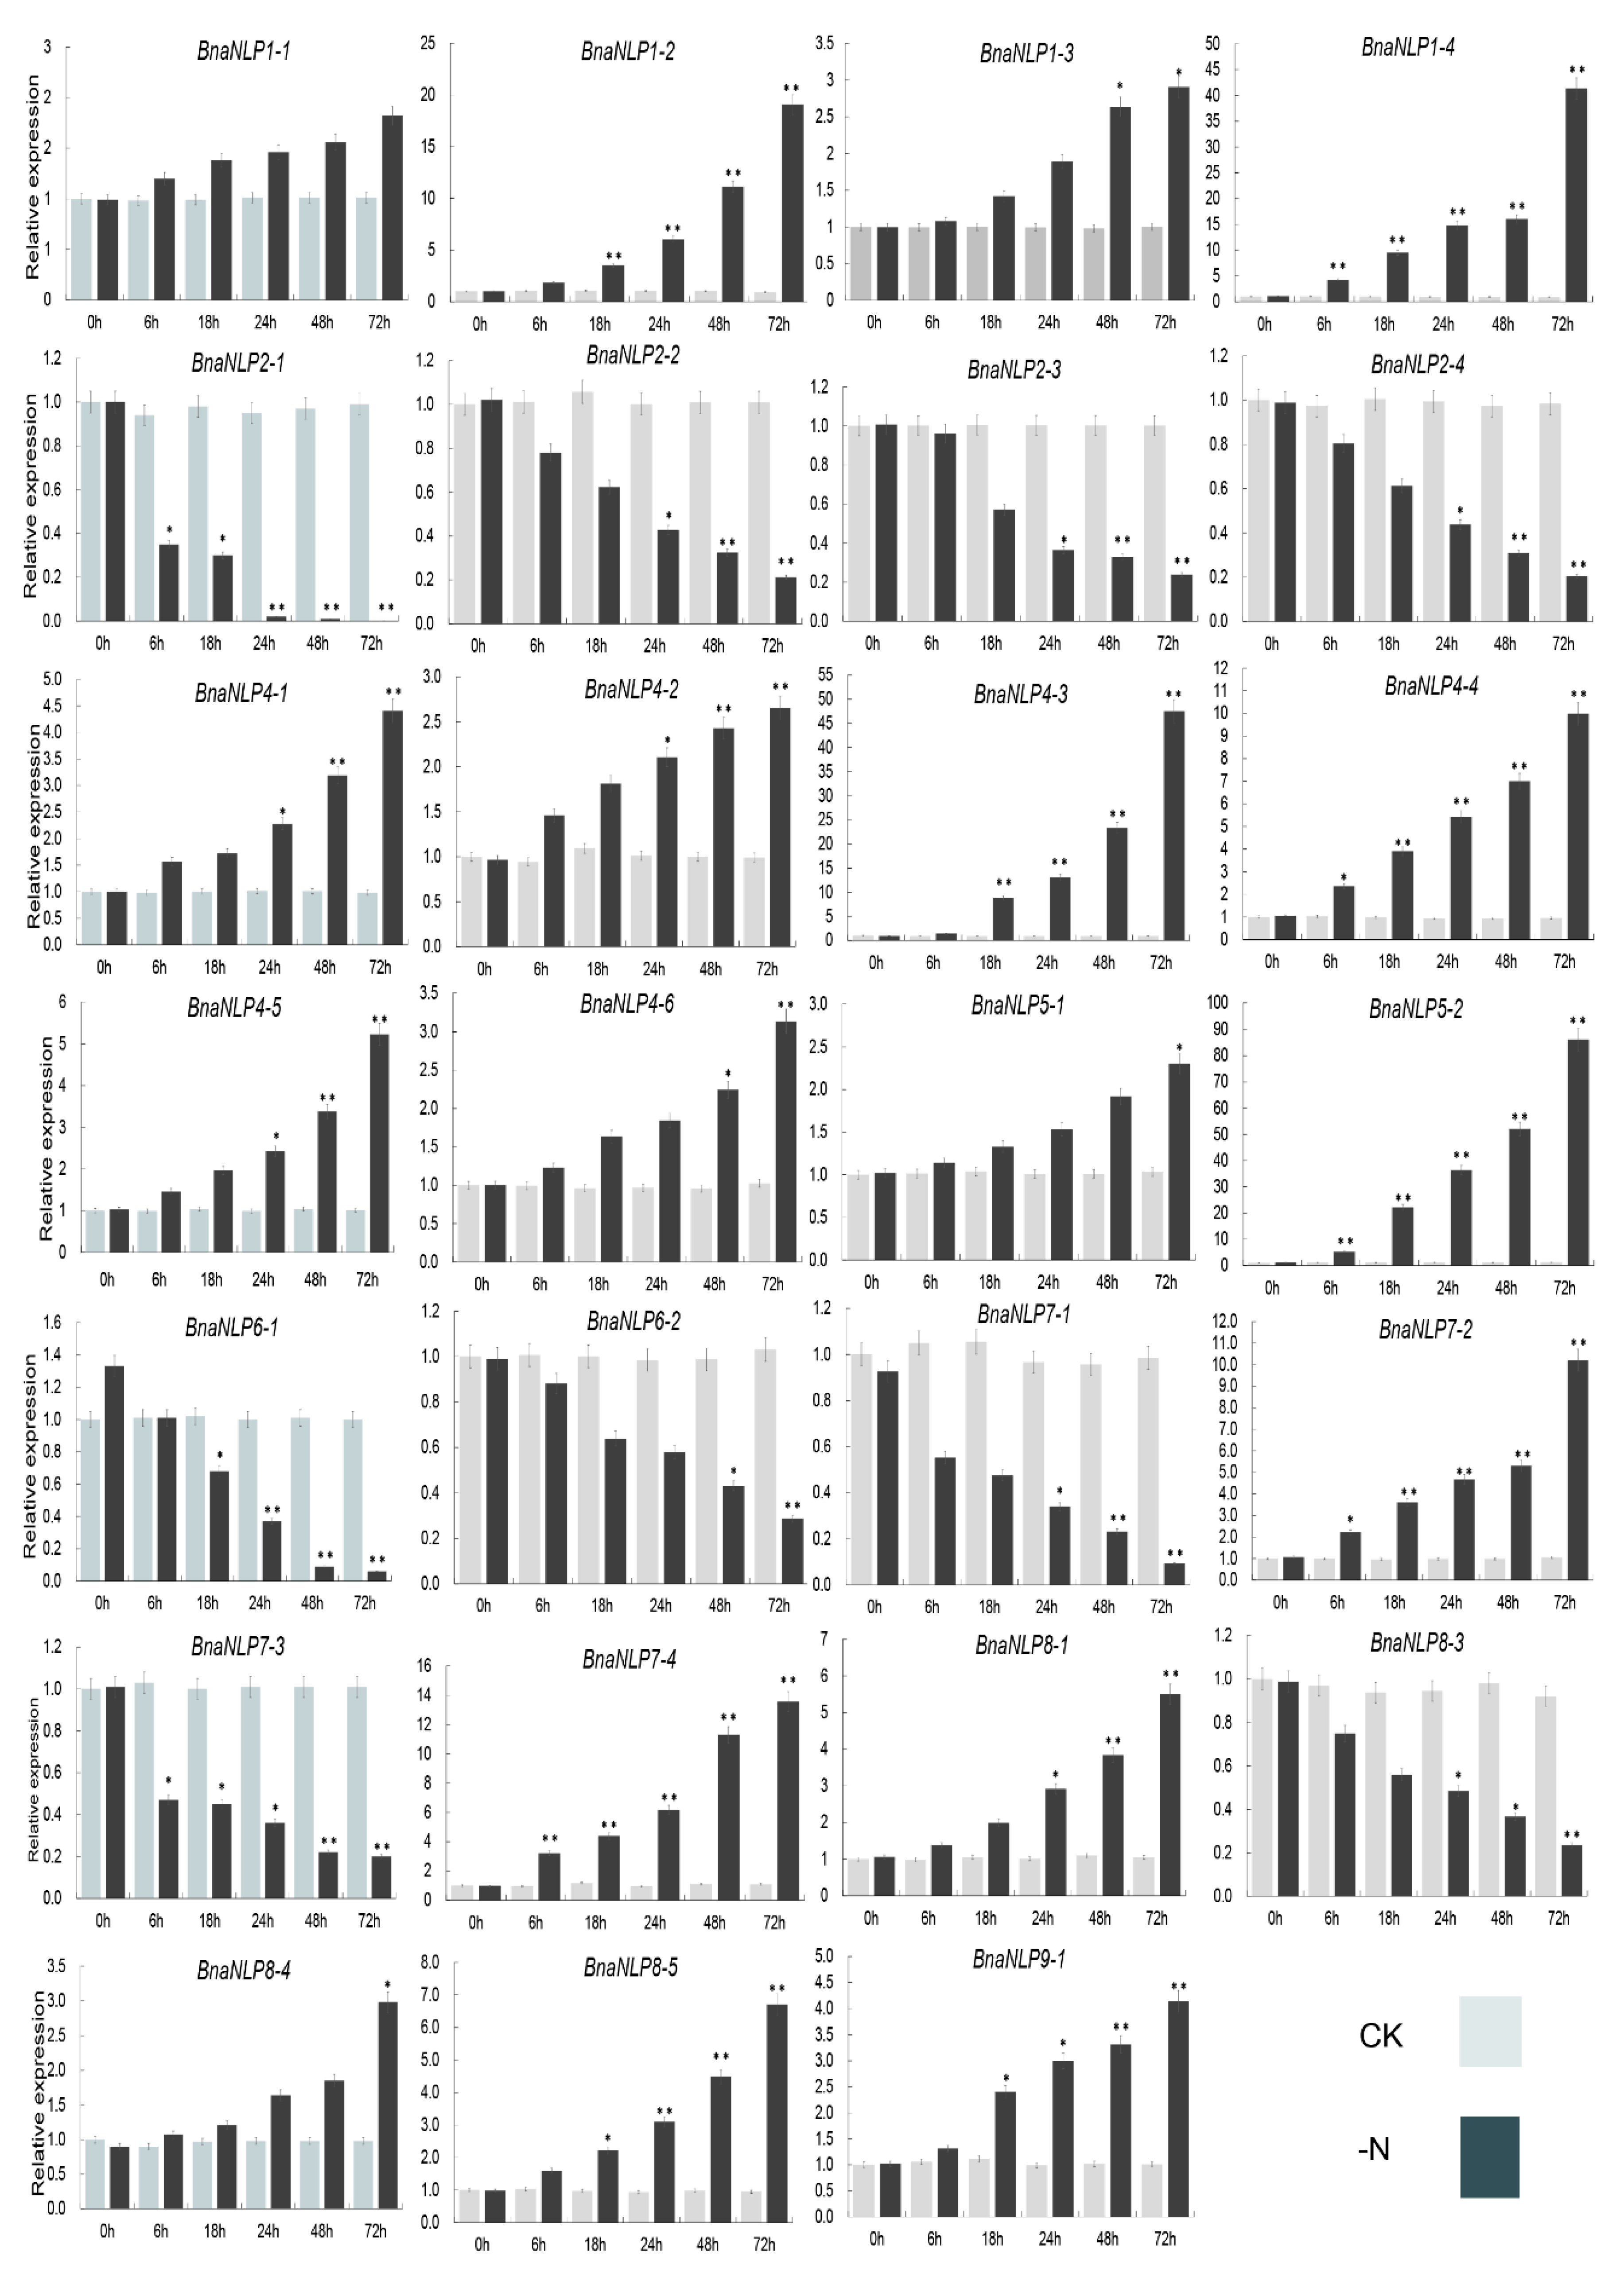
2.8. Expression Patterns of BnaNLP Genes under Nitrogen Deficiency

To investigate the expression patterns of BnaNLP genes under nitrogen deficiency, seedling leaves (SLs) and (seedling roots) SRs were harvested at various time points (0 to 72 h) after culturing in Hoagland nutrient solution with or without Nitrogen. In SLs, BnaNLP8-3, BnaNLP8-4, BnaNLP8-5, BnaNLP9-1, BnaNLP1, BnaNLP4, and BnaNLP5 subfamily members were upregulated under nitrogen deficiency treatment, while other members were downregulated (Figure 7). Most BnaNLPs were significantly upregulated or downregulated after 48–72 h of nitrogen deficient treatment, except for BnaNLP1-1 and BnaNLP8-4. In addition, a few genes were upregulated immediately after treatment and subsequently downregulated after 6 to 18 h, such as BnaNLP6-1 and BnaNLP8-1.
Interestingly, the responses of most BnaNLP genes in SRs to nitrogen deficiency treatment were highly similar to those in SLs (Figure 7 and Figure 8). BnaNLP1-3 and BnaNLP1-4 were the most sensitive genes to nitrogen deficiency treatment in SLs, whereas BnaNLP4-3 was most sensitive to this treatment in SRs (Figure 7 and Figure 8). Among the four BnaNLP7 subfamily members, three (BnaNLP7-1, BnaNLP7-3, and BnaNLP7-4) were downregulated after treatment in SLs, while BnaNLP7-2 was upregulated (Figure 7). BnaNLP7-1/3 were downregulated and BnaNLP7-2/4 were upregulated after treatment in SRs. In general, members of the same subfamily often shared similar expression patterns, except for members of the BnaNLP7/8 subfamilies, consistent with their phylogenetic relationships.

3. Discussion

3.1. Characterization of the NLP Gene Family in B. napus

Previous studies have revealed nine NLP family genes in Arabidopsis [8] and maize [17], six in rice [14], and five in sorghum [10]. In this study, we identified 31 BnaNLP family genes in B. napus. The BnaNLP gene family is larger than the NLP gene family in other plant species, because B. napus experienced an extra WGT and merging events [35]. Interestingly, NLP family genes have showed long protein residues and slightly lower pI values in several species [10,14,20,29]. Similar results were also detected in BnaNLP genes (Table 1), which illustrated that this TFs prefer to be active in acidic conditions. In maize, most ZmNLP genes possessed four to six exons, with the exception of ZmNLP1 which contained seven exons [20]. Similarly, for NLP genes in Populus trichocarpa, most NLP also contained four to six exons, except for PtrNLP1 (two exons) and PtrNLP4 (seven exons) [29]. In this study, different gene structures were found among BnaNLP family members, and group I and II members had fewer exons (four to five) than group III members (five to six, BnaNLP8-6 and BnaNLP9 possessed seven exons), implying structural diversification among the BnaNLP subfamilies. NLP proteins contain two conserved domains, RWP-RK and PB1. All BnaNLP proteins identified in this study contain two domains, except for BnaNLP4-4, which contains only the RWP-RK domain. Sequence analysis of BnaNLP4-4 indicated that more than 50 amino acids (including the PB1 domain) are absent in its C-terminus, which was caused by sequence fragmentation in the evolution or sequencing error in the B. napus genome. The RWP-RK domain contains a helix-turn-helix motif and an amphipathic leucine zipper, which might be involved in DNA binding [10,11]; further studies showed that its activity is unrelated to nitrate signaling, whereas the N-terminal regions of NLPs function as a transcriptional activation domain to mediate this signaling [22]. However, our docking results suggested that this domain may not be involved in the binding of NLP protein with nucleic acids. The PB1 domain contains two α-helices and a mixed five-stranded β-sheet, which might play a key role in its protein-binding ability [15]. We found that the PB1 domain acts like a switch, which may involve controlling the initiation or stopping the binding process. Hence, the biological function of the PB1 domain in the protein binding process deserved further elucidation.
Previous studies suggested that the structurally characterized GAF domains bind with low-molecular-weight ligands, including cGMP, 2-oxoglutarate, nitric oxide and nitrate, or serve as homodimerization modules associated with gene regulation in organisms ranging from bacteria to higher plants [3,36,37]. Due to the limitation of sequence identity between BnaNLP7-1 and the template, the binding site for GAF domain was not identified in our docking results. But we found the conserved sensing and signaling GAF domain in all BnaNLP proteins. Although legumes have specifically evolved as the NIN gene with functional responsibility for symbiotic nitrogen fixation, the presence of these three domains (GAF, RWP-RK, PB1) allows the NLPs to function in various aspects of nitrogen responses in non-nitrogen fixating plants, including nitrogen sensing, transcriptional modulation, and signal transduction [20]. In this study, all BnaNLP proteins possessed the three domains (besides BnaNLP4-4), reflecting the pivotal roles of BnaNLP proteins in rapid response and adaptation to nitrogen deficiency in B. napus.

3.2. Phylogenetic Relationship and Duplication Analysis of BnaNLPs

At least three ancient copies of NLP genes are thought to have existed in the ancestor of monocots and dicots [10], and two NLP genes have experienced one round of duplication in Arabidopsis, whereas the third gene has undergone several rounds of duplication since the divergence of eudicots and monocots. Our phylogenetic analysis of NLP genes in nine plant species provided evidence for the hypothesis that the ancestor of monocots and dicots contained at least three NLP gene family members (Figure 2), since there is at least one NLP gene in each of three NLP groups in A. trichopoda. Our results suggest that the ancestor of NLPs in most plant species has experienced one round of duplication, while the ancestor of NLPs in group III may have been duplicated more than once in the Brassicaceae lineages, perhaps due to the WGT event that have occurred in Brassicaceae species.
In general, B. rapa and B. oleracea contain three syntenic copies of each A. thaliana gene [28,29] and B. napus contains six, since it was generated from B. rapa and B. oleracea [35]. In this study, 0–2 copies of each NLP gene were identified in B. rapa and B. oleracea and 1–6 copies were identified in B. napus, perhaps due to genome shrinkage or gene loss after WGT. We detected 31 syntenic copies of BnaNLP genes and 16 syntenic copies of BraNLP genes in ancient WGT blocks, suggesting that the NLP gene family in the A subgenome of Brassica crops is highly conserved. However, 14 syntenic gene copies were found in ancient WGT blocks in B. oleracea, only eight of which contained both the RWP-RK and PBl domains, perhaps due to assembly errors of B. oleracea genome.

3.3. Expression Profiling and Response of Genes to Nitrogen Deficient Conditions

The expression patterns of NLP genes in different organs have been investigated in several plants. In rice and Arabidopsis, NLPs are expressed in almost all organs [14]. AtNLP8 and AtNLP9 are preferentially expressed in senescent leaves and seeds and are expressed at moderate or very low levels in other organs [14]. In rice, OsNLP1 and OsNLP3 are highly expressed in source organs, representing the most abundant OsNLP transcripts [14]. NLPs in P. trichocarpa are highly expressed in leaves, roots, male catkins, xylem, seeds, and female catkins [29]. In this study, we found that most BnaNLP genes were expressed in leaves, while only the four BnaNLP7 subfamily members were highly expressed in leaves (Figure 6). Similar to previous reports, the accumulations of BnaNLP genes in leaves might also be used for storing nitrogen to coordinate leaf expansion and photosynthetic capacity, and nitrogen supply can improve their storage to promote leaf growth and biomass [38]. BnaNLP1 genes were highly expressed in silique pericarps, the main source organ during the podding stage in B. napus, suggesting that BnaNLP1 subfamily members may be involved in nitrogen storage or supply mainly in silique pericarps. In addition, six NLPs (BnaNLP4-1, BnaNLP4-4, BnaNLP8-1, BnaNLP8-4, BnaNLP9-1, and BnaNLP9-2) were strongly expressed in seeds at 40 and 46 DAF, suggesting that these genes may function in nitrogen assimilation during seed maturation. BnaNLP6 subfamily members were primarily expressed in roots, which is similar to the expression patterns of NLP genes in maize [20]. Different from nitrogen-fixing plants, the sources of nitrogen in Brassica species are mainly based on the absorption of nitrate nitrogen in soil though roots [2,39]; the strong expression of BnaNLP6 subfamily in root may reflect the important roles of BnaNLP6 in nitrogen absorption in roots of B. napus. We found that members of the same subfamily share similar expression profiles, including BnaNLP1, BnaNLP2, BnaNLP5, BnaNLP6, BnaNLP7 and BnaNLP9 subfamilies, suggesting basic functional conservation within each subfamily [14]. However, members of the BnaNLP4 or BnaNLP8 subfamily showed less similar expression profiles and some of them are not expressed at any organs, illustrating that nonfunctionalization or subfunctionalization occurred in the two BnaNLP subfamilies.
Nitrogen deficiency treatment can trigger rapid, extensive transcriptional changes of genes involved in a wide range of cellular and physiological processes [40,41]. In the current study, most BnaNLP genes were up- or down-regulated under nitrogen deficiency treatment in both SLs and SRs, due to the specific functions in nitrogen remobilization during nitrogen deficiency [42]. These upregulated BnaNLP genes may play key roles in the distribution and remobilization of nitrogen in response to the short-time demand for nitrogen during nitrogen deficiency. Interestingly, the induction of BnaNLP genes was slower than that observed for the homologs in maize, which were up/downregulated within 2 h of nitrate treatment [20], pointing to different nitrogen utilization mechanisms between B. napus and maize.
In Arabidopsis, AtNLP7 regulates nitrate and nitrogen starvation responses [9] and was identified in a genetic screen for regulators of the primary nitrate response [2]. AtNLP7 binds to the promoters of 851 genes in response to nitrate signals, binding preferentially to the transcriptional start sites of target genes. Moreover, the accumulation of AtNLP7 in the nucleus occurs independently of transcriptional regulation, and inhibiting nuclear export mimics the nitrate signal [24]. In this study, we identified four BnaNLP7 subfamily members. Of these, three (BnaNLP7-1/7-3/P7-4) were downregulated and only the BnaNLP7-2 expression was upregulated in SLs after nitrogen deficiency treatment (Figure 7). However, BnaNLP7-1/7-3 were downregulated and BnaNLP7-2/7-4 were upregulated in SRs after nitrogen deficiency treatment, suggesting that BnaNLP7 subfamily members have experienced subfunctionalization during the polyploidy evolution of B. napus. The three different expression patterns in BnaNLP7 subfamily (upregulated in both SLs and SRs (BnaNLP7-2), downregulated in both SLs and SRs (BnaNLP7-1/7-3) and the exhibition of opposite regulated patterns in SLs vs. SRs (BnaNLP7-4)) point to the presence of at least three types of molecular mechanisms that function in response to nitrogen deficiency. Based on functional studies of AtNLP7, it could be speculated that there might be at least three groups of genes which are regulated by different BnaNLP7 subfamily members. Under the condition of nitrogen deficiency, upstream nitrogen signaling pathway genes activate different BnaNLP7 subfamily members in different organs, then the post-translationally activated BnaNLP7 regulate the expression of nitrate-inducible assimilation and downstream regulatory genes through interaction with NREs to improve the nitrogen absorption in roots and nitrogen assimilation in whole B. napus plants.
In summary, we found that BnaNLP genes have various expression patterns and most of them are extremely sensitive to nitrogen deficiency. This provides insights into the biological functions of BnaNLP genes in response to nitrogen deficiency.

4. Materials and Methods

4.1. Plant Materials and Treatments

Seeds of Brassica napus cultivar ZS11 were germinated in plant growth chambers (under a 16 h photoperiod at 25/18 °C day/night, 60% humidity, 250 µmoles/m2/s; PGC Flex, Conviron, MB, Canada) and transplanted into a field in Chongqing, China. To detect the expression patterns of BnaNLP family members in different organs, root (Ro), hypocotyl (Hy), and cotyledon (Co) organs were collected at 48 h after seed germination. Ro, stem (St), mature leaf (Le), bud (Bu), and flower (Fl) organs were harvested at the initial blooming stage, while seeds (Se) were harvested at 10, 20, 40, and 46 DAF, and silique pericarps (SP) were harvested at 10, 21, 30, 40, and 46 DAF in the field. Two biological replicates per sample were collected for RNA sequencing (RNA-seq) analysis.
To investigate the expression patterns of BnaNLP genes under nitrogen deficiency, B. napus seedlings were cultivated in pots in full-strength Hoagland solution without sand as a substrate in a plant growth chamber with a thermo-photoperiod of 25 °C for 16 h/18 °C for 8 h (light/dark) [43]. One-month-old seedlings were transferred into new full-strength Hoagland solution or modified N-deficient Hoagland nutrient solution for treatment. All nutrition solutions were renewed every 3 days. Three biological replicates of SLs and SRs were harvested after 0, 6, 18, 24, 48, and 72 h of treatment. All samples were immediately frozen in liquid nitrogen and stored at −80 °C.

4.2. Identification of NLP Family Genes in Plants

Genomic, coding sequences, and protein sequences from A. thaliana, B. napus, B. rapa, and B. oleracea were downloaded from the Arabidopsis Information Resource (TAIR, http://www.arabidopsis.org) and the Brassica Database (BRAD, http://brassicadb.org/brad). Sequences from A. trichopoda, rice, maize, sorghum, and grape were obtained from Phytozome 12.0 (www. phytozome.net).
To identify NLP genes in these species, nine NLP protein sequences from Arabidopsis were used as queries in a reciprocal Basic Local Alignment Search Tool Protein (BLASTP) analysis [44,45] using the threshold and minimum alignment coverage parameters described previously [46]. All NLP protein sequences were further analyzed using PfamScan (http://www.ebi.ac.uk/Tools/pfa/pfamscan/) to confirm the presence of two NLP-related domains, RWP-RK (PF02042) and PBl (PF00564), with an e-value cut-off of 1 × 10⁻⁵.

4.3. Phylogenetic Analysis of the NLP Family in B. napus

Multiple sequence alignments of NLP coding sequences between B. napus and A. thaliana and of protein sequences in the nine plant species (A. thaliana, B. napus, B. rapa, B. oleracea, rice, maize, sorghum, grape and A. trichopoda) mentioned above were conducted using ClustalW2 with default parameters (http://www.genome.jp/tools-bin/clustalw). The phylogenetic trees were generated using the Molecular Evolutionary Genetics Analysis (MEGA) 7 program (Tokyo Metropolitan University, Tokyo, Japan) [47] with the NJ method, the p-distance + G substitution model, 1000 bootstrap replications, and conserved sequences with a coverage of 70%. The phylogenetic trees were visualized using FigTree v1.4.0 (http://tree.bio.ed.ac.uk/software/figtree/). The coding sequence alignments were imported into KaKs_calculator2.0 (Chinese Academy of Sciences, Beijing, China) to calculate the synonymous mutation rate (Ks) and non-synonymous mutation rate (Ka) using the NG method [22].

4.4. Chromosomal Locations and Protein Property Analysis

Chromosomal locations of the BnaNLP genes and the orthologous relationships between A. thaliana and Brassica species were determined based on the results of reciprocal BLASTP analysis and the general feature format (GFF) files downloaded from the Brassica database (http://brassicadb.org/brad). The chromosome distribution was plotted with MapChart2.0 (https://mapchart.net/) [48].
The molecular weight (MW) and isoelectric point (pI) of each BnaNLP protein were predicted using the ExPASy server (http://expasy.org). The transmembrane transport peptides were predicted using Tmpred [49], and signal peptides were predicted using SignalP4.1 (http://www.cbs.dtu.dk/services/SignalP/) [50]. Subcellular localization of BnaNLP was predicted using an extensive high-performance subcellular protein localization prediction system MultiLoc2.0 server (http://abi.inf.uni-tuebingen.de/Services/MultiLoc2/) by incorporating phylogenetic profiles and Gene Ontology terms [51], with the predictive method MultiLoc2-HighRes (Plant), 10 Localization. Gene Structure Display Server (GSDS 2.0, http://gsds.cbi.pku.edu.cn) was used to display the exon/intron structures of BnaNLP genes.

4.5. Motif Identification and TF Binding Site Analysis

Conserved motifs in the proteins were identified using the Expectation Maximization for Motif Elucidation program (MEME v4.12.0, http://meme-suite.org) with the following parameter settings: The maximum number of motifs was 15, and the optimum width was set from 6 to 200. Only motifs with an e-value of 1e-10 were retained for further analysis. The promoter sequences (2-kb upstream region) of the BnaNLP genes were obtained from the B. napus genome (http://www.genoscope.cns.fr/brassicanapus). PlantPAN2.0 (http://plantpan2.itps.ncku.edu.tw) was used to analyze TF binding sites (TFBSs).

4.6. Three-Dimensional Structure Prediction of BnaNLP7-1

The three-dimensional (3D) structure of BnaNLP7-1 protein was predicted using the I-TASSER program (https://zhanglab.ccmb.med.umich.edu/I-TASSER/) [32]. To identify the best structural template for BnaNLP7-1 in the Protein Data Bank (PDB) database [52], the query sequence was subjected to multiple rounds of threading using LOMETS [53]. RNA-dependent RNA polymerases of transcribing cypoviruses (PDB ID: 3JA4) [33] were the best structural template for our queried protein. The newly generated 3D model was aligned to the template using TM-align, and COFACTOR was used to predict the binding sites of ligands to the protein structure [54,55]. Chimera 1.2 (https://www.cgl.ucsf.edu/chimera/) was used to examine and visualize the newly generated 3D model of BnaNLP7-1.

4.7. RNA Isolation, RNA-Sequencing, and Quantitative Reverse-Transcription PCR

Total RNA was extracted from the organ using an RNA Extraction Kit (Tiangen, Beijing, China), and cDNA was synthesized from 1 µg of total RNA using M-MLV transcriptase (TaKaRa Biotechnology, Dalian, China) according to the manufacturer’s instructions.
To determine the organ-specific expression profiles of BnaNLP genes, publicly available B. napus RNA-seq data (BioProject ID PRJNA358784) were used to quantify the expression levels of the B. napus genes in different organs as fragments per kilobase of exon per million reads mapped (FPKM) values using Cufflinks with default parameters. Two independent biological replicates were analyzed per sample. The expression values of the 31 BnaNLP genes were extracted from the RNA-seq results and normalized by Log2 (FPKM + 1).
Reverse transcription quantitative PCR (RT-qPCR) was performed on a Bio-Rad CFX96 Real Time System (USA) according to a previously described method [20]. Gene-specific primer sequences for the BnaNLP genes were obtained from the qPrimerDB database [56]. (Table S1). Each reaction was carried out in biological triplicate in a reaction volume of 20 µL containing 1.6 µL of gene-specific primers (1.0 µM), 2.0 µL of cDNA, 10 µL of SYBR green, 0.2 µL of ROX Reference Dye II, and 6 µL of sterile distilled water. The PCR program was as follows: 95 °C for 3 min; 45 cycles of 10 s at 95 °C and 30 s at 60 °C; and then melt curve 65 °C to 95 °C, increment 0.5 °C for 5 s. Melting curves were generated to estimate the specificity of these reactions. Relative expression levels were calculated using the 2−ΔΔCt method, with BnaACT7 and BnaUBC21 used as internal controls [57].

Supplementary Materials

Supplementary materials can be found at https://www.mdpi.com/1422-0067/19/8/2270/s1.

Author Contributions

J.L. and K.L. conceived and designed the experiments; M.L., Y.F., and W.C. performed the sampling and experiments; M.L., Y.F., W.S., C.Q., L.L., and K.Z. analyzed the data; X.X. and Z.T. contributed to data analysis and interpretation; M.L., W.C., and K.L. wrote the paper. All authors reviewed the manuscript.

Funding

This work was funded by the National Key Research and Development Plan (2018YFD0100501 and 2016YFD0101007), Natural Science Foundation of Chongqing (cstc2018jcyjAX0347), National Natural Science Foundation of China (31571701 and U1302266), the Fundamental Research Funds for the Central Universities (XDJK2012A009 and XDJK2014B038), and Program of Introducing Talents of Discipline to Universities (B12006).

Acknowledgments

The authors are very grateful to Kathleen Farquharson, the Science Editor for The Plant Cell, for her critical reading of the manuscript.

Conflicts of Interest

The authors declare no conflict of interest. The founding sponsors had no role in the design of the study; in the collection, analyses, or interpretation of data; in the writing of the manuscript, and in the decision to publish the results.

References

  1. Crawford, N.M. Nitrate: Nutrient and signal for plant growth. Plant Cell 1995, 7, 859. [Google Scholar] [CrossRef] [PubMed]
  2. Wang, R.; Xing, X.J.; Wang, Y.; Tran, A.; Crawford, N. A genetic screen for nitrate regulatory mutants captures the nitrate transporter gene NRT1.1. Plant Physiol. 2009, 151, 472–478. [Google Scholar] [CrossRef] [PubMed]
  3. Ho, Y.S.J.; Burden, L.M.; Hurley, J.H. Structure of the GAF domain, a ubiquitous signaling motif and a new class of cyclic GMP receptor. EMBO J. 2000, 19, 5288–5299. [Google Scholar] [CrossRef] [PubMed] [Green Version]
  4. Hu, H.C.; Wang, Y.Y.; Tsay, Y.F. AtCIPK8, a CBL-interacting protein kinase, regulates the low-affinity phase of the primary nitrate response. Plant J. 2009, 57, 264–278. [Google Scholar] [CrossRef] [PubMed] [Green Version]
  5. Forde, B.G. Local and long-range signaling pathways regulating plant responses to nitrate. Annu. Rev. Plant Biol. 2002, 53, 203–224. [Google Scholar] [CrossRef] [PubMed]
  6. Sonoda, Y.; Ikeda, A.; Saiki, S.; von Wirén, N.; Yamaya, T.; Yamaguchi, J. Distinct expression and function of three ammonium transporter genes (OsAMT1;1-1;3) in rice. Plant Cell Physiol. 2003, 44, 726–734. [Google Scholar] [CrossRef] [PubMed]
  7. Bi, Y.M.; Wang, R.L.; Zhu, T.; Rothstein, S.J. Global transcription profiling reveals differential responses to chronic nitrogen stress and putative nitrogen regulatory components in Arabidopsis. BMC Genom. 2007, 8, 281. [Google Scholar] [CrossRef] [PubMed]
  8. Hachiya, T.; Mizokami, Y.; Miyata, K.; Tholen, D.; Watanabe, C.K.; Noguchi, K. Evidence for a nitrate-independent function of the nitrate sensor NRT1.1 in Arabidopsis thaliana. J. Plant Res. 2011, 124, 425–430. [Google Scholar] [CrossRef] [PubMed]
  9. Castaings, L.; Antonio, C.; Delphine, P.; Virginie, G.; Yves, T.; Stéphanie, B.M.; Ludivine, T.; Jean-Pierre, R.; Françoise, D.; Emilio, F.; et al. The nodule inception-like protein 7 modulates nitrate sensing and metabolism in Arabidopsis. Plant J. 2009, 57, 426–435. [Google Scholar] [CrossRef] [PubMed]
  10. Schauser, L.; Wioletta, W.; Jens, S. Evolution of NIN-like proteins in Arabidopsis, rice, and Lotus japonicus. J. Mol. Evol. 2005, 60, 229–237. [Google Scholar] [CrossRef] [PubMed]
  11. Schauser, L.; Roussis, A.; Stiller, J.; Stougaard, J. A plant regulator controlling development of symbiotic root nodules. Nature 1999, 402, 191–195. [Google Scholar] [CrossRef] [PubMed]
  12. Borisov, A.Y.; Madsen, L.H.; Tsyganov, V.E.; Umehara, Y.; Voroshilova, V.A.; Batagov, A.O.; Sandal, N.; Mortensen, A.; Schauser, L.; Ellis, N.; et al. The Sym35 gene required for root nodule development in pea is an ortholog of Nin from Lotus japonicus. Plant Physiol. 2003, 131, 1009–1017. [Google Scholar] [CrossRef] [PubMed]
  13. Suzuki, W.; Konishi, M.; Yanagisawa, S. The evolutionary events necessary for the emergence of symbiotic nitrogen fixation in legumes may involve a loss of nitrate responsiveness of the NIN transcription factor. Plant Signal. Behav. 2013, 8, e25975. [Google Scholar] [CrossRef] [PubMed]
  14. Chardin, C.; Thomas, G.; Francois, R.; Christian, M.; Anne, K. The plant RWP-RK transcription factors: Key regulators of nitrogen responses and of gametophyte development. J. Exp. Bot. 2014, 65, 5577–5587. [Google Scholar] [CrossRef] [PubMed]
  15. Sumimoto, H.; Sachiko, K.; Takashi, I. Structure and function of the PB1 domain, a protein interaction module conserved in animals, fungi, amoebas, and plants. Sci. STKE 2007, 401, re6. [Google Scholar] [CrossRef] [PubMed]
  16. Studholme, D.J.; Dixon, R. Domain architectures of σ54-dependent transcriptional activators. J. Bacteriol. 2003, 185, 1757–1767. [Google Scholar] [CrossRef] [PubMed]
  17. Bush, M.; Dixon, R. The role of bacterial enhancer binding proteins as specialized activators of s54-dependent transcription. Microbiol. Mol. Biol. Rev. 2012, 76, 497–529. [Google Scholar] [CrossRef] [PubMed]
  18. Yanagisawa, S. Transcription factors involved in controlling the expression of nitrate reductase genes in higher plants. Plant Sci. 2014, 229, 167–171. [Google Scholar] [CrossRef] [PubMed]
  19. Yan, D.W.; Easwaran, V.; Chau, V.; Okamoto, M.; Ierullo, M.; Kimura, M.; Endo, A.; Yano, R.; Pasha, A.; Gong, Y.C.; et al. NIN-like protein 8 is a master regulator of nitrate-promoted seed germination in Arabidopsis. Nat. Commun. 2016, 7, 13179. [Google Scholar] [CrossRef] [PubMed]
  20. Ge, M.; Liu, Y.H.; Jiang, L.; Wang, Y.C.; Lv, Y.D.; Zhou, L.; Liang, S.Q.; Bao, H.B.; Zhao, H. Genome-wide analysis of maize NLP transcription factor family revealed the roles in nitrogen response. Plant Growth Regul. 2018, 84, 95–105. [Google Scholar] [CrossRef]
  21. Konishi, M.; Yanagisawa, S. The regulatory region controlling the nitrate-responsive expression of a nitrate reductase gene, NIA1, in Arabidopsis. Plant Cell Physiol. 2011, 52, 824–836. [Google Scholar] [CrossRef] [PubMed]
  22. Konishi, M.; Yanagisawa, S. Arabidopsis NIN-like transcription factors have a central role in nitrate signalling. Nat. Commun. 2013, 4, 1617. [Google Scholar] [CrossRef] [PubMed]
  23. Jian, W.; Zhang, D.W.; Zhu, F.; Wang, S.X.; Zhu, T.; Pu, X.J.; Zheng, T.; Feng, H.; Lin, H.H. Nitrate reductase-dependent nitric oxide production is required for regulation alternative oxidase pathway involved in the resistance to Cucumber mosaic virus infection in Arabidopsis. Plant Growth Regul. 2015, 77, 99–107. [Google Scholar] [CrossRef]
  24. Marchive, C.; Roudier, F.; Castaings, L.; Bréhaut, V.; Blondet, E.; Colot, V.; Meyer, C.; Krapp, A. Nuclear retention of the transcription factor NLP7 orchestrates the early response to nitrate in plants. Nat. Commun. 2013, 4, 1713. [Google Scholar] [CrossRef] [PubMed] [Green Version]
  25. Guan, P.; Ripoll, J.J.; Wang, R.H.; Vuong, L.; Bailey-Steinitz, L.J.; Ye, D.N.; Crawford, N.M. Interacting TCP and NLP transcription factors control plant responses to nitrate availability. Proc. Natl. Acad. Sci. USA 2017, 114, 2419–2424. [Google Scholar] [CrossRef] [PubMed] [Green Version]
  26. Liu, K.H.; Niu, Y.J.; Konishi, M.; Wu, Y.; Du, H.; Sun, H.; Li, L.; Boundsocq, M.; Mccormack, M.; Maekawa, S.; et al. Discovery of nitrate–CPK–NLP signalling in central nutrient–growth networks. Nature 2017, 545, 311–316. [Google Scholar] [CrossRef] [PubMed] [Green Version]
  27. Nagaharu, U.; Nagaharu, N. Genome analysis in Brassica with special reference to the experimental formation of B. napus and peculiar mode of fertilization. Jpn. J. Bot. 1935, 7, 389–452. [Google Scholar]
  28. Wu, X.Y.; Xu, Z.R.; Qu, C.P.; Li, W.; Sun, Q.; Liu, G.J. Genome-wide identification and characterization of NLP gene family in Populus trichocarpa. Bull. Bot. Res. 2014, 34, 37–43. [Google Scholar]
  29. Feng, C.; Wu, J.; Wang, X.W. Genome triplication drove the diversification of Brassica plants. Hortic. Res. 2014, 1, 14024. [Google Scholar]
  30. Anton, N.; Makova, K.D.; Li, W.H. The Ka/Ks ratio test for assessing the protein-coding potential of genomic regions: An empirical and simulation study. Genome Res. 2002, 12, 198–202. [Google Scholar]
  31. Chow, C.N.; Zheng, H.Q.; Wu, N.Y.; Chien, C.H.; Huang, H.D.; Lee, T.Y.; Chiang-Hsieh, Y.F.; Hou, P.F.; Yang, T.Y.; Chang, W.C. Plant PAN 2.0: An update of plant promoter analysis navigator for reconstructing transcriptional regulatory networks in plants. Nucleic Acids Res. 2015, 44, 1154–1160. [Google Scholar] [CrossRef] [PubMed]
  32. Zhang, Y. I-TASSER server for protein 3D structure prediction. BMC Bioinform. 2008, 9, 40–46. [Google Scholar] [CrossRef] [PubMed]
  33. Liu, H.; Cheng, L. Cryo-EM shows the polymerase structures and a nonspooled genome within a dsRNA virus. Nucleic Acids Res. 2015, 349, 1347–1350. [Google Scholar] [CrossRef] [PubMed]
  34. Yang, J.Y.; Roy, A.; Zhang, Y. BioLiP: A semi-manually curated database for biologically relevant ligand-protein interactions. Nucleic Acids Res. 2013, 41, 1096–1103. [Google Scholar] [CrossRef] [PubMed]
  35. Chalhoub, B.; Denoeud, F.; Liu, S.; Parkin, I.A.; Tang, H.; Wang, X.; Chiquet, J.; Belcram, H.; Tong, C.; Samans, B.; et al. Early allopolyploid evolution in the post-Neolithic Brassica napus oilseed genome. Science 2014, 345, 950–953. [Google Scholar] [CrossRef] [PubMed]
  36. Shi, R.; McDonald, L.; Cygler, M.; Ekiel, I. Coiled-coil helix rotation selects repressing or activating state of transcriptional regulator DhaR. Structure 2014, 22, 478–487. [Google Scholar] [CrossRef] [PubMed]
  37. Niemann, V.; Koch-Singenstreu, M.; Nilkens, S.; Götz, F.; Unden, G.; Stehle, T. The NreA protein functions as a nitrate receptor in the Staphylococcal nitrate regulation system. J. Mol. Biol. 2014, 426, 1539–1553. [Google Scholar] [CrossRef] [PubMed]
  38. Liu, T.; Ren, T.; White, P.J.; Cong, R.H.; Lu, J. Storage nitrogen co-ordinates leaf expansion and photosynthetic capacity in winter oilseed rape. J. Exp. Bot. 2018, 69, 2995–3007. [Google Scholar] [CrossRef] [PubMed] [Green Version]
  39. Saha, K.C.; Sangigrahi, S.; Mandal, L.N. Effect of inoculation of Azospirillum lipoferum on nitrogen fixation in rhizosphere soil, their association with root, yield and nitrogen uptake by mustard (Brassica juncea). Plant Soil 1985, 87, 273–280. [Google Scholar] [CrossRef]
  40. Scheible, W.R.; Morcuende, R.; Czechowski, T.; Fritz, C.; Osuna, D.; Palacios-Rojas, N.; Schindelasch, D.; Thimm, O.; Udvardi, M.K.; Stitt, M. Genome-wide reprogramming of primary and secondary metabolism, protein synthesis, cellular growth processes, and the regulatory infrastructure of Arabidopsis in response to nitrogen. Plant Physiol. 2004, 136, 2483–2499. [Google Scholar] [CrossRef] [PubMed]
  41. Wang, R.; Okamoto, M.; Xing, X.; Crawford, N.M. Microarray analysis of the nitrate response in Arabidopsis roots and shoots reveals over 1000 rapidly responding genes and new linkages to glucose, trehalose-6-phosphate, iron, and sulfate metabolism. Plant Physiol. 2003, 132, 556–567. [Google Scholar] [CrossRef] [PubMed]
  42. Safavi-Rizi, V.; Franzaring, J.; Fangmeier, A.; Kunze, K. Divergent N Deficiency-Dependent Senescence and Transcriptome Response in Developmentally Old and Young Brassica napus Leaves. Front. Plant Sci. 2018, 9, 48. [Google Scholar] [CrossRef] [PubMed]
  43. Hoagland, D.R.; Daniel, I.A. The Water-Culture Method For Growing Plants without Soil; California Agricultural Experiment Station, Circular; University of California: Berkeley, CA, USA, 1950; Volume 31, p. 347. [Google Scholar]
  44. Altschul, S.F.; Gish, W.; Miller, W.; Myers, E.W.; Lipman, D.J. Basic local alignment search tool. Mol. Biol. 1990, 215, 403–410. [Google Scholar] [CrossRef]
  45. Altschul, S.F.; Madden, T.L.; Schäffer, A.A.; Zhang, J.; Zhang, Z.; Miller, W.; Lipman, D.J. Gapped BLAST and PSI-BLAST: A new generation of protein database search programs. Nucleic Acids Res. 1997, 25, 3389–3402. [Google Scholar] [CrossRef] [PubMed]
  46. Fan, Y.H.; Yu, M.N.; Liu, M.; Zhang, R.; Sun, W.; Qian, M.C.; Duan, H.C.; Chang, W.; Ma, J.Q.; Qu, C.M.; et al. Genome-wide identification, evolutionary and expression analyses of the GALACTINOL SYNTHASE gene family in rapeseed and tobacco. Int. J. Mol. Sci. 2017, 18, 2768. [Google Scholar] [CrossRef] [PubMed]
  47. Sudhir, K.; Glen, S.; Koichiro, T. MEGA7: Molecular evolutionary genetics analysis version 7.0 for bigger datasets. Mol. Biol. Evol. 2016, 33, 1870–1874. [Google Scholar]
  48. Voorrips, R.E. MapChart: Software for the graphical presentation of linkage maps and QTLs. J. Hered. 2002, 93, 77–78. [Google Scholar] [CrossRef] [PubMed]
  49. Hofmann, K.; Stoffel, W. TMbase-A database of membrane spanning proteins segments. Biol. Chem. 1993, 374, 166. [Google Scholar]
  50. Henrik, N. Protein function prediction. Mol. Biol. 2017, 1611, 59–73. [Google Scholar]
  51. Blum, T.; Briesemeister, S.; Kohlbacher, O. MultiLoc2: Integrating phylogeny and gene ontology terms improves subcellular protein localization prediction. BMC Bioinform. 2009, 10, 274. [Google Scholar] [CrossRef] [PubMed]
  52. Berman, H.M.; Westbrook, J.; Feng, Z.; Gilliland, G.; Bhat, T.N.; Weissig, H.; Shindvalov, I.N.; Bourne, P.E. The Protein Data Bank. Nucleic Acids Res. 2000, 28, 235–242. [Google Scholar] [CrossRef] [PubMed] [Green Version]
  53. Wu, S.; Zhang, Y. LOMETS: A local meta-threading-server for protein structure prediction. Nucleic Acids Res. 2007, 35, 3375–3382. [Google Scholar] [CrossRef] [PubMed] [Green Version]
  54. Roy, A.; Kucukural, A.; Zhang, Y. I-TASSER: A unified plat form for automated protein structure and function prediction. Nat. Protoc. 2010, 5, 725–738. [Google Scholar] [CrossRef] [PubMed]
  55. Roy, A.; Yang, J.; Zhang, Y. COFACTOR: An accurate comparative algorithm for structure-based protein function annotation. Nucleic Acids Res. 2012, 40, 471–477. [Google Scholar] [CrossRef] [PubMed]
  56. Lu, K.; Li, T.; He, J.; Chang, W.; Zhang, R.; Liu, M.; Yu, M.; Fan, Y.; Ma, J.; Sun, W.; et al. qPrimerDB: A thermodynamics-based gene-specific qPCR primer database for 147 organisms. Nucleic Acids Res. 2018, 46, 1229–1236. [Google Scholar] [CrossRef] [PubMed]
  57. Lu, K.; Xiao, Z.; Jian, H.; Peng, L.; Qu, C.; Fu, M.; He, B.; Tie, L.; Liang, Y.; Xu, X.; et al. A combination of genome-wide association and transcriptome analysis reveals candidate genes controlling harvest index-related traits in Brassica napus. Sci. Rep. 2016, 6, 36452. [Google Scholar] [CrossRef] [PubMed]
Figure 1. Phylogenetic relationships, gene structures, and conserved motifs of NLP proteins in A. thaliana and B. napus. The amino acid sequences of AtNLPs and BnaNLPs were aligned using ClustalW2. (A) The phylogenetic tree was constructed using MEGA 7.0 with the neighbor-joining method (1000 bootstrap replicates) and displayed using FigTree v1.4.0. The 40 NLP proteins in A. thaliana and B. rapa are clustered into three distinct groups. The scale bar represents 0.05 kb. At: A. thaliana; Bna: B. napus; (B) gene structures generated using the Gene Structure Display Server. Exons (CDS) and introns are shown with yellow wedges and black lines, respectively. Numbers 0, 1, and 2 represent introns in phases 0, 1, and 2, respectively; (C) conserved motifs of BnaNLP proteins identified by MEME. The motifs are indicated by colored boxes and their numbers are shown in the scale below the diagram; (D) sequences of the 15 conserved motifs in BnaNLPs identified in this study.
Ijms 19 02270 g001
Figure 2. Phylogenetic relationships between BnaNLPs and other plant NLP proteins. The phylogenetic tree was constructed using MEGA 7.0 with the neighbor-joining method (1000 bootstrap replicates) and displayed using FigTree v1.4.0. NLP proteins in the phylogenetic tree are clustered into three distinct groups. At: A. thaliana (marked in red), Bra: B. rapa, Bol: B. oleracea, Bna: B. napus (marked in blue), AmTr: A. trichopoda, Os: O. sativa, Vv: V. vinifera, Zm: Z. mays, Sb: S. bicolor. Groups I, II and III are indicated by a blue, red, and yellow background, respectively.
Ijms 19 02270 g002
Figure 3. Chromosomal distribution of BnaNLP genes in the B. napus genome. Chromosomal information for BnaNLP genes was obtained from the B. napus genome annotation results and mapped to the corresponding chromosomes. The scale bar indicates the genome size of B. napus.
Ijms 19 02270 g003
Figure 4. Syntenic relationships of NLP genes in A. thaliana, B. napus, B. rapa, and B. oleracea.
Ijms 19 02270 g004
Figure 5. Predicted 3D structures of BnaNLP7-1 protein. The models were obtained using I-TASSER. tRNA-dependent RNA polymerases of transcribing cypoviruses (PDB ID: 3JA4) were used as the template for 3D structure predication. (A) 3D structure of BnaNLP7-1 protein; (B) template model of 3JA4 and 3D structure of BnaNLP7-1 protein; (C,D) binding between the BnaNLP7-1 dock and its nucleic acid substrate (PBD: 2r7rA); (C) the conserved PWP-PK domain and PB1 motifs are shown on the 3D structure in red and blue, respectively. The surface of the nucleic acid substrate is shown in purple. (D) The conserved PWP-PK domain and PB1 motifs are shown in red on the 3D structure. α-helices, β-strands, and random coils are indicated in green, yellow, and navy blue, respectively. All images were generated using Chimera 1.2.
Ijms 19 02270 g005
Figure 6. Organ-specific expression profiles of BnaNLP genes. Organ-specific expression patterns of BnaNLP genes were obtained based on the RNA-seq data. The color bar at the upper right side of the figure represents Log2 (FPKM + 1), with blue representing little or no expression. Ro_48h: Roots collected at 48 h after germination; Hy_48: Hypocotyls harvested at 48 h after germination; Co_48h: cotyledons collected at 48 h after germination; Ro, St, Le, Bu and Fl: Roots, stems, leaves, buds and flowers harvested at the initial blooming stage; Se_10d, Se_20d, Se_40d and Se_46d: Seeds harvested at 10, 20, 40, and 46 days after flowering; SP_10d, SP_20d, SP_30d, SP_40d, and SP_46d: Silique pericarps harvested at 10, 20, 30, 40, and 46 days after flowering.
Ijms 19 02270 g006
Figure 7. Expression profiles of BnaNLP genes in SRs under normal and nitrogen deficient conditions. Relative expression levels of BnaNLP genes were determined by RT-qPCR. SRs were collected under normal growth and nitrogen deficient conditions at 0, 6, 12, 24, 48, and 72 h after treatment. * represents the significant level, ** represents the extremely significant level.
Ijms 19 02270 g007
Figure 8. Expression profiles of BnaNLP genes in SLs under normal and nitrogen deficient conditions. Relative expression levels of BnaNLP genes were determined by RT-qPCR. SRs were collected under normal growth and nitrogen deficient conditions at 0, 6, 12, 24, 48 and 72 h after treatments. * represents the significant level, ** represents the extremely significant level.
Ijms 19 02270 g008
Table 1. List of BnaNLP genes identified in B. napus.
Gene Name in B. napusGene ID in B. napusGene ID in A. thalianaChromosomePosition (bp)Number of IntronsProtein Length (aa)Protein Molecular Weight (kDa)Protein Isoelectric Point (pI)Protein Subcellular Localization
BnaNLP1-1BnaC03g47510DAT2G17150C0332,561,336~32,565,236387095.785.1Nucleus
BnaNLP1-2BnaA07g03130DAT2G17150A072,770,119~2,774,330389599.324.98Nucleus
BnaNLP1-3BnaA06g25930DAT2G17150A0617,936,012~17,942,485387296.025.18Nucleus
BnaNLP1-4BnaC07g06170DAT2G17150C079,960,829~9,965,297389699.334.98Nucleus
BnaNLP2-1BnaA01g02150DAT4G35270A011,061,127~1,065,935488998.916.87Nucleus
BnaNLP2-2BnaA03g53210DAT4G35270A0327,917,856~27,921,4123897100.076.67Nucleus
BnaNLP2-3BnaC01g03280DAT4G35270C011,694,787~1,699,8103966107.195.92Nucleus
BnaNLP2-4BnaC07g45500DAT4G35270C0743,543,401~43,546,6993901100.717.04Chloroplast
BnaNLP3-1BnaA06g40940DAT4G38340A062,255,358~2,256,385368176.377.31Nucleus
BnaNLP4-1BnaA06g14540DAT1G20640A067,867,109~7,871,401381491.055.59Nucleus
BnaNLP4-2BnaA07g11340DAT1G20640A0710,591,730~10,594,794377586.885.36Nucleus
BnaNLP4-3BnaA08g21720DAT1G20640A0815,991,108~15,994,588476485.195.61Nucleus
BnaNLP4-4BnaC05g16000DAT1G20640C059,745,808~9,749,062370377.855.84Nucleus
BnaNLP4-5BnaC07g15260DAT1G20640C0721,212,376~21,215,440376986.075.47Nucleus
BnaNLP4-6BnaC08g19370DAT1G20640C0822,293,545~22,296,521476185.025.75Nucleus
BnaNLP5-1BnaA07g32630DAT1G76350A0722,548,833~22,552,146380289.645.89Nucleus
BnaNLP5-2BnaC06g37080DAT1G76350C0635,298,227~35,301,829380289.615.94Nucleus
BnaNLP6-1BnaA09g12180DAT1G64530A096,394,926~6,398,454582291.485.56Nucleus
BnaNLP6-2BnaCnng38990DAT1G64530Unknown 582291.565.74Nucleus
BnaNLP7-1BnaA01g35090DAT4G24020A01386,973~387,2415934102.955.5Nucleus
BnaNLP7-2BnaA03g46410DAT4G24020A0323,822,691~23,826,3045934102.685.6Nucleus
BnaNLP7-3BnaC01g15850DAT4G24020C0110,891,090~10,895,1625978108.055.96Nucleus
BnaNLP7-4BnaC07g38670DAT4G24020C0739,940,917~39,945,1055937103.065.61Nucleus
BnaNLP8-1BnaA03g20260DAT2G43500A039,638,886~9,642,606589598.715.41Nucleus
BnaNLP8-2BnaA04g25110DAT2G43500A0418,201,925~18,205,255579888.355.94Nucleus
BnaNLP8-3BnaA05g03380DAT2G43500A051,878,196~1,880,941480989.365.94Nucleus
BnaNLP8-4BnaC03g24230DAT2G43500C0313,588,155~13,591,741589799.005.42Nucleus
BnaNLP8-5BnaC04g02980DAT2G43500C042,115,457~2,118,921579988.085.92Nucleus
BnaNLP8-6BnaC04g48980DAT2G43500C0447,362,522~47,365,605681190.075.94Nucleus
BnaNLP9-1BnaA07g18430DAT3G59580A0715,037,510~15,041,748685294.095.47Nucleus
BnaNLP9-2BnaC06g17440DAT3G59580C0620,075,721~20,079,938685194.155.58Nucleus
Table 2. Non-synonymous and synonymous nucleotide substitution rates between AtNLPs and the corresponding orthologs in B. napus.
GroupGene ID in A. thalianaGene ID in B. napusModelKaKsKa/KsAverage Ka/Ks
Group IAT2G17150BnaNLP1-1NG0.0955730.3818170.2503110.169549
AT2G17150BnaNLP1-2NG0.0849250.3755650.226126
AT2G17150BnaNLP1-3NG0.0947420.3822760.247837
AT2G17150BnaNLP1-4NG0.0897740.3765770.238395
AT4G35270BnaNLP2-1NG0.0641360.4640960.138196
AT4G35270BnaNLP2-2NG0.0683870.4092030.167123
AT4G35270BnaNLP2-3NG0.0639390.4706390.135856
AT4G35270BnaNLP2-4NG0.0706920.4316990.163754
AT4G38340BnaNLP3-1NG0.1234200.3650140.338126
AT1G20640BnaNLP4-1NG0.0440270.5229560.084189
AT1G20640BnaNLP4-2NG0.0574610.4307020.133413
AT1G20640BnaNLP4-3NG0.0638750.377240.169322
AT1G20640BnaNLP4-4NG0.0569560.6026420.094510
AT1G20640BnaNLP4-5NG0.0563440.4184560.134646
AT1G20640BnaNLP4-6NG0.0639630.3618070.176786
AT1G76350BnaNLP5-1NG0.0556690.604930.092026
AT1G76350BnaNLP5-2NG0.0572360.624090.091711
Group IIAT1G64530BnaNLP6-1NG0.0695870.5451780.1276420.103387
AT1G64530BnaNLP6-2NG0.0707990.5199490.136166
AT4G24020BnaNLP7-1NG0.0273870.3471580.07889
AT4G24020BnaNLP7-2NG0.0345820.3639120.095029
AT4G24020BnaNLP7-3NG0.0295750.3458750.085507
AT4G24020BnaNLP7-4NG0.035223 0.36280.097086
Group IIIAT2G43500BnaNLP8-1NG0.0836880.3932170.2128290.264202
AT2G43500BnaNLP8-2NG0.1052730.4193280.251052
AT2G43500BnaNLP8-3NG0.0965030.4346560.222021
AT2G43500BnaNLP8-4NG2.3953104.042260.592566
AT2G43500BnaNLP8-5NG0.0937130.4711950.198883
AT2G43500BnaNLP8-6NG0.1073750.4051350.265035
AT3G59580BnaNLP9-1NG0.0846300.4691670.180383
AT3G59580BnaNLP9-2NG0.0896170.4695580.190854

