1. Introduction
Pyrus bretschneideri cv. ‘Dangshan Su’ is a cultivar of
Pyrus bretschneideri Rehd. Pollination can affect pear fruit quality, such as its true hardness and sugar, amino acid, and stone cell content [
1,
2,
3,
4]. During the ripening of pear fruit, a large number of substances are synthesized. Previous studies have focused on the metabolites related to taste, color, aroma, and nutrition in mature fruits. A qualitative and quantitative analysis of sugar, organic acids, amino acids, and fatty acids in different varieties of pear fruits showed that the composition of different pear fruit varieties varied greatly [
5]. The phenylpropanoid pathway is the junction between secondary metabolism and primary metabolism, such as lignin synthesis. The phenylpropanoid pathway is derived from the shikimic acid pathway, and the shikimic acid pathway can be formed via phosphoenolpyruvate in the primary metabolic glycolytic pathway. In addition, the phenylpropanoid pathway is not only related to the biosynthesis of lignin and flavonoids but also related to other aromatic metabolites, such as coumarin, phenolic volatiles, and hydrolysable tannins [
6,
7]. Oikawa analyzed the metabolic profiles of pear fruits and determined the physiological effects of the metabolites in pear fruits [
8]. However, there has been no report on the effects of pollination on the primary metabolites in ‘Dangshan Su’ pear fruit.
The lignin synthesis process has been basically elucidated [
9], and the types of lignin contained in the pear fruit are guaiacyl lignin (G-lignin) and syringyl lignin (S-lignin) [
10]. Lignin synthesis, translocation, and deposition are closely related to the development of stone cells. Pearlite cells are thick-walled tissue cells formed by the deposition of lignin on the parenchyma of parenchyma cells and secondary thickening of the primary wall. The pear fruit quality is related to the content of stone cells [
11,
12]. The effect of pollination on lignin synthesis in pear fruit can theoretically be a basis for improving pear fruit quality.
Previous studies have reported that pollination affects the expression of laccase gene microRNA in pear fruit [
4], and the expression of peroxidase 47 (PER47), β-glucosidase (BGLU15), and laccase-4 (LAC4) [
13], thus affecting lignin synthesis. This finding demonstrates that pollination with different pollens affects the synthesis of lignin in pear fruit on the levels of gene and protein expression. However, there has been no report regarding the effect of pollination on metabolites in ‘Dangshan Su’ pear fruit. In this study, the primary metabolites in ‘Dangshan Su’ fruit pollinated by ‘Wonhwang’ (DW) and ‘Jingbaili’ (DJ) at 47 and 64 days after pollination (DAPs) were detected, combined with quantitative detection of the lignin synthesis intermediate metabolites cinnamic acid,
p-coumaric acid, caffeic acid, ferulic acid, sinapic acid, coniferaldehyde, sinapaldehyde, coniferyl alcohol, and sinapyl alcohol to investigate the effects of pollination on primary metabolism and lignin synthesis in ‘Dangshan Su’ pear fruit and to improve the pear fruit quality.
According to the previous experimental results of this research group, lignin mainly forms between 15 days and 63 days after flowering [
2,
4,
11,
12]. The content of lignin and stone cells in DW and DJ has been detected. At 47 DAPs, the lignin content reaches a peak, which is the key period of lignin formation. At 63 DAPs, there are significant differences in the lignin content and stone cell content in pear fruits [
13]. Therefore, fruit at 47 and 63 DAPs was selected for metabolomics analyses.
3. Discussion and Conclusions
Metabolomic analysis does not rely on transcriptomics, proteomics, or genomic sequences and has a wide range of applications. This analysis is one of the most effective methods for understanding the mechanisms of metabolic regulation [
21,
22]. In this experiment, GC-MS and LC-ESI-MS/MS methods were used for detection. Compared with NMR spectroscopy, these techniques have more extensive coverage and more complex univariate and multivariate data analysis methods [
23]. In addition, LC-ESI-MS/MS has the advantages of high precision, high sensitivity, and high output [
24]. In this study, LC-ESI-MS/MS data were used to rapidly and sensitively characterize and quantify 7 metabolites in pear fruit via MRM [
25].
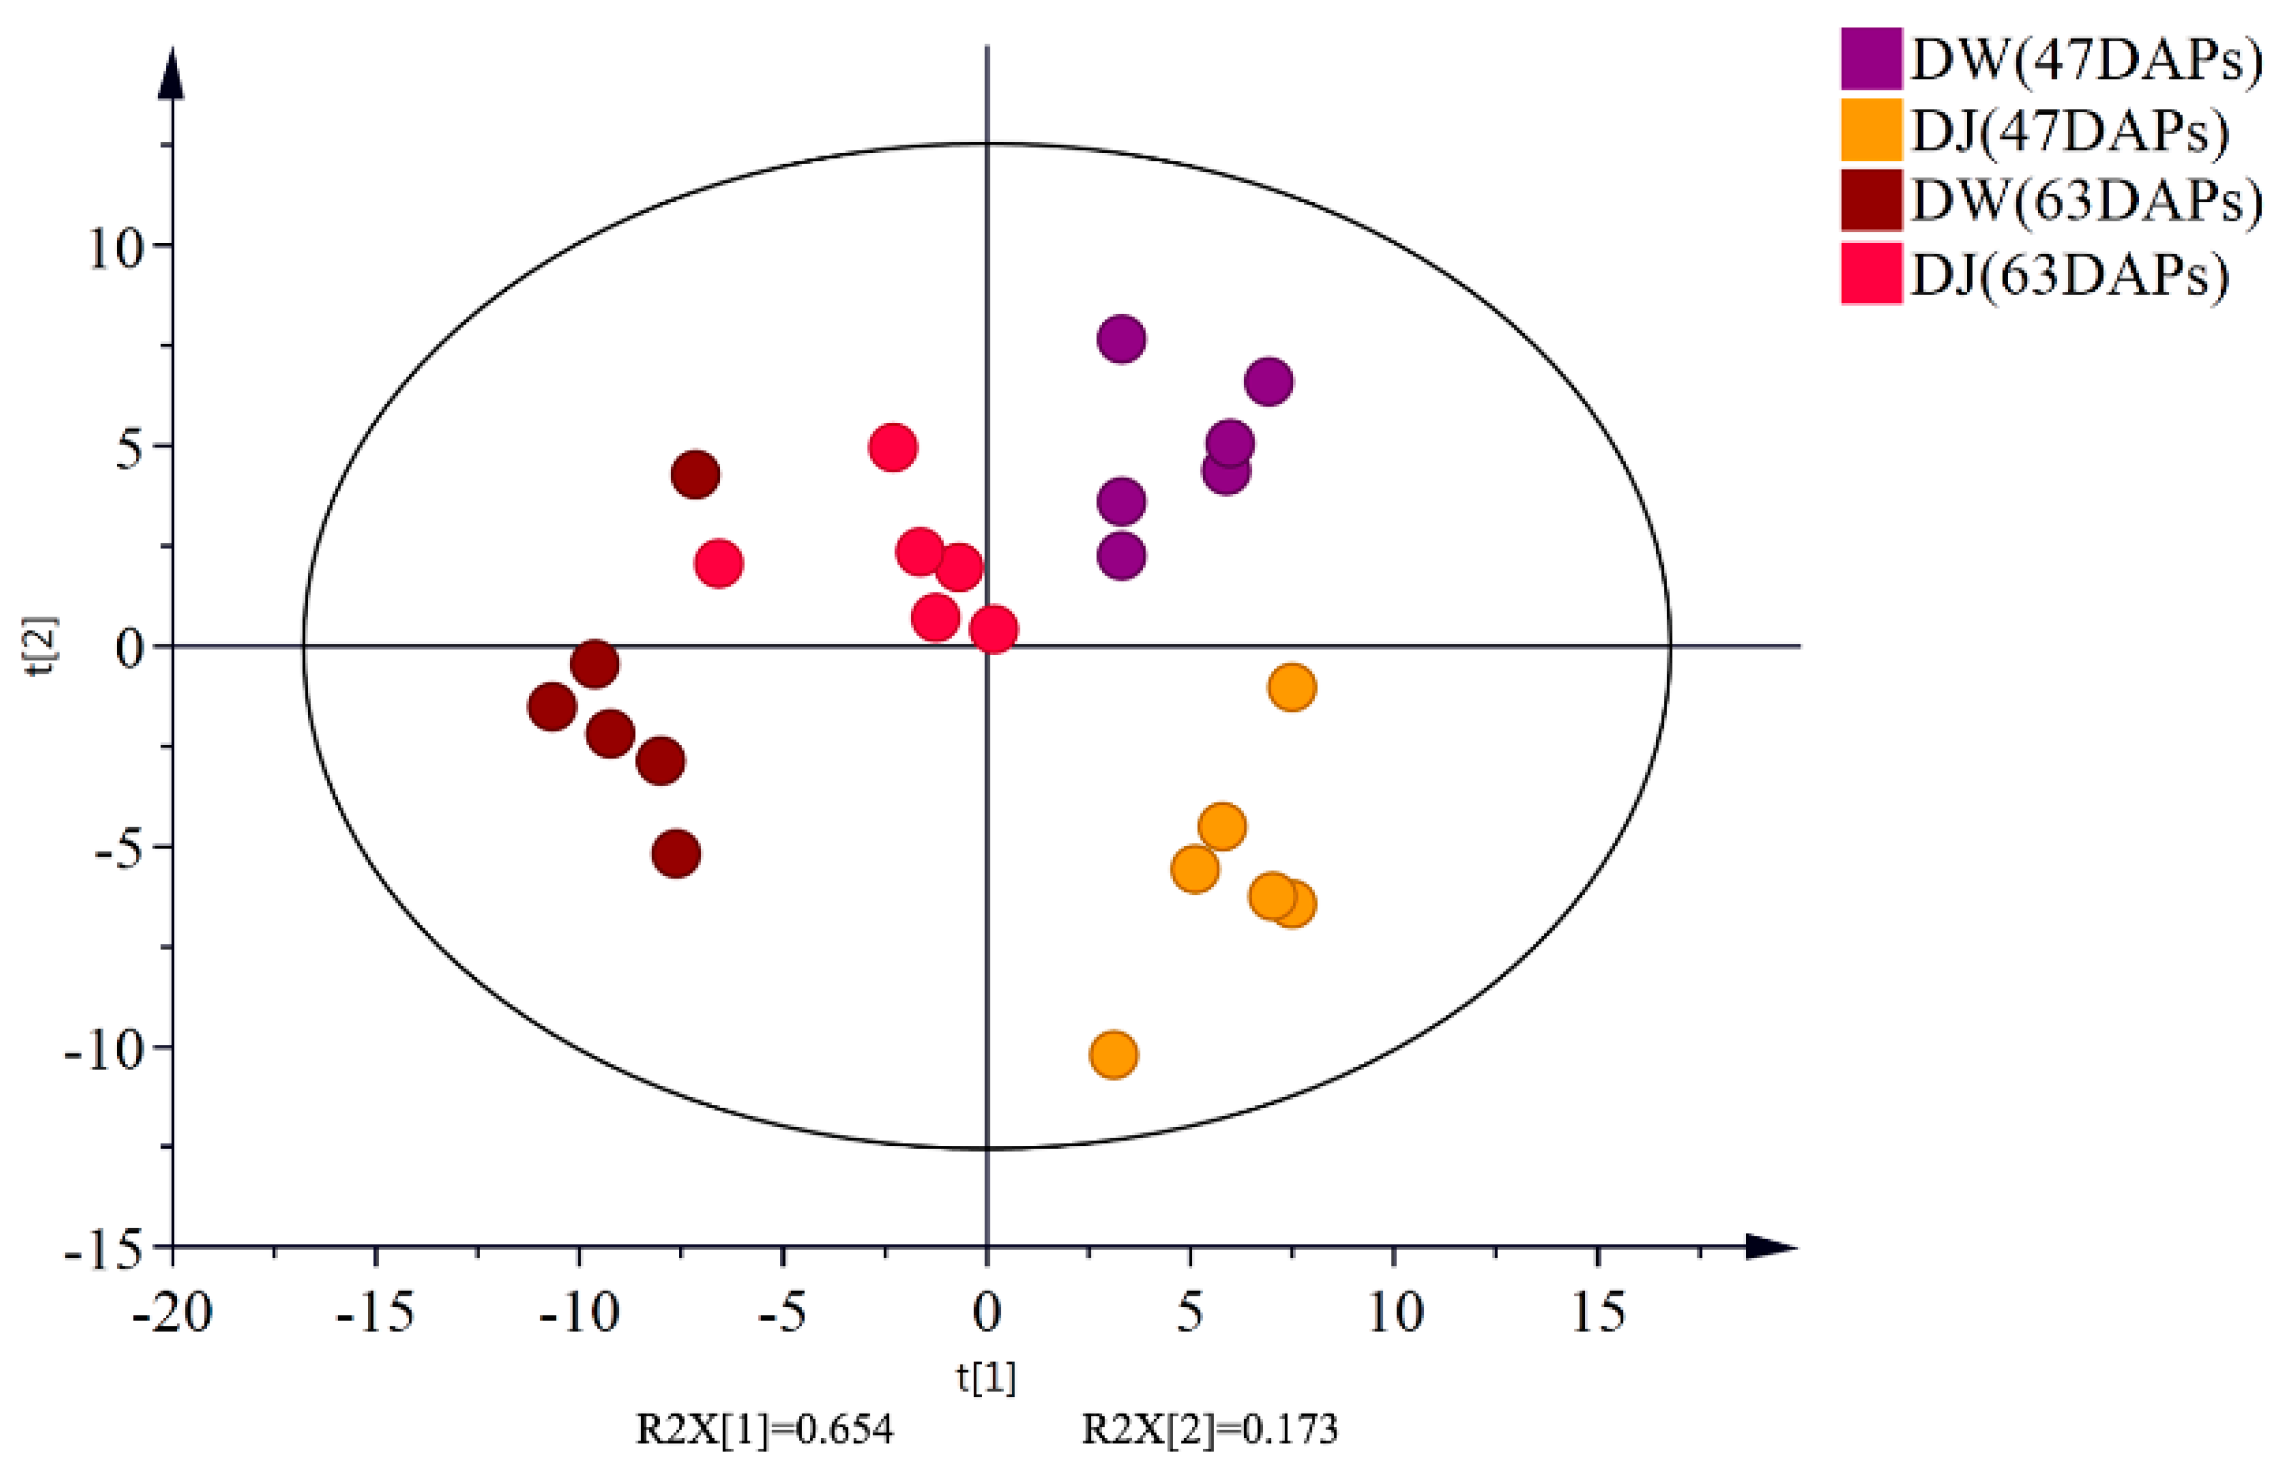
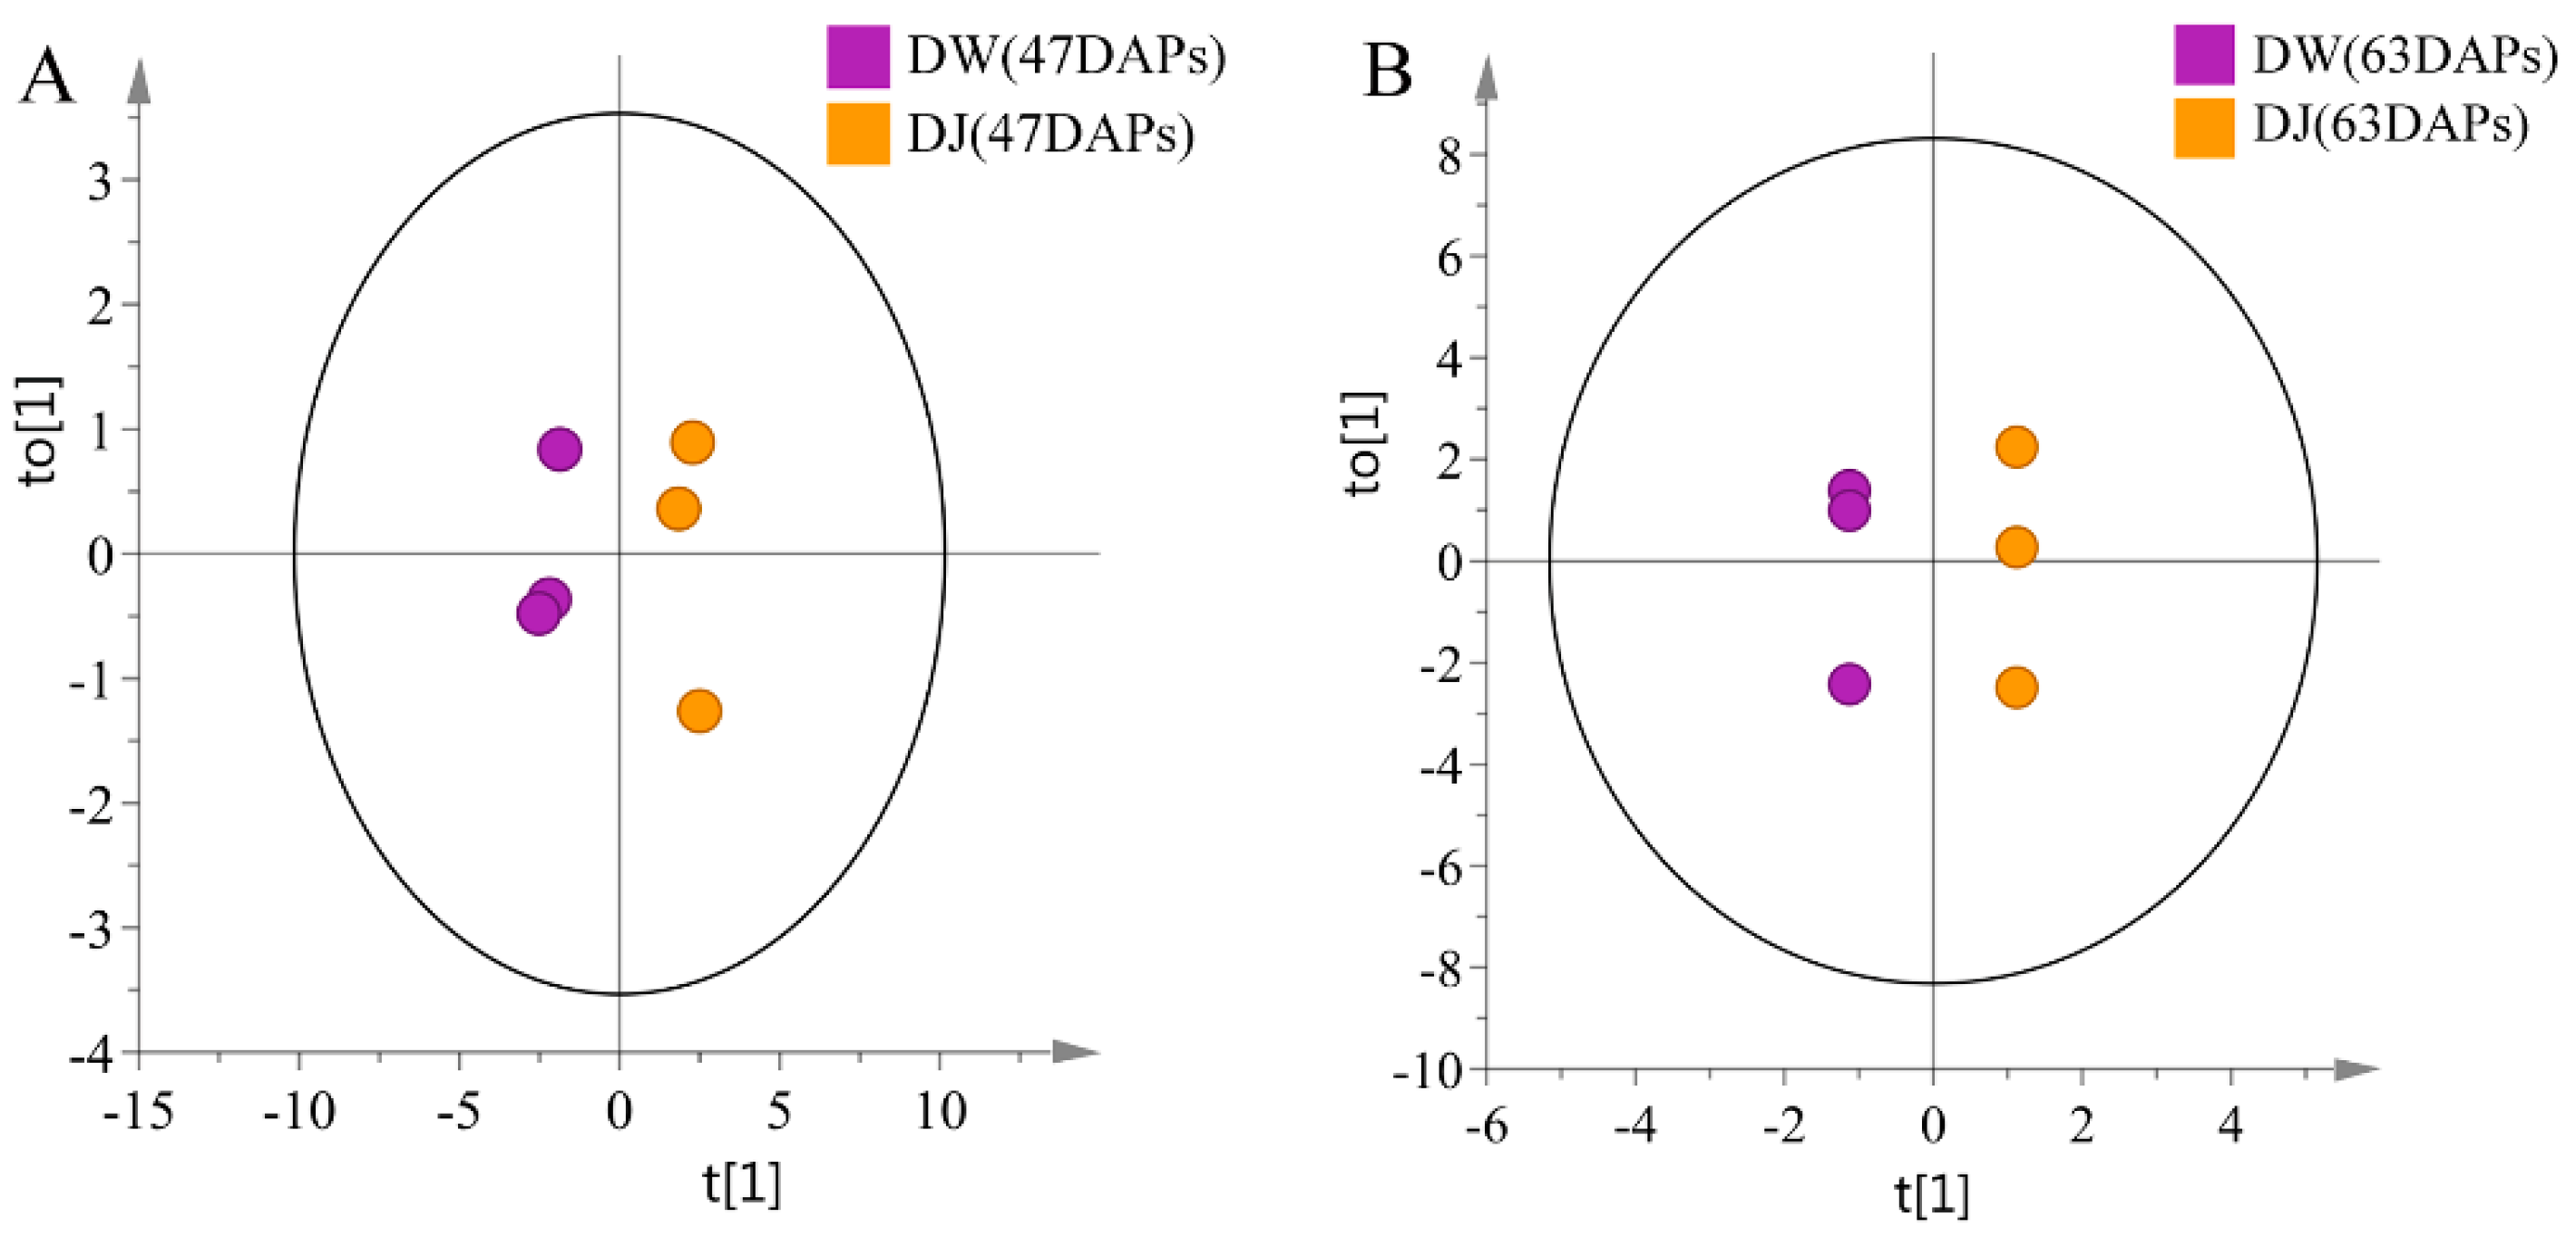
Target detection of pear fruit primary metabolites with GC-MS, PCA, and OPLS-DA showed that DW and DJ can clearly be distinguished. Different pollens have a great influence on metabolites. Sugar, amino acids, and fatty acids are associated with pear fruit quality [
5]. At 47 DAPs, the sugar and amino acid content is relatively higher in DW, and the fatty acid content is relatively lower. At 63 DAPs, the sugar, amino acid, and fatty acid content in DW is lower than that in DJ. It can be speculated that different pollens could affect the quality of pear fruit.
At 47 DAPs, the KEGG pathways are enriched by differential metabolites, including phenylalanine, tyrosine and tryptophan biosynthesis (
Table 3), and the synthesis of lignin is initiated by the deamination of phenylalanine to form cinnamic acid [
26]. Therefore, it can be inferred that pollination affects the synthesis of phenylalanine in pear fruit and regulates the synthesis of lignin.
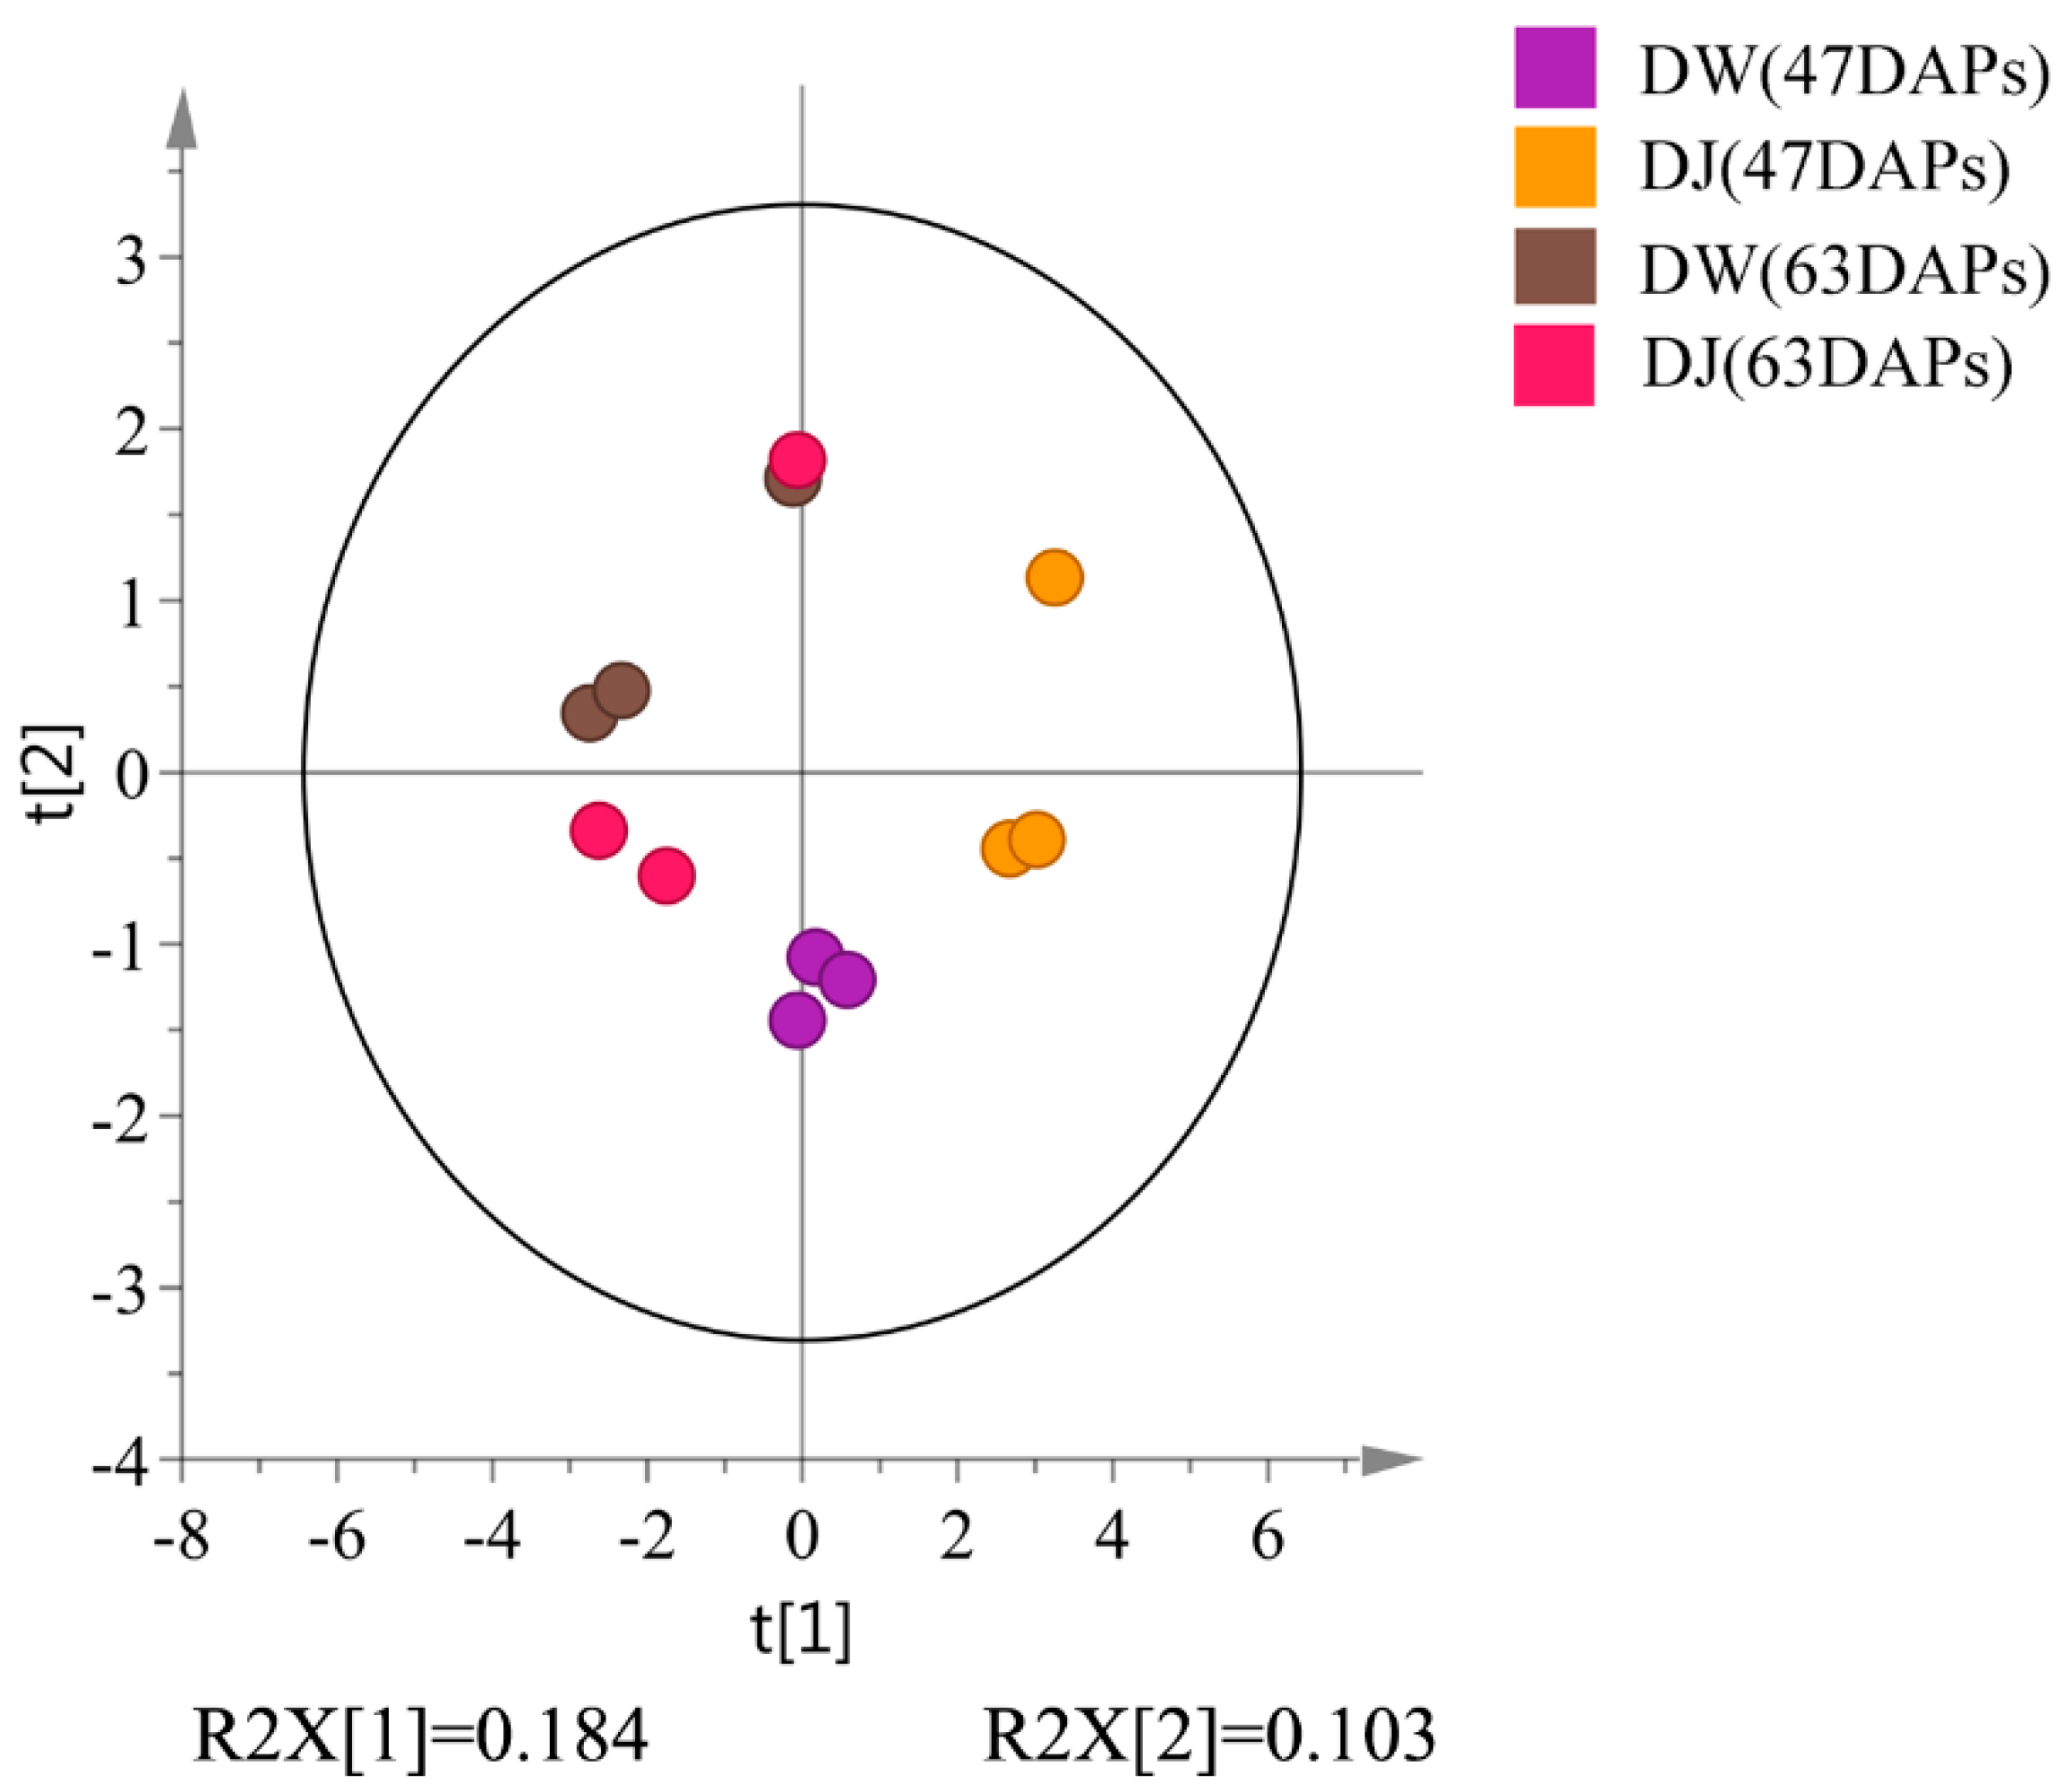
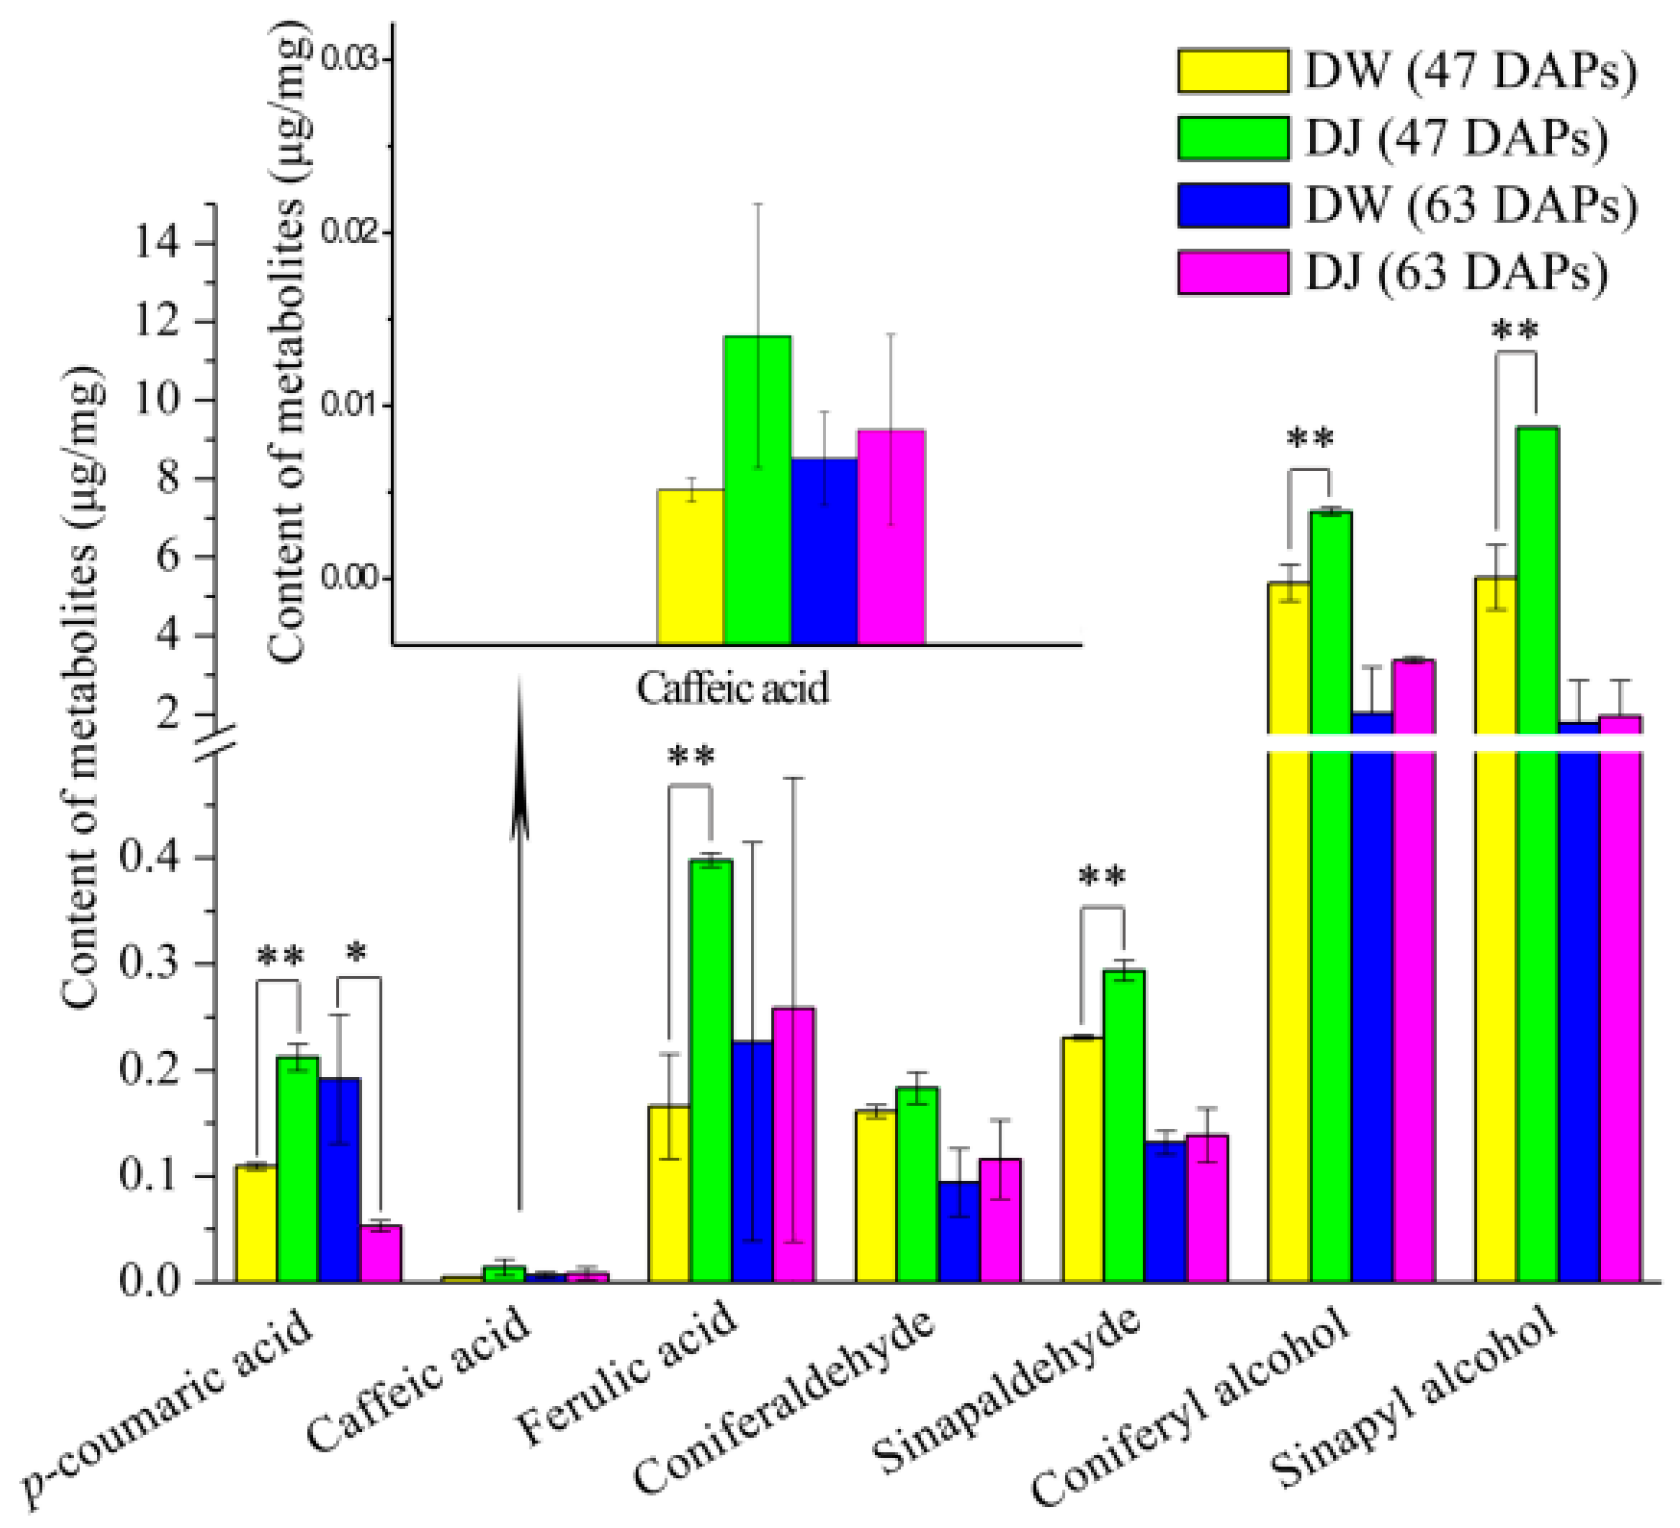
Through the targeted metabolomics analyses of DW and DJ, along with the OPLS-DA, at 47 DAPs, the differential metabolites identified were p-coumaric acid, ferulic acid, sinapaldehyde, coniferyl alcohol and sinapyl alcohol. At 63 DAPs, the differential metabolite was p-coumaric acid. Therefore, it is speculated that different pollens affect the formation of lignin synthesis intermediate metabolites in pear fruit and then regulate the formation of lignin. At 47 DAPs, different pollens had a great influence on the formation of lignin.
The differential metabolites included
p-coumaric acid both at 47 DAPs and 63 DAPs. The
p-coumaric acid content in DW was 0.52 times and 3.62 times higher than that in DJ at 47 DAPs and 63 DAPs, respectively; at the same time, the lignin content was 0.47 times and 2.55 times higher, respectively. It can be seen that when the lignin content in pear fruit is high, the
p-coumaric acid content is also high. Through multiple regression analysis, it was found that
p-coumaric acid and lignin were significantly positively correlated (R
2 = 0.733,
p < 0.01). The
p-coumaric acid content could affect the synthesis of lignin [
27,
28]. The synthesis of pear lignin mainly initiated from
p-coumaric acid, consistent with the results of Cai [
2].
p-Coumaric acid is a precursor to the synthesis of lignin in pear fruit, which is closely related to the synthesis of lignin and the formation of stone cells [
29].
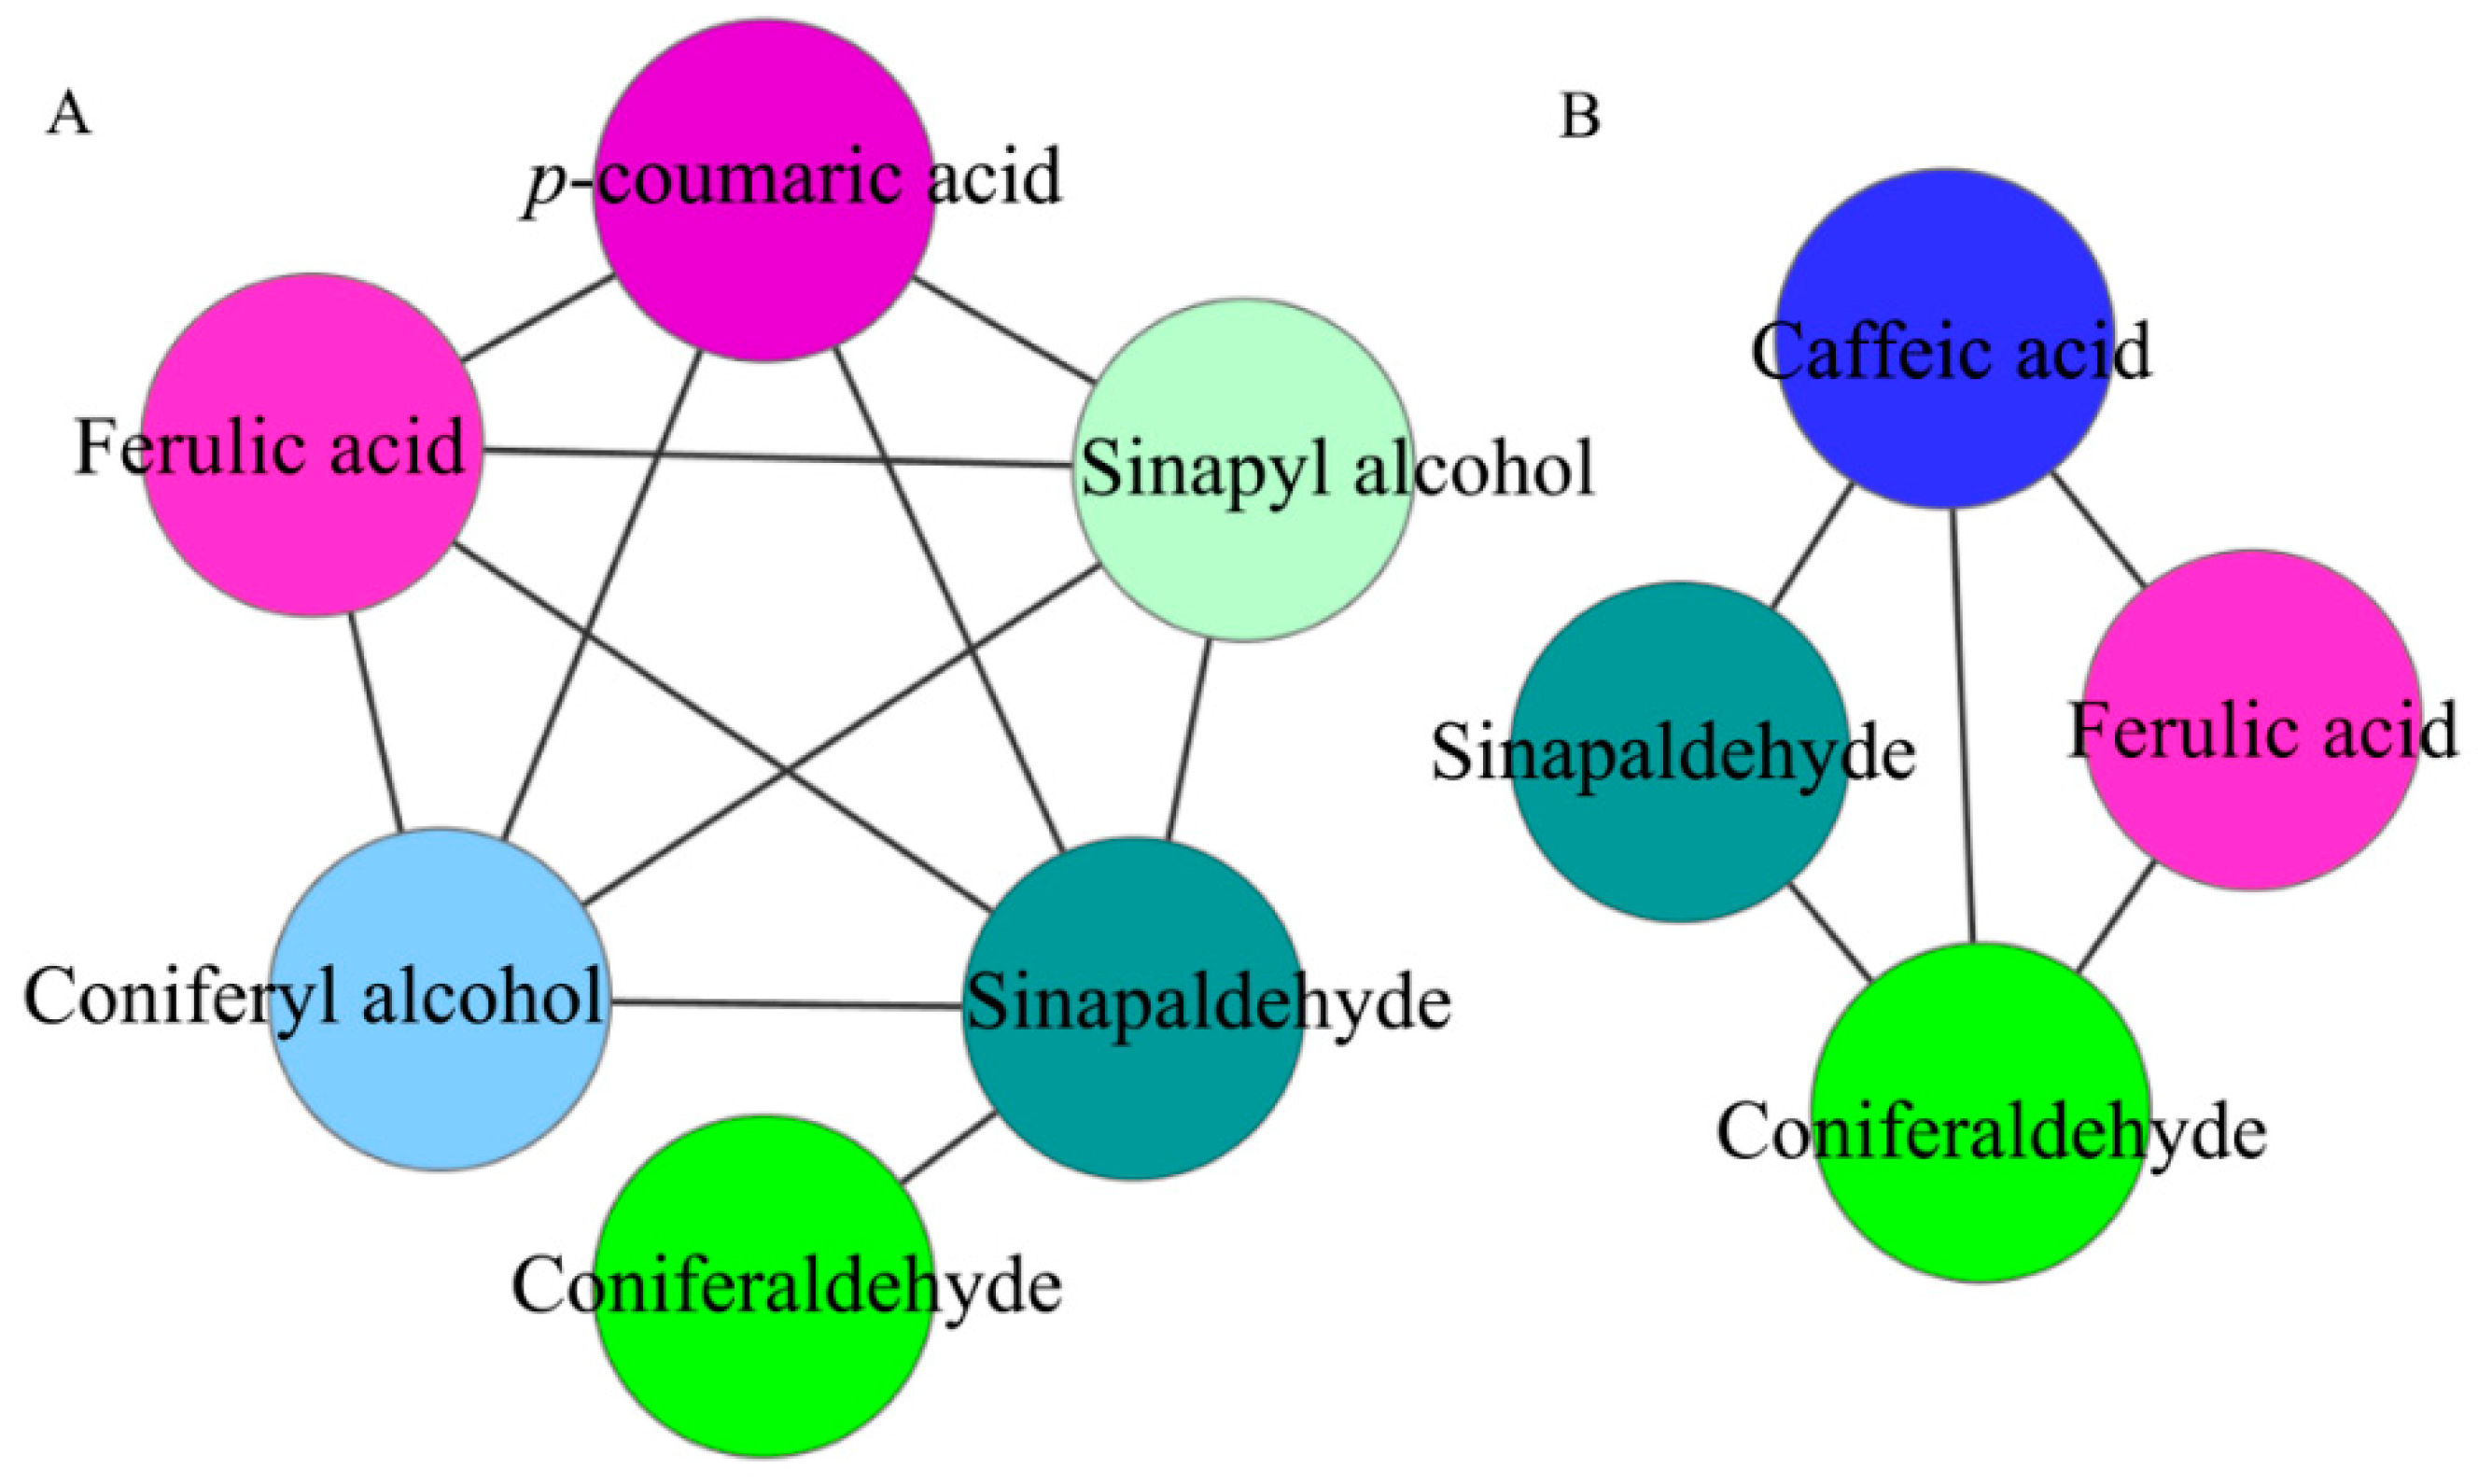
At 47 DAPs, 11 pairs of lignin synthesis intermediate metabolites were significantly positively correlated. At 63 DAPs, 5 pairs of lignin synthesis intermediate metabolites were significantly positively correlated. It can be seen that 47 DAPs is a critical period for lignin formation in pear fruit. This result is consistent with previous results [
13].
4. Materials and Methods
4.1. Materials
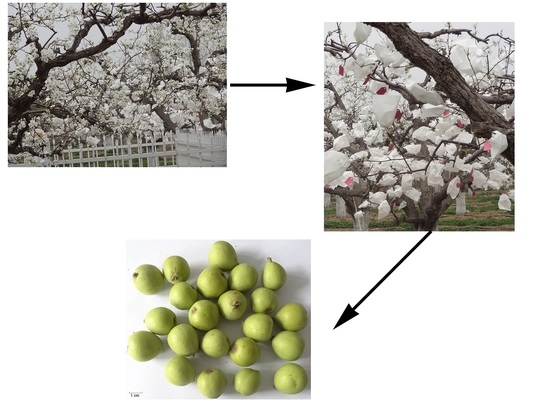
Fruits were obtained from 50-year-old pear trees grown in Dangshan, Anhui, China. In April, twenty robust and healthy ‘Dangshan Su’ managed in a consistent manner were selected as mother trees. The ‘Wonhwang’ (Pyrus pyrifolia Nakai.) and ‘Jingbaili’ (Pyrus ussuriensis Maxim.) were selected as father trees, and the pollen was collected from buds with similar developmental stages and sizes. Buds on the short branches of ‘Dangshan Su’ with similar developmental stages and sizes were selected from the mid-crown area on the south side of each tree, and the stamen was removed and fertilized with pollen from P. pyrifolia cv. ‘Wonhwang’ (DW) and P. ussuriensis cv. ‘Jingbaili’ (DJ). Two fruits were kept for each short branch and covered with bags for seven days after pollination. Fruits were collected at 47 and 63 DAPs. Twenty fruits with relatively uniform size were collected at each time point, refrigerated, and transferred to the laboratory for further study. The standard samples of cinnamic acid, p-coumaric acid, caffeic acid, ferulic acid, sinapic acid, coniferaldehyde, sinapaldehyde, coniferyl alcohol and sinapyl alcohol were purchased from Sigma-Aldrich (St. Louis, MO, USA) (purity > 99%).
Methanol (HPLC grade) was purchased from TEDIA (Fairfield, OH, USA). Pyridine was obtained from Ehrenstorfer (Augsburg, Germany). N,O-bis (trimethylsilyl)-trifluoroacetamide (BSTFA) containing 1% trimethylchlorosilane (TMCS) was purchased from SUPELCO (Bellefonte, PA, USA). Water was obtained from Wahaha Group Co., Ltd. (Hangzhou, China).
4.2. Preparation and LC-MS Detection of Lignin Synthesis Intermediate Metabolite Standard Solution
According to the difference in mass spectrometry response signals, the standards were weighed and dissolved in chromatographic-grade methanol solution to obtain standard solutions of different concentrations. Concentrations of p-coumaric acid, ferulic acid, coniferaldehyde, coniferyl alcohol, and sinapyl alcohol: 10, 30, 40, 80 and 500 ng/mL; cinnamic acid concentrations: 30, 40, 80, 500 and 1000 ng/mL; caffeic acid concentrations: 5, 10, 30, 40 and 80 ng/mL; sinapic acid concentrations: 5, 30, 40 and 80 ng/mL; and sinapaldehyde concentrations: 5, 10, 40, 80 and 500 ng/mL.
Standard solutions were analysed using ultra-high-performance liquid chromatography coupled with tandem mass spectrometry (UHPLC-MS/MS). The MS detection was performed on a Qtrap 6500 MS (AB Sciex, Framingham, MA, USA) equipped with an ESI source operating in negative-ion mode. Quantification of 9 metabolites was carried out in the MRM mode [
30,
31]. At the same time, optimization to voltage (DP), cluster collision (CE) and mass spectrum parameters, such as the optimal conditions for 9 types of compound ion pairs for rapid screening, was performed. The optimized mass spectrometry conditions were as follows: the gas curtain gas 30; collision gas 8; ion spray voltage −4500 V, temperature 550; ion source gas 1:55; and gas 2:55. The MRM detection parameters of 9 compounds are shown in
Table 5, and the corresponding MRM changes were measured to determine the retention time of each metabolite [
32,
33].
The eluents were as follows: A, water with 0.1% formic acid; and B, acetonitrile with 0.1% formic acid. The gradient program was as follows: 10–10% B (3 min), 10–95% B (10 min), 95–95% B (2 min), 95–10% B (0.1 min), and 10–10% B (2.9 min) at a constant flow of 0.2 mL/min. The standard curves and retention times were obtained by testing of the lignin synthesis intermediate metabolite standards (
Table 6).
4.3. Extraction and Derivation of Primary Metabolites from Pear and Analysis by GC-MS
According to Roessner [
34] and other methods, the extraction and derivation of primary metabolites in pears were performed as follows:
- (1)
A 100 mg sample frozen in liquid nitrogen was placed in a 2 mL centrifuge tube, and 1.4 mL of methanol (−20 °C precooled, chromatography grade) was added. The sample was ground with a ball mill and then vortexed for 1 min.
- (2)
The centrifuge tube was sealed with parafilm and placed in an ultrasonic cleaner at 40 °C for 30 min.
- (3)
After the end of the ultrasonication, the liquid and the residue was transferred from the 2 mL centrifuge tube to a 10 mL centrifuge tube, and 1.4 mL of purified water (precooled at 4 °C) was added. The sample was then centrifuged at 8000 rpm/min for 15 min.
- (4)
Then, 100 μL of the upper methanol/water mixture supernatant was placed in a glass flask, and the sample was dried with nitrogen and derivatized. First, 60 μL of hydroxylamine hydrochloride solution (hydroxylamine hydrochloride dissolved in pyridine, 20 mg/mL) was added, and then, the sample was sealed with parafilm, vortexed for 30 s, and placed in an oven at 37 °C for 120 min. Subsequently, 60 μL of derivatizing reagent (99% BSTFA + 1%TMCS) was added, and the flask was sealed and incubated at 37 °C for 90 min. After centrifugation at 12,000 rpm for 4 min, the supernatant was taken in the inner cannula, and the sample was tested. All samples were replicated six times. The test conditions were as follows:
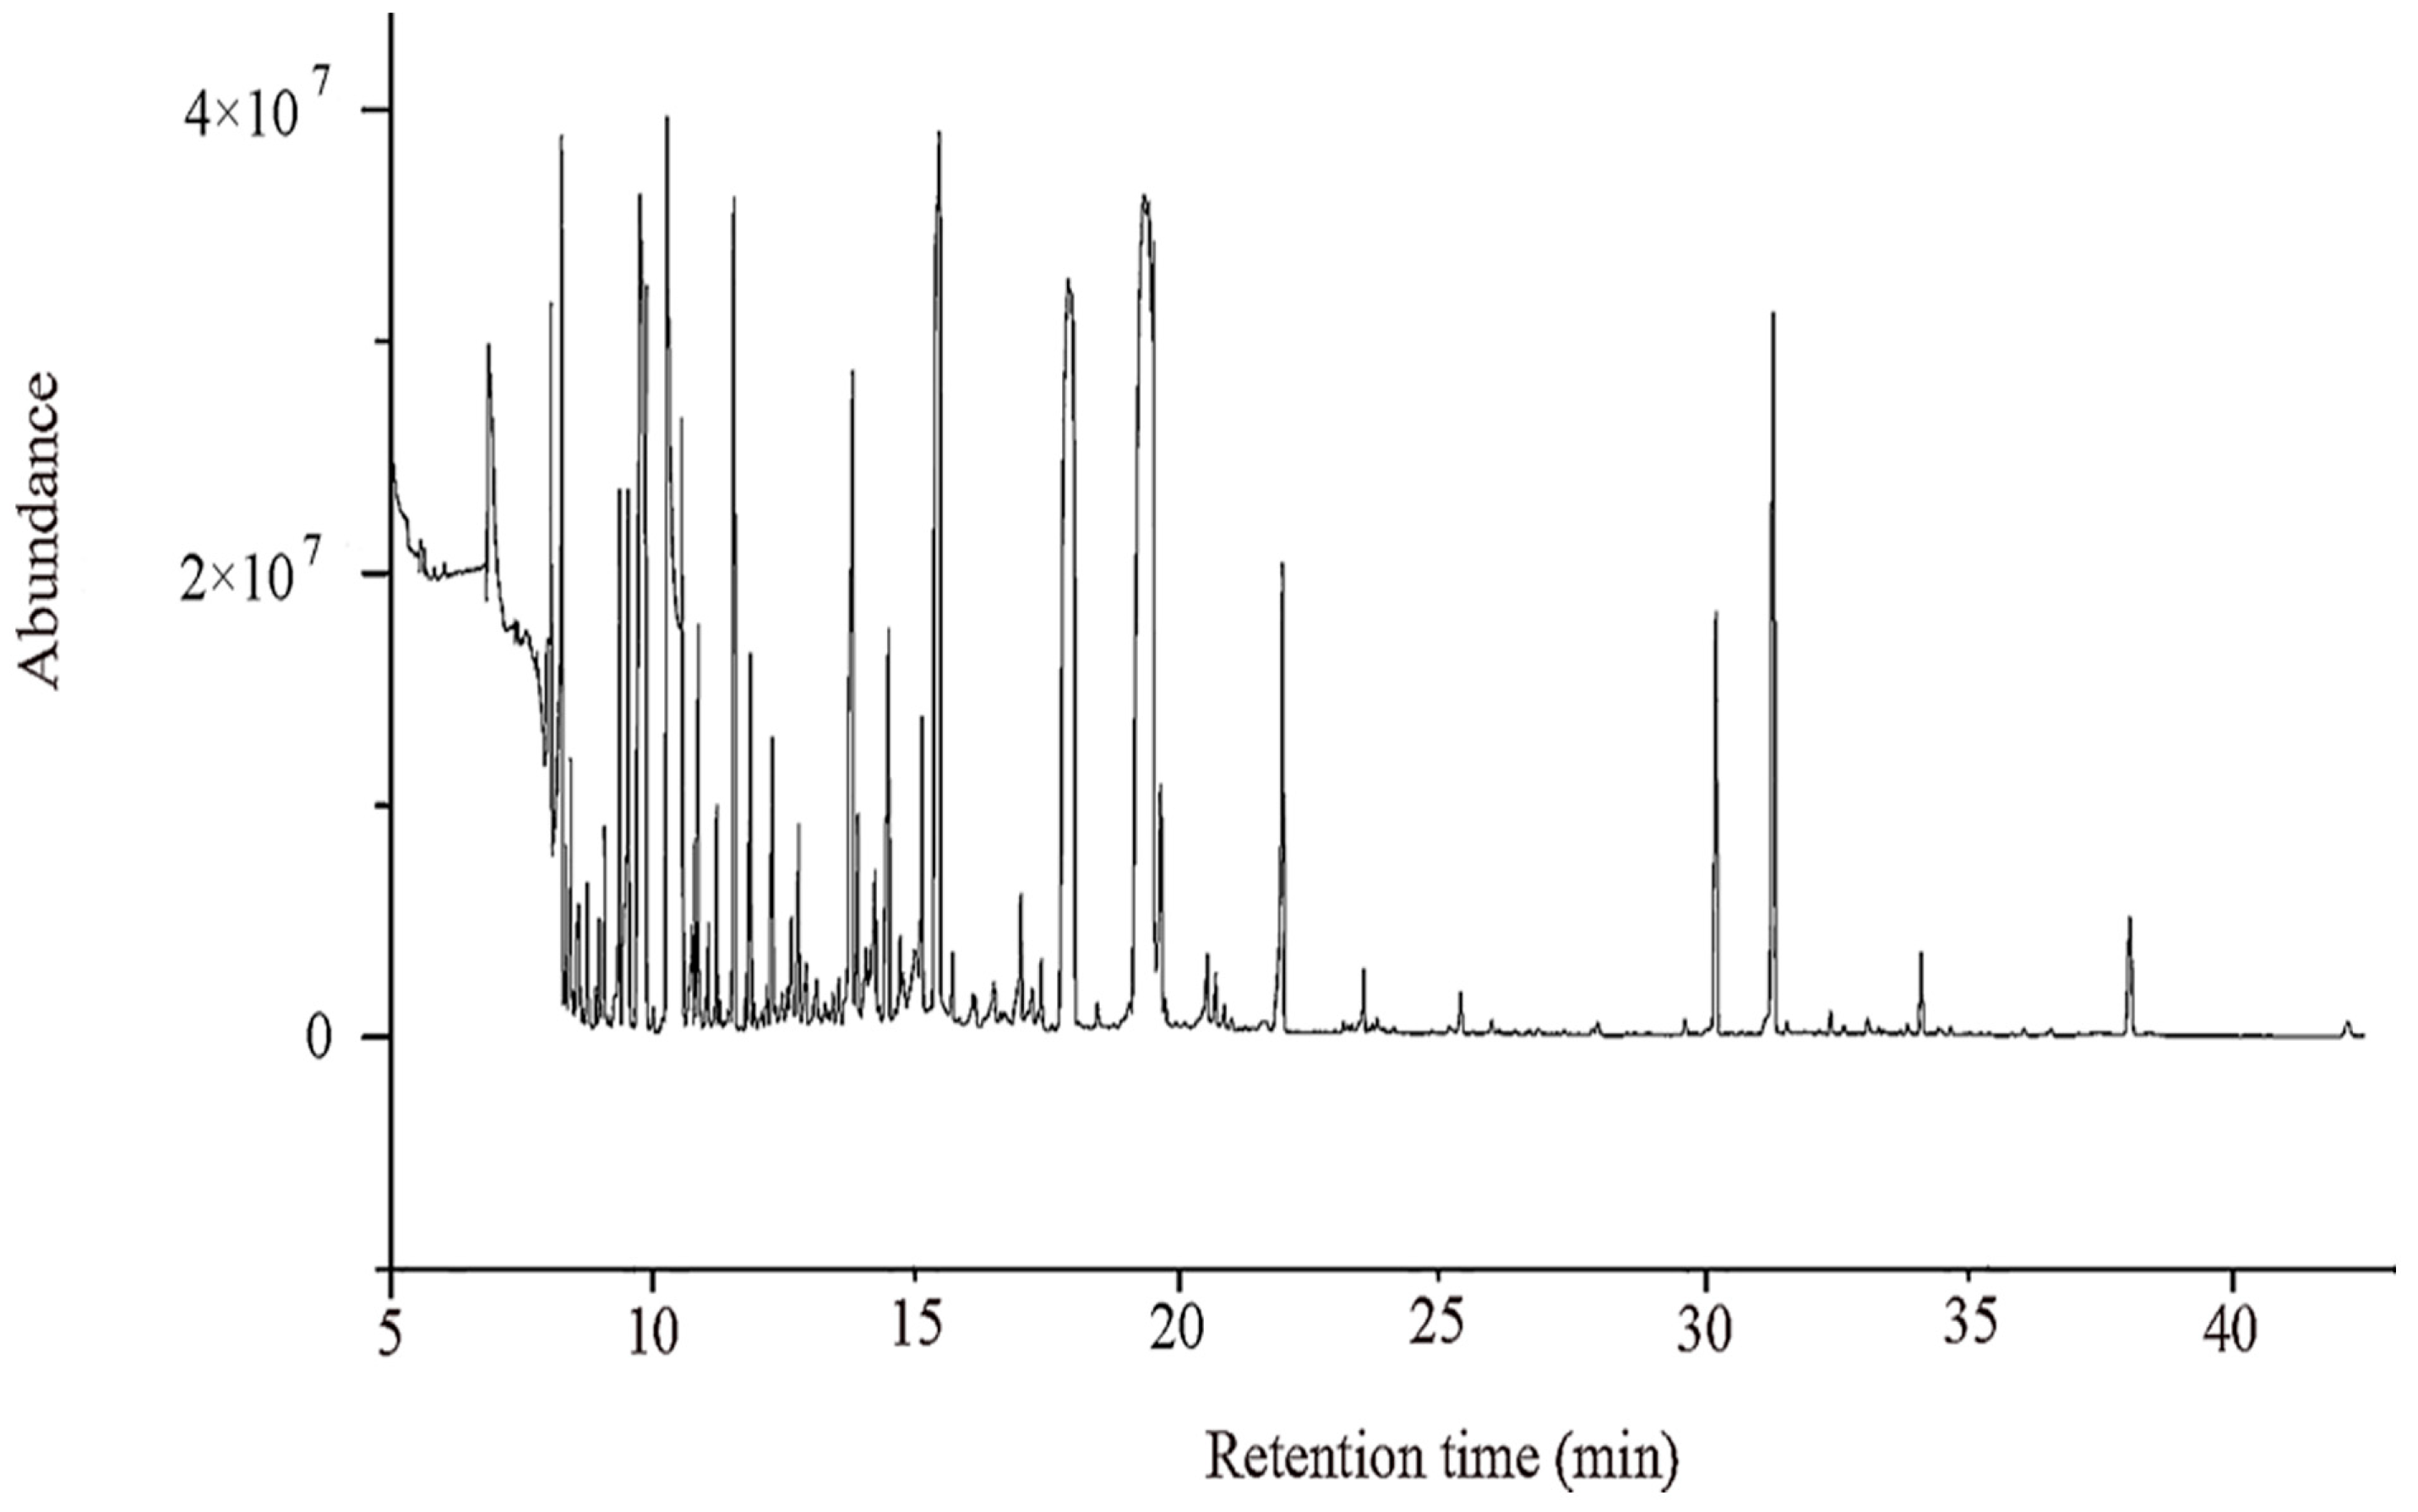
Extracts of pear fruits were subjected to metabolic profiling analysis using an Agilent 7890B-5975C GC-MS system. Chromatographic separation was performed with a DB-5 MS fused-silica capillary column (30 m × 0.25 mm × 0.25 μm, Agilent Technologies, Santa Clara, CA, USA). The splitless injection volume was 1 µL. The column temperature was held at 40 °C for 4 min, increased to 190 °C at a rate of 15 °C/min, increased to 200 °C at a rate of 4 °C/min for 3 min, increased to 240 °C at a rate of 10 °C/min for 5 min, and then increased to 280 °C at a rate of 10 °C/min for 10 min. The carrier gas was helium (99.999%, Hefei Junjun Experimental Materials Co., Ltd., Hefei, China), and the flow rate was maintained at a constant linear velocity of 1.0 mL/min. The electron ionization source voltage was 70 eV with an electron impact (EI) ionization mass spectrometric detector (MSD). The ion source temperature was 230 °C, and the interface temperature was 280 °C. Data acquisition started at 5.0 min, with a mass range of 35–780 m/z.
4.4. Extraction and LC-MS Detection of Intermediate Metabolites from Pyrus Lignin
- (1)
Extraction of phenolic acid material: 100 mg of the samples was taken and frozen in liquid nitrogen. According to the material liquid volume, 80% ethanol solution was added at a 1:15 ratio, and the sample was ground with a ball mill, ultrasonicated for 40 min at 40 °C, and centrifuged to obtain the supernatant. The process was repeated for each group three times.
- (2)
Phenolic alcohol extract and phenolic substances: 100 mg of each sample was frozen in liquid nitrogen. According to the material liquid volume, 90% ethanol solution was added at a 1:15 ratio, and the sample was ground with a ball mill, ultrasonicated for 30 min at 70 °C, and centrifuged to obtain the supernatant. The process was repeated for each group three times.
After combination of the two supernatants, the nitrogen was blown dry, and 100 μL of acetonitrile was added. The sample was centrifuged at 12,000 rpm for 10 min, and the supernatant was removed. UPLC-ESI-MS/MS was used for qualitative and quantitative analysis of the metabolites of lignin synthesis.
4.5. Data Processing and Analysis
To pass the raw GC/MS data through ChemStation (version e. 02.02.1431, Agilent, Santa Clara CA, USA) analysis software, they must be converted into a common format (CDF format) by importing ChromaTOF (version 4.34, LECO, St Joseph, MI, USA) preprocessing software, including extraction, peak to noise, and deconvolution functions. The NIST and Fiehn databases were used for qualitative metabolite analysis and alignment, and finally, the peak data matrix was derived.
LC-MS/MS data were analyzed with Analyst 1.6.2 software (AB Sciex, Framingham, MA, USA) using the default parameters for automatic identification of the various MRM changes and integrals. In addition, an auxiliary artificial check was performed by examining retention times and characteristic ions compared with those of the standards to determine the detected compounds. The linear regression standard curve was plotted with the concentration of the analyte as the vertical coordinate. The mass spectra peak area of each metabolite in the sample was substituted into the linear equation of the standards, and the metabolite content in the samples was obtained.
SIMCA-P (version 14.0, Umetrics, Umea, Sweden) was imported to adopt unsupervised principal component analysis (PCA) of the GC-MS matrix in the numerical test results data and the lignin synthesis intermediate metabolites content to examine differences between the population distribution in the samples and the stability of the whole analysis process. Then, supervised orthogonal partial least squares-discriminant analysis (OPLS-DA) was used to differentiate between the metabolic profile of the general differences between groups and to find the differences between groups of metabolites. The differential metabolites were selected on the basis of the combination of the statistically significant threshold of variable influence on projection (VIP) values obtained from the OPLS-DA model and the
p-value from a two-tailed Student’s
t-test of the normalized peak area. The VIP value means variables have influence on classification [
35]. Through this analysis, whether compounds in different groups significantly contributed (VIP > 1,
p < 0.05) was determined [
17,
36]. We mapped the differential metabolites to the KEGG database (
http://www.kegg.jp/kegg/pathway.html), which could be enriched to the KEGG pathway and confirmed the relationship between metabolite-metabolite correlations. SPSS software (IBM, Armonk, New York, USA) was also used for the statistical analyses, including correlations and significance analyses.

 ,
, 


