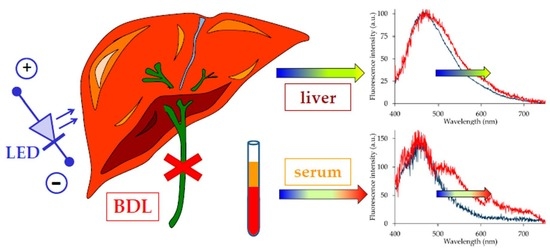
Serum and Hepatic Autofluorescence as a Real-Time Diagnostic Tool for Early Cholestasis Assessment

 ,
,  and
and
Abstract
:
1. Introduction
2. Results
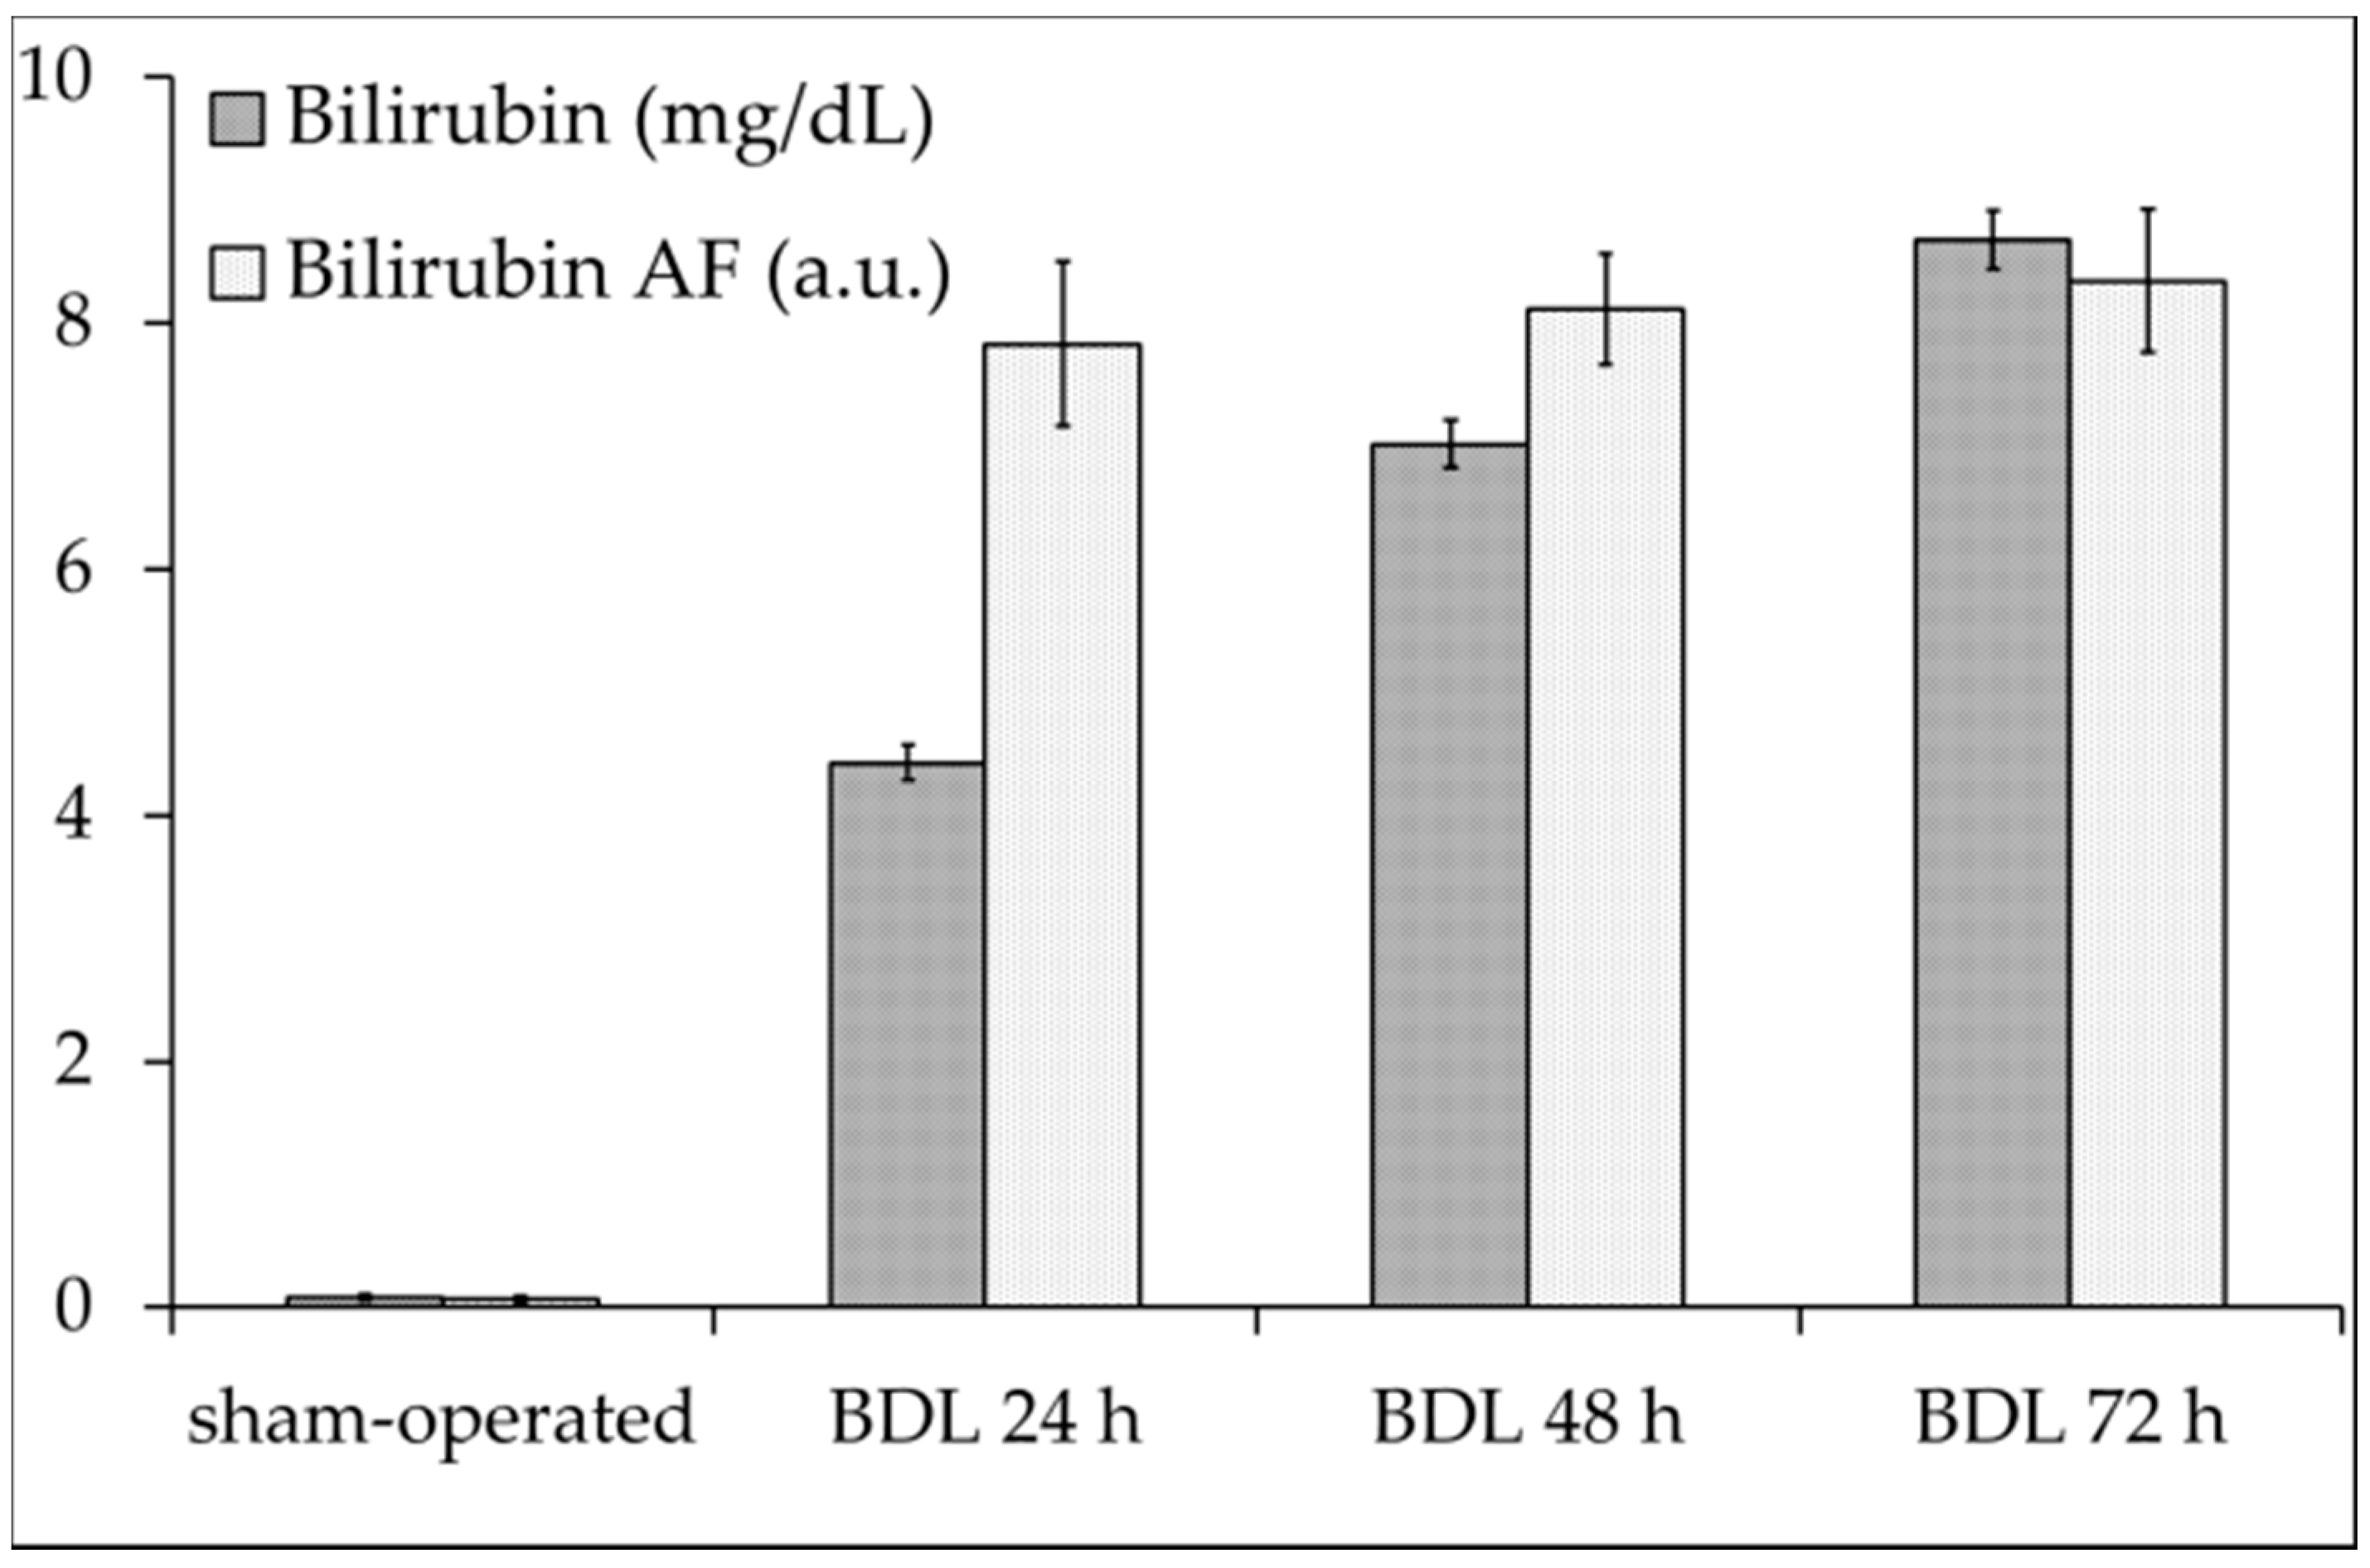
2.1. Serum Analysis
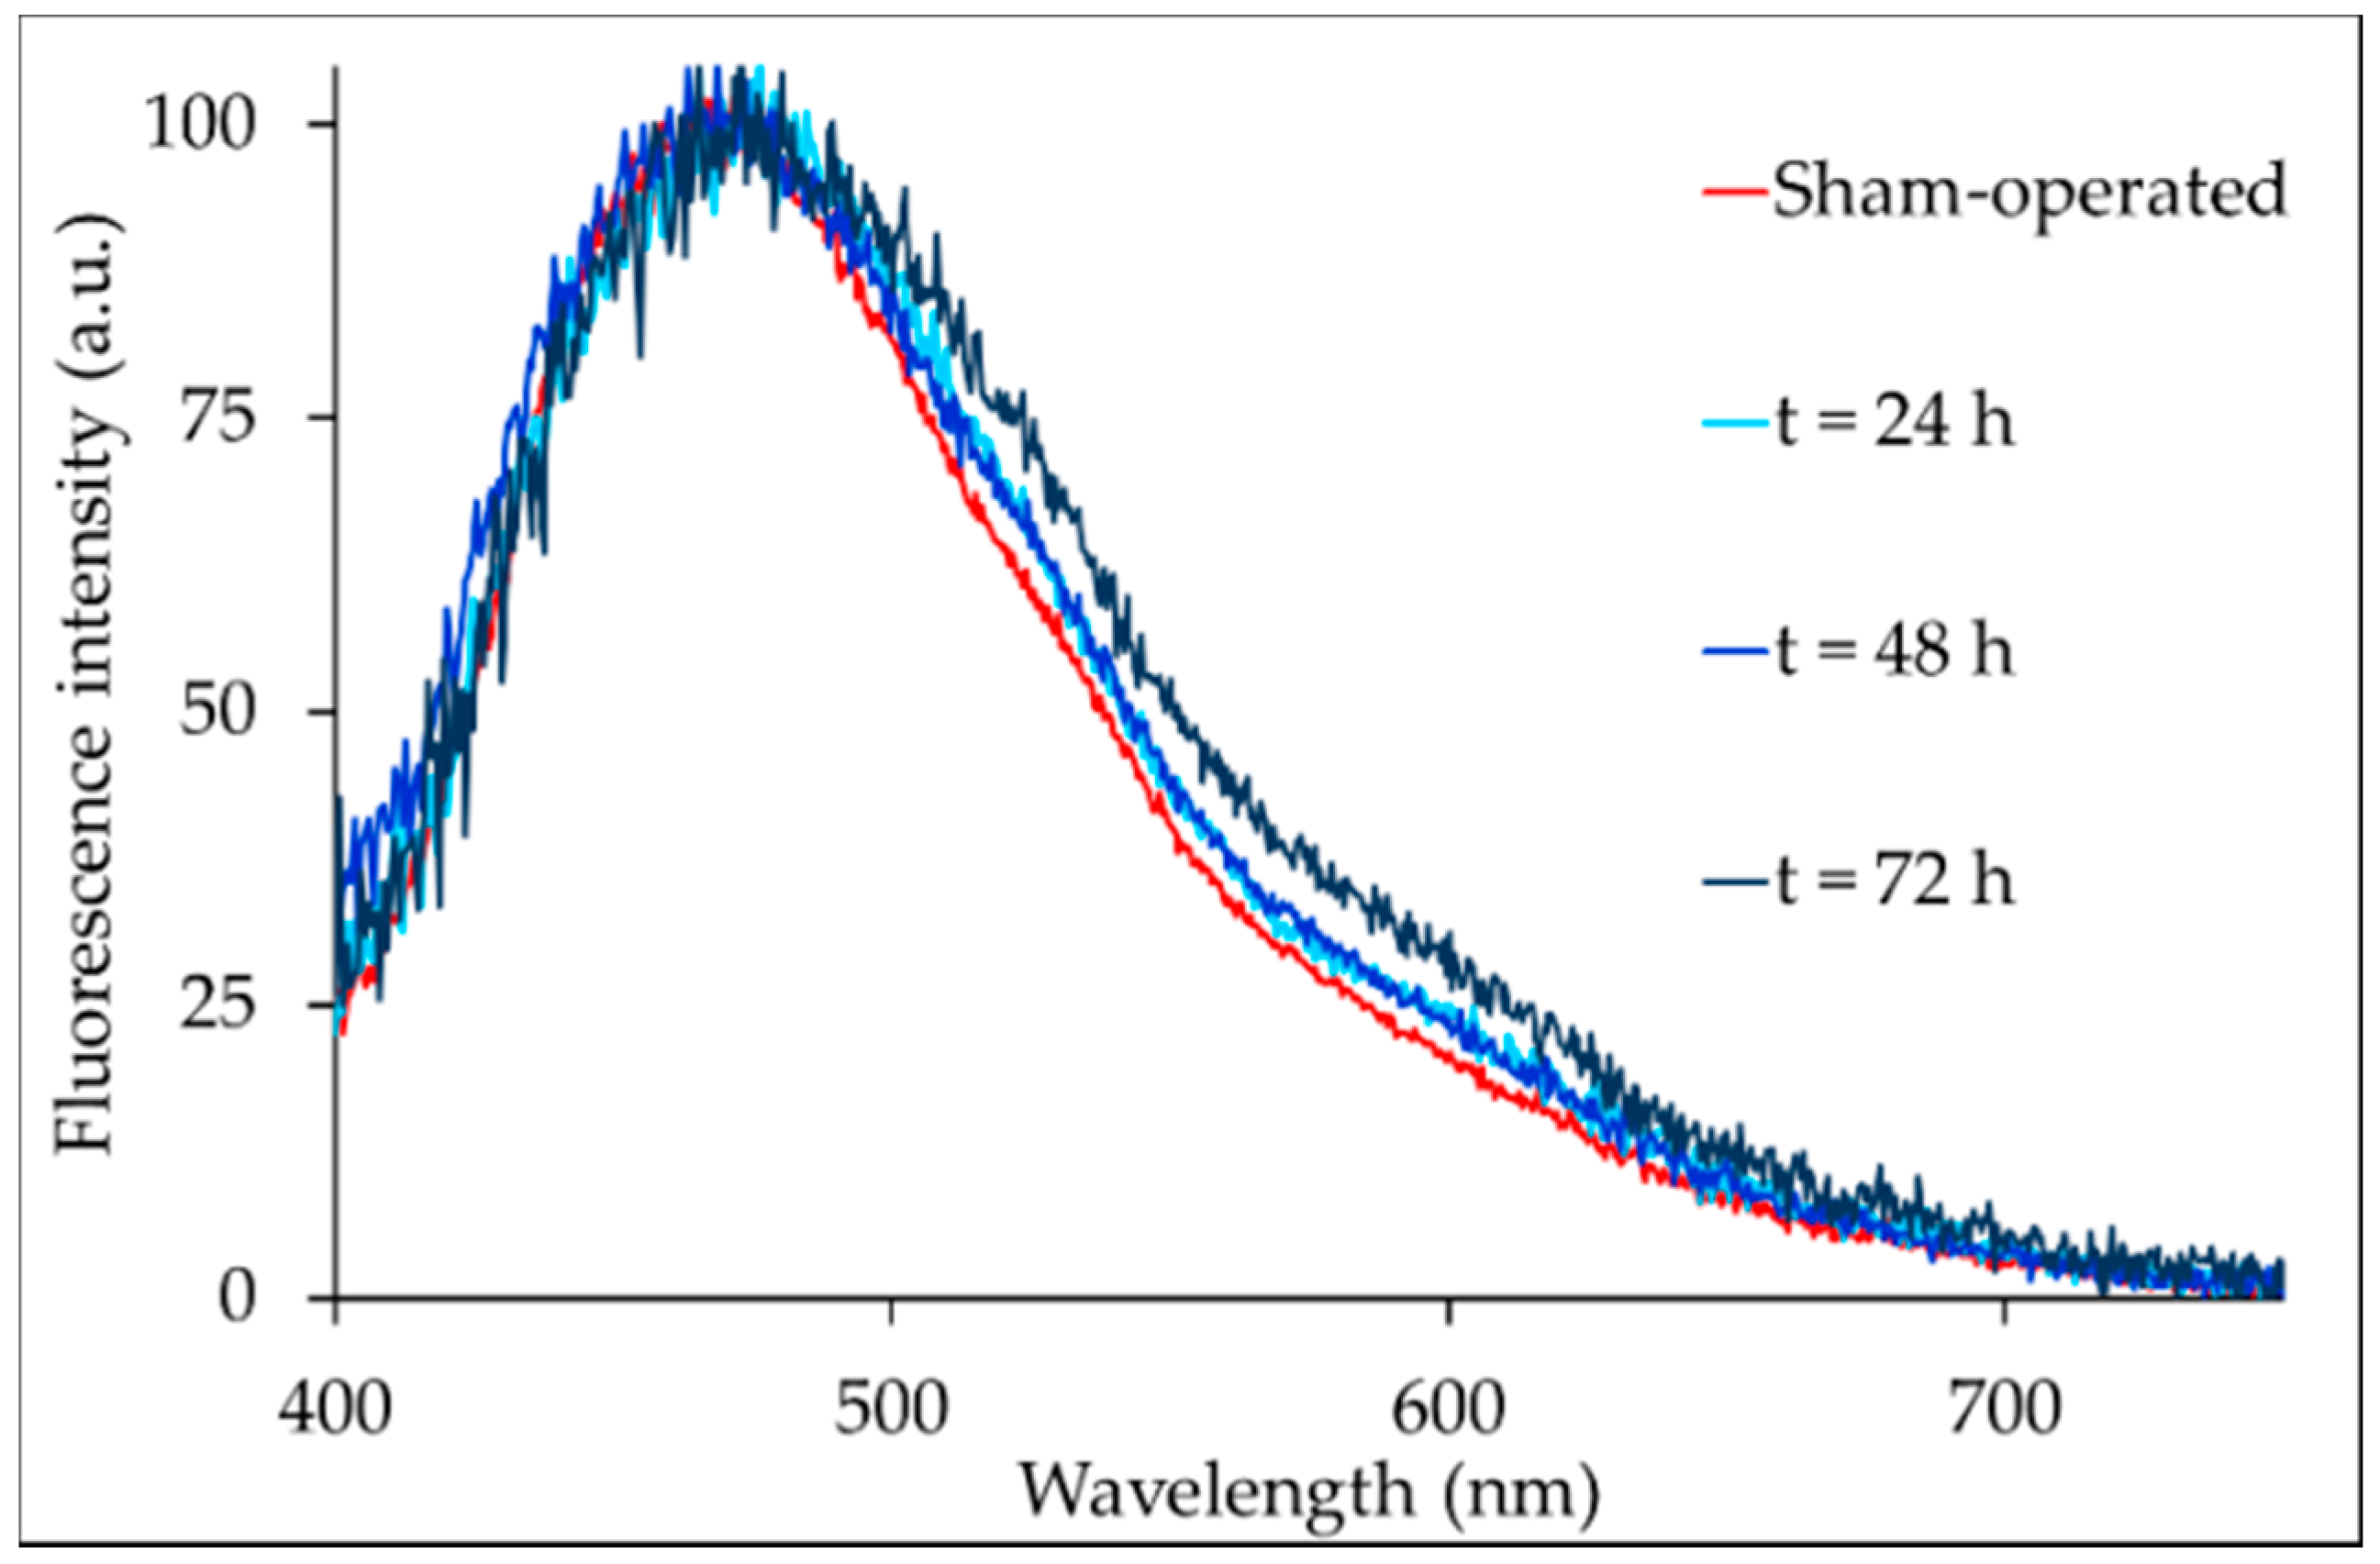
2.2. Liver Autofluorescence
3. Discussion
4. Materials and Methods
4.1. Animal Model
4.2. Chemicals and Biochemical Assays
4.3. Autofluorescence Spectrofluorometric Analysis
4.4. Spectral Fitting Analysis
4.5. Statistical Analysis
5. Conclusions
Supplementary Materials
Author Contributions
Funding
Acknowledgments
Conflicts of Interest
Abbreviations
| ADP | Adenosine diphosphate |
| AF | Autofluorescence |
| ALT | Alanine aminotransferase |
| AP | Alkaline phosphatase |
| AST | Aspartate transaminase |
| ATP | Adenosine triphosphate |
| a.u. | Arbitrary units |
| BDL | Bile duct ligation |
| CTAB | Hexadecyltrimethylammonium-bromide |
| GMG | Half-Gaussian modified Gaussian spectral functions |
| Lpgs | Lipopigments (Lipofuscin-like lipopigments) |
| MCD | Methyl choline deficient diet |
| NAD(P)H | Nicotinamide adenine dinucleotide (phosphate) |
| OMA | Optical multichannel analyzer |
| PBS | Phosphate-buffered saline |
| S.E. | Standard error |
| TBARS | Thiobarbituric acid reactive substances |
| γGT | γ-glutamyltransferase |
References
- De Vries, E.; Beuers, U. Management of cholestatic disease in 2017. Liver Int. 2017, 37, 123–129. [Google Scholar] [CrossRef] [PubMed]
- Woolbright, B.L.; Jaeschke, H. Novel insight into mechanisms of cholestatic liver injury. World J. Gastroenterol. 2012, 18, 4985–4993. [Google Scholar] [CrossRef] [PubMed]
- Varga, Z.V.; Erdelyi, K.; Paloczi, J.; Cinar, R.; Zsengeller, Z.K.; Jourdan, T.; Matyas, C.; Balazs, N.T.; Guillot, A.; Xiang, X.; et al. Disruption of renal arginine metabolism promotes kidney injury in hepatorenal syndrome. Hepatology 2018. [Google Scholar] [CrossRef] [PubMed]
- Dhanda, S.; Sunkaria, A.; Halder, A.; Sandhir, R. Mitochondrial dysfunctions contribute to energy deficits in rodent model of hepatic encephalopathy. Metab. Brain Dis. 2018, 33, 209–223. [Google Scholar] [CrossRef] [PubMed]
- Sheen, J.-M.; Chen, Y.-C.; Tain, Y.-L.; Huang, L.-T. Increased circulatory asymmetric dimethylarginine and multiple organ failure: Bile duct ligation in rat as a model. Int. J. Mol. Sci. 2014, 15, 3989–4006. [Google Scholar] [CrossRef] [PubMed]
- O’Brien, A.; China, L.; Massey, K.A.; Nicolaou, A.; Winstanley, A.; Newson, J.; Hobbs, A.; Audzevich, T.; Gilroy, D.W. Bile duct-ligated mice exhibit multiple phenotypic similarities to acute decompensation patients despite histological differences. Liver Int. 2016, 36, 837–846. [Google Scholar] [CrossRef] [PubMed]
- Mariotti, V.; Strazzabosco, M.; Fabris, L.; Calvisi, D.F. Animal models of biliary injury and altered bile acid metabolism. Biochim. Biophys. Acta 2018, 1864, 1254–1261. [Google Scholar] [CrossRef] [PubMed] [Green Version]
- Georgiev, P.; Jochum, W.; Heinrich, S.; Jang, J.H.; Nocito, A.; Dahm, F.; Clavien, P.A. Characterization of time-related changes after experimental bile duct ligation. Br. J. Surg. 2008, 95, 646–656. [Google Scholar] [CrossRef] [PubMed]
- Abshagen, K.; König, M.; Hoppe, A.; Müller, I.; Ebert, M.; Weng, H.; Holzhütter, H.-G.; Zanger, U.M.; Bode, J.; Vollmar, B.; et al. Pathobiochemical signatures of cholestatic liver disease in bile duct ligated mice. BMC Syst. Biol. 2015, 9, 83. [Google Scholar] [CrossRef] [PubMed] [Green Version]
- Woolbright, B.L.; Jaeschke, H. Therapeutic targets for cholestatic liver injury. Expert Opin. Ther. Targets 2016, 20, 463–475. [Google Scholar] [CrossRef] [PubMed]
- Heidari, R.; Ghanbarinejad, V.; Mohammadi, H.; Ahmadi, A.; Ommati, M.M.; Abdoli, N.; Aghaei, F.; Esfandiari, A.; Azarpira, N.; Niknahad, H. Mitochondria protection as a mechanism underlying the hepatoprotective effects of glycine in cholestatic mice. Biomed. Pharmacother. 2018, 97, 1086–1095. [Google Scholar] [CrossRef] [PubMed]
- Arduini, A.; Serviddio, G.; Tormos, A.M.; Monsalve, M.; Sastre, J. Mitochondrial dysfunction in cholestatic liver diseases. Front. Biosci. 2012, 4, 2233–2252. [Google Scholar] [CrossRef]
- Kountouras, J.; Billing, B.H.; Scheuer, P.J. Prolonged bile duct obstruction: A new experimental model for cirrhosis in the rat. Br. J. Exp. Pathol. 1984, 65, 305–311. [Google Scholar] [PubMed]
- Liu, F.; Chen, L.; Rao, H.-Y.; Teng, X.; Ren, Y.-Y.; Lu, Y.-Q.; Zhang, W.; Wu, N.; Liu, F.-F.; Wei, L. Automated evaluation of liver fibrosis in thioacetamide, carbon tetrachloride and bile duct ligation rodent models using second-harmonic generation/two-photon excited fluorescence microscopy. Lab. Investig. 2017, 97, 84–92. [Google Scholar] [CrossRef] [PubMed]
- Croce, A.C.; Bottiroli, G. Autofluorescence spectroscopy and imaging: A tool for biomedical research and diagnosis. Eur. J. Histochem. 2014, 58, 320–337. [Google Scholar] [CrossRef] [PubMed]
- Croce, A.C.; Ferrigno, A.; Bottiroli, G.; Vairetti, M. Autofluorescence-based optical biopsy: An effective diagnostic tool in hepatology. Liver Int. 2018, 38, 1160–1174. [Google Scholar] [CrossRef] [PubMed]
- Croce, A.C.; Ferrigno, A.; Santin, G.; Vairetti, M.; Bottiroli, G. Bilirubin: An autofluorescence bile biomarker for liver functionality monitoring. J. Biophotonics 2014, 7, 810–817. [Google Scholar] [CrossRef] [PubMed]
- Croce, A.C.; Santamaria, G.; de Simone, U.; Lucchini, F.; Freitas, I.; Bottiroli, G. Naturally-occurring porphyrins in a spontaneous-tumour bearing mouse model. Photochem. Photobiol. Sci. 2011, 10, 1189–1195. [Google Scholar] [CrossRef] [PubMed]
- Gao, B. Editorial. Cell. Mol. Immunol. 2016, 13, 265–266. [Google Scholar] [CrossRef] [PubMed]
- Papadopoulos, V.; Filippou, D.; Manolis, E.; Mimidis, K. Haemostasis impairment in patients with obstructive jaundice. J. Gastrointestin. Liver Dis. 2007, 16, 177–186. [Google Scholar] [PubMed]
- Burtis, C.A.; Ashwood, E.R.; Bruns, D.E. Tietz Textbook of Clinical Chemistry and Molecular Diagnostics, 4th ed.; Saunders: Philadelphia, PA, USA, 2006; ISBN 9781455734122. [Google Scholar]
- Fahmy, S.R.; Mohamed, A.S. Holoturia arenicola extract modulates bile duct ligation-induced oxidative stress in rat kidney. Int. J. Clin. Exp. Pathol. 2015, 8, 1649–1657. [Google Scholar] [PubMed]
- Ferrigno, A.; Palladini, G.; Bianchi, A.; Rizzo, V.; di Pasqua, L.G.; Perlini, S.; Richelmi, P.; Vairetti, M. Lobe-specific heterogeneity in asymmetric dimethylarginine and matrix metalloproteinase levels in a rat model of obstructive cholestasis. Biomed. Res. Int. 2014, 2014. [Google Scholar] [CrossRef] [PubMed]
- Fargo, M.V.; Grogan, S.P.; Saguil, A. Evaluation of jaundice in adults. Am. Fam. Phys. 2017, 95, 164–168. [Google Scholar] [PubMed]
- Masubuchi, N.; Nishiya, T.; Imaoka, M.; Mizumaki, K.; Okazaki, O. Promising toxicological biomarkers for the diagnosis of liver injury types: Bile acid metabolic profiles and oxidative stress marker as screening tools in drug development. Chem. Biol. Interact. 2016, 255, 74–82. [Google Scholar] [CrossRef] [PubMed]
- Croce, A.C.; Ferrigno, A.; Santin, G.; Piccolini, V.M.; Bottiroli, G.; Vairetti, M. Autofluorescence of liver tissue and bile: Organ functionality monitoring during ischemia and reoxygenation. Lasers Surg. Med. 2014, 46, 412–421. [Google Scholar] [CrossRef] [PubMed]
- Bloomer, J.R. Liver metabolism of porphyrins and haem. J. Gastroenterol. Hepatol. 1998, 13, 324–329. [Google Scholar] [CrossRef] [PubMed] [Green Version]
- Esmat, S.; Elgendy, D.; Ali, M.; Esmat, S.; El-Nabarawy, E.A.; Mahmoud, S.B.; Shaker, O. Prevalence of photosensitivity in chronic hepatitis C virus patients and its relation to serum and urinary porphyrins. Liver Int. 2014, 34, 1033–1039. [Google Scholar] [CrossRef] [PubMed]
- Sassa, S. Modern diagnosis and management of the porphyrias. Br. J. Haematol. 2006, 135, 281–292. [Google Scholar] [CrossRef] [PubMed] [Green Version]
- Wang, Q.M.; Duan, Z.J.; Du, J.L.; Guo, S.B.; Sun, X.Y.; Liu, Z. Heme oxygenase/carbon monoxide pathway inhibition plays a role in ameliorating fibrosis following splenectomy. Int. J. Mol. Med. 2013, 31, 1186–1194. [Google Scholar] [CrossRef] [PubMed]
- Fukushima, S.; Okuno, H.; Shibatani, N.; Nakahashi, Y.; Seki, T.; Okazaki, K. Effect of biliary obstruction and internal biliary drainage on hepatic cytochrome P450 isozymes in rats. World J. Gastroenterol. 2008, 14, 2556–2560. [Google Scholar] [CrossRef] [PubMed]
- Marcu, L. Characterization of type I, II, III, IV, and V collagens by time-resolved laser-induced fluorescence spectroscopy. Proc. SPIE 2000, 3917, 93–101. [Google Scholar] [CrossRef]
- Derosa, G.; Maffioli, P. Traditional Markers in Liver Disease. In Biomarkers in Liver Disease; Springer: Dordrecht, The Netherlands, 2017; pp. 3–22. ISBN 9400776748. [Google Scholar]
- Croce, A.C.; de Simone, U.; Freitas, I.; Boncompagni, E.; Neri, D.; Cillo, U.; Bottiroli, G. Human liver autofluorescence: An intrinsic tissue parameter discriminating normal and diseased conditions. Lasers Surg. Med. 2010, 42, 371–378. [Google Scholar] [CrossRef] [PubMed]
- Palladini, G.; Ferrigno, A.; Richelmi, P.; Perlini, S.; Vairetti, M. Role of matrix metalloproteinases in cholestasis and hepatic ischemia/reperfusion injury: A review. World J. Gastroenterol. 2015, 21, 12114–12124. [Google Scholar] [CrossRef] [PubMed]
- Palladini, G.; Ferrigno, A.; Rizzo, V.; Boncompagni, E.; Richelmi, P.; Freitas, I.; Perlini, S.; Vairetti, M. Lobe-specific heterogeneity and matrix metalloproteinase activation after ischemia/reperfusion injury in rat livers. Toxicol. Pathol. 2012, 40, 722–730. [Google Scholar] [CrossRef] [PubMed]
- Croce, A.C.; Ferrigno, A.; Piccolini, V.M.; Tarantola, E.; Boncompagni, E.; Bertone, V.; Milanesi, G.; Freitas, I.; Vairetti, M.; Bottiroli, G. Integrated autofluorescence characterization of a modified-diet liver model with accumulation of lipids and oxidative stress. Biomed. Res. Int. 2014, 2014. [Google Scholar] [CrossRef] [PubMed]
- Bidlack, W.R.; Tappel, A.L. Fluorescent products of phospholipids during lipid peroxidation. Lipids 1973, 8, 203–207. [Google Scholar] [CrossRef] [PubMed]
- Slater, T.F.; Sawyer, B.C. The stimulatory effects of carbon tetrachloride and other halogenoalkanes on peroxidative reactions in rat liver fractions in vitro. General features of the systems used. Biochem. J. 1971, 123, 805–814. [Google Scholar] [CrossRef] [PubMed]
- Croce, A.C.; Ferrigno, A.; Bertone, V.; Piccolini, V.M.; Berardo, C.; Di Pasqua, L.G.; Rizzo, V.; Bottiroli, G.; Vairetti, M. Fatty liver oxidative events monitored by autofluorescence optical diagnosis: Comparison between subnormothermic machine perfusion and conventional cold storage preservation. Hepatol. Res. 2017, 47, 668–682. [Google Scholar] [CrossRef] [PubMed]
- Alonzo, C.A.; Karaliota, S.; Pouli, D.; Liu, Z.; Karalis, K.P.; Georgakoudi, I. Two-photon excited fluorescence of intrinsic fluorophores enables label-free assessment of adipose tissue function. Sci. Rep. 2016, 6, 31012. [Google Scholar] [CrossRef] [PubMed] [Green Version]
- Sato, B.; Tanaka, A.; Mori, S.; Yanabu, N.; Kitai, T.; Tokuka, A.; Inomoto, T.; Iwata, S.; Yamaoka, Y.; Chance, B. Quantitative analysis of redox gradient within the rat liver acini by fluorescence images: Effects of glucagon perfusion. Biochim. Biophys. Acta 1995, 1268, 20–26. [Google Scholar] [CrossRef]
- Chance, B.; Schoener, B.; Oshino, R.; Itshak, F.; Nakase, Y. Oxidation-reduction ratio studies of mitochondria in freeze-trapped samples. NADH and flavoprotein fluorescence signals. J. Biol. Chem. 1979, 254, 4764–4771. [Google Scholar] [PubMed]
- Kunz, W.S.; Kunz, W. Contribution of different enzymes to flavoprotein fluorescence of isolated rat liver mitochondria. Biochim. Biophys. Acta 1985, 841, 237–246. [Google Scholar] [CrossRef]
- Scholz, R.; Thurman, R.G.; Williamson, J.R.; Chance, B.; Bücher, T. Flavin and pyridine nucleotide oxidation-reduction changes in perfused rat liver. I. Anoxia and subcellular localization of fluorescent flavoproteins. J. Biol. Chem. 1969, 244, 2317–2324. [Google Scholar] [PubMed]
- Cu, A.; Bellah, G.G.; Lightner, D.A. On the Fluorescence of Bilirubin. J. Am. Chem. Soc. 1975, 97, 2579–2580. [Google Scholar] [CrossRef] [PubMed]
- Lowry, O.H.; Rosebrough, N.J.; Farr, L.; Randall, R. Protein measurement with the folin phenol reagent. J. Biol. Chem. 1951, 193, 265–275. [Google Scholar] [CrossRef] [PubMed]
- Ferrigno, A.; di Pasqua, L.G.; Berardo, C.; Siciliano, V.; Richelmi, P.; Vairetti, M. Oxygen tension-independent protection against hypoxic cell killing in rat liver by low sodium. Eur. J. Histochem. 2017, 61, 2798. [Google Scholar] [CrossRef] [PubMed]
- Ferrigno, A.; Carlucci, F.; Tabucchi, A.; Tommassini, V.; Rizzo, V.; Richelmi, P.; Gringeri, E.; Neri, D.; Boncompagni, E.; Freitas, I.; et al. Different susceptibility of liver grafts from lean and obese Zucker rats to preservation injury. Cryobiology 2009, 59, 327–334. [Google Scholar] [CrossRef] [PubMed]
- Croce, A.C.; Ferrigno, A.; Vairetti, M.; Bertone, R.; Freitas, I.; Bottiroli, G. Autofluorescence properties of isolated rat hepatocytes under different metabolic conditions. Photochem. Photobiol. Sci. 2004, 3, 920–926. [Google Scholar] [CrossRef] [PubMed]
- Marquardt, D.W. An Algorithm for Least-Squares Estimation of Nonlinear Parameters. J. Soc. Ind. Appl. Math. 1963, 11, 431–441. [Google Scholar] [CrossRef]


| Rat Model | AST (mU/mL) a | ALT (mU/mL) a | γGT (mU/mL) a | AP (mU/mL) b | Iron (mg/dL) a | Uric Acid (mg/dL) b | Urea (mg/dL) a |
|---|---|---|---|---|---|---|---|
| Sham-operated | 90.20 ± 7.10 | 36.41 ± 2.20 | 3.7 ± 0.02 | 259.63 ± 13.01 | 158.62 ± 18.01 | 1.15 ± 0.10 | 20.4 ± 0.9 |
| BDL | 636.22 ± 82.10 | 306.21 ± 35.10 | 10.21 ± 2.1 | 329.83 ± 25.04 | 294.22 ± 48.13 | 0.82 ± 0.05 b | 31.42 ± 1.25 |
| BDL Time | Autofluorescence Signal Contributors | ||||
|---|---|---|---|---|---|
| Blue Band (center = 455 nm) | Bilirubin (517–530 nm) | Bilirubin (570 nm) | Bilirubin (517–530 nm)/(570 nm) | Red Bands (600–770 nm) | |
| Sham-operated | 98.56 ± 5.26 | ≈0.09 § | ≈0.06 § | § | 1.76 ± 0.12 a |
| t = 24 h | 69.05 ± 3.49 | 16.98 ± 1.45 | 4.67 ± 0.34 | 4.17 ± 0.29 | 7.12 ± 0.40 b |
| t = 48 h | 70.22 ± 4.41 | 14.80 ± 0.76 | 3.68 ± 0.20 | 4.01 ± 0.31 | 8.71 ± 0.46 c |
| t = 72 h | 67.31 ± 4.77 | 14.31 ± 0.92 | 3.56 ± 0.24 | 4.02 ± 0.20 | 13.60 ± 0.62 b,c |
| BDL Time | Autofluorescence Endogenous Fluorophores | ||||||
|---|---|---|---|---|---|---|---|
| Proteins | NAD(P)Hbound | NAD(P)Hfree | Flavins | Vitamin A | Fatty Acids | Lpgs | |
| Sham-operated | 3.72 ± 0.26 a,b | 13.06 ± 0.81 c | 39.23 ± 2.35 | 3.94 ± 0.20 d | 21.07 ± 1.07 a | 12.43 ± 0.71 | 6.01 ± 0.43 c |
| t = 24 h | 5.40 ± 0.44 a,a′ | 11.76 ± 0.83 | 38.19 ± 2.29 | 5.02 ± 0.25 | 20.44 ± 1.22 | 11.42 ± 0.78 | 6.69 ± 0.55 |
| t = 48 h | 7.09 ± 0.49 b | 11.33 ± 0.68 | 37.88 ± 1.97 | 5.37 ± 0.26 | 18.35 ± 0.91 | 11.10 ± 0.59 | 6.98 ± 0.50 |
| t = 72 h | 8.80 ± 0.52 a′,b | 9.27 ± 0.46 c | 37.15 ± 1.67 | 5.02 ± 0.27 | 16.97 ± 0.69 a | 10.9 ± 0.46 | 8.78 ± 0.42 c |
| BDL Time | Optical Parameters | Biochemical Parameters | |||
|---|---|---|---|---|---|
| NAD(P)Htotal | NAD(P)Hfree/NAD(P)Hbound a | Redox Ratio b | ATP/ADP c | TBARS (nmol/mg prot) c | |
| Sham-operated | 56.23 ± 3.65 | 3.00 ± 0.18 a | 0.070 ± 0.003 | 3.85 ± 0.90 | 0.19 ± 0.02 |
| t = 72 h | 51.44 ± 2.62 | 4.01 ± 0.21 | 0.097 ± 0.005 | 1.24 ± 0.31 | 0.31 ± 0.01 |
© 2018 by the authors. Licensee MDPI, Basel, Switzerland. This article is an open access article distributed under the terms and conditions of the Creative Commons Attribution (CC BY) license (http://creativecommons.org/licenses/by/4.0/).
Share and Cite
Croce, A.C.; Bottiroli, G.; Di Pasqua, L.G.; Berardo, C.; Siciliano, V.; Rizzo, V.; Vairetti, M.; Ferrigno, A. Serum and Hepatic Autofluorescence as a Real-Time Diagnostic Tool for Early Cholestasis Assessment. Int. J. Mol. Sci. 2018, 19, 2634. https://doi.org/10.3390/ijms19092634
Croce AC, Bottiroli G, Di Pasqua LG, Berardo C, Siciliano V, Rizzo V, Vairetti M, Ferrigno A. Serum and Hepatic Autofluorescence as a Real-Time Diagnostic Tool for Early Cholestasis Assessment. International Journal of Molecular Sciences. 2018; 19(9):2634. https://doi.org/10.3390/ijms19092634
Chicago/Turabian StyleCroce, Anna C., Giovanni Bottiroli, Laura G. Di Pasqua, Clarissa Berardo, Veronica Siciliano, Vittoria Rizzo, Mariapia Vairetti, and Andrea Ferrigno. 2018. "Serum and Hepatic Autofluorescence as a Real-Time Diagnostic Tool for Early Cholestasis Assessment" International Journal of Molecular Sciences 19, no. 9: 2634. https://doi.org/10.3390/ijms19092634