Chitosan Hydrogel Beads Supported with Ceria for Boron Removal


1
Department of Inorganic, Analytical Chemistry and Electrochemistry, Faculty of Chemistry, Silesian University of Technology, B. Krzywoustego 6, 44-100 Gliwice, Poland
2
Department of Physical Chemistry and Technology of Polymers, Faculty of Chemistry, Silesian University of Technology, ks. M. Strzody 9, 44-100 Gliwice, Poland
*
Author to whom correspondence should be addressed.
Int. J. Mol. Sci. 2019, 20(7), 1567; https://doi.org/10.3390/ijms20071567
Submission received: 28 February 2019
/
Revised: 22 March 2019
/
Accepted: 26 March 2019
/
Published: 28 March 2019
(This article belongs to the Special Issue Biobased and/or Biodegradable Polymeric Materials)
Abstract
:In this study, a chitosan hydrogel supported with ceria (labelled Ce-CTS) was prepared by an encapsulation technique and used for the efficient removal of excess B(III) from aqueous solutions. The functionalisation of chitosan with Ce(IV) and the improvement in the adsorptive behaviour of the hydrogel were determined by SEM-EDS, FTIR, XRD, and inductively coupled plasma optical emission spectrometer (ICP-OES) analyses and discussed. The results demonstrate that Ce-CTS removes boric acid from aqueous solutions more efficiently than either cerium dioxide hydrate or raw chitosan beads, the precursors of the Ce-CTS biosorbent. The maximum adsorption capacity of 13.5 ± 0.9 mg/g was achieved at pH 7 after 24 h. The equilibrium data of boron adsorption on Ce-CTS fitted the Freundlich isotherm model, while the kinetic data followed the Elovich pseudo-second-order model, which indicated that the process was non-homogeneous. The dominant mechanism of removal was the reaction between boric acid molecules and hydroxyl groups bound to the ceria chelated by chitosan active centres. Due to its high efficiency in removing boron, good regeneration capacity and convenient form, Ce-CTS may be considered a promising biosorbent in water purification.
1. Introduction
The concentration of boron in water is regulated in various countries throughout the world. In Poland and the rest of the European Union, the recommended level of boron in drinking and irrigation water and in wastewater discarded to the environment is 1.0 mg/dm3. This is because boron—a significant micronutrient for plants [1]—is harmful in excess. In humans, a high content of boron may lead to damage to the nervous system [2].
Various techniques have been used in the removal of boron species from water and wastewater, including adsorption, ion exchange, co-precipitation, ultrafiltration, reverse osmosis and electrodialysis. Among these techniques, adsorption has been found to be a superior technique due to its ease of design, operational simplicity and good efficiency with regard to the removal, not only of boron, but also other pollutants [3,4,5,6,7]. In the last two decades, numerous papers have presented results for the adsorption of B(III) using various materials, such as active carbons [8,9,10], zeolites [11,12], metal oxides [13,14], nanoparticles [15,16] and waste materials [17,18].
Chitosan (CTS), which contains functional hydroxyl (OH) and amino (NH2) groups, is one of the most abundant biopolymers. It is extracted by a deacetylation procedure from chitin. This polymer has shown a high adsorption potential for various aquatic pollutants in water treatment [19]. Various metal cations, oils and dyes are easily attracted by these groups, due to the chelating effect and electrostatic attraction [20,21,22]. Some typical anions, such as fluoride, nitrate and phosphate, may undergo fixation by electrostatic attraction or ion exchange in acidic media on protonated amine functions [23,24,25]. The electrostatic attraction mechanism has also been reported for the binding of a series of metals that form anionic complexes in acidic solutions, e.g., Cr(VI) and Mo(VI) [22]. Unfortunately, the adsorption of boron species onto chitosan is characterised by the biopolymer not having a high enough capacity [26]. This is because, in a low pH solution, B(III) mainly exists in the inert form of B(OH)3. Under such conditions, electrostatic attraction does not occur. At a higher pH, when borate anions are the dominant forms in the solution, chitosan is not protonated to yield ammonium ions (NH3+), and there is instead a repulsion between the negatively charged surface of chitosan and B(OH)4− ions. Therefore, many ways of functionalising chitosan in order to obtain greater applications have been reported [27]. Among them, rare earth metal-binding chitosan composites have attracted researchers’ attention because of their active properties and high adsorption capacity [21,28,29,30].
Cerium dioxide is one of the most abundant and cheapest rare earth oxides, possessing resistance to acids and bases and not eluting during the removal of harmful substances in water [29]. Cerium has a good chelating ability with the functional groups present in chitosan and can possess a high adsorption capacity because of its positive charge [21,30]. Biopolymers based on cerium(III) immobilised cross-linked chitosan (CTS-Ce) composites have been prepared and employed for the removal of fluoride and phosphate from water [28,29,31,32]. Additionally, a fibrous mat of chitosan/polyvinyl alcohol, containing cerium(III), was used for the removal of chromium(VI) from aqueous solutions [33].
Until now, boron has not been removed on such adsorbents based on chitosan and cerium ions, e.g., CTS-Ce, CTS/PVA-Ce, etc. Moreover, Ce4+ ions have never been previously used to modify chitosan; only Ce3+ salts have been used as an additive to a carrier in the above-cited papers. Therefore, a strategy of fabricating composites by immobilising cerium(IV) ions and chitosan is a novel and very promising concept. The objectives of this study are the following: (i) to synthesise the new composite (Ce-CTS) via a co-precipitation and coagulation method and to characterise its structure before and after adsorption using a Fourier-transform infrared (FTIR) spectrometer, scanning electron microscope (SEM) and X-ray diffractometer (XRD); (ii) to study the adsorption isotherms of B(III) on Ce-CTS composites in batch mode; (iii) to study the adsorption of boron on cerium dioxide hydrate; and (iv) to discuss the possible reasons and mechanisms for the adsorption of B on Ce-CTS composites.
2. Results and Discussions
2.1. Ce-CTS Composite Characteristics
The prepared composite of chitosan supported with Ce(IV) was in the form of light yellow– beige hydrogel beads with an average diameter of about 4 mm (Figure S1 in the Supplementary Materials), which, after drying and grinding, became a powder (<0.45 mm) composite and remained a pale yellow–beige colour.
Figure 1 shows the FTIR spectra of the unmodified chitosan (CTS) and the prepared chitosan composite beads filled with Ce(IV) particles (Ce-CTS). Characteristic peaks for chitosan show the amide (C=O) stretch at 1651 cm−1, the C–N stretch at 1594 cm−1, the bending due to N–H stretching and the absorptions due to C–H stretching at 2890 cm−1 and the C–H bending at 1381 cm−1. C–O–C antisymmetric stretching can be seen at 1152 cm−1, and the C–O skeletal stretch characteristic of polysaccharides is observed at 1034 cm−1. The inorganic filler, i.e., cerium dioxide particles, shows absorption bands at 523 cm−1 [34]. After adsorption, in the spectrum of the Ce-CTS-B beads, more intensive bands than for Ce-CTS can be observed at 3400 cm−1, 2900 cm−1 and 1069 cm−1, due to the interaction of the OH groups of CTS and Ce with boron.
The SEM images of the Ce-CTS composite before and after adsorption of boron are shown in Figure 2. Comparing the Ce-CTS and Ce-CTS-B beads, more open structures are observed in the Ce-CTS bead before boron adsorption. In addition, the SEM image shows a well-ordered honeycomb structure with pores in each layer. The large surface area provided by the porous structure of Ce-CTS beads exposes more available active sites during the adsorption process for the capture of boron. After adsorption, such open pores are not visible, and the whole structure becomes more compact and closed. The EDS measurement was carried out to confirm the elements in the composite. The EDS spectrum of the Ce-CTS composite shows the presence of C, N, O and Ce in the investigated sample, confirming the incorporation of Ce4+ ions into the chitosan matrix.
Figure 3 presents the XRD pattern of the unmodified CTS and the Ce-CTS composite before and after boron adsorption. The addition of cerium caused the chitosan to be enriched with the cerium-based compound. The particles of cerium were not well crystallised, or the nanoparticles had a very small size; thus, the identification of all of the peaks was not possible. However, on the XRD pattern, some of the broad peaks were registered, and their positions were at 28.73°, 33.03°, 48.04°, 56.16° and the broad bump between 74.53–82.23° 2Theta. The position of the peaks might indicate that ceramic oxide particles, CeO2, were formed (JCPDS card #89-8436). Similar results were presented in [35], where chitosan was modified by cerium compounds to obtain a bio-nanomaterial. The majority of the powder sample consisted of chitosan, which usually exhibits an amorphous phase; however, characteristic broad signals between 18 and 22° 2Theta, and a small 37–39° 2Theta signal were registered. No differences in the XRD patterns were observed between the Ce-CTS and Ce-CTS-B samples.
The content of cerium in the Ce-CTS composite hydrogel beads (after dissolving three dry samples in concentrated HNO3) was equal to 1.71 ± 0.20%. This confirmed once again the presence of cerium in the new composite material.
2.2. The Possible Mechanism of Ce-CTS Composite Formation
Cerium is the only lanthanide that forms stable solids in the IV oxidation state. In an aqueous solution, it is in the form of a hydrate [Ce(H2O)n]4+ (n >6). In this study, cerium(IV) nitrate was used as a precursor of the Ce-CTS composite. Ce(NO3)4 is a substance that is soluble in water but undergoes hydrolysis and then precipitation according to the following equations [36]:
[Ce(H2O)n]4+ + 4 H2O → [Ce(OH)4(H2O)n−4] + 4 H3O+
[Ce(OH)4(H2O)n−4] + 4 H3O+ → CeO2·nH2O + 4 H2O
The hydrated cerium(IV) oxide ion is a yellow gelatinous precipitate, which is readily soluble in acids while being insoluble in excess base; it has a very well-developed surface and probably has good adsorption properties [36]. During the gelation process of the chitosan beads, cerium ions, in the presence of the hydroxyl groups introduced into the solution with NaOH, form the CeO2 hydrate while the reactive functional groups in chitosan, -NH2 and -OH, having free electron pairs, are coordinated by the Ce4+ ions [37]. In this study, the presence of peaks corresponding to the crystalline structure of CeO2 in resulting Ce-CTS was confirmed by XRD analysis. A similar result was obtained by Hu et al. [32] and Zhang et al. [38]. A monocomplex is probably formed between Ce and CTS (in a ratio of 1:1), as shown in Scheme 1, although a dichelate complex (1:2) could not be ruled out, as reported by Elanchezhiyan et al. [37]. The formation of a cerium mono or dichelate complex results in chitosan surface modification. The presence of additional OH groups promotes the chemical adsorption of boron.
2.3. pH Study and the Mechanism of B Adsorption
pH is an important parameter that should be considered when studying boron adsorption from aqueous solutions. This parameter determines the number of anionic species (B(OH)4−) and boric acid molecules (B(OH)3) present in the solutions that are in the equilibrium described by the equation below and the equilibrium constant Ka:
B(OH)3 + H2O ↔ B(OH)4− + H+ pKa = 9.2
Figure 4 shows how the adsorption of boron on freshly precipitated cerium(IV) oxide (graph 1), on chitosan modified with cerium(IV) (graph 2) and on unmodified CTS (graph 3) changed with the pH of the solution. When the pH increased from 5 to 7, boron removal by the Ce-CTS beads increased very slightly to reach the maximum adsorption of 8.42 ± 0.61 mg/g(Ce) (calculated per 1 g of Ce) at pH 7.0. At a pH < 7, the adsorption of boron on CeO2·nH2O in situ was very low in contrast to the adsorption on CTS, which was the highest in low pHs. At a pH higher than 7, less boron adsorption on Ce-CTS was observed, while on CeO2·nH2O slowly increasing adsorption was noted (Figure 4). The maximum boron adsorption on hydrated cerium dioxide, at a value of qexpt = 8.20 ± 0.16 mg/g(Ce), was reached at a pH of 10. The adsorption was only slightly decreased with a further increase in pH. On the other hand, when the pH was 10 and higher, rather low adsorption capacity of Ce-CTS was observed, which might have been due to the excess concentration of hydroxyl groups, which compete with borate anions in the alkaline solution [39]. The most beneficial adsorption effect was obtained at a pH of 10 and a pH of 7 for the process carried out on CeO2·nH2O and Ce-CTS, respectively. Furthermore, the adsorption on Ce-CTS depended on the content of Ce in the hydrogel. The capacity increased when the weight ratio of Ce to CTS increased from 1:12 to 1:4 (2, 2′ and 2” graphs in Figure 4). Adsorption on the unmodified CTS was very low and was only 1.1 mg/g at acidic pH (graph 3). This means a different adsorption mechanism occurs in these cases.
A mechanism of boron adsorption strongly depends on pH solution [39,40]. In the case of the unmodified CTS, when pH is below the pKa value of chitosan (6.3–6.8), amine groups are protonated and act as the sites of formation of a complex with boric acid present in low pH. At a pH >6.8, adsorption on CTS occurs through the molecular attraction of H3BO3 through a hydrogen bond with an amine or hydroxyl groups of chitosan [40]. The adsorption of the B(OH)4− anion on the hydrated CeO2·nH2O is presumably the result of electrostatic attraction between the positively charged surface of the oxide and the negative boron ion. In the case of adsorption on Ce-CTS, the adsorbent–adsorbate interaction can be explained as follows: because the maximum boron adsorption on Ce-CTS was observed at a pH of ca. 7 when the percentage of boric acid as a neutral monomolecule was more than 99% in the solution, it can be assumed that the Coulomb attraction was very weak or did not occur at all. The dominant mechanism of adsorption at neutral and acidic pH would be the reaction between the boric acid molecule and hydroxyl groups bound to the cerium chelated by chitosan active centres (Scheme 2A). At a pH >8 the amount of boron anionic species increases in the solutions, which results in the possibility of the reaction shown in Scheme 2B.
2.4. Isotherm Models
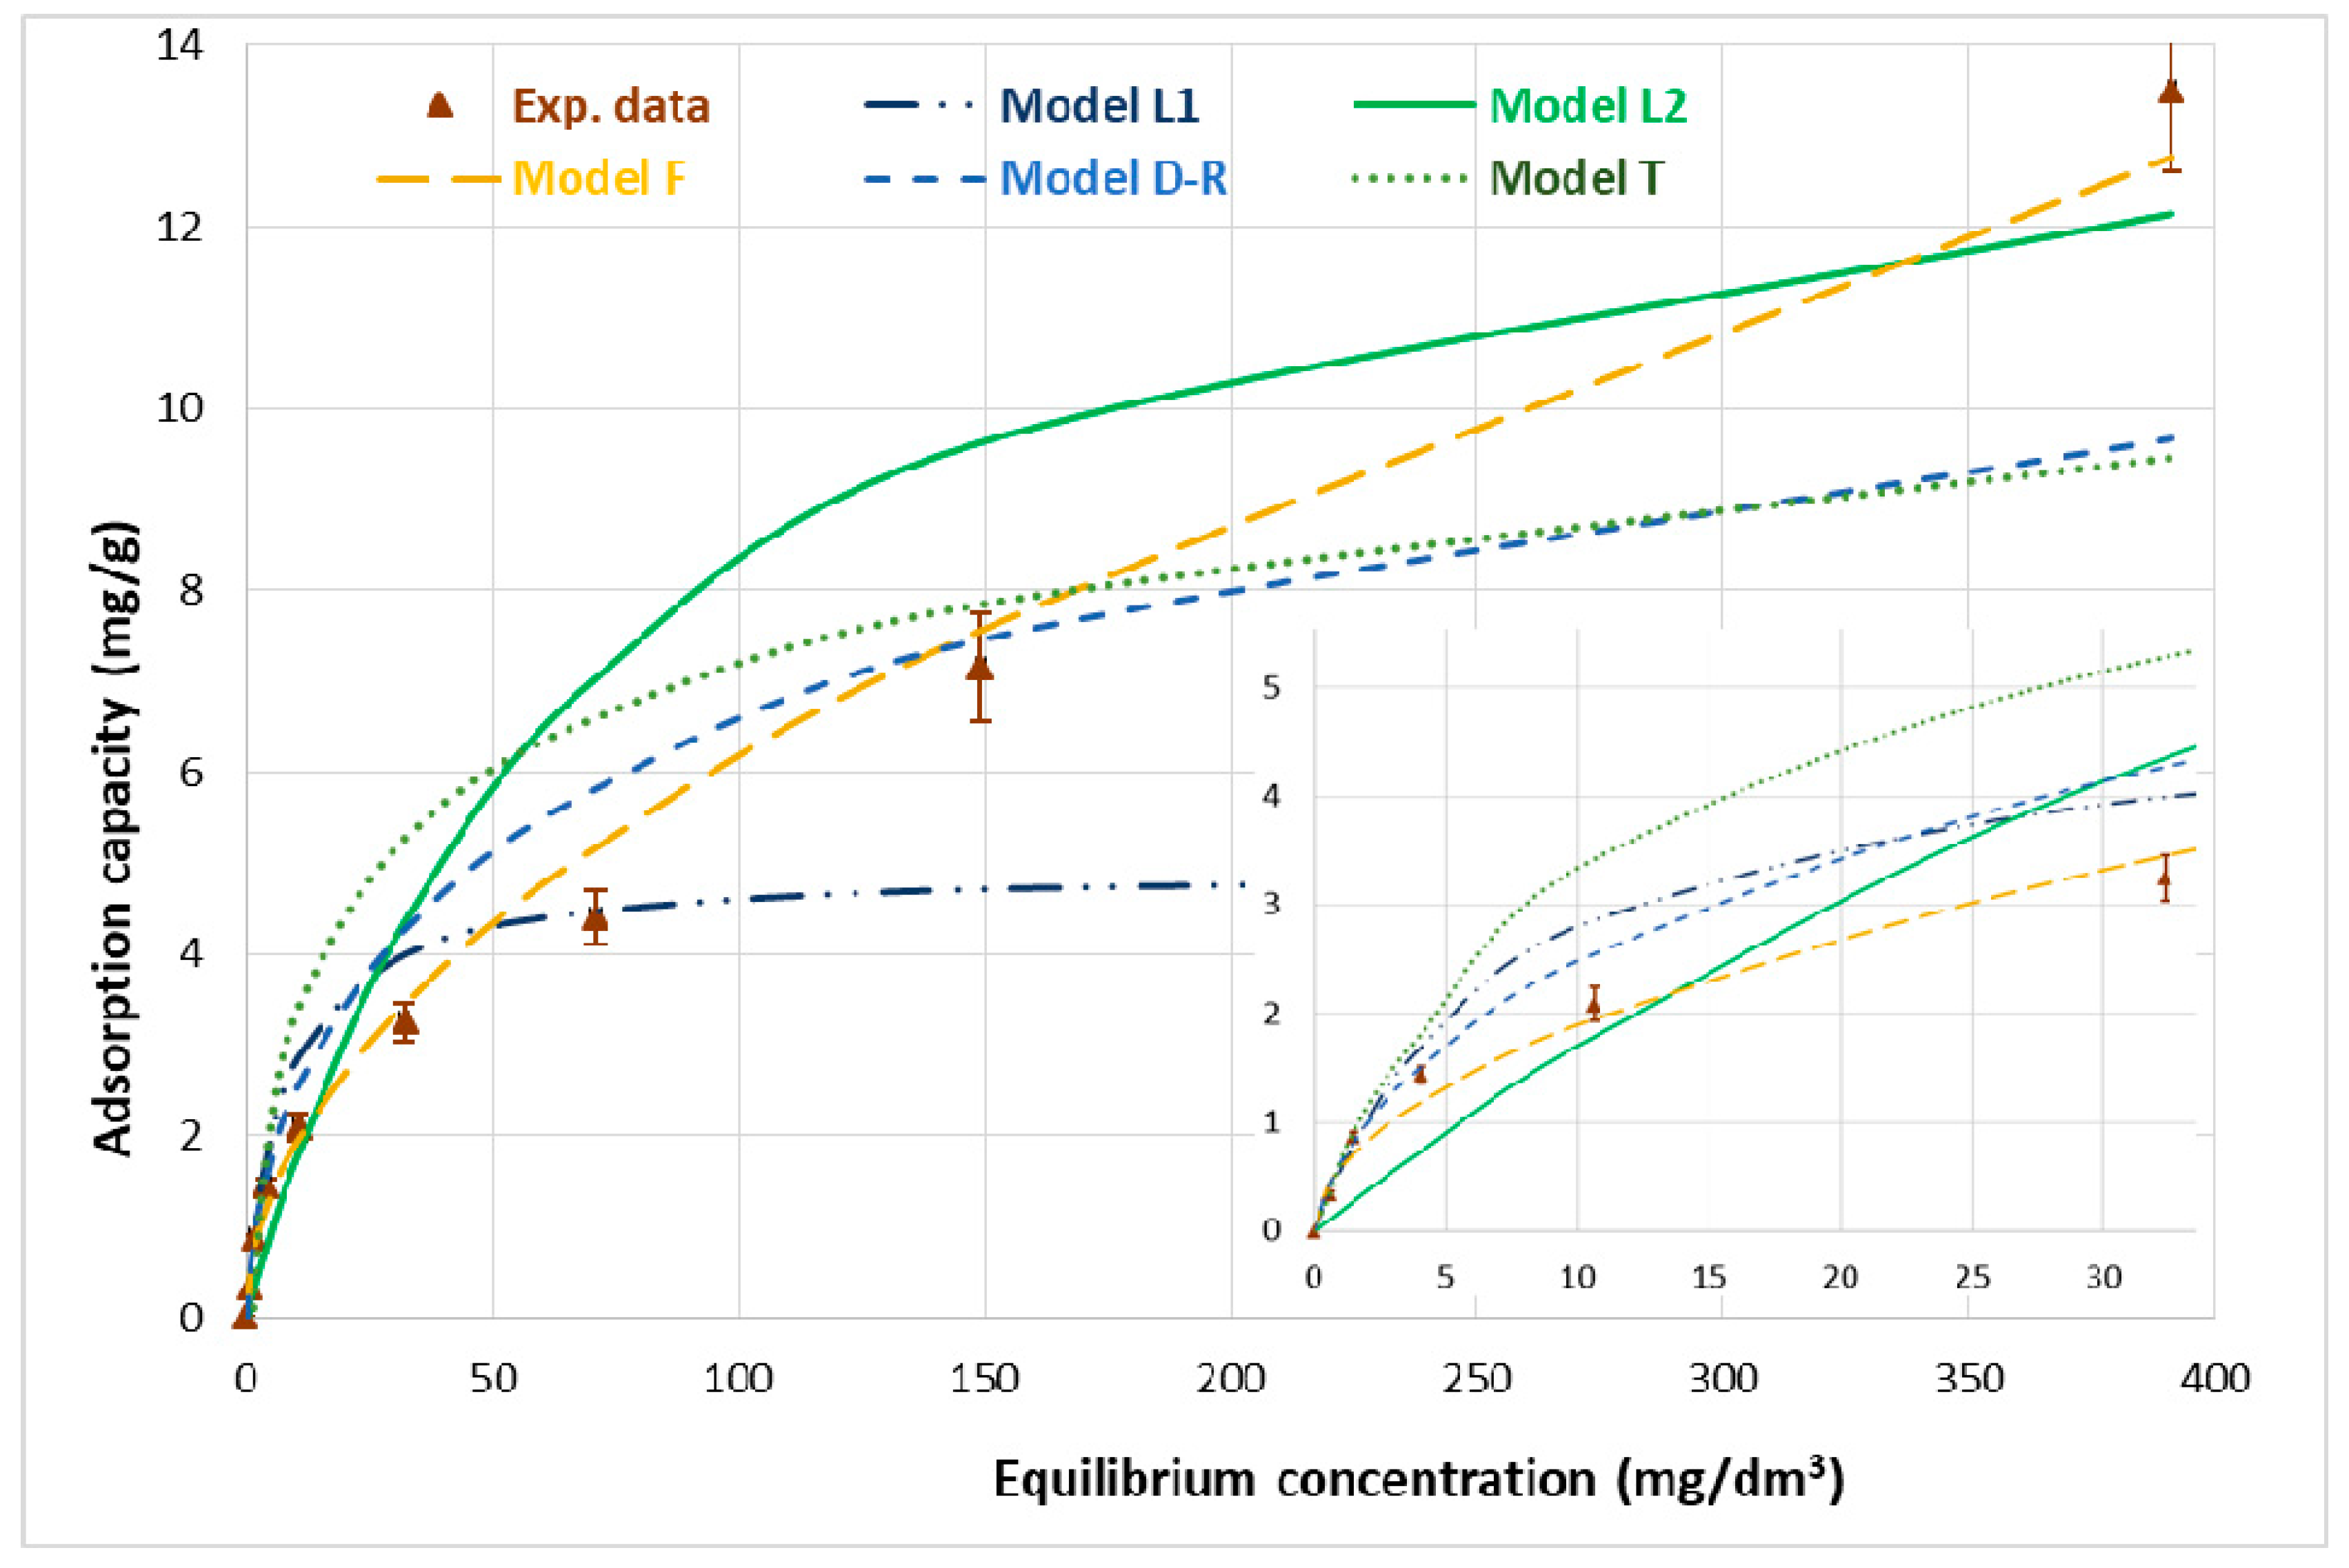
Figure 5 shows the adsorption isotherm of boron on the Ce-CTS composite hydrogel beads and the fitting of the Langmuir, Freundlich, Dubinin–Radushkevich and Temkin adsorption models [41,42] onto the experimental data. The experimental adsorption capacity, qexpt, was 13.5 ± 0.9 mg/g at 20 °C, with a contact time of 24 h and an initial boron concentration of 500 mg/dm3. Furthermore, the content of boron in the thermally dried Ce-CTS composite (after dissolving three samples in concentrated HNO3) was equal to 13.0 ± 0.3 mg/g, which confirmed the experimental adsorption capacity given above calculated according to Equation (11) (Section 3.4).
The adsorption capacity of the chitosan hydrogel beads towards boron was higher than that of the majority of chitosan adsorbents reported so far [3,15] or at least comparable to them [43,44]. The details are summarised in Table 1. Furthermore, it was found that Ce-CTS was a better biosorbent than the gelatinous precipitate of hydrated cerium dioxide. CeO2 had a boron adsorption capacity equal to 8.20 mg/g(Ce), while Ce-CTS was 8.42 mg/g(Ce) starting from the same initial boron concentration of 20 mg/dm3, as mentioned in Section 2.3. Additionally, the fine and difficult-to-separate precipitate of hydrated cerium dioxide has great disadvantages in water treatment technology, in contrast to the form of the hydrogel beads of the Ce-CTS composite proposed in this study. It should also be emphasised that boron is removed in high efficiency over a wide pH range, which makes Ce-CTS competitive with boron selective resins, e.g., Amberlite IRA 743, Purolite S 108 (see Table 1).
To assess the maximum adsorption capacity and to determine the mechanism of adsorption, two-parameter models of isotherms describing experimental data were used: the Langmuir, Freundlich, Dubinin–Radushkevich and Temkin equations [41,42]. The most developed equations used to describe adsorption equilibria are mainly the Langmuir and Freundlich models. The Langmuir (L) model assumes that adsorption occurs on surface sites on each of which the energy is equal, while the Freundlich (F) model allows for several kinds of adsorption sites in the solid, each having a different energy of adsorption. The Dubinin–Radushkevich (D–R) isotherm is a local isotherm often used to describe adsorption, explaining the equilibrium of adsorption by the theory of volume filling of adsorbent micropores. The Temkin (T) isotherm describes monolayer adsorption on a heterogeneous surface, assuming that the heat of adsorption of all the molecules in the layer decreases linearly due to the adsorbent–adsorbate interaction, and the adsorption is characterised by an even distribution of binding energy.
The results of the boron adsorption modelling are presented in Table 2. The adsorption models used in this study and their equations in linear and nonlinear forms are presented in the Supplementary Materials (Table S1). The coefficients of the models were determined by linear regression. The degree of fit of the linear equations to the experimental points was assessed on the basis of the coefficient of determination, R2:
where qexpt is an experimental adsorption capacity and qcalc is a calculated adsorption capacity. The determined linear regression parameters were introduced into the model equations and the fit was rated using the mean error, ARE:
As presented in Table S1 and Table 2, qm and B are the L parameters, qm is the adsorptive capacity (mg/g) expressed as the maximum amount of boron that can be adsorbed by the adsorbent as a monolayer, and B is an equilibrium constant that corresponds to the adsorption energy (dm3/mg). The parameters KF (mg/g) and n resulting from the F model correspond to the relative adsorptive capacity and the adsorption intensity of the adsorbent, respectively. The essential characteristics of a Langmuir isotherm can be expressed in terms of a dimensionless constant separation factor, RL, which is defined by Equation (6):
where C is final boron concentration in the solution (mg/dm3). According to Hall et al. [50], the parameter RL indicates the shape of the isotherm in the following manner: RL > 1, unfavourable; RL = 1, linear; 0 < RL < 1, favourable; and RL = 0, irreversible. Similarly, the fitness of using the F equation to describe the adsorption can be assessed by the constant n. If 1 < n <10, then the F equation is adequate for use [45].
In the D–R equation given in Table S1, ε is a Polanyi potential, which equals RTln(1+1/c), where R is a gas constant (kJ/(mol K)) and T is a temperature (K) while the xm parameter is the adsorption capacity (mol/g) and the k parameter is a constant related to the adsorption energy (mol2/kJ2). The adsorption energy, E, (the energy required to transfer 1 mol of adsorbate species to the surface of the adsorbent from infinity in the bulk of the solution) is obtained from the following Equation (7):
The parameters bT (kJ/mol) and AT (dm3/mg), calculated from the T model, correspond to the adsorption energy change and the adsorption equilibrium constant, respectively. If the energy of adsorption is less than 20 kJ/mol, the adsorption is physical in nature due to weak van der Waals forces. The energy for chemisorption lies in the range 40–800 kJ/mol [45].
As can be seen in Table 2, the L model gave the best fit to the experimental data of boron adsorption on the Ce-CTS composite, because it had the highest correlation coefficient, 0.9897. The dimensionless constant separation factor, RL, in the range of <0.795 and >0.015 for initial boron concentrations of 2–500 mg/dm3, indicated a favourable adsorption. Unfortunately, the value of parameter qm, very different from the experimental capacity, qexp, indicated the impossibility of the full interpretation of the process by the Langmuir model. The smallest mean error, 13.2%, was obtained by fitting the F model simultaneously with a rather high correlation coefficient, R2 = 0.9810. As can be seen in Table 2, the KF parameters amounted to 0.584 mg/g, while the parameter n was 1.95, which meant that the F model was adequate for describing the discussed process. A slightly worse fit was obtained for the D–R model: the correlation coefficient was 0.9097, while the mean error was 26.7%. Although the D–R model was less suitable than the F model, the calculated value Xm (14.4 mg/g) was in a good agreement with the experimental qexpt, 13.5 ± 0.9 mg/g. The worst fit was obtained for the T model, which was inadequate for describing boron adsorption on Ce-CTS.
Generally, the Freundlich equation fits the experimental data because of its high correlation coefficients and relatively low mean error. The better conformity of the Freundlich model over the other isotherm models for boron adsorption was noted on freeze-dried chitosan beads [26], freeze-dried chitosan functionalised with N-methylglucamine [46] and cobalt(II)-doped chitosan hydrogel [51]. The F model usually corresponds to multilayer adsorption with non-uniform distribution of adsorption heat and affinities over the heterogeneous surface. The values of parameters, kf below 1 and n above 1, indicate high adsorption intensity and the chemisorption nature of the process [52].
2.5. Kinetic Models
The effect of contact time, t, on boron adsorption is shown in Figure 6. Equilibrium was reached after 24 h, independently of the initial boron concentration. Four kinetic models: the Lagergren pseudo-first-order, the Elovich pseudo-second-order, the parabolic diffusion and the combination of both the chemical reaction and the intraparticle diffusion models were tested [53,54,55]. The kinetic model equations in linear and nonlinear forms are presented in the Supplementary Materials (Table S2). The coefficients of the models were determined by linear regression.
Moreover, the constant k2 was used to calculate the initial adsorption rate, r, at t = 0, defined by Equation (8):
In Table 3, the resulting parameters and the correlation coefficients R2 of the kinetic models for various initial boron concentrations are listed. The calculated values of R2 for the pseudo-first-order and the intraparticle diffusion kinetic equations were low, indicating that the Elovich and Weber and Morris models were not applicable to the discussed process. However, in the high initial boron concentration, good agreement was obtained when the model of pseudo-first order reaction was used. The description by the pseudo-second-order reaction model gave very good correlations with the experimental data. For the pseudo-second-order rate kinetic model, the coefficients R2 were in the range of >0.9995 and <0.9997. The calculated values of qe agreed with the experimental adsorption capacities, qexpt, while the initial adsorption rate, r, increased when the initial boron concentration increased. Unfortunately, the chemical rate constants for the second-order reaction were the function of initial concentrations of the boron solution—they decreased 237 times with an increase of the concentration from 20 to 2000 mg/dm3. Hence, on the basis of the reaction models, it was difficult to draw a clear conclusion on the mechanism that governed the adsorption rate. To describe this process, a model combining the chemical reaction with intraparticle diffusion was proposed [55]. The results indicate that the combined model was more appropriate to describe boron adsorption on the solid surface of the Ce-CTS composite. A parameter k4 called the surface process constant by Modrzejewska et al. [55] was used to describe sorption of copper by chitosan hydrogel; it was independent of the concentration. In Table 3, the resulting rate constants for the combined model insignificantly decreased with an increase in the concentration from 20 to 2000 mg/dm3. Hence, it was assumed that the process of diffusion inside the granule structure was proceeded by irreversible adsorption on the inner granule walls.
2.6. The Stability of the Ce-CTS and Desorption Tests
The stability of the composite, and, in particular, the bond strength between cerium and chitosan, is an important factor for qualifying the proposed biosorbent for use in purifying water or wastewater. In this study, the degree of elution of cerium from the composite was tested under the conditions of the adsorption and desorption process.
The effect of contact time and initial boron concentration on the elution of cerium ions from the Ce-CTS composite beads during the adsorption at a pH of 7 is shown in Figure 7. The graph shows that Ce(IV) ions did not elute from the composite, even after 3 days of contact time with the adsorptive, when the initial concentration of boron was up to 500 mg/dm3. The percentage of the cerium in the Ce-CTS before and after adsorption indicated that there were no changes in the content of cerium in the biosorbent. However, when the initial concentration of boron in solution increased, the elution of cerium ions also slightly increased. The elution of the cerium(IV) in the concentration range from 0.5 to 2.5 mg/dm3 was noticeable only when the initial boron concentration was 1000 mg/dm3 or greater, and when the contact time was elongated to 3 days. As can be seen in Figure 7, the increase in the cerium concentration in the eluate was accompanied by a reduction in the cerium content in the composite, which varied from 1.55 to 0.97, while the boron concentration increased from 500 to 5000 mg/dm3 and the contact time was 72 h. Because the optimal adsorption time was set to 24 h (see Figure 6), and after this time no leaching of the cerium from the composite was found, it was concluded that the proposed biosorbent was stable under the conditions of the adsorption process.
Next, the possibility of desorbing the boron from the composite without the loss of cerium in the composite was considered. The percentage of boron desorption, D (%), was calculated from the experimental data using the following equation:
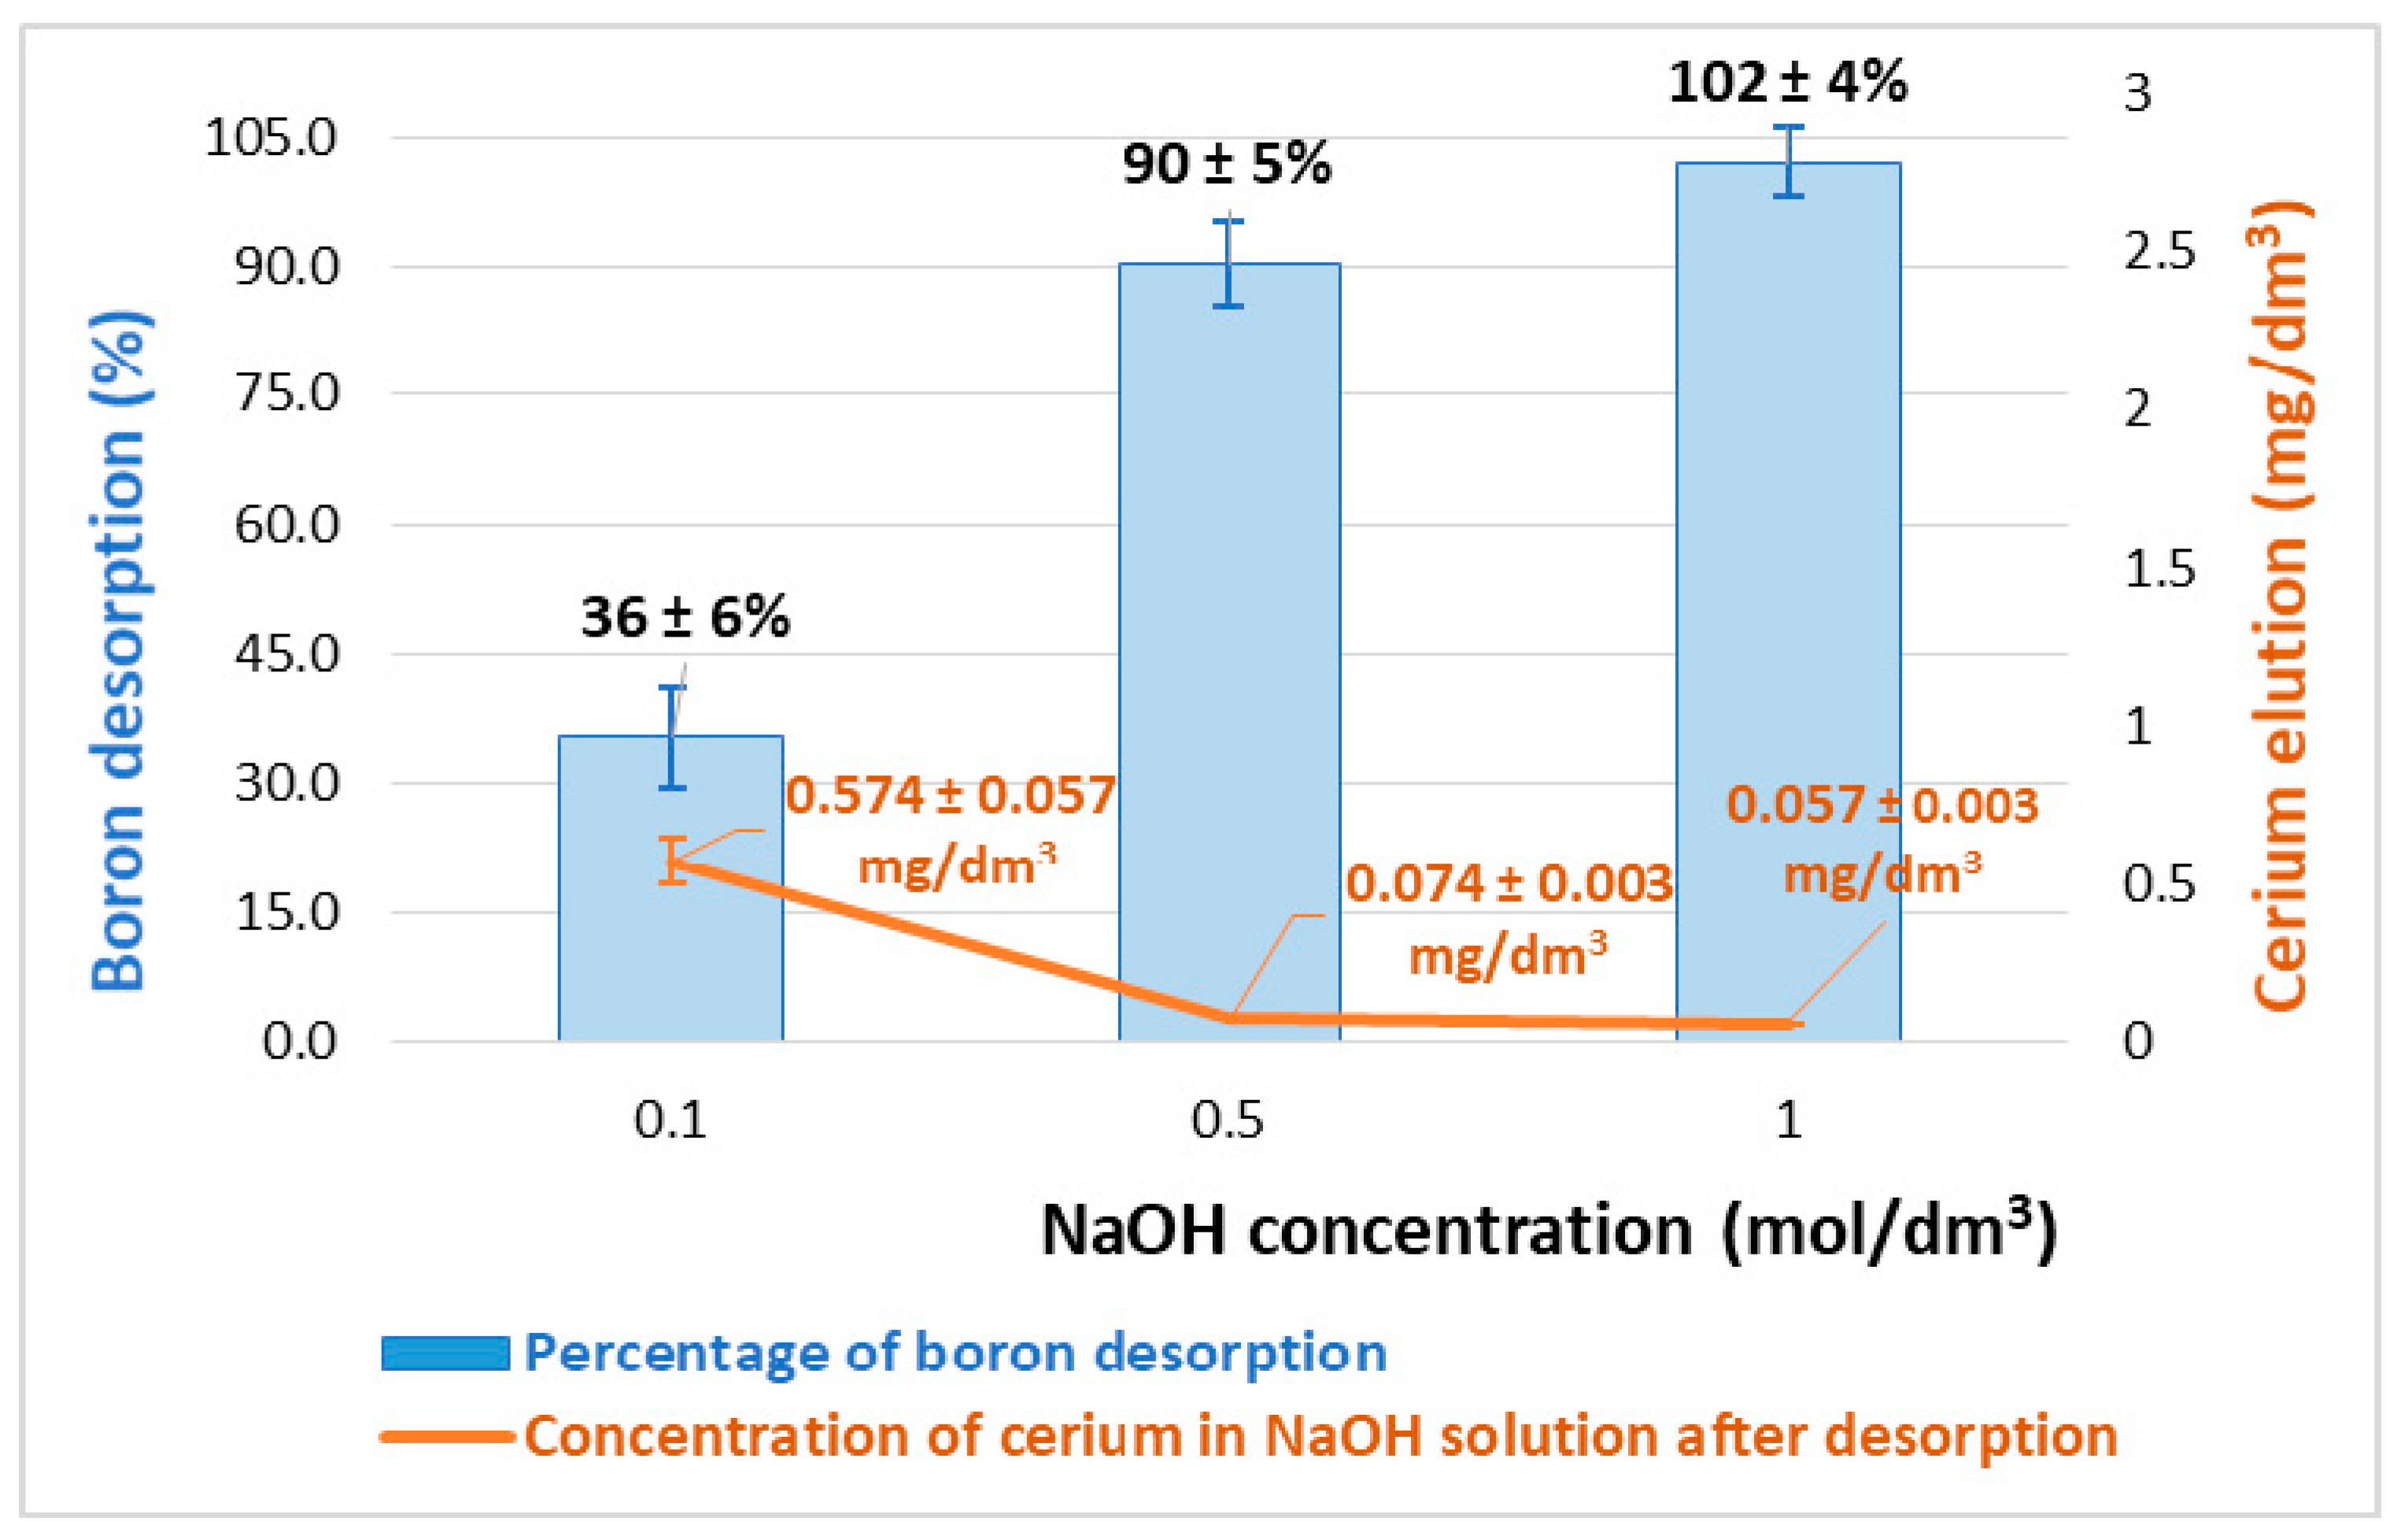
where qD is the amount of desorbed boron per biosorbent mass (mg/g). Examining the effect of pH (Figure 4), the adsorption capacity of B(III) on Ce-CTS was relatively low under alkaline conditions. Furthermore, it is known that CeO2 is insoluble in excess base. Therefore, the B desorption process was carried out using various concentrations of sodium hydroxide solution. The effect of the regenerant concentration on boron desorption and on cerium elution can be seen in Figure 8. Total boron desorption was obtained with 1 M NaOH solution. No Ce was found in the regenerative solution after desorption. The obtained results indicate that the Ce-CTS composite can be effectively regenerated and reused in the next adsorption cycle.
3. Materials and Methods
3.1. Reagents
All the reagents employed in the study were of analytical reagent grade. A basic standard solution of boron in the form of boric acid (1 g/dm3) and cerium standard solutions of 1 g/dm3 were supplied by Merck. Water was purified by a Millipore Elix 10 system. Chitosan (molecular weight 600,000–800,000) was purchased from Acros Organics (Geel, Belgium); its degree of deacetylation, as determined by means of an H1 NMR method, was equal to 97%. Cerium nitrate, Ce(NO3)4·6H2O, was supplied by Loba Feinchemie GmbH (Fischamend, Austria). Sodium hydroxide, hydrochloric acid and glacial acetic acid were purchased from Avantor Performance Materials Poland S.A., Gliwice, Poland.
3.2. Analytical Procedures and Apparatus
Boron and cerium were determined using inductively coupled plasma optical emission spectroscopy (ICP-OES) with a Varian 710-ES spectrometer (Varian, Mulgrave, Victoria, Australia). The following parameters were used: radio frequency (RF) power 1.0 kW, plasma flow 15 dm3/min, auxiliary flow 1.5 dm3/min, nebuliser pressure 200 kPa, pump rate 15 rpm and emission lines: λ = 208.956, λ = 249.678 and λ = 249.772 nm (for boron) and λ = 407.347, λ = 407.570, λ = 418.659 and λ = 446.021 nm (for cerium). Calibration curves were prepared using standard solutions in the ranges of 0.1–1.5 mg/dm3 and 0.1–5 mg/dm3 for boron and cerium, respectively. The changes in the chitosan structure were determined by a Fourier-transform infrared (FTIR) Spectrum Two spectrometer (Perkin Elmer, Waltham, MA, USA). The scanning electron microscope (SEM) micrographs of the chitosan bio-composite were produced using a Phenom ProX SEM (Phenom-World Bv, Eindhoven, The Netherlands). The phase compositions of the chitosan-based samples were determined using a Seifert 3003TT powder X-ray diffractometer with a Cu X-ray tube: kλ1 = 1.540598 Å, kλ2 = 1.544426 Å and kβ = 1.39225 Å (Seifert, Ahrensburg, Germany). Powder samples were analysed three times, and the XRD patterns presented in the manuscript were an average of the scans between 10 and 90° 2Theta.
3.3. Ce-CTS Composite Preparation
The procedure described previously [46] was adopted to prepare cerium–chitosan hydrogel beads. Briefly, a chitosan solution was prepared by dissolving 3 g of chitosan in 75 cm3 of 1 wt.% acetic acid solution. Next, 2.65 g, 1.56 g or 0.76 g of Ce(NO3)4·6H2O (the precursor of the oxide/hydroxide CeO2/Ce(OH)4) was added to the chitosan solution and sonicated for 30 min to obtain a well-dispersed, homogenous solution. The chitosan-precursor solution was added dropwise, using a thin needle (internal diameter 0.9 mm), into a stirred 20 wt.% aqueous NaOH solution. This resulted in immediate coagulation and the formation of beads. The newly formed chitosan beads (with different weight ratios of Ce to CTS: 1:4; 1:6 and 1:12) were then filtered and washed with demineralised water to remove traces of gelling solution. A portion of the chitosan beads was dried at 70 °С for 12 h to remove the water from the pore structure. The total content of cerium in the composite was determined by the ICP-OES method after dissolving the thermally dried chitosan beads in concentrated HNO3. The dry beads were powdered in an agate mortar and sieved to a constant size of <0.45 mm. The averaged Ce-CTS powder (weight ratio of Ce to CTS equal to 1:4) was analysed by FTIR and XRD.
3.4. Adsorption and Desorption Procedure
The experiments were carried out with 1 g of composite hydrogel beads and 0.01 or 0.02 dm3 of boron solution at a concentration range of 0–5000 mg/dm3. The experiments were carried out at a pH range of 5–10 and a temperature of 20 °C for 1–72 h in a 100 cm3 conical flask with a ground polyurethane (PU) joint. The boron solution and composite hydrogel beads were shaken at a mixing rate of 60 rpm in a mechanical shaker. At the end of the experiment, the residual solution was analysed for boron and cerium concentration by the ICP-OES method. Each adsorption experiment was repeated three times to obtain an average value. The content of adsorbed boron was also determined by the ICP-OES method after dissolving the composite samples in concentrated HNO3.
The boron adsorption coefficients (the removal efficiency, R (%), and the adsorption capacity, qexpt (mg/g)) were calculated from the experimental data in each sample using the following equations:
where C0 and C are the initial and final concentrations of boron in the solution (mg/dm3), respectively, V0 is the volume of adsorptive (dm3) and m is the dry mass of the composite or the equivalent mass of cerium (g).
The desorption of boron from the composite was examined as follows: 1.0 g of boron-saturated composite hydrogel beads and 20 cm3 of sodium hydroxide solution at concentrations of 0.1, 0.5 or 1.0 mol/dm3 were mixed for 24 h at room temperature. The boron and cerium concentrations were determined by taking aliquots. The concentrations given were the means of three experimental results.
The behaviour of boron and cerium species present together in the solution at increasing pH was examined. For this purpose, a solution containing Ce(IV) at a concentration of 2000 mg/dm3 and B(III) at a concentration of 20 mg/dm3 was made. The pH of the solution was adjusted to a value of 2 by using 0.1 M HCl. Then, 0.4 cm3 of the solution was used for the analysis of boron and cerium by the ICP-OES method. Next, 0.1 or 2 M NaOH solution was added to increase the pH by one unit, and 0.4 cm3 of the solution was again taken for the analysis of the boron and cerium concentration. The procedure was continued until the pH reached a value of 12.
4. Conclusions
A low-cost, non-toxic, biodegradable Ce-CTS composite hydrogel was prepared by an encapsulation technique for the efficient removal of B(III) from aqueous solutions. Ce-CTS possesses higher adsorption capacity than cerium dioxide hydrate (CeO2·nH2O) and chitosan hydrogel beads, the precursors of the new biosorbent. It was stable under the conditions of the adsorption–desorption processes. Its high adsorption capacity and convenient form, beads, guarantees its efficiency and ease of application in water purification.
Boron removal by the Ce-CTS biosorbent was dependent on the pH of the solution, being most favourable at a pH of 7. The equilibrium data for boron adsorption on Ce-CTS fitted the Freundlich isotherm model, which indicated that the process was non-homogeneous and chemical in nature. The maximum adsorption was achieved after 24 h and followed the kinetic model combining the chemical reaction with intraparticle diffusion.
The functionalisation of chitosan with Ce(IV) to improve the adsorptive behaviour of hydrogel beads was observed. SEM-EDS, FTIR, XRD and ICP-OES analyses confirmed the formation of a chelate complex between the Ce4+ ion and active groups on the chitosan surface. The dominant mechanism of removal was the reaction between the boric acid molecule or borate anion and hydroxyl groups bound to the cerium chelated by chitosan active centres. Considering the abovementioned factors, the proposed Ce-CTS composite beads could be a potential alternative for the effective removal of boron(III) from contaminated water.
Supplementary Materials
Supplementary materials can be found at https://www.mdpi.com/1422-0067/20/7/1567/s1.
Author Contributions
Conceptualisation, J.K.; methodology, J.K.; software, J.K., G.D., A.K.-K. and M.G.; validation, J.K.; formal analysis, J.K., G.D., A.K.-K. and M.G.; investigation, J.K.; resources, J.K. and G.D.; data curation, J.K., G.D., A.K.-K. and M.G.; original draft preparation, J.K.; review and editing, J.K.; visualisation, J.K.; supervision, J.K.; project administration, J.K.; and funding acquisition, J.K.
Funding
The APC was funded by the Rector’s Habilitation Grant. Silesian University of Technology, RGH grant number 04/010/RGH18/0087.
Conflicts of Interest
The authors declare no conflict of interest.
Abbreviations
| CTS | Unmodified chitosan |
| Ce-CTS | Chitosan composite supported with Ce(IV) |
| Ce-CTS-B | Chitosan composite supported with Ce(IV) after boron adsorption |
| FTIR | Fourier-transform infrared spectrometer |
| SEM-EDS | Scanning electron microscope with energy dispersive spectrometer |
| XRD | X-ray diffractometer |
| ICP-OES | Inductively coupled plasma optical emission spectrometer |
| L model | Langmuir model |
| F model | Freundlich model |
| T model | Temkin model |
References
- Shireen, F.; Nawaz, M.A.; Chen, C.; Zhang, Q.; Zheng, Z.; Sohail, H.; Sun, J.; Cao, H.; Huang, Y.; Bie, Z. Boron: Functions and Approaches to Enhance Its Availability in Plants for Sustainable Agriculture. Int. J. Mol. Sci. 2018, 19, 1856. [Google Scholar] [CrossRef] [PubMed]
- Bobrowska-Grzesik, E.; Ciba, J.; Grossman, A.; Kluczka, J.; Trojanowska, J.; Zołotajkin, M. Chemical Elements. Compendium; 2 Theta: Cesky Tesin, Czech Republic, 2013. [Google Scholar]
- Guan, Z.; Lv, J.; Bai, P.; Guo, X. Boron removal from aqueous solutions by adsorption—A review. Desalination 2016, 383, 29–37. [Google Scholar] [CrossRef]
- Shang, X.; Jiang, H.; Wang, Q.; Liu, P.; Xie, F. Cellulose-starch Hybrid Films Plasticized by Aqueous ZnCl2 Solution. Int. J. Mol. Sci. 2019, 20, 474. [Google Scholar] [CrossRef]
- Jakobik-Kolon, A.; Mitko, K.; Bok-Badura, J. Zinc Sorption Studies on Pectin-Based Biosorbents. Materials 2017, 10, 84. [Google Scholar] [CrossRef]
- Kluczka, J. Reactive Polymers in Mercury Removal from Electrolytic Brine. Sep. Sci. Technol. 2009, 44, 3698–3716. [Google Scholar] [CrossRef]
- Smolik, M.; Zolotajkin, M.; Kluczka, J. Distribution of trace amounts of impurities during manganese(II) sulfate crystallization at 20-degrees-c and 2-degrees-c. Pol. J. Chem. 1995, 69, 1322–1327. [Google Scholar]
- Celik, Z.; Can, B.; Kocakerim, M. Boron removal from aqueous solutions by activated carbon impregnated with salicylic acid. J. Hazard. Mater. 2008, 152, 415–422. [Google Scholar] [CrossRef] [PubMed]
- Halim, A.; Roslan, N.; Yaacub, N.; Latif, M. Boron Removal from Aqueous Solution Using Curcumin-impregnated Activated Carbon. Sains Malays. 2013, 42, 1293–1300. [Google Scholar]
- Zohdi, N.; Mahdavi, F.; Abdullah, L.; Choong, T. Removal of boron from aqueous solution using magnetic carbon nanotube improved with tartaric acid. J. Environ. Health Sci. Eng. 2014, 12. [Google Scholar] [CrossRef]
- Karahan, S.; Yurdakoc, M.; Seki, Y.; Yurdakoc, K. Removal of boron from aqueous solution by clays and modified clays. J. Colloid Interface Sci. 2006, 293, 36–42. [Google Scholar] [CrossRef] [PubMed]
- Kluczka, J.; Trojanowska, J.; Zolotajkin, M. Utilization of fly ash zeolite for boron removal from aqueous solution. Desalin. Water Treat. 2015, 54, 1839–1849. [Google Scholar] [CrossRef]
- Demetriou, A.; Pashalidis, I.; Nicolaides, A.; Kumke, M. Surface mechanism of the boron adsorption on alumina in aqueous solutions. Desalin. Water Treat. 2013, 51, 6130–6136. [Google Scholar] [CrossRef]
- Kluczka, J. Boron Removal from Aqueous Solutions using an Amorphous Zirconium Dioxide. Int. J. Environ. Res. 2015, 9, 711–720. [Google Scholar]
- Kluczka, J.; Gnus, M.; Dudek, G.; Turczyn, R. Removal of boron from aqueous solution by composite chitosan beads. Sep. Sci. Technol. 2017, 52, 1559–1571. [Google Scholar] [CrossRef]
- Zelmanov, G.; Semiat, R. Boron removal from water and its recovery using iron (Fe+3) oxide/hydroxide-based nanoparticles (NanoFe) and NanoFe-impregnated granular activated carbon as adsorbent. Desalination 2014, 333, 107–117. [Google Scholar] [CrossRef]
- Yuksel, S.; Yurum, Y. Removal of Boron from Aqueous Solutions by Adsorption Using Fly Ash, Zeolite, and Demineralized Lignite. Sep. Sci. Technol. 2010, 45, 105–115. [Google Scholar] [CrossRef]
- Al-Ghouti, M.; Salih, N. Application of eggshell wastes for boron remediation from water. J. Mol. Liq. 2018, 256, 599–610. [Google Scholar] [CrossRef]
- Elwakeel, K. Environmental Application of Chitosan Resins for the Treatment of Water and Wastewater: A Review. J. Dispers. Sci. Technol. 2010, 31, 273–288. [Google Scholar] [CrossRef]
- Pestov, A.; Bratskaya, S. Chitosan and Its Derivatives as Highly Efficient Polymer Ligands. Molecules 2016, 21, 330. [Google Scholar] [CrossRef]
- Elanchezhiyan, S.; Sivasurian, N.; Meenakshi, S. Efficacy of La3+ entrapped chitosan bio-polymeric matrix for the recovery of oil from oil-in-water emulsion. J. Appl. Polym. Sci. 2016, 133. [Google Scholar] [CrossRef]
- Desbrieres, J.; Guibal, E. Chitosan for wastewater treatment. Polym. Int. 2018, 67, 7–14. [Google Scholar] [CrossRef]
- Barbusiński, K.; Salwiczek, S.; Paszewska, A. The use of chitosan for removing selected pollutants from water and wastewater—short review. Archit. Civ. Eng. Environ. 2016, 9, 107–115. [Google Scholar] [CrossRef]
- Liu, X.; Zhang, L. Removal of phosphate anions using the modified chitosan beads: Adsorption kinetic, isotherm and mechanism studies. Powder Technol. 2015, 277, 112–119. [Google Scholar] [CrossRef]
- Sowmya, A.; Meenakshi, S. Effective removal of nitrate and phosphate anions from aqueous solutions using functionalised chitosan beads. Desalin. Water Treat. 2014, 52, 2583–2593. [Google Scholar] [CrossRef]
- Bursali, E.A.; Seki, Y.; Seyhan, S.; Delener, M.; Yurdakoc, M. Synthesis of Chitosan Beads as Boron Sorbents. J. Appl. Polym. Sci. 2011, 122, 657–665. [Google Scholar] [CrossRef]
- Pakdel, P.; Peighambardoust, S. Review on recent progress in chitosan-based hydrogels for wastewater treatment application. Carbohydr. Polym. 2018, 201, 264–279. [Google Scholar] [CrossRef] [PubMed]
- Liang, P.; Zhang, Y.; Wang, D.; Xu, Y.; Luo, L. Preparation of mixed rare earths modified chitosan for fluoride adsorption. J. Rare Earths 2013, 31, 817–822. [Google Scholar] [CrossRef]
- Li, J.; Liu, Q.; Huang, R.; Wang, G. Synthesis of a novel Ce(III)-incorporated cross-linked chitosan and its effective removal of fluoride from aqueous solution. J. Rare Earths 2016, 34, 1053–1061. [Google Scholar] [CrossRef]
- Elanchezhiyan, S.; Meenakshi, S. Facile synthesis of metal incorporated chitin for the recovery of oil from oil-in-water emulsion using adsorptive method. J. Clean. Prod. 2016, 139, 1339–1350. [Google Scholar] [CrossRef]
- Zhu, T.; Zhu, T.; Gao, J.; Zhang, L.; Zhang, W. Enhanced adsorption of fluoride by cerium immobilized cross-linked chitosan composite. J. Fluor. Chem. 2017, 194, 80–88. [Google Scholar] [CrossRef]
- Hu, P.; Liu, Q.; Wang, J.; Huang, R. Phosphate removal by Ce(III)-impregnated crosslinked chitosan complex from aqueous solutions. Polym. Eng. Sci. 2017, 57, 44–51. [Google Scholar] [CrossRef]
- Wang, F.; Ge, M. Fibrous mat of chitosan/polyvinyl alcohol/containing cerium(III) for the removal of chromium(VI) from aqueous solution. Text. Res. J. 2013, 83, 628–637. [Google Scholar] [CrossRef]
- Ansari, A.A.; Kaushik, A. Synthesis and optical properties of nanostructured Ce(OH)4. J. Semicond. 2010, 31, 033001. [Google Scholar] [CrossRef]
- Senthilkumar, R.; Bhuvaneshwari, V.; Ranjithkumar, R.; Sathiyavimal, S.; Malayaman, V.; Chandarshekar, B. Synthesis, characterization and antibacterial activity of hybrid chitosan-cerium oxide nanoparticles: As a bionanomaterials. Int. J. Biol. Macromol. 2017, 104, 1746–1752. [Google Scholar] [CrossRef]
- Cotton, F.A.; Wilkinson, G.; Gaus, P.L. Basic Inorganic Chemistry; John Wiley and Sons, Inc.: Hoboken, NJ, USA, 1987. [Google Scholar]
- Elanchezhiyan, S.; Prabhu, S.M.; Meenakshi, S. Effective adsorption of oil droplets from oil-in-water emulsion using metal ions encapsulated biopolymers: Role of metal ions and their mechanism in oil removal. Int. J. Biol. Macromol. 2018, 112, 294–305. [Google Scholar] [CrossRef] [PubMed]
- Zhang, L.; Zhu, T.; Liu, X.; Zhang, W. Simultaneous oxidation and adsorption of As(III) from water by cerium modified chitosan ultrafine nanobiosorbent. J. Hazard. Mater. 2016, 308, 1–10. [Google Scholar] [CrossRef] [PubMed]
- Gazi, M.; Shahmohammadi, S. Removal of trace boron from aqueous solution using iminobis-(propylene glycol) modified chitosan beads. React. Funct. Polym. 2012, 72, 680–686. [Google Scholar] [CrossRef]
- Demey, H.; Vincent, T.; Ruiz, M.; Sastre, A.; Guibal, E. Development of a new chitosan/Ni(OH)(2)-based sorbent for boron removal. Chem. Eng. J. 2014, 244, 576–586. [Google Scholar] [CrossRef]
- Duong, D.D. Adsorption Analysis Equilibria and Kinetics; Imperial College Press: London, UK, 1998. [Google Scholar]
- Paderewski, M.L. Adsorption Processes in Chemical Engineering; WNT: Warszawa, Poland, 1999. [Google Scholar]
- Oladipo, A.; Gazi, M. Hydroxyl-enhanced magnetic chitosan microbeads for boron adsorption: Parameter optimization and selectivity in saline water. React. Funct. Polym. 2016, 109, 23–32. [Google Scholar] [CrossRef]
- Demey, H.; Vincent, T.; Ruiz, M.; Nogueras, M.; Sastre, A.M.; Guibal, E. Boron recovery from seawater with a new low-cost adsorbent material. Chem. Eng. J. 2014, 254, 463–471. [Google Scholar] [CrossRef]
- Treybal, R.E. Mass Transfer Operations; McGraw Hill: New York, NY, USA, 1980. [Google Scholar]
- Wei, Y.T.; Zheng, Y.M.; Chen, J.P. Design and fabrication of an innovative and environmental friendly adsorbent for boron removal. Water Res. 2011, 45, 2297–2305. [Google Scholar] [CrossRef] [PubMed]
- Liu, R.; Ma, W.; Jia, C.-Y.; Wang, L.; Li, H.-Y. Effect of pH on biosorption of boron onto cotton cellulose. Desalination 2007, 207, 257–267. [Google Scholar] [CrossRef]
- Kluczka, J.; Korolewicz, T.; Zołotajkin, M.; Simka, W.; Raczek, M. A new adsorbent for boron removal from aqueous solutions. Environ. Technol. 2013, 34, 1369–1376. [Google Scholar] [CrossRef] [PubMed]
- Nasef, M.; Nallappan, M.; Ujang, Z. Polymer-based chelating adsorbents for the selective removal of boron from water and wastewater: A review. React. Funct. Polym. 2014, 85, 54–68. [Google Scholar] [CrossRef]
- Hall, K.R.; Eagleton, L.C.; Acrivos, A.; Vermeulen, T. Pore and solid diffusion kinetics in fixed bed adsorption order constant pattern conditions. Ind. Eng. Chem. Fundam. 1966, 5, 212–223. [Google Scholar] [CrossRef]
- Kluczka, J.; Torz, A.; Lacka, D.; Kazek-Kesik, A.; Adamek, J. Boron Removal by Adsorption on Cobalt(II) Doped Chitosan Bio-composite. J. Polym. Environ. 2018, 26, 2039–2048. [Google Scholar] [CrossRef]
- Foo, K.; Hameed, B. Insights into the modeling of adsorption isotherm systems. Chem. Eng. J. 2010, 156, 2–10. [Google Scholar] [CrossRef]
- Ho, Y.; McKay, G. The kinetics of sorption of basic dyes from aqueous solution by sphagnum moss peat. Can. J. Chem. Eng. 1998, 76, 822–827. [Google Scholar] [CrossRef]
- Ho, Y.; McKay, G. Sorption of dye from aqueous solution by peat. Chem. Eng. J. 1998, 70, 115–124. [Google Scholar] [CrossRef]
- Modrzejewska, Z.; Rogacki, G.; Sujka, W.; Zarzycki, R. Sorption of copper by chitosan hydrogel: Kinetics and equilibrium. Chem. Eng. Process. 2016, 109, 104–113. [Google Scholar] [CrossRef]
Figure 1.
The FTIR spectra of the unmodified chitosan (CTS) and the chitosan composite supported with Ce(IV) before (Ce-CTS) and after (Ce-CTS-B) boron adsorption.
Figure 1.
The FTIR spectra of the unmodified chitosan (CTS) and the chitosan composite supported with Ce(IV) before (Ce-CTS) and after (Ce-CTS-B) boron adsorption.
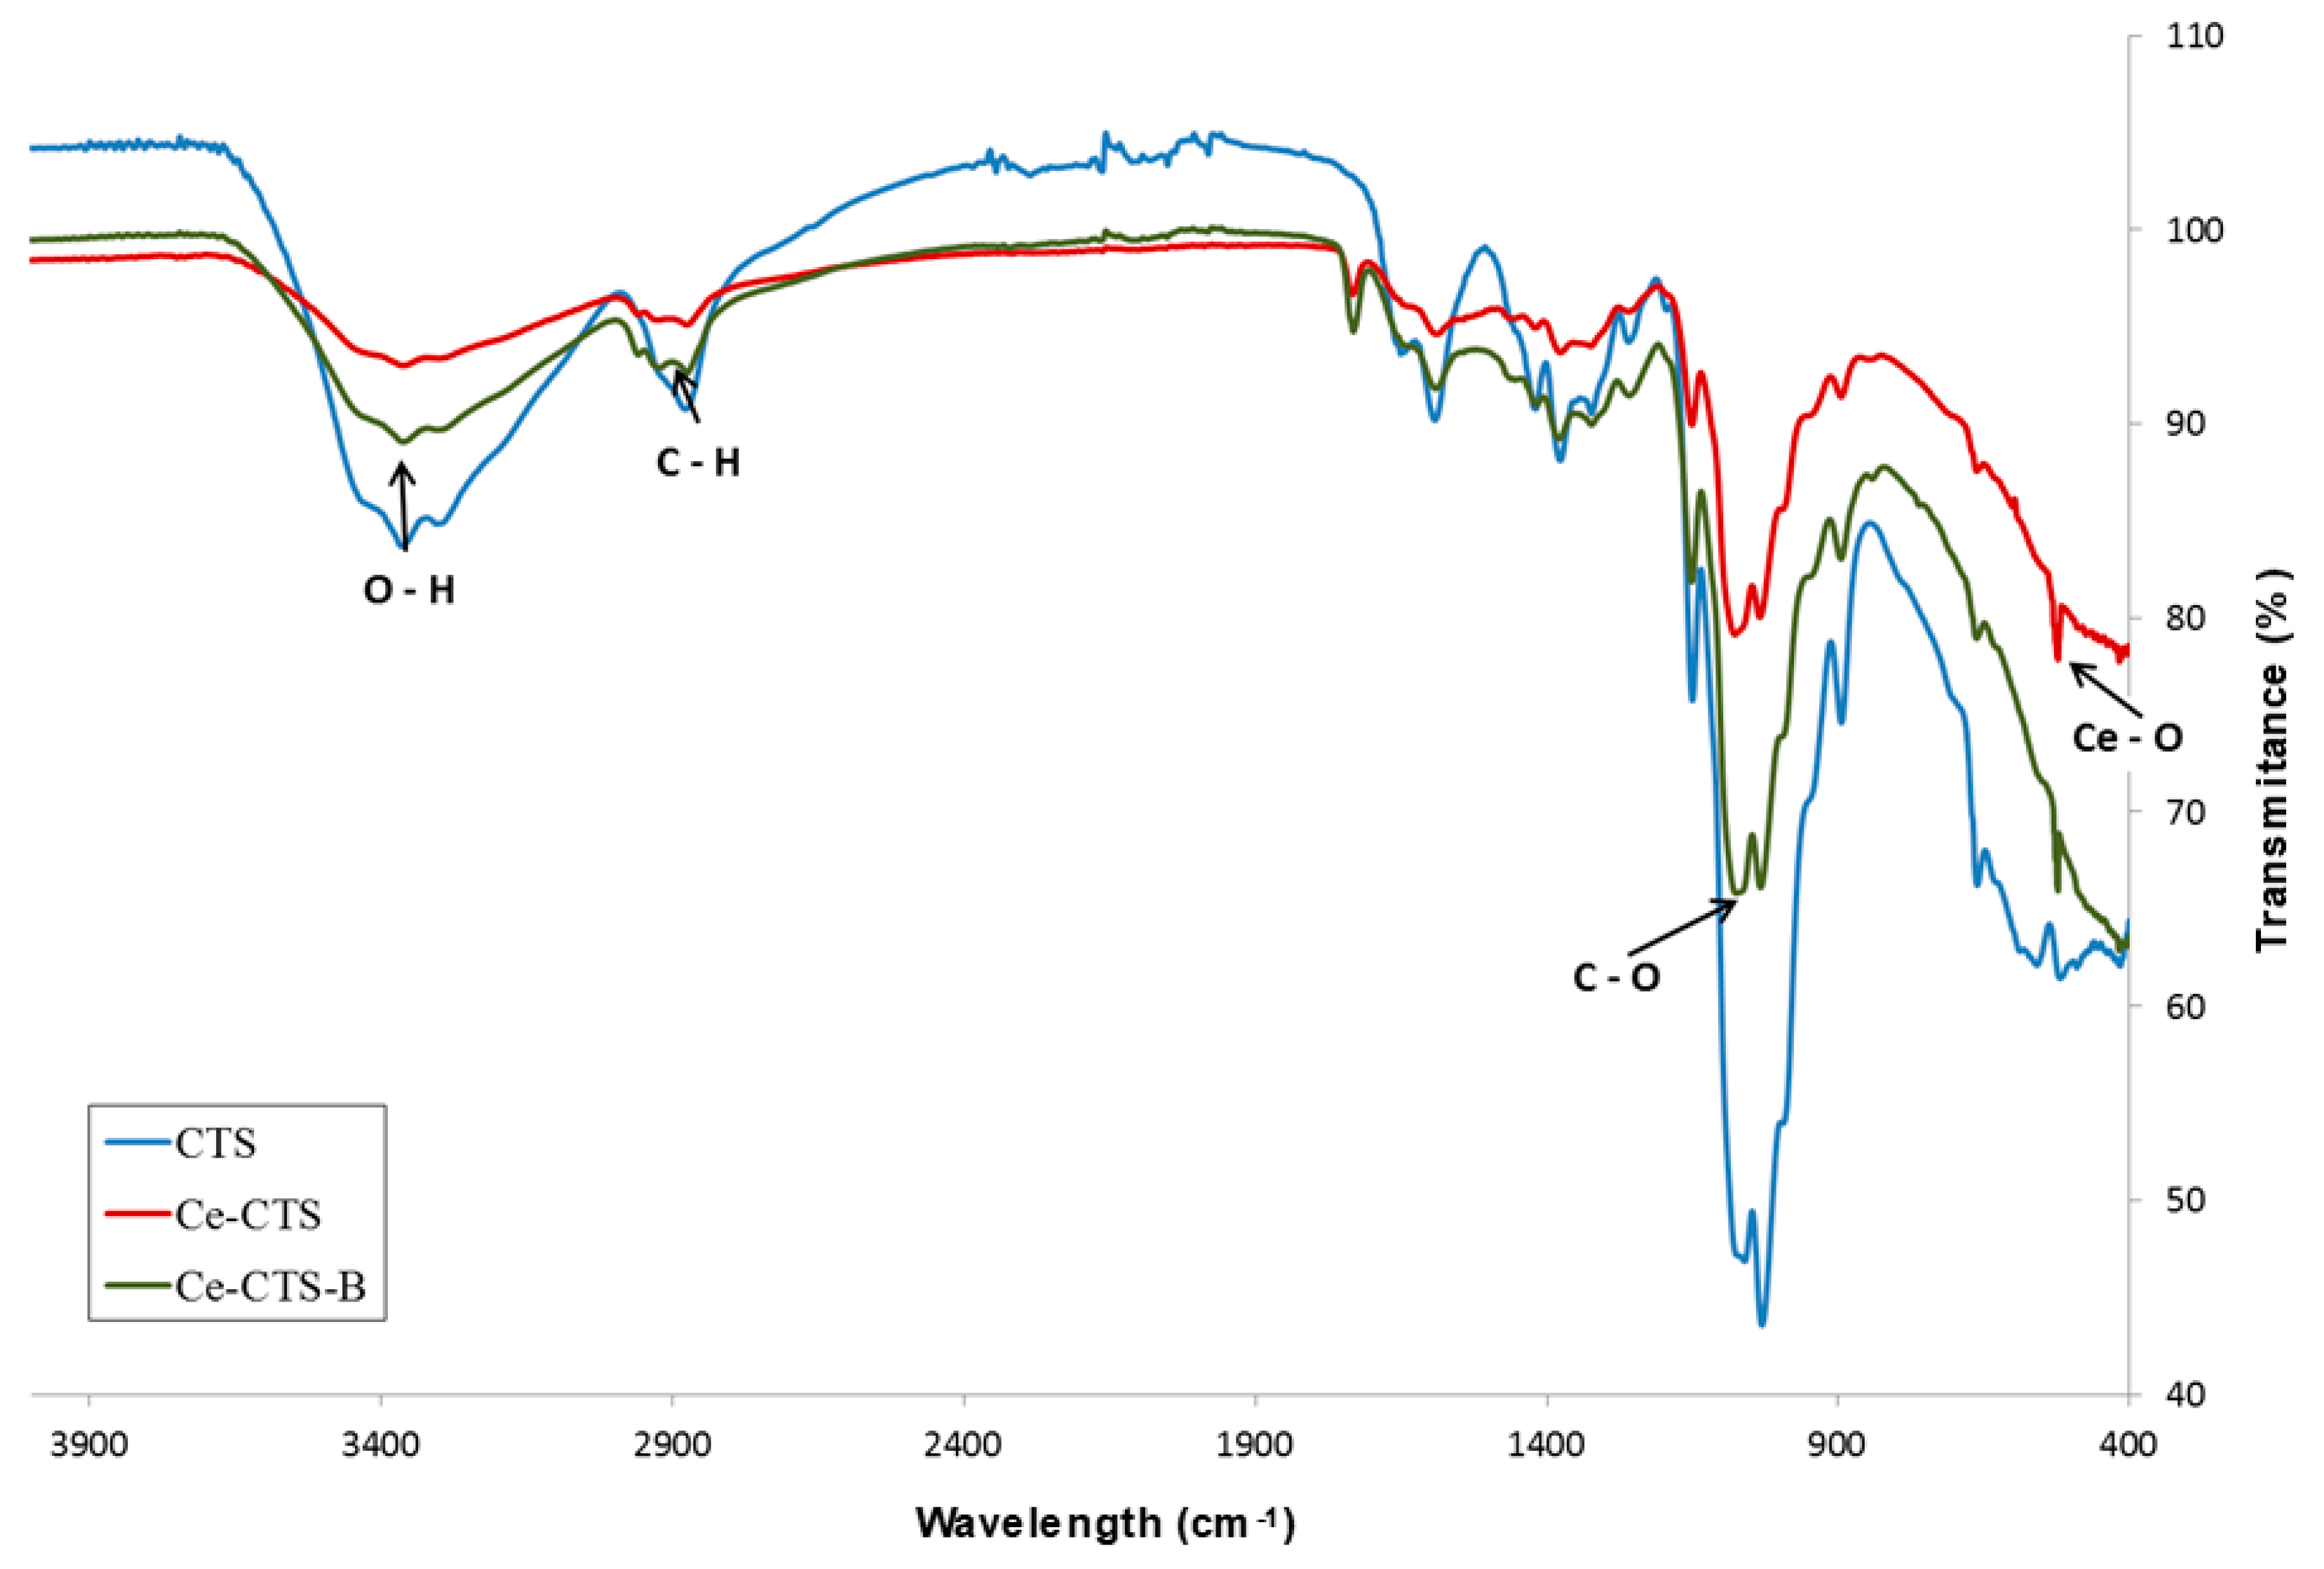
Figure 2.
SEM images of the cross-section of the chitosan composite supported with Ce(IV): (a) Ce-CTS before adsorption; (b) Ce-CTS-B after boron adsorption; and (c) the EDS spectrum of Ce-CTS.
Figure 2.
SEM images of the cross-section of the chitosan composite supported with Ce(IV): (a) Ce-CTS before adsorption; (b) Ce-CTS-B after boron adsorption; and (c) the EDS spectrum of Ce-CTS.
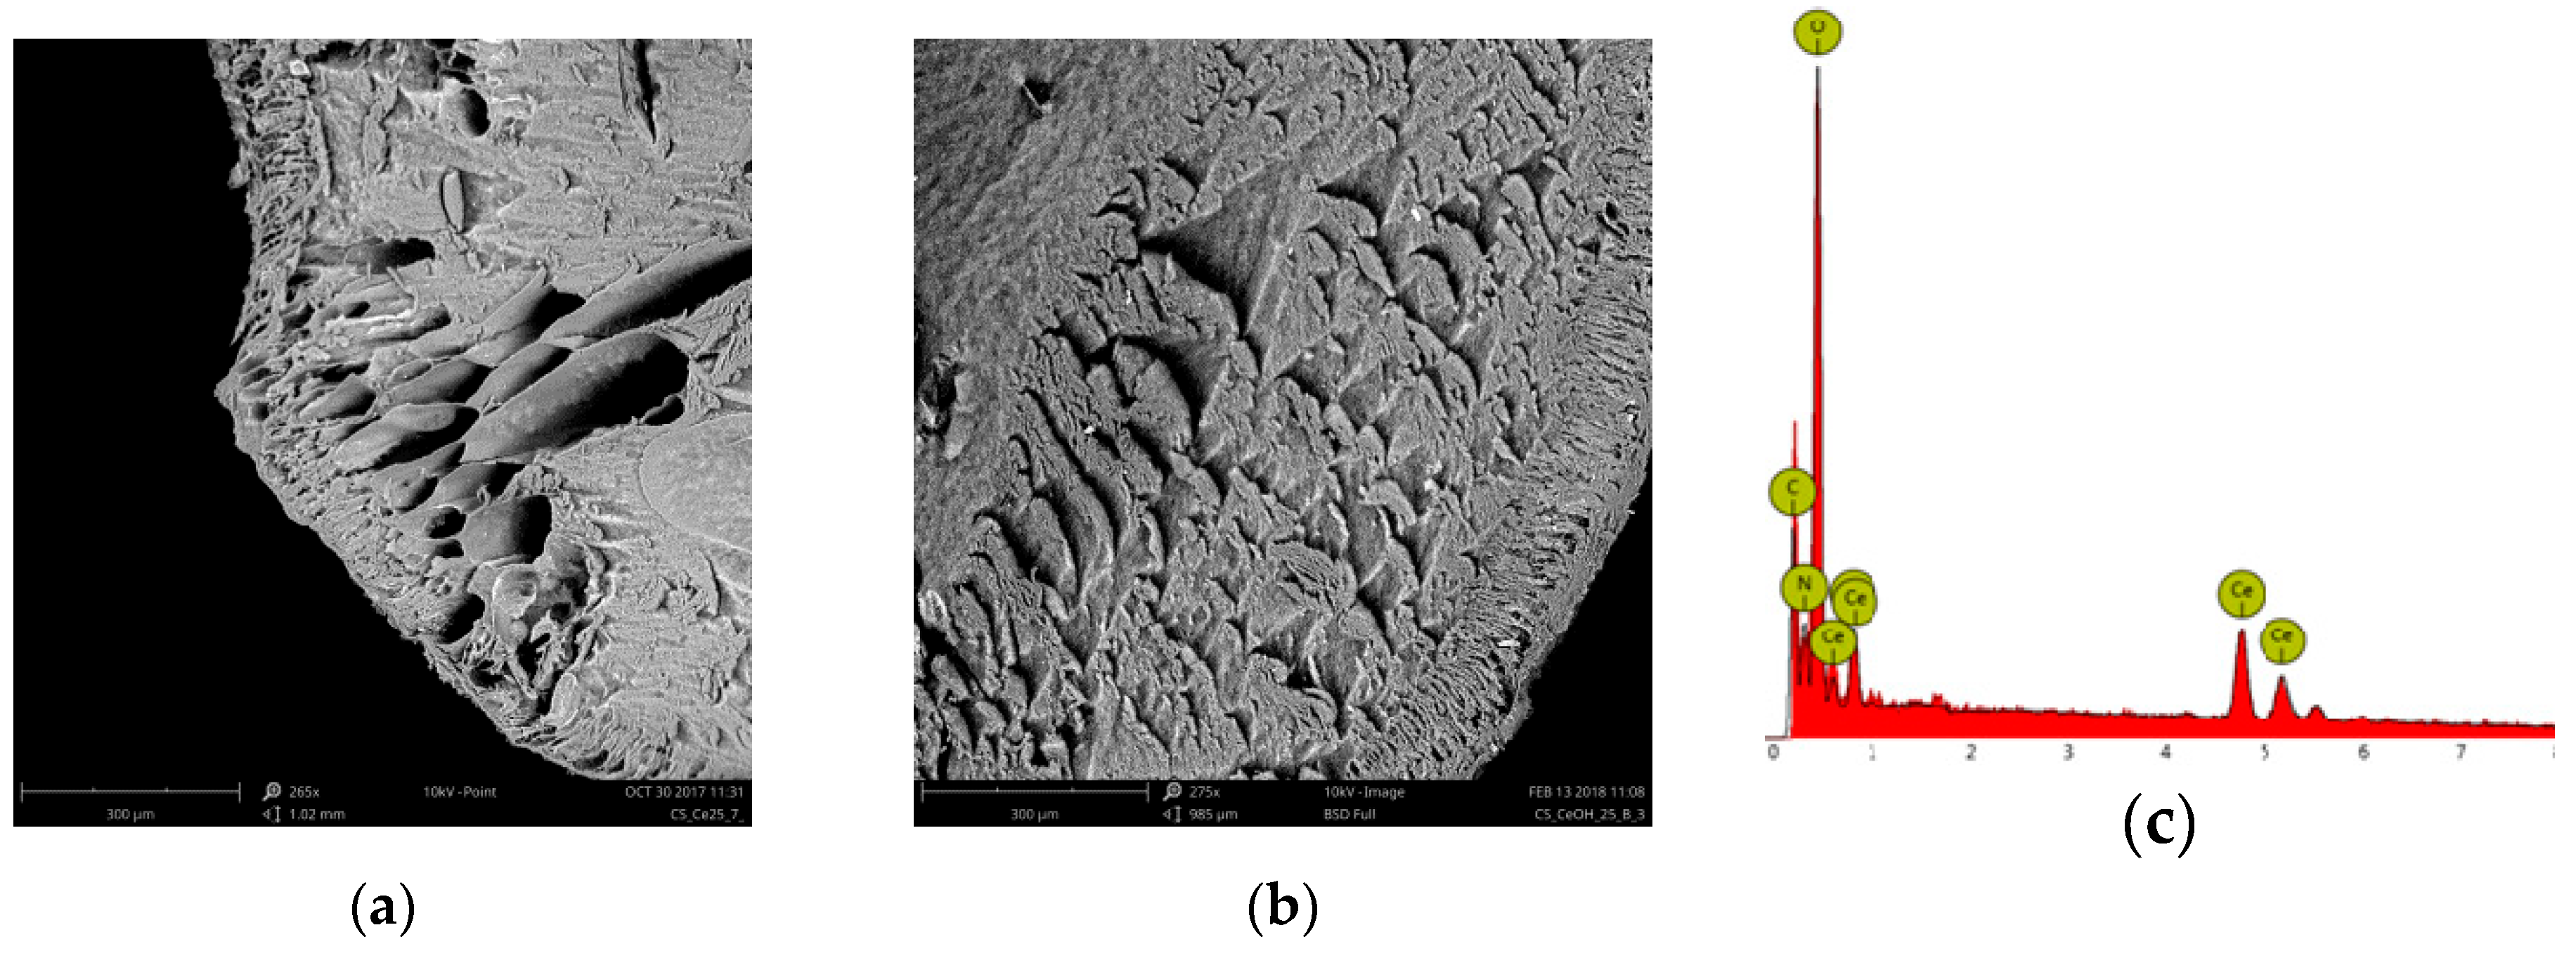
Figure 3.
The XRD spectra of the unmodified chitosan (CTS) and the chitosan composite supported with Ce(IV) before boron adsorption (Ce-CTS) and after boron adsorption (Ce-CTS-B).
Figure 3.
The XRD spectra of the unmodified chitosan (CTS) and the chitosan composite supported with Ce(IV) before boron adsorption (Ce-CTS) and after boron adsorption (Ce-CTS-B).

Scheme 1.
The formation of Ce-CTS composite hydrogel beads.
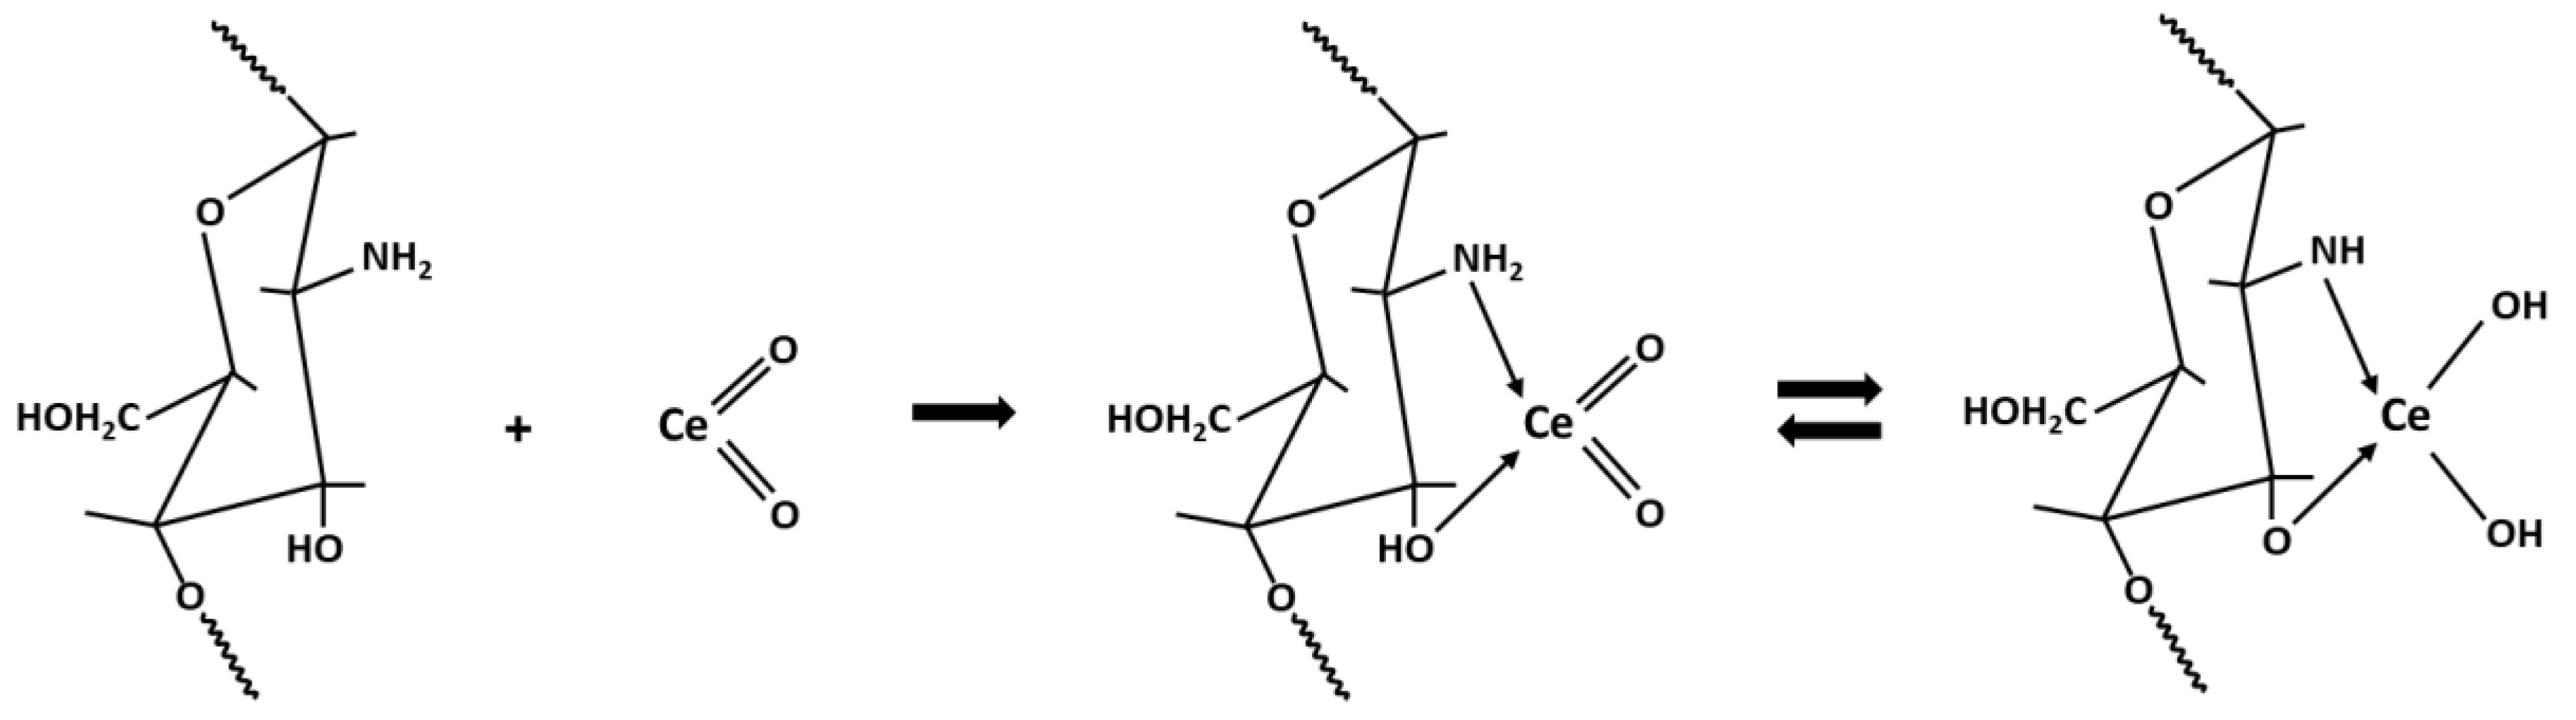
Figure 4.
Comparison of boron adsorption capacity of CeO2·nH2O, Ce-CTS and CTS as a function of initial pH value at a temperature of 20 ± 1 °C.
Figure 4.
Comparison of boron adsorption capacity of CeO2·nH2O, Ce-CTS and CTS as a function of initial pH value at a temperature of 20 ± 1 °C.

Scheme 2.
The possible mechanism of boron adsorption on the Ce-CTS composite hydrogel beads: (A) acid and neutral pH; (B) alkaline pH.
Scheme 2.
The possible mechanism of boron adsorption on the Ce-CTS composite hydrogel beads: (A) acid and neutral pH; (B) alkaline pH.
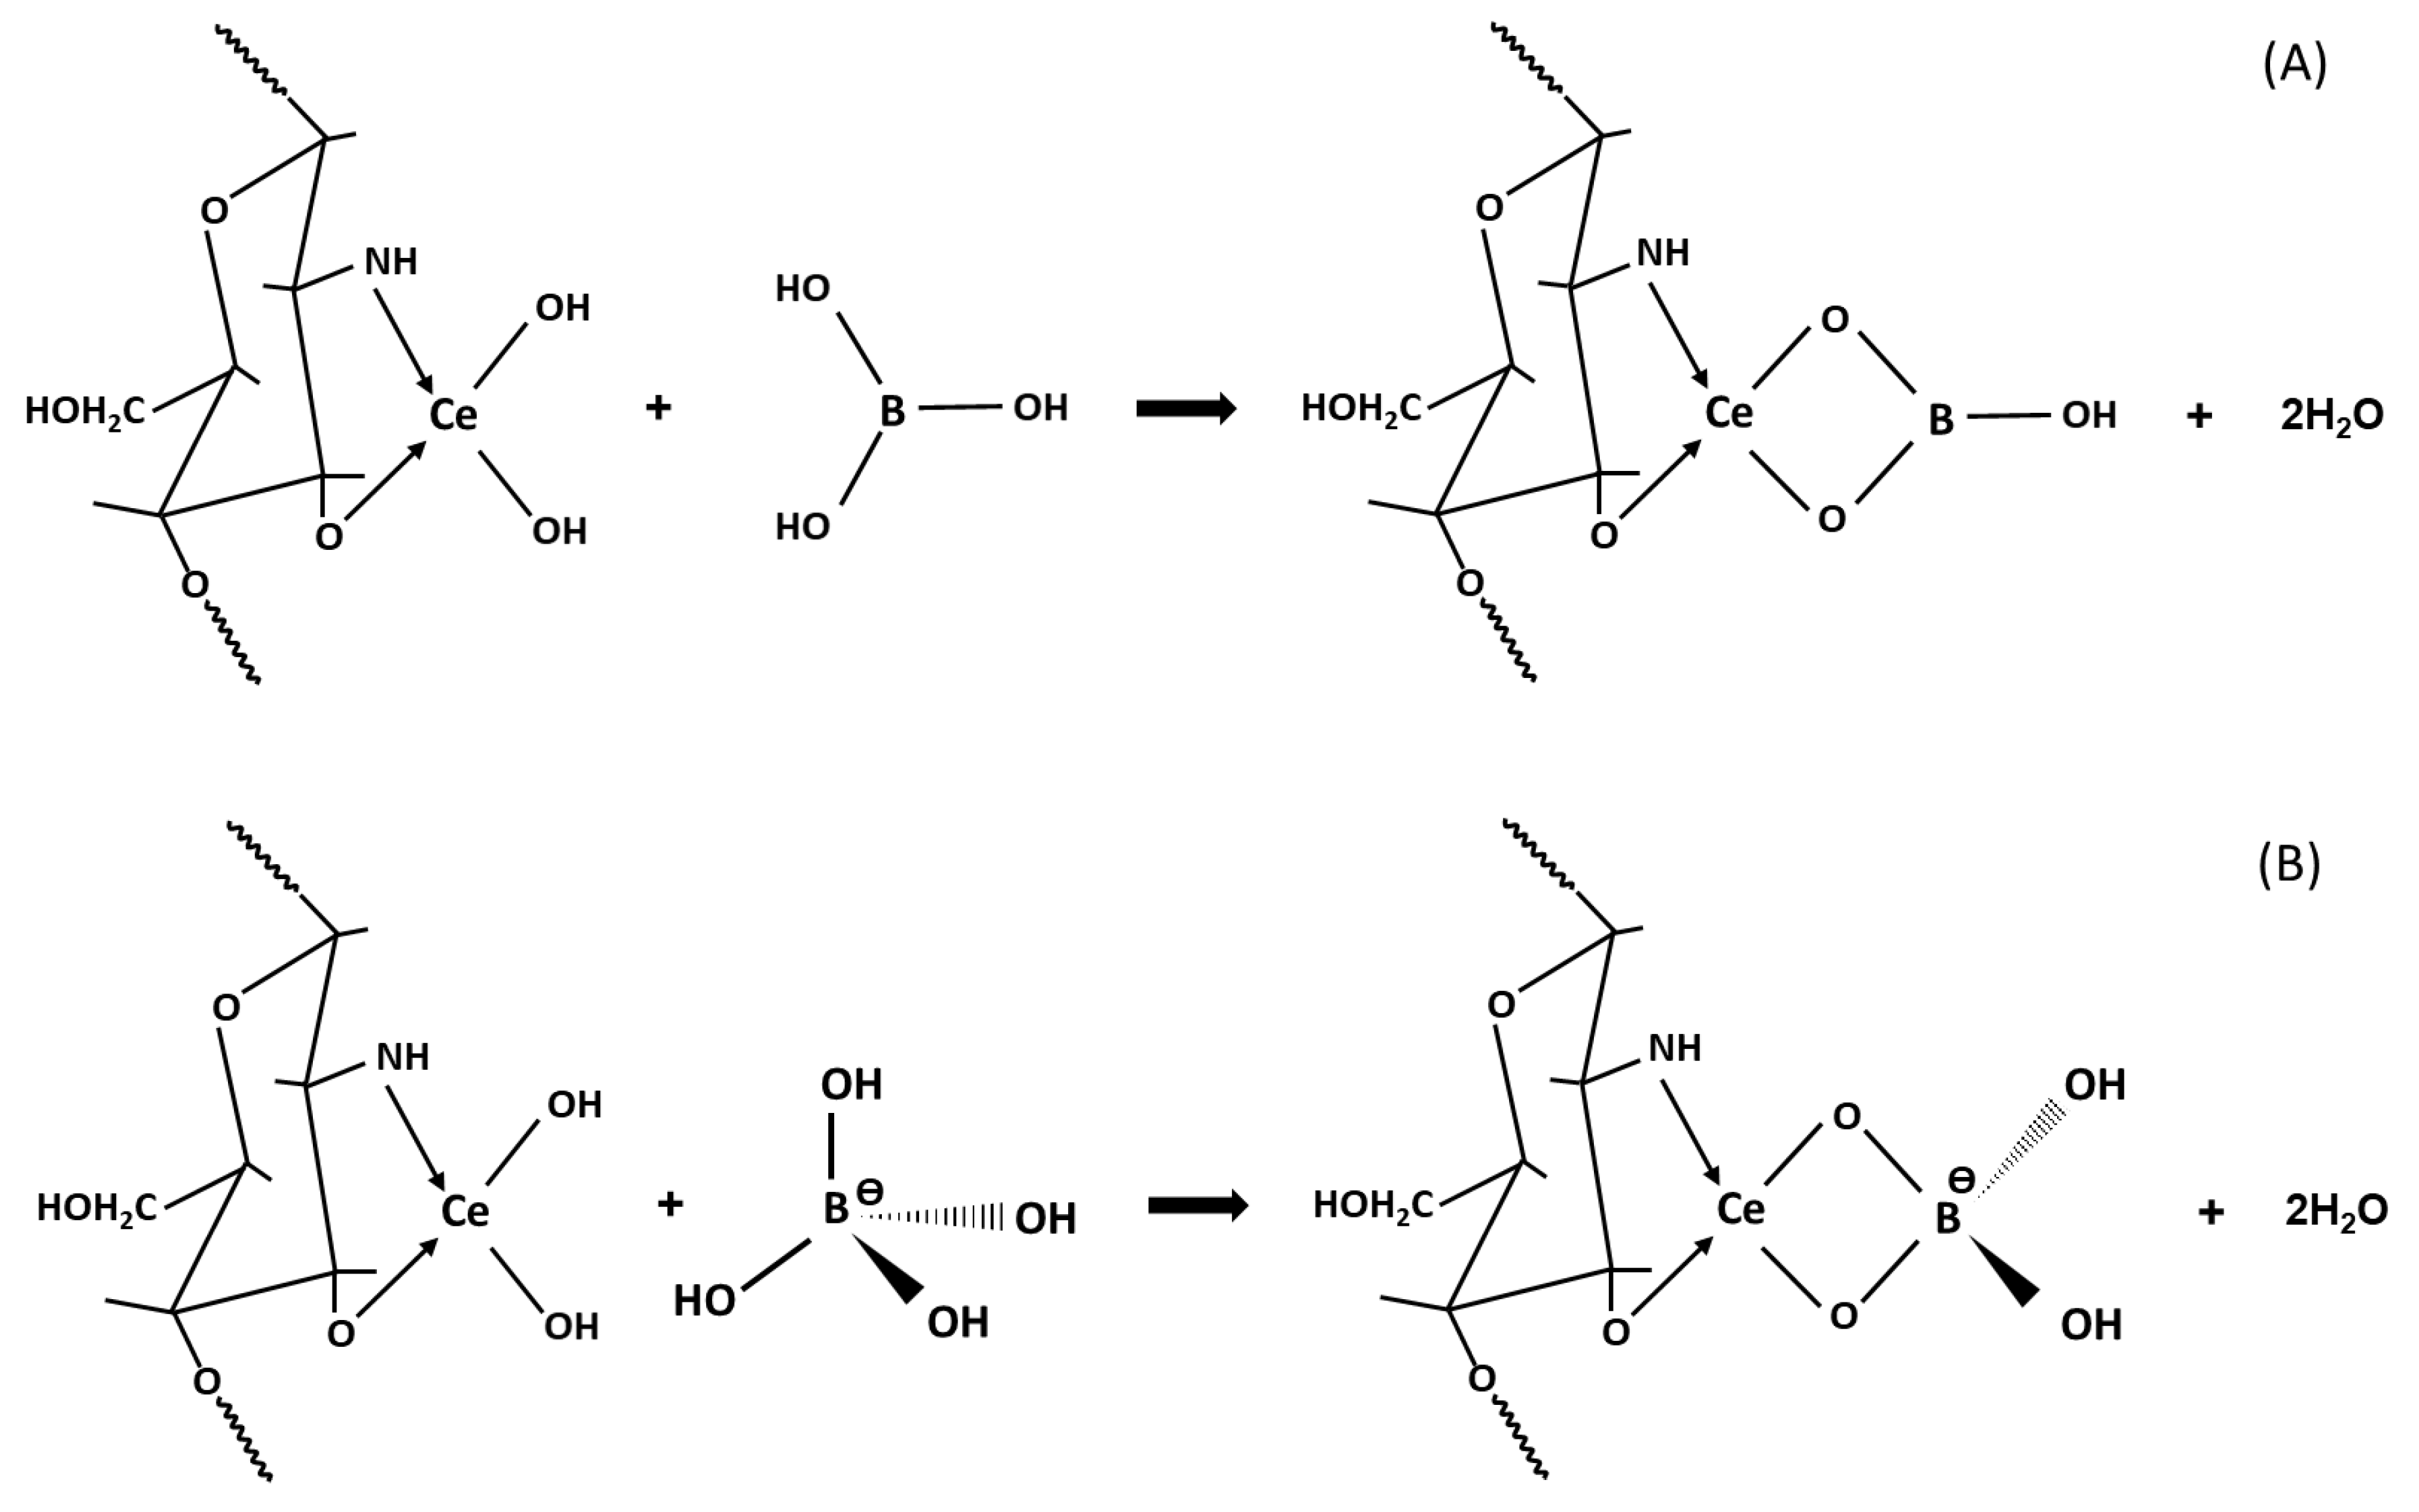
Figure 5.
Boron adsorption isotherms on the Ce-CTS composite hydrogel beads: experimental curve and Langmuir, Freundlich, Dubinin–Radushkevich and Temkin models at 20 ± 1 °C and time of 24 h. The inserted figure is the adsorption isotherms on Ce-CTS with initial boron concentrations up to 50 mg/dm3.

Figure 6.
Effect of contact time on boron adsorption efficiency using the Ce-CTS composite hydrogel beads. The inserted figure is the effect of contact time with initial boron concentrations of 20 and 200 mg/dm3.
Figure 6.
Effect of contact time on boron adsorption efficiency using the Ce-CTS composite hydrogel beads. The inserted figure is the effect of contact time with initial boron concentrations of 20 and 200 mg/dm3.
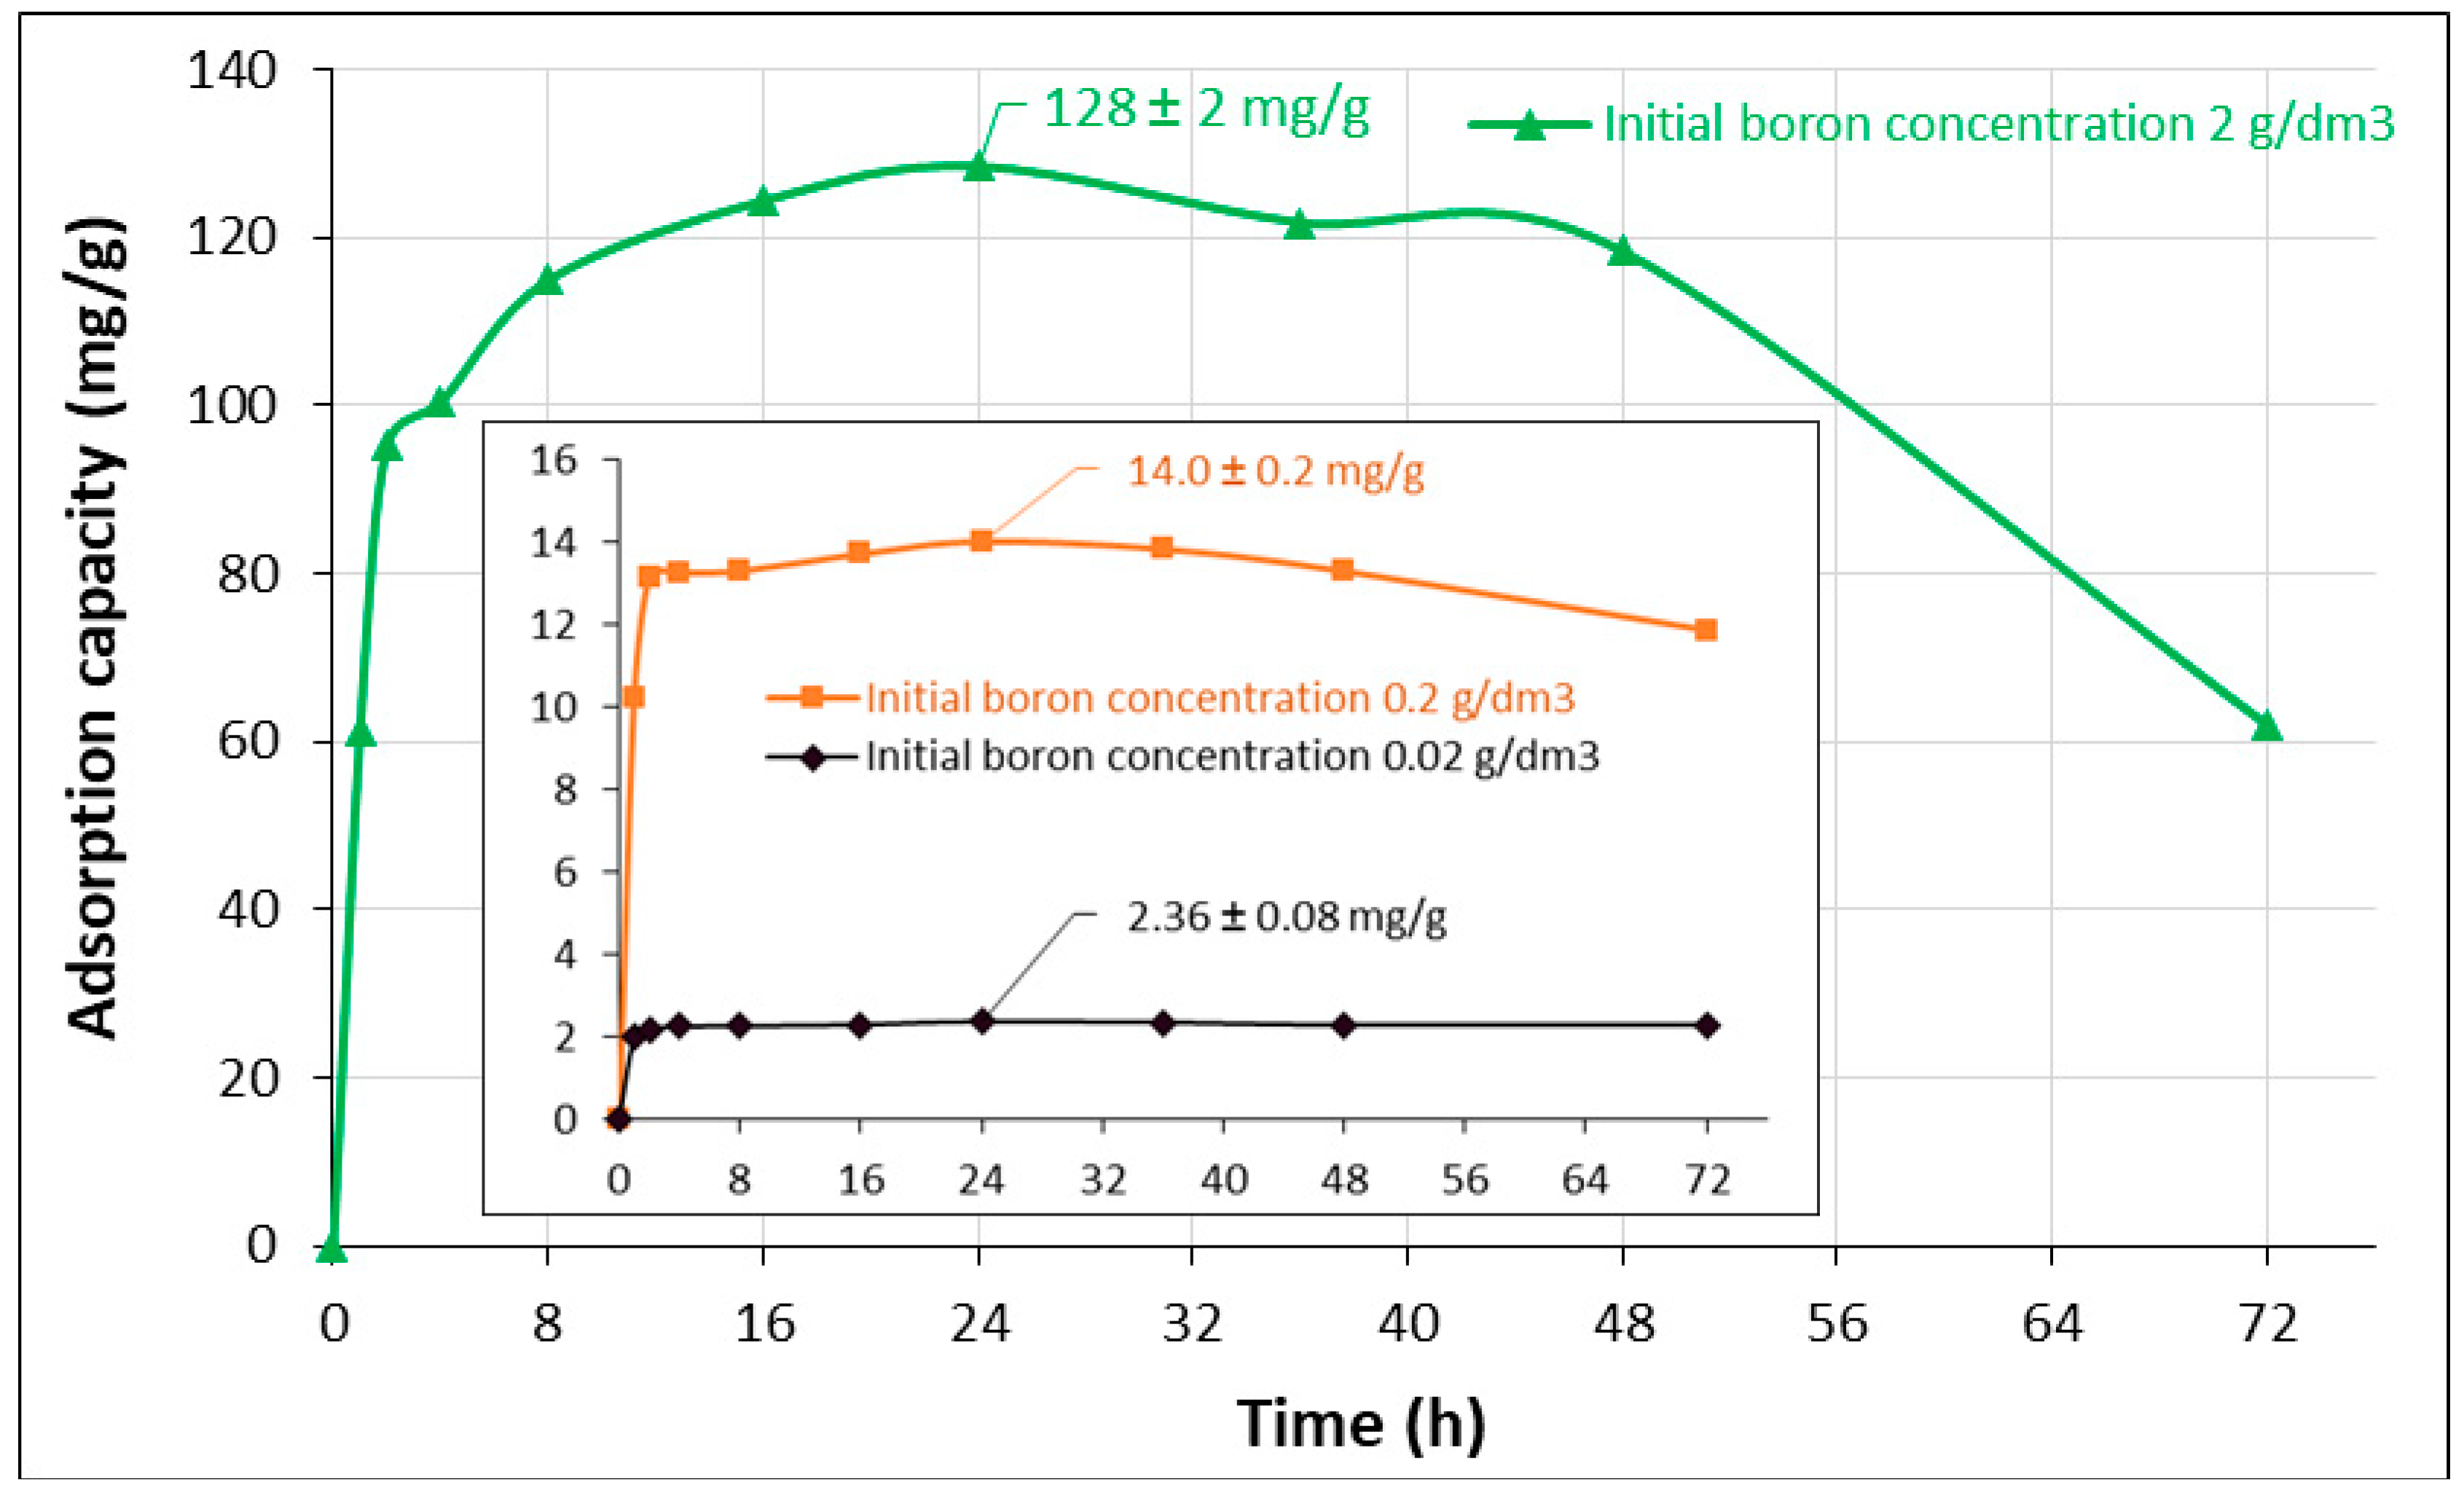
Figure 7.
The influence of the initial boron concentration and time of contact on the elution of cerium ions from the Ce-CTS composite hydrogel beads (1) and changes of the cerium percentage in Ce-CTS during adsorption (2).
Figure 7.
The influence of the initial boron concentration and time of contact on the elution of cerium ions from the Ce-CTS composite hydrogel beads (1) and changes of the cerium percentage in Ce-CTS during adsorption (2).

Figure 8.
The influence of the regenerant concentration on boron desorption efficiency and cerium elution from the Ce-CTS composite hydrogel beads.
Figure 8.
The influence of the regenerant concentration on boron desorption efficiency and cerium elution from the Ce-CTS composite hydrogel beads.

Table 1.
Comparison of boron adsorption capacity on Ce-CTS with chitosan beads and other sorbents.
| Sorbent/Parameter | Temp.(C) | pH | C0(B) (mg/dm3) | Adsorbent Dosage (g/dm3) | t (min) | qexpt (mg/g) | Ref. |
|---|---|---|---|---|---|---|---|
| Filler | Chitosan | ||||||
| NanoTiO2 | 25 | 4 | 20 | 50 | 5 | 4.3 | [15] |
| NanoCr2O3 | 25 | 4 | 20 | 50 | 5 | 3.5 | [15] |
| NanoFe3O4 | 25 | 4 | 20 | 50 | 5 | 4.4 | [15] |
| Fe(OH)3 | 25 | 4 | 20 | 50 | 5 | 7.8 | [15] |
| Without filler | 25 | 8 | 10 | 2 | 30 | 3.5 | [26] |
| Glycidol | 25 | 7 | 5.2 | 8.3 | 45 | 23.8 | [39] |
| Ni(OH)2 | 25 | 7 | 50 | 1 | 4320 | 61.4 *** | [40] |
| NMDG * | 20 | 7 | 4.8 | 0.5 | 480 | 35.1 | [45] |
| Co(OH)2 | 25 | 8.5 | 20 | 50 | 60 | 2.5 | [46] |
| Ce(OH)4 | 20 | 7 | 500 | 100 | 2880 | 13.5 | This paper |
| Other sorbents | |||||||
| Amberlite IRA-743 | 30 | 9.5 | 40 | 10 | 7.5 | [3] | |
| AC ** and Salicylic Acid | 25 | 8 | 25 | 20 | 30 | 0.325 | [8] |
| AC ** and Curcumin | 25 | 5.5 | 1000 | 40 | 120 | 5.05* | [9] |
| Fly ash zeolite | 25 | 7 | 50 | 20 | 30 | 2.3 | [12] |
| Cotton cellulose | 25 | 7 | 500 | 20 | 480 | 11.3 | [47] |
| Clinoptylolite | 25 | 8 | 50 | 20 | 30 | 0.155 | [48] |
| Clinoptylolite and ZrO2 | 25 | 8 | 50 | 20 | 30 | 1.03 | [48] |
| Purolite S 108 | 30 | 9.2 | **** | 2 | **** | 6.2 | [49] |
*: N-methylo-D-glucamine; **: Activated carbon; ***: Calculated per 1 g of Ni(OH)2; ****: no data.
Table 2.
Parameters of Langmuir (L), Freundlich (F), Dubinin–Radushkevich (D–R) and Temkin (T) isotherms on the Ce-CTS composite hydrogel beads at 20 ± 1 °C.
Table 2.
Parameters of Langmuir (L), Freundlich (F), Dubinin–Radushkevich (D–R) and Temkin (T) isotherms on the Ce-CTS composite hydrogel beads at 20 ± 1 °C.
| Isotherm Model | Parameters of the Isotherm Models (qexpt = 13.5 ± 0.9 mg/g) | |||||||
|---|---|---|---|---|---|---|---|---|
| L | qm (mg/g) | B (dm3/mg) | R2 | ARE (%) | ||||
| 4.95 | 0.129 | 0.9897 | 23.9 | |||||
| RL for initial boron concentration (mg/dm3): | ||||||||
| 2 | 5 | 10 | 20 | 50 | 100 | 200 | 500 | |
| 0.795 | 0.608 | 0.437 | 0.279 | 0.134 | 0.072 | 0.037 | 0.015 | |
| F | KF (mg/g) | n | R2 | ARE (%) | ||||
| 0.584 | 1.95 | 0.9810 | 13.2 | |||||
| D–R | Xm (mg/g) | E (kJ/mol) | R2 | ARE (%) | ||||
| 14.4 | −9.13 | 0.9709 | 26.7 | |||||
| T | AT | bT × 10−3 | R2 | ARE (%) | ||||
| 0.727 | 1.48 | 0.7651 | 41.0 | |||||
Table 3.
Kinetic parameters for boron adsorption on the Ce-CTS composite hydrogel beads at 20 ± 1 °C.
Table 3.
Kinetic parameters for boron adsorption on the Ce-CTS composite hydrogel beads at 20 ± 1 °C.
| Initial Boron Concentration | Experimental Capacity | Parameters of the Kinetic Models | |||
|---|---|---|---|---|---|
| Pseudo-first-order | |||||
| C0(B) (mg/dm3) | qexpt (mg/g) | q1 (mg/g) | K1 (g/(mg∙h)) | R12 | |
| 20 | 2.36 | 0.148 | −0.0368 | 0.1234 | |
| 200 | 14.0 | 1.026 | 0.0394 | 0.1927 | |
| 2000 | 128.5 | 58.425 | 0.1697 | 0.9864 | |
| Pseudo-second-order | |||||
| C0(B) (mg/dm3) | qexpt (mg/g) | q2 (mg/g) | k2 (g/(mg∙h)) | R22 | r (mg/(g∙h)) |
| 20 | 2.36 | 2.37 | 1.540 | 0.9996 | 8.65 |
| 200 | 14.0 | 14.1 | 0.2167 | 0.9997 | 43.1 |
| 2000 | 128.5 | 133.3 | 0.0065 | 0.9995 | 114.9 |
| Intraparticle diffusion model | |||||
| C0(B) (mg/dm3) | qexpt (mg/g) | q3 (mg/g) | Kp (mg/(g∙(h)1/2)) | R32 | |
| 20 | 2.36 | 2.01 | 0.076 | 0.7273 | |
| 200 | 14.0 | 11.2 | 0.650 | 0.5269 | |
| 2000 | 128.5 | 65.0 | 14.5 | 0.8018 | |
| Model combining the chemical reaction with intraparticle diffusion | |||||
| C0(B) (mg/dm3) | qexpt (mg/g) | q4 (mg/g) | K4 (dm3/(g∙h)) | R42 | |
| 20 | 2.36 | 2.95 | 0.0099 | 0.9287 | |
| 200 | 14.0 | 103.5 | 0.0060 | 0.9081 | |
| 2000 | 128.5 | 1577 | 0.0034 | 0.8925 | |
© 2019 by the authors. Licensee MDPI, Basel, Switzerland. This article is an open access article distributed under the terms and conditions of the Creative Commons Attribution (CC BY) license (http://creativecommons.org/licenses/by/4.0/).
Share and Cite
MDPI and ACS Style
Kluczka, J.; Dudek, G.; Kazek-Kęsik, A.; Gnus, M. Chitosan Hydrogel Beads Supported with Ceria for Boron Removal. Int. J. Mol. Sci. 2019, 20, 1567. https://doi.org/10.3390/ijms20071567
AMA Style
Kluczka J, Dudek G, Kazek-Kęsik A, Gnus M. Chitosan Hydrogel Beads Supported with Ceria for Boron Removal. International Journal of Molecular Sciences. 2019; 20(7):1567. https://doi.org/10.3390/ijms20071567
Chicago/Turabian StyleKluczka, Joanna, Gabriela Dudek, Alicja Kazek-Kęsik, and Małgorzata Gnus. 2019. "Chitosan Hydrogel Beads Supported with Ceria for Boron Removal" International Journal of Molecular Sciences 20, no. 7: 1567. https://doi.org/10.3390/ijms20071567
Note that from the first issue of 2016, this journal uses article numbers instead of page numbers. See further details here.