Plasma Metabolites Associated with Brain MRI Measures of Neurodegeneration in Older Adults in the Atherosclerosis Risk in Communities–Neurocognitive Study (ARIC-NCS)

 , , ,
, , ,
Abstract
:
1. Introduction
2. Results
3. Discussion
4. Materials and Methods
4.1. Population
4.2. Brain MRI Measures
4.3. Measurement of Plasma Metabolites
4.4. Covariates
4.5. Statistical Analysis
5. Conclusions
Supplementary Materials
Author Contributions
Funding
Acknowledgments
Conflicts of Interest
References
- Müller, K.; Courtois, G.; Ursini, M.V.; Schwaninger, M. New Insight Into the Pathogenesis of Cerebral Small-Vessel Diseases. Stroke 2017, 48, 520–527. [Google Scholar] [CrossRef]
- Wardlaw, J.M.; Smith, E.E.; Biessels, G.J.; Cordonnier, C.; Fazekas, F.; Frayne, R.; Lindley, R.I.; O’Brien, J.T.; Barkhof, F.; Benavente, O.R.; et al. Neuroimaging standards for research into small vessel disease and its contribution to ageing and neurodegeneration. Lancet Neurol. 2013, 12, 822–838. [Google Scholar] [CrossRef] [Green Version]
- Hassan, A.; Hunt, B.J.; O’sullivan, M.; Parmar, K.; Bamford, J.M.; Briley, D.; Brown, M.M.; Thomas, D.J.; Markus, H.S. Markers of endothelial dysfunction in lacunar infarction and ischaemic leukoaraiosis. Brain 2003, 126, 424–432. [Google Scholar] [CrossRef] [Green Version]
- Hassan, A.; Hunt, B.J.; O’sullivan, M.; Bell, R.; D’souza, R.; Jeffery, S.; Bamford, J.M.; Markus, H.S. Homocysteine is a risk factor for cerebral small vessel disease, acting via endothelial dysfunction. Brain 2004, 127, 212–219. [Google Scholar] [Green Version]
- Fornage, M.; Chiang, Y.A.; O’meara, E.S.; Psaty, B.M.; Reiner, A.P.; Siscovick, D.S.; Tracy, R.P.; Longstreth, W. Biomarkers of inflammation and MRI-defined small vessel disease of the brain. Stroke 2008, 39, 1952–1959. [Google Scholar] [CrossRef]
- Kjaergaard, A.D.; Johansen, J.S.; Bojesen, S.E.; Nordestgaard, B.G. Elevated plasma YKL-40, lipids and lipoproteins, and ischemic vascular disease in the general population. Stroke 2015, 46, 329–335. [Google Scholar] [CrossRef]
- Schilling, S.; Tzourio, C.; Dufouil, C.; Zhu, Y.; Berr, C.; Alpérovitch, A.; Crivello, F.; Mazoyer, B.; Debette, S. Plasma lipids and cerebral small vessel disease. Neurology 2014, 83, 1844–1852. [Google Scholar] [CrossRef]
- Ewers, M.; Mielke, M.M.; Hampel, H. Blood-based biomarkers of microvascular pathology in Alzheimer’s disease. Exp. Gerontol. 2010, 45, 75–79. [Google Scholar] [CrossRef]
- Leitinger, N.; Tyner, T.R.; Oslund, L.; Rizza, C.; Subbanagounder, G.; Lee, H.; Shih, P.T.; Mackman, N.; Tigyi, G.; Territo, M.C. Structurally similar oxidized phospholipids differentially regulate endothelial binding of monocytes and neutrophils. Proc. Natl. Acad. Sci. USA 1999, 96, 12010–12015. [Google Scholar] [CrossRef] [Green Version]
- Huber, J.; Vales, A.; Mitulovic, G.; Blumer, M.; Schmid, R.; Witztum, J.L.; Binder, B.R.; Leitinger, N. Oxidized membrane vesicles and blebs from apoptotic cells contain biologically active oxidized phospholipids that induce monocyte-endothelial interactions. Arterioscler. Thromb. Vasc. Biol. 2002, 22, 101–107. [Google Scholar] [CrossRef]
- Chatterjee, S. Sphingolipids in atherosclerosis and vascular biology. Arterioscler. Thromb. Vasc. Biol. 1998, 18, 1523–1533. [Google Scholar] [CrossRef]
- Liu, Y.; Wada, R.; Yamashita, T.; Mi, Y.; Deng, C.-X.; Hobson, J.P.; Rosenfeldt, H.M.; Nava, V.E.; Chae, S.-S.; Lee, M.-J. Edg-1, the G protein–coupled receptor for sphingosine-1-phosphate, is essential for vascular maturation. J. Clin. Investig. 2000, 106, 951–961. [Google Scholar] [CrossRef] [Green Version]
- Li, D.; Misialek, J.R.; Huang, F.; Windham, B.G.; Yu, F.; Alonso, A. Independent association of plasma hydroxysphingomyelins with physical function in the Atherosclerosis Risk in Communities (ARIC) study. J. Gerontol. A Biol. Sci. Med. Sci. 2017, 73, 1103–1110. [Google Scholar] [CrossRef]
- Li, D.; Misialek, J.R.; Boerwinkle, E.; Gottesman, R.F.; Sharrett, A.R.; Mosley, T.H.; Coresh, J.; Wruck, L.M.; Knopman, D.S.; Alonso, A. Plasma phospholipids and prevalence of mild cognitive impairment and/or dementia in the ARIC Neurocognitive Study (ARIC-NCS). Alzheimers Dement. (Amst.) 2016, 3, 73–82. [Google Scholar] [CrossRef] [Green Version]
- Zöller, I.; Meixner, M.; Hartmann, D.; Büssow, H.; Meyer, R.; Gieselmann, V.; Eckhardt, M. Absence of 2-hydroxylated sphingolipids is compatible with normal neural development but causes late-onset axon and myelin sheath degeneration. J. Neurosci. 2008, 28, 9741–9754. [Google Scholar] [CrossRef]
- Potter, K.A.; Kern, M.J.; Fullbright, G.; Bielawski, J.; Scherer, S.S.; Yum, S.W.; Li, J.J.; Cheng, H.; Han, X.; Venkata, J.K.; et al. Central nervous system dysfunction in a mouse model of FA2H deficiency. Glia 2011, 59, 1009–1021. [Google Scholar] [CrossRef] [Green Version]
- Svennerholm, L.; Ställberg-Stenhagen, S. Changes in the fatty acid composition of cerebrosides and sulfatides of human nervous tissue with age. J. Lipid Res. 1968, 9, 215–225. [Google Scholar]
- Hancock, S.E.; Friedrich, M.G.; Mitchell, T.W.; Truscott, R.J.; Else, P.L. The phospholipid composition of the human entorhinal cortex remains relatively stable over 80 years of adult aging. Geroscience 2017, 39, 73–82. [Google Scholar] [CrossRef] [Green Version]
- Baylis, D.; Bartlett, D.B.; Patel, H.P.; Roberts, H.C. Understanding how we age: Insights into inflammaging. Longev. Heal. 2013, 2, 8. [Google Scholar] [CrossRef]
- Wallner, S.; Schmitz, G. Plasmalogens the neglected regulatory and scavenging lipid species. Chem. Phys. Lipids 2011, 164, 573–589. [Google Scholar] [CrossRef]
- Luiking, Y.C.; Engelen, M.P.; Deutz, N.E. Regulation of nitric oxide production in health and disease. Curr. Opin. Clin. Nutr. Metab. Care 2010, 13, 97–104. [Google Scholar] [CrossRef]
- Clarkson, P.; Adams, M.R.; Powe, A.J.; Donald, A.E.; McCredie, R.; Robinson, J.; McCarthy, S.N.; Keech, A.; Celermajer, D.S.; Deanfield, J.E. Oral L-arginine improves endothelium-dependent dilation in hypercholesterolemic young adults. J. Clin. Investig. 1996, 97, 1989–1994. [Google Scholar] [CrossRef]
- Hoth, K.F.; Tate, D.F.; Poppas, A.; Forman, D.E.; Gunstad, J.; Moser, D.J.; Paul, R.H.; Jefferson, A.L.; Haley, A.P.; Cohen, R.A. Endothelial function and white matter hyperintensities in older adults with cardiovascular disease. Stroke 2007, 38, 308–312. [Google Scholar] [CrossRef]
- Mielke, M.M.; Bandaru, V.V.; Han, D.; An, Y.; Resnick, S.M.; Ferrucci, L.; Haughey, N.J. Factors affecting longitudinal trajectories of plasma sphingomyelins: The Baltimore Longitudinal Study of Aging. Aging Cell 2015, 14, 112–121. [Google Scholar] [CrossRef] [PubMed]
- Shah, J.S.; Rai, S.N.; DeFilippis, A.P.; Hill, B.G.; Bhatnagar, A.; Brock, G.N. Distribution based nearest neighbor imputation for truncated high dimensional data with applications to pre-clinical and clinical metabolomics studies. BMC Bioinform. 2017, 18, 114. [Google Scholar] [CrossRef]
- Investigators. The Atherosclerosis Risk in Communities (ARIC) Study: Design and objectives. The ARIC investigators. Am. J. Epidemiol. 1989, 129, 687–702. [Google Scholar] [CrossRef]
- Knopman, D.S.; Gottesman, R.F.; Sharrett, A.R.; Wruck, L.M.; Windham, B.G.; Coker, L.; Schneider, A.L.; Hengrui, S.; Alonso, A.; Coresh, J.; et al. Mild Cognitive Impairment and Dementia Prevalence: The Atherosclerosis Risk in Communities Neurocognitive Study (ARIC-NCS). Alzheimers Dement. (Amst.) 2016, 2, 1–11. [Google Scholar] [CrossRef]
- Knopman, D.S.; Griswold, M.E.; Lirette, S.T.; Gottesman, R.F.; Kantarci, K.; Sharrett, A.R.; Jack, C.R., Jr.; Graff-Radford, J.; Schneider, A.L.; Windham, B.G.; et al. Vascular imaging abnormalities and cognition: Mediation by cortical volume in nondemented individuals: Atherosclerosis risk in communities-neurocognitive study. Stroke 2015, 46, 433–440. [Google Scholar] [CrossRef]
- Raz, L.; Jayachandran, M.; Tosakulwong, N.; Lesnick, T.G.; Wille, S.M.; Murphy, M.C.; Senjem, M.L.; Gunter, J.L.; Vemuri, P.; Jack, C.R. Thrombogenic microvesicles and white matter hyperintensities in postmenopausal women. Neurology 2013, 80, 911–918. [Google Scholar] [CrossRef] [PubMed] [Green Version]
- Fischl, B.; Salat, D.H.; Busa, E.; Albert, M.; Dieterich, M.; Haselgrove, C.; Van Der Kouwe, A.; Killiany, R.; Kennedy, D.; Klaveness, S. Whole brain segmentation: Automated labeling of neuroanatomical structures in the human brain. Neuron 2002, 33, 341–355. [Google Scholar] [CrossRef]
- Erten-Lyons, D.; Dodge, H.H.; Woltjer, R.; Silbert, L.C.; Howieson, D.B.; Kramer, P.; Kaye, J.A. Neuropathologic basis of age-associated brain atrophy. JAMA Neurol. 2013, 70, 616–622. [Google Scholar] [CrossRef] [PubMed]
- Fjell, A.M.; McEvoy, L.; Holland, D.; Dale, A.M.; Walhovd, K.B.; Alzheimer’s Disease Neuroimaging Initiative. Brain changes in older adults at very low risk for Alzheimer’s disease. J. Neurosci. 2013, 33, 8237–8242. [Google Scholar] [CrossRef] [PubMed]
- Schwarz, C.G.; Gunter, J.L.; Wiste, H.J.; Przybelski, S.A.; Weigand, S.D.; Ward, C.P.; Senjem, M.L.; Vemuri, P.; Murray, M.E.; Dickson, D.W. A large-scale comparison of cortical thickness and volume methods for measuring Alzheimer’s disease severity. NeuroImage Clin. 2016, 11, 802–812. [Google Scholar] [CrossRef]
- Wong, T.Y.; Shankar, A.; Klein, R.; Bray, M.S.; Couper, D.J.; Klein, B.E.; Sharrett, A.R.; Folsom, A.R. Apolipoprotein E gene and early age-related maculopathy: The Atherosclerosis Risk in Communities Study. Ophthalmology 2006, 113, 255–259. [Google Scholar] [CrossRef] [PubMed]
- Baecke, J.A.; Burema, J.; Frijters, J.E. A short questionnaire for the measurement of habitual physical activity in epidemiological studies. Am. J. Clin. Nutr. 1982, 36, 936–942. [Google Scholar] [CrossRef] [Green Version]
- Loehr, L.R.; Rosamond, W.D.; Chang, P.P.; Folsom, A.R.; Chambless, L.E. Heart failure incidence and survival (from the Atherosclerosis Risk in Communities study). Am. J. Cardiol. 2008, 101, 1016–1022. [Google Scholar] [CrossRef] [PubMed]
- Rosamond, W.D.; Folsom, A.R.; Chambless, L.E.; Wang, C.H.; McGovern, P.G.; Howard, G.; Copper, L.S.; Shahar, E. Stroke incidence and survival among middle-aged adults—9-year follow-up of the Atherosclerosis Risk in Communities (ARIC) cohort. Stroke 1999, 30, 736–743. [Google Scholar] [CrossRef]
- Parrinello, C.M.; Lutsey, P.L.; Ballantyne, C.M.; Folsom, A.R.; Pankow, J.S.; Selvin, E. Six-year change in high-sensitivity C-reactive protein and risk of diabetes, cardiovascular disease, and mortality. Am. Heart J. 2015, 170, 380–389. [Google Scholar] [CrossRef]

| Participants Included | Participants Excluded | ||||
|---|---|---|---|---|---|
| without Brain MRI but Metabolites | without Metabolites but Brain MRI | without Metabolites or Brain MRI | |||
| (n = 238) | (n = 203) | (n = 1739) | (n = 4358) | ||
| Age, years | 77.5 (5.6) | 78.5 (5.5) | 76.3 (5.3) | 75.4 (5.2) | |
| African American, % | 21.9 | 36.0 | 29.4 | 20.8 | |
| Female, % | 56.7 | 51.7 | 60.3 | 58.7 | |
| Body mass index, kg/m2 | 28.2 (5.4) | 29.4 (6.1) | 28.5 (5.7) | 28.9 (5.9) | |
| Current drinker, % | 41.6 | 38.9 | 46.4 | 49.0 | |
| Current smoker, % | 4.2 | 4.4 | 5.2 | 5.8 | |
| Diabetes, % | 36.6 | 40.4 | 32.6 | 32.0 | |
| High school graduate or higher, % | 83.2 | 74.9 | 85.8 | 85.0 | |
| HDL cholesterol, mg/dL | 52.0 (14.8) | 52.0 (14.0) | 53.2 (14.3) | 51.7 (13.9) | |
| Hypertension medication, % | 77.3 | 81.3 | 75.4 | 75.5 | |
| Statin medication, % | 50.0 | 55.2 | 50.9 | 52.3 | |
| Prevalence of coronary heart disease, % | 13.0 | 26.6 | 9.6 | 18.0 | |
| Prevalence of heart failure, % | 4.6 | 13.8 | 5.0 | 10.0 | |
| Prevalence of stroke, % | 3.8 | 8.9 | 3.4 | 4.3 | |
| Systolic blood pressure, mmHg | 132.4 (19.3) | 131.5 (19.2) | 131.2 (18.4) | 130.4 (18.7) | |
| Sports index | 2.6 (0.8) | 2.5 (0.8) | 2.6 (0.8) | 2.6 (0.8) | |
| Total cholesterol, mg/dL | 180.8 (41.0) | 181.4 (45.6) | 183.9 (42.3) | 181.1 (41.8) | |
| Triglycerides, mg/dL | 128.7 (75.8) | 119.6 (54.8) | 124.8 (62.1) | 126.7 (64.9) | |
| Depression score | 3.1 (2.9) | 3.8 (3.7) | 3.2 (3.1) | 3.1 (3.0) | |
| APOE, % | |||||
| e4/e4 | 3.4 | 4.9 | 2.4 | 1.9 | |
| e2/e4 or e3/e4 | 31.9 | 33.0 | 24.8 | 25.5 | |
| Other | 62.6 | 57.6 | 69.0 | 68.2 | |
| Missing | 2.1 | 4.4 | 3.7 | 4.4 | |
| Brain MRI characteristics | |||||
| Lacunar infarcts, % | 22.7 | 0 | 17.9 | 0 | |
| White matter hyperintensity volume, cm3 | 21.1 (20.2) | - | 17.2 (16.7) | - | |
| Total brain volume, cm3 | 1012.7 (108.2) | - | 1011.5 (108.9) | - | |
| Total AD signature region volume, cm3 | 58.6 (6.9) | - | 58.9 (7.0) | - | |
| Freesurfer deep grey cortical volume, cm3 | 42.6 (4.4) | - | 42.6 (4.3) | - | |
| Brain MRI | Metabolites | Model | n | Odds ratio (95% CI) | p-value |
|---|---|---|---|---|---|
| Lacunar infarct (n = 54) | PC aa C36:5 | Model 1 | 238 | 1.13 (0.74, 1.72) | 0.58 |
| Model 2 | 238 | 1.69 (1.01, 2.83) | 0.04 | ||
| PC aa C36:6 | Model 1 | 238 | 1.16 (0.76, 1.76) | 0.49 | |
| Model 2 | 238 | 1.48 (0.85, 2.58) | 0.17 | ||
| SM C26:0 | Model 1 | 238 | 1.03 (0.72, 1.46) | 0.88 | |
| Model 2 | 238 | 0.94 (0.52, 1.69) | 0.84 | ||
| SM (OH) C22:1 | Model 1 | 238 | 1.03 (0.67, 1.60) | 0.88 | |
| Model 2 | 238 | 0.85 (0.41, 1.74) | 0.65 | ||
| SM (OH) C22:2 | Model 1 | 238 | 0.98 (0.61, 1.57) | 0.93 | |
| Model 2 | 238 | 1.03 (0.52, 2.04) | 0.94 | ||
| SM (OH) C24:1 | Model 1 | 238 | 0.95 (0.65, 1.40) | 0.80 | |
| Model 2 | 238 | 0.74 (0.38, 1.46) | 0.39 | ||
| Model 1: Logistic regression adjusted for age, race/center, sex, APOE, and education level | |||||
| Model 2: Model 1 with additional adjustment for body mass index, diabetes mellitus, drinking status, HDL cholesterol, smoking status, sports index, systolic blood pressure, total cholesterol, triglycerides, use of antihypertensive medications (yes or no), use of statins (yes or no), depression, and prevalence of coronary heart disease, heart failure, and stroke at the ARIC visit 5. | |||||
| Brain MRI | Metabolites | Model | n | β (95% CI)1 | p-value |
|---|---|---|---|---|---|
| Log(WMH) | PC aa C36:5 | Model 1 | 237 | 0.04 (−0.09, 0.18) | 0.54 |
| Model 2 | 237 | 0.16 (0.02, 0.30) | 0.02 | ||
| PC aa C36:6 | Model 1 | 237 | 0.04 (−0.12, 0.20) | 0.62 | |
| Model 2 | 237 | 0.14 (−0.02, 0.30) | 0.08 | ||
| SM C26:0 | Model 1 | 237 | −0.06 (−0.20, 0.09) | 0.46 | |
| Model 2 | 237 | −0.06 (−0.21, 0.09) | 0.45 | ||
| SM (OH) C22:1 | Model 1 | 237 | −0.07 (−0.21, 0.07) | 0.32 | |
| Model 2 | 237 | −0.14 (−0.30, 0.02) | 0.09 | ||
| SM (OH) C22:2 | Model 1 | 237 | −0.01 (−0.17, 0.15) | 0.94 | |
| Model 2 | 237 | −0.03 (−0.20, 0.15) | 0.77 | ||
| SM (OH) C24:1 | Model 1 | 237 | −0.19 (−0.31, −0.06) | 0.003 | |
| Model 2 | 237 | −0.21 (−0.33, −0.09) | 0.001 | ||
| Model 1: Linear regression adjusted for age, race/center, sex, APOE, education level, and estimated total intracranial volume | |||||
| Model 2: Model 1 with additional adjustment for body mass index, diabetes mellitus, drinking status, HDL cholesterol, smoking status, sports index, systolic blood pressure, total cholesterol, triglycerides, use of antihypertensive medications (yes or no), use of statins (yes or no), depression, and prevalence of coronary heart disease, heart failure, and stroke at the ARIC visit 5 baseline. | |||||
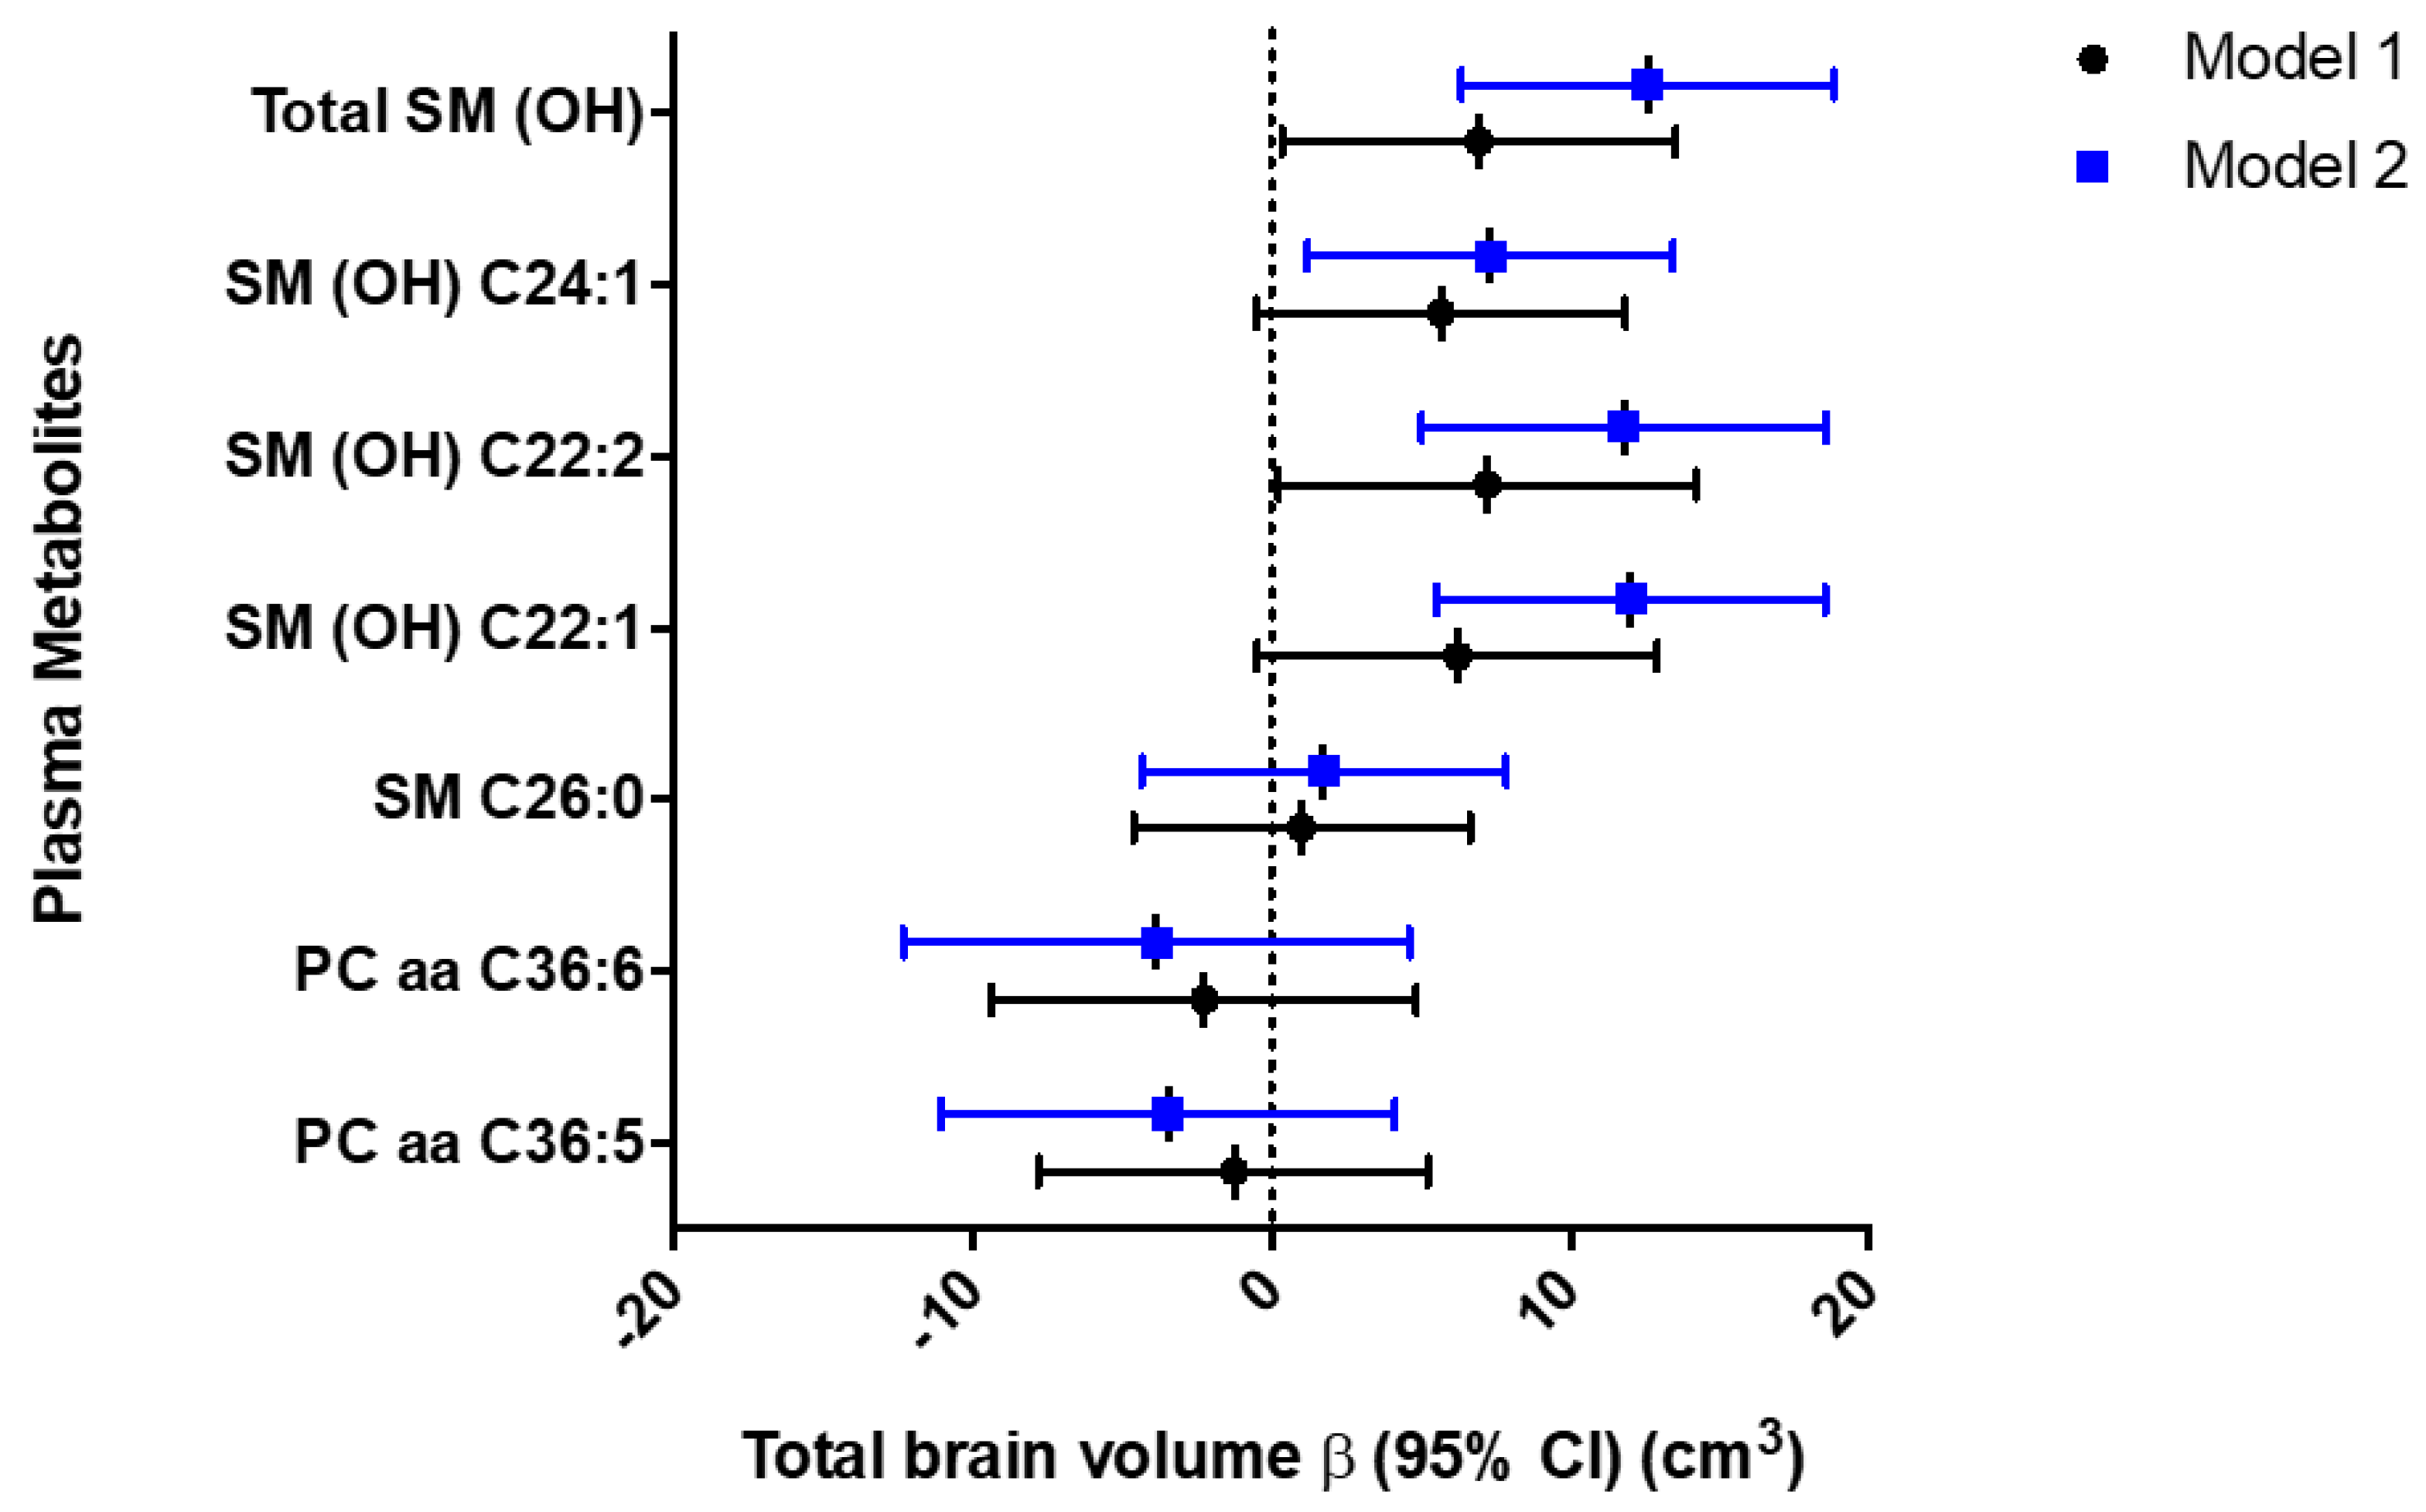
| Brain MRI | Metabolites | Model | n | β (95% CI)1 | p-value |
|---|---|---|---|---|---|
| Total brain volume | PC aa C36:5 | Model 1 | 237 | −1.26 (−7.78, 5.26) | 0.70 |
| Model 2 | 237 | −3.46 (−11.08, 4.15) | 0.37 | ||
| PC aa C36:6 | Model 1 | 237 | −2.26 (−9.37, 4.86) | 0.53 | |
| Model 2 | 237 | −3.86 (−12.33, 4.62) | 0.37 | ||
| SM C26:0 | Model 1 | 237 | 1.02 (−4.61, 6.65) | 0.72 | |
| Model 2 | 237 | 1.75 (−4.35, 7.85) | 0.57 | ||
| SM (OH) C22:1 | Model 1 | 237 | 6.23 (−0.46, 12.92) | 0.07 | |
| Model 2 | 237 | 12.04 (5.53, 18.55) | 0.0003 | ||
| SM (OH) C22:2 | Model 1 | 237 | 7.23 (0.23, 14.24) | 0.04 | |
| Model 2 | 237 | 11.79 (5.03, 18.56) | 0.001 | ||
| SM (OH) C24:1 | Model 1 | 237 | 5.67 (−0.51, 11.85) | 0.07 | |
| Model 2 | 237 | 7.33 (1.20, 13.46) | 0.02 | ||
| Total AD signature region cortical volume | Phospholipid | Model | n | β (95% CI) | p-value |
| PC aa C36:5 | Model 1 | 236 | 0.07 (−0.50, 0.64) | 0.82 | |
| Model 2 | 236 | −0.07 (−0.75, 0.61) | 0.84 | ||
| PC aa C36:6 | Model 1 | 236 | 0.41 (−0.17, 0.99) | 0.16 | |
| Model 2 | 236 | 0.32 (−0.41, 1.04) | 0.39 | ||
| SM C26:0 | Model 1 | 236 | −0.36 (−0.93, 0.21) | 0.22 | |
| Model 2 | 236 | −0.47 (−0.98, 0.04) | 0.07 | ||
| SM (OH) C22:1 | Model 1 | 236 | 0.19 (−0.46, 0.83) | 0.57 | |
| Model 2 | 236 | −0.18 (−0.91, 0.56) | 0.64 | ||
| SM (OH) C22:2 | Model 1 | 236 | 0.28 (−0.41, 0.96) | 0.43 | |
| Model 2 | 236 | 0.01 (−0.72, 0.73) | 0.99 | ||
| SM (OH) C24:1 | Model 1 | 236 | 0.02 (−0.63, 0.66) | 0.96 | |
| Model 2 | 236 | −0.30 (−0.98, 0.38) | 0.39 | ||
| Model 1: Linear regression adjusted for age, race/center, sex, APOE, education level, and estimated total intracranial volume. | |||||
| Model 2: Model 1 with additional adjustment for body mass index, diabetes mellitus, drinking status, HDL cholesterol, smoking status, sports index, systolic blood pressure, total cholesterol, triglycerides, use of antihypertensive medications (yes or no), use of statins (yes or no), depression, prevalence of coronary heart disease, heart failure, and stroke at the ARIC visit 5 baseline. | |||||
| Brain MRI | Phospholipid | Model | n | β (95% CI)1 | p-value |
|---|---|---|---|---|---|
| Total brain volume | |||||
| Total SM(OH) | Model 1 | 237 | 6.95 (0.35, 13.54) | 0.04 | |
| Model 2 | 237 | 12.61 (6.36, 18.86) | <0.0001 | ||
| Model 1: Linear regression adjusted for age, race/center, sex, APOE, education level, and estimated total intracranial volume. | |||||
| Model 2: Model 1 with additional adjustment for body mass index, diabetes mellitus, drinking status, HDL cholesterol, smoking status, sports index, systolic blood pressure, total cholesterol, triglycerides, use of antihypertensive medications (yes or no), use of statins (yes or no), depression, and prevalence coronary heart disease, heart failure, and stroke at the ARIC visit 5 baseline. | |||||
| All analyses incorporated a weight accounting for selection into the metabolite study group from the ARIC visit 5 sample. | |||||
| Boldness indicates p-value less than 0.05. | |||||
| MRI: Magnetic resonance imaging | |||||
© 2019 by the authors. Licensee MDPI, Basel, Switzerland. This article is an open access article distributed under the terms and conditions of the Creative Commons Attribution (CC BY) license (http://creativecommons.org/licenses/by/4.0/).
Share and Cite
Li, D.; Misialek, J.R.; Jack, C.R.; Mielke, M.M.; Knopman, D.; Gottesman, R.; Mosley, T.; Alonso, A. Plasma Metabolites Associated with Brain MRI Measures of Neurodegeneration in Older Adults in the Atherosclerosis Risk in Communities–Neurocognitive Study (ARIC-NCS). Int. J. Mol. Sci. 2019, 20, 1744. https://doi.org/10.3390/ijms20071744
Li D, Misialek JR, Jack CR, Mielke MM, Knopman D, Gottesman R, Mosley T, Alonso A. Plasma Metabolites Associated with Brain MRI Measures of Neurodegeneration in Older Adults in the Atherosclerosis Risk in Communities–Neurocognitive Study (ARIC-NCS). International Journal of Molecular Sciences. 2019; 20(7):1744. https://doi.org/10.3390/ijms20071744
Chicago/Turabian StyleLi, Danni, Jeffrey R. Misialek, Clifford R. Jack, Michelle M. Mielke, David Knopman, Rebecca Gottesman, Tom Mosley, and Alvaro Alonso. 2019. "Plasma Metabolites Associated with Brain MRI Measures of Neurodegeneration in Older Adults in the Atherosclerosis Risk in Communities–Neurocognitive Study (ARIC-NCS)" International Journal of Molecular Sciences 20, no. 7: 1744. https://doi.org/10.3390/ijms20071744