
Raman Imaging—A Valuable Tool for Tracking Fatty Acid Metabolism—Normal and Cancer Human Colon Single-Cell Study

Abstract
:1. Introduction
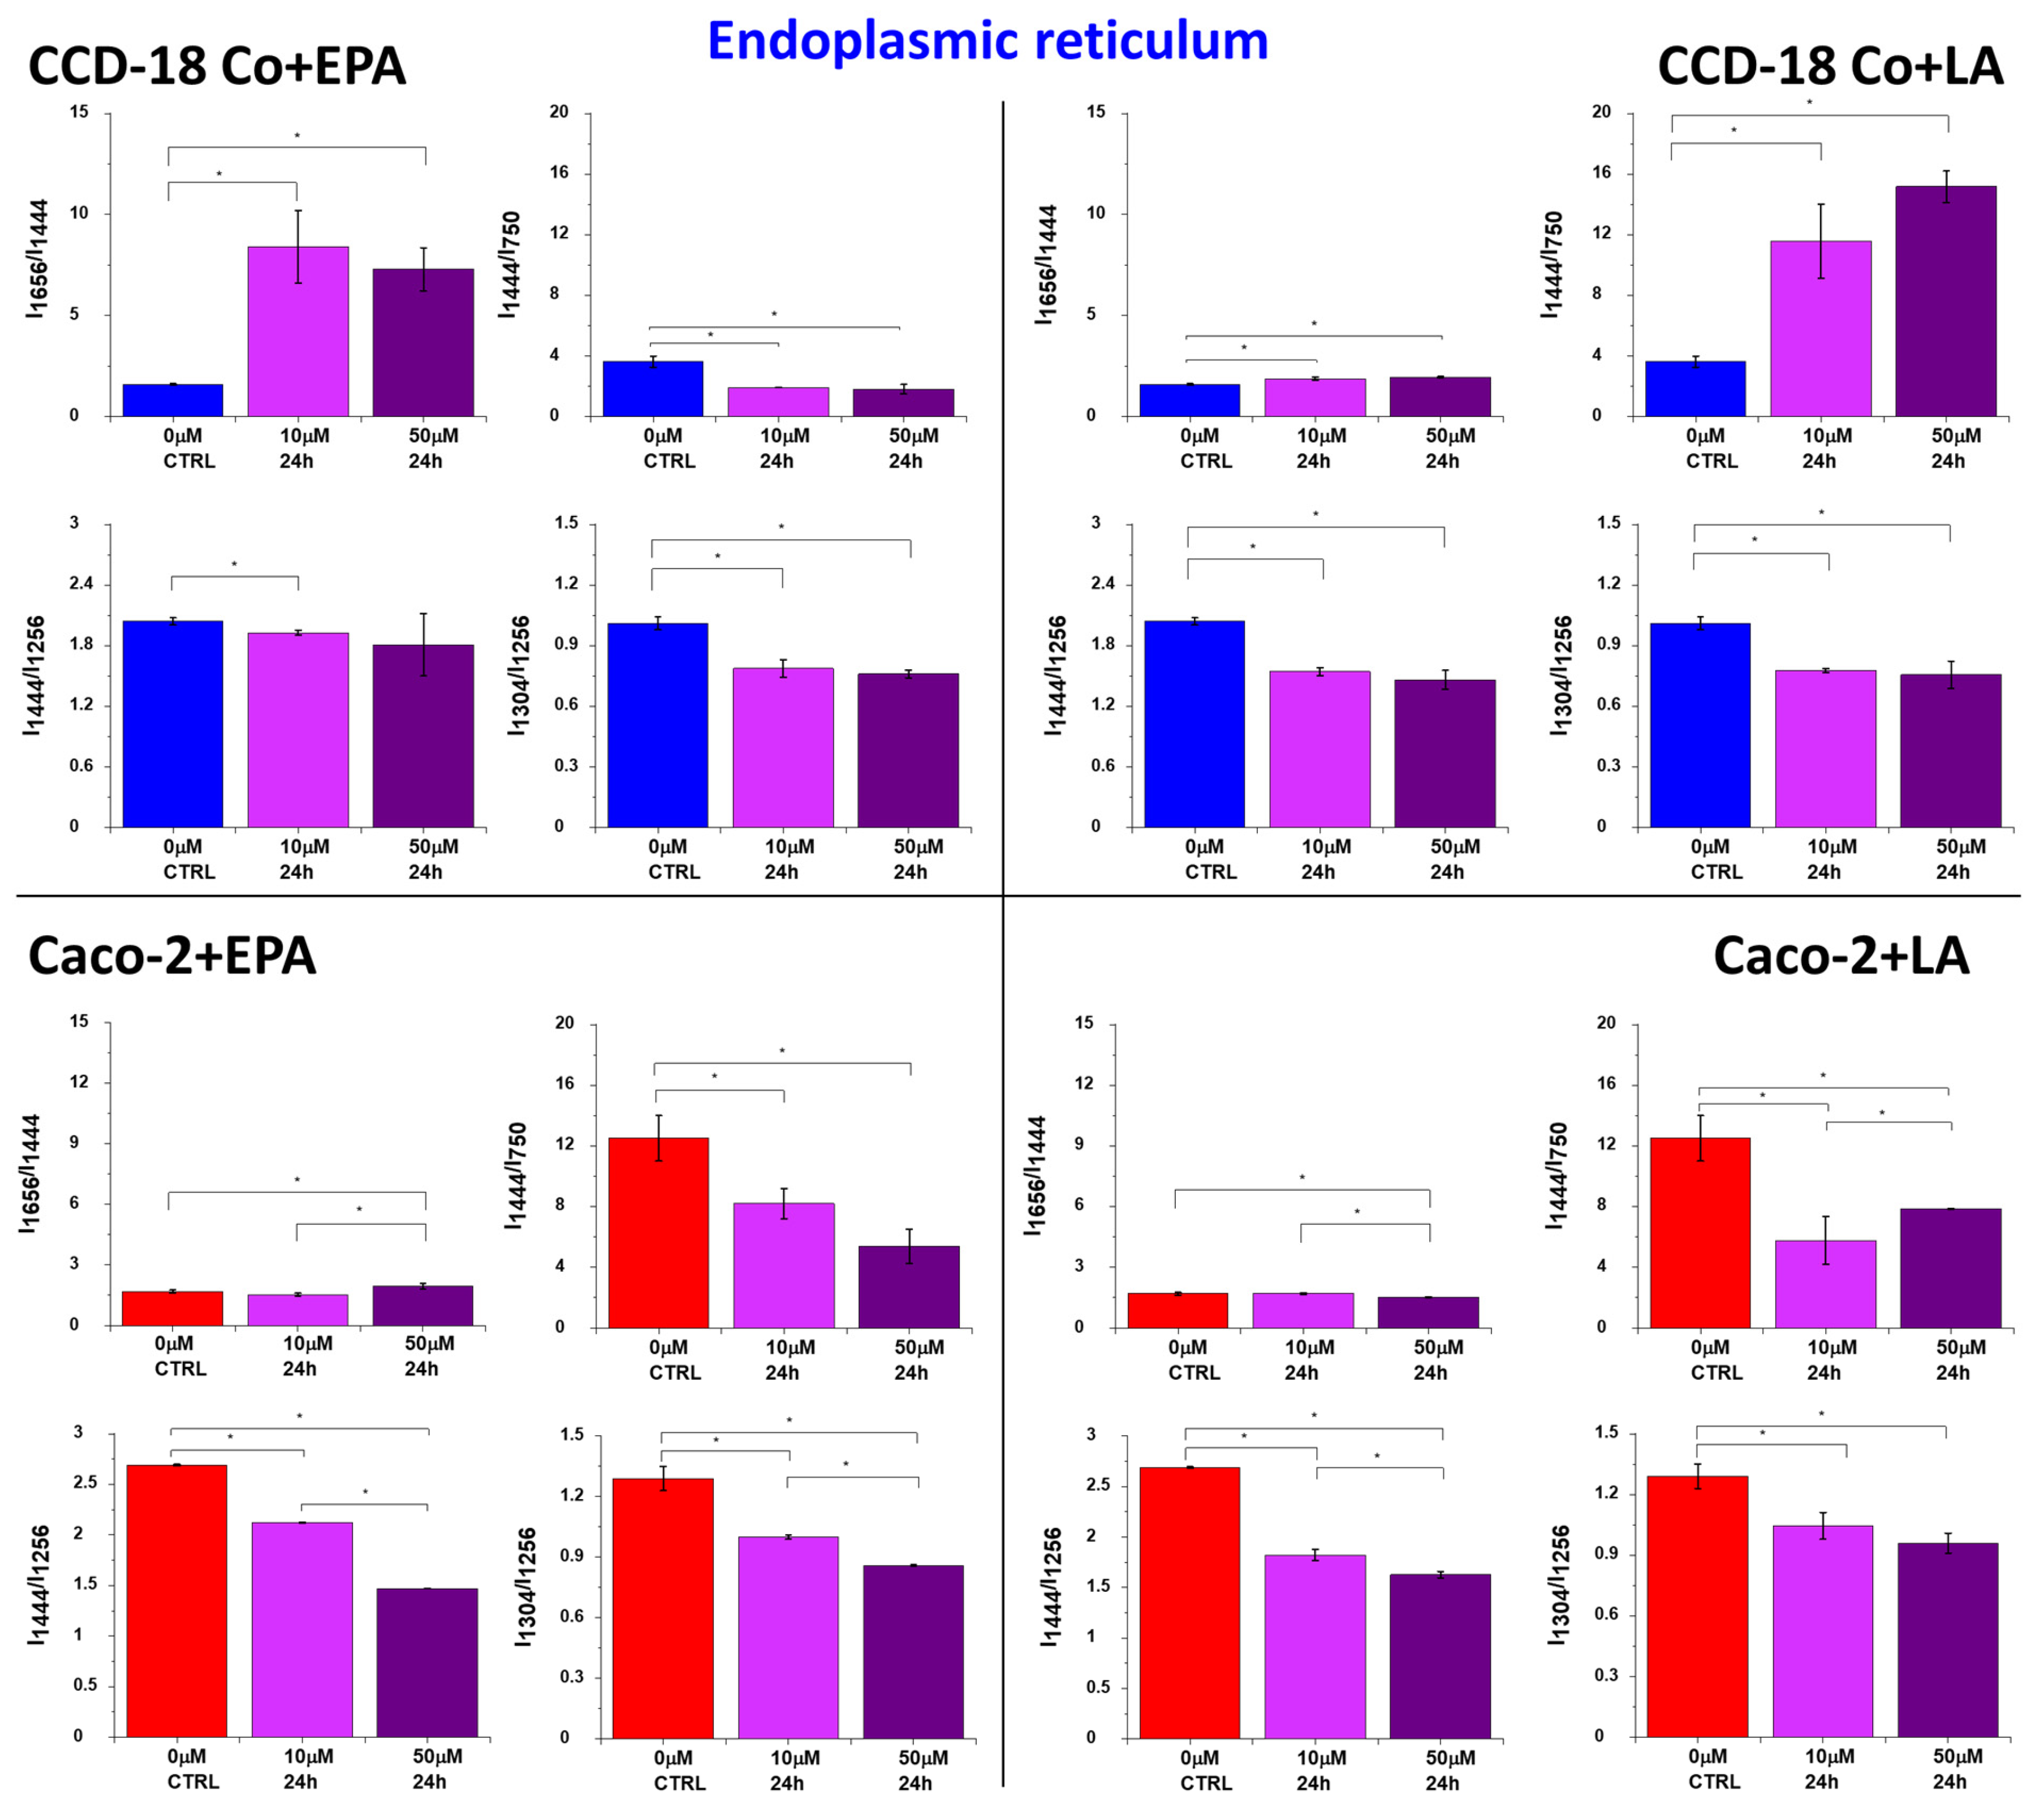
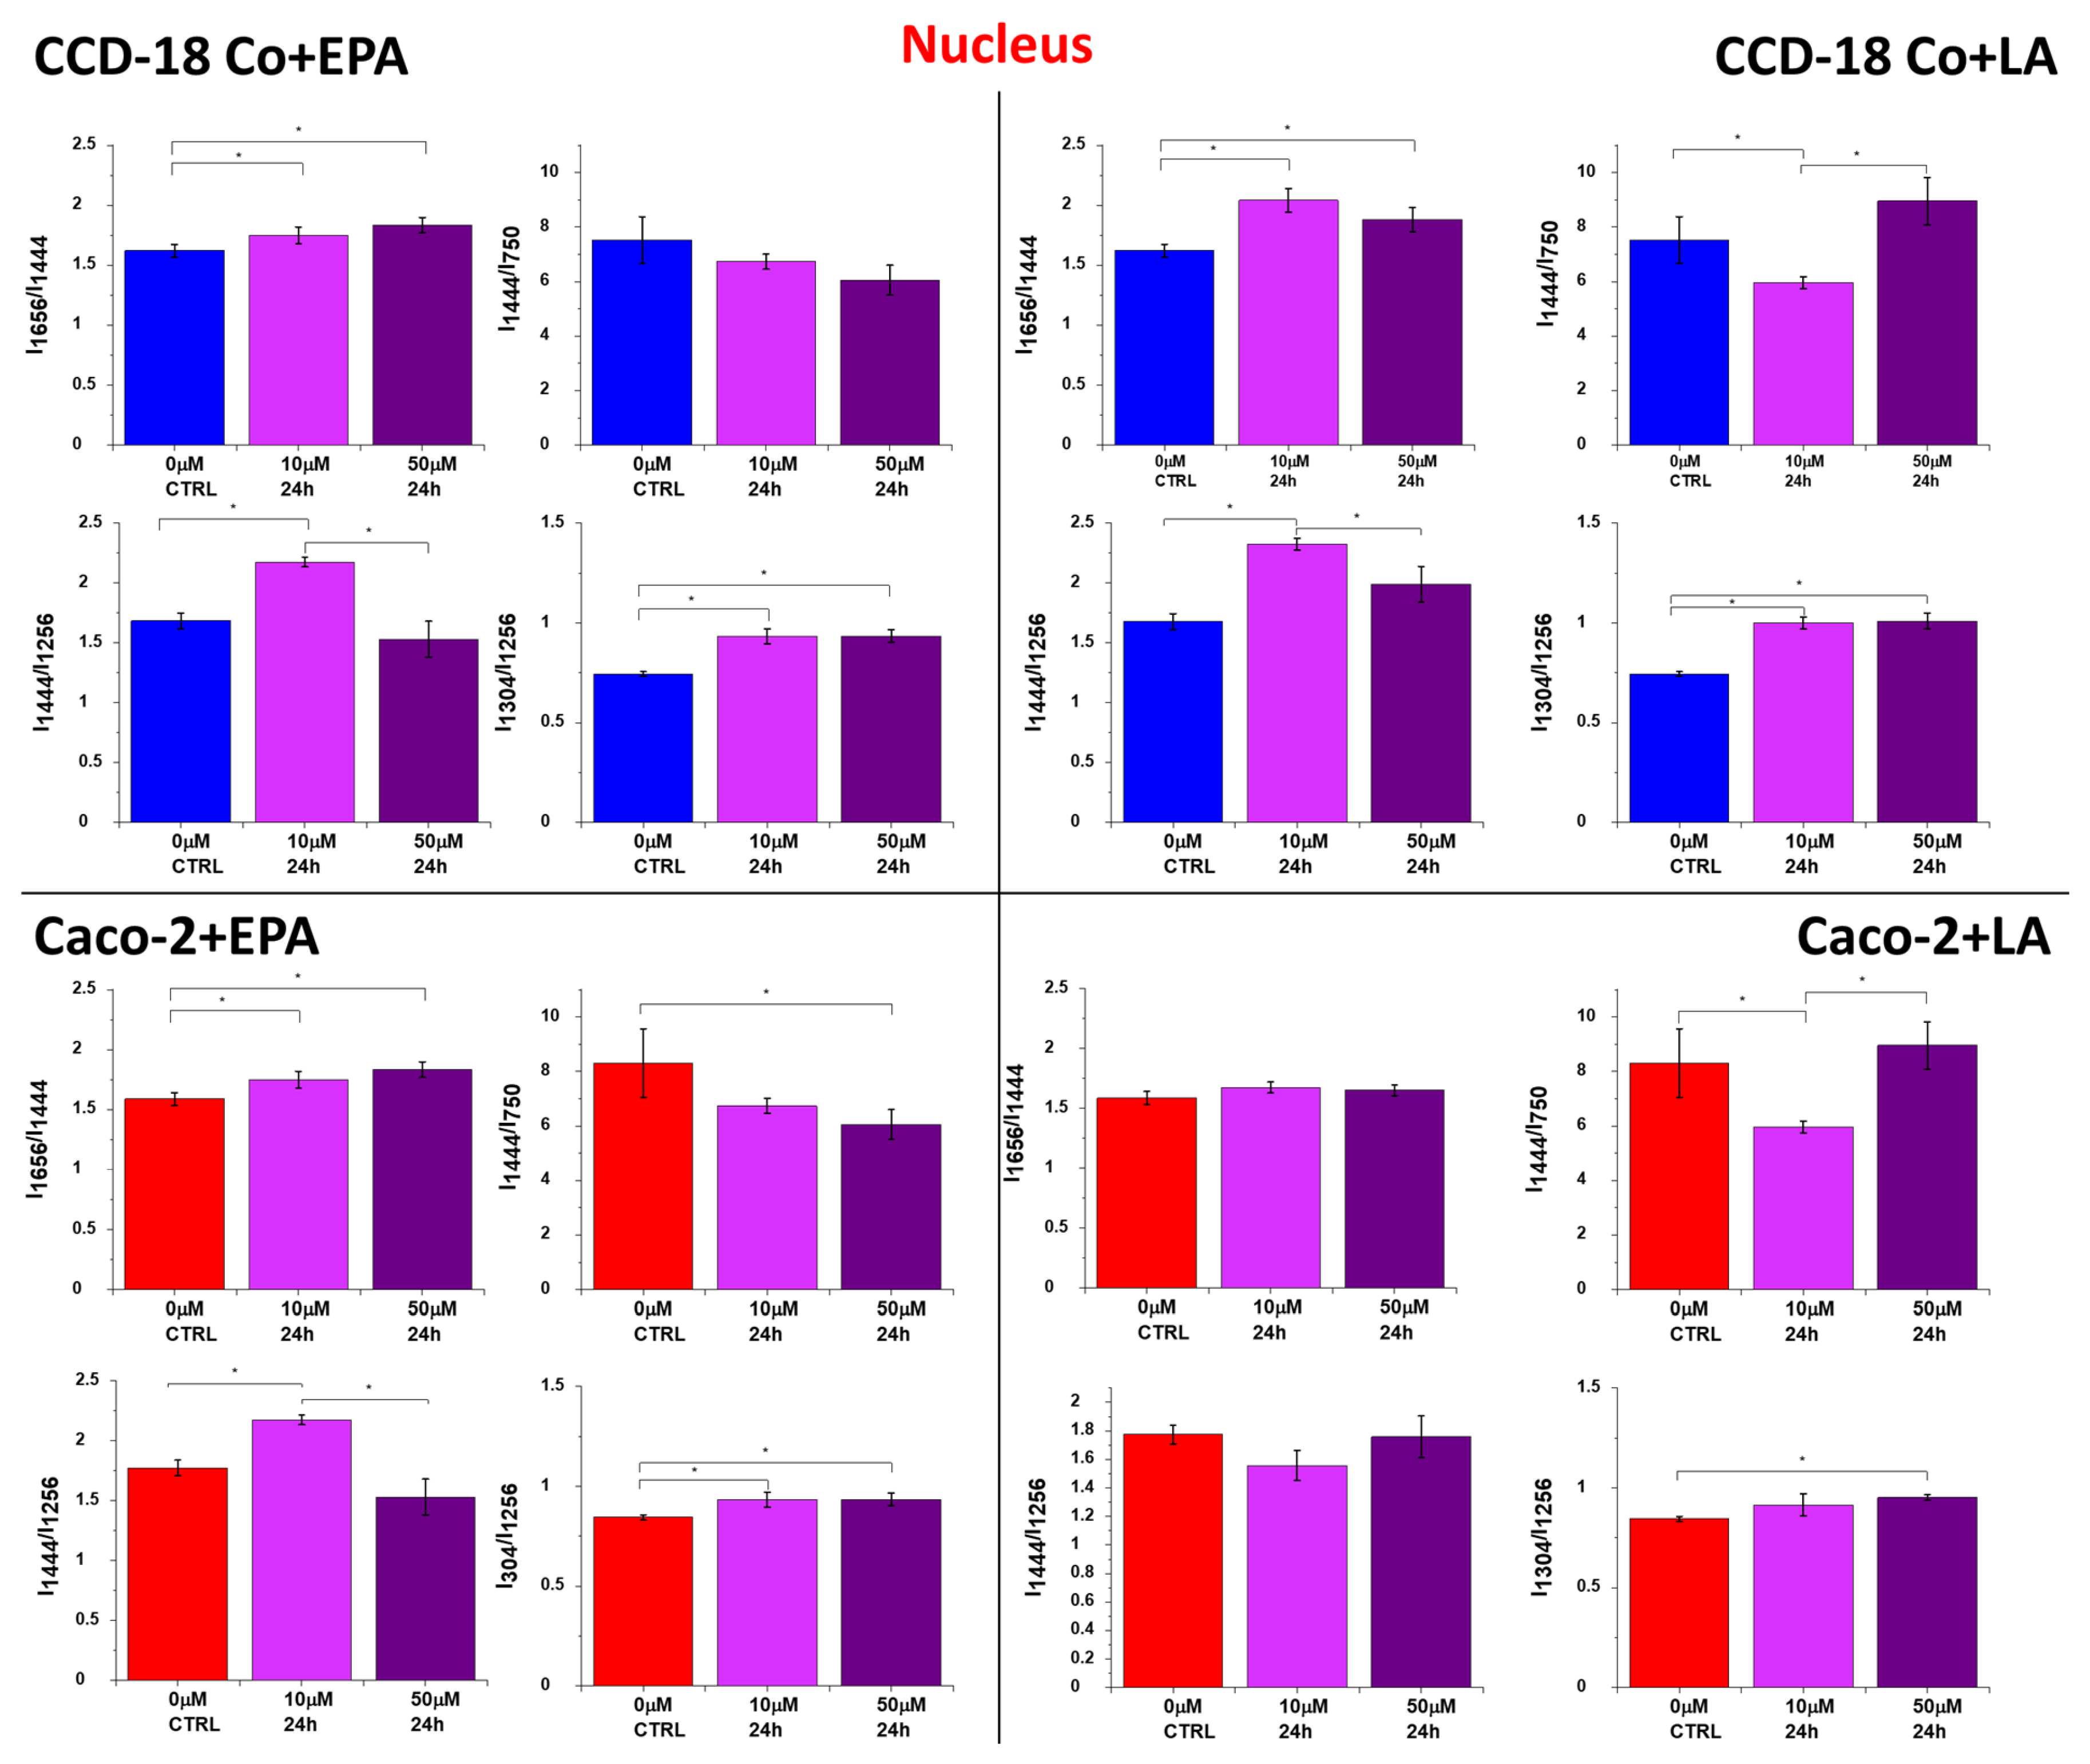
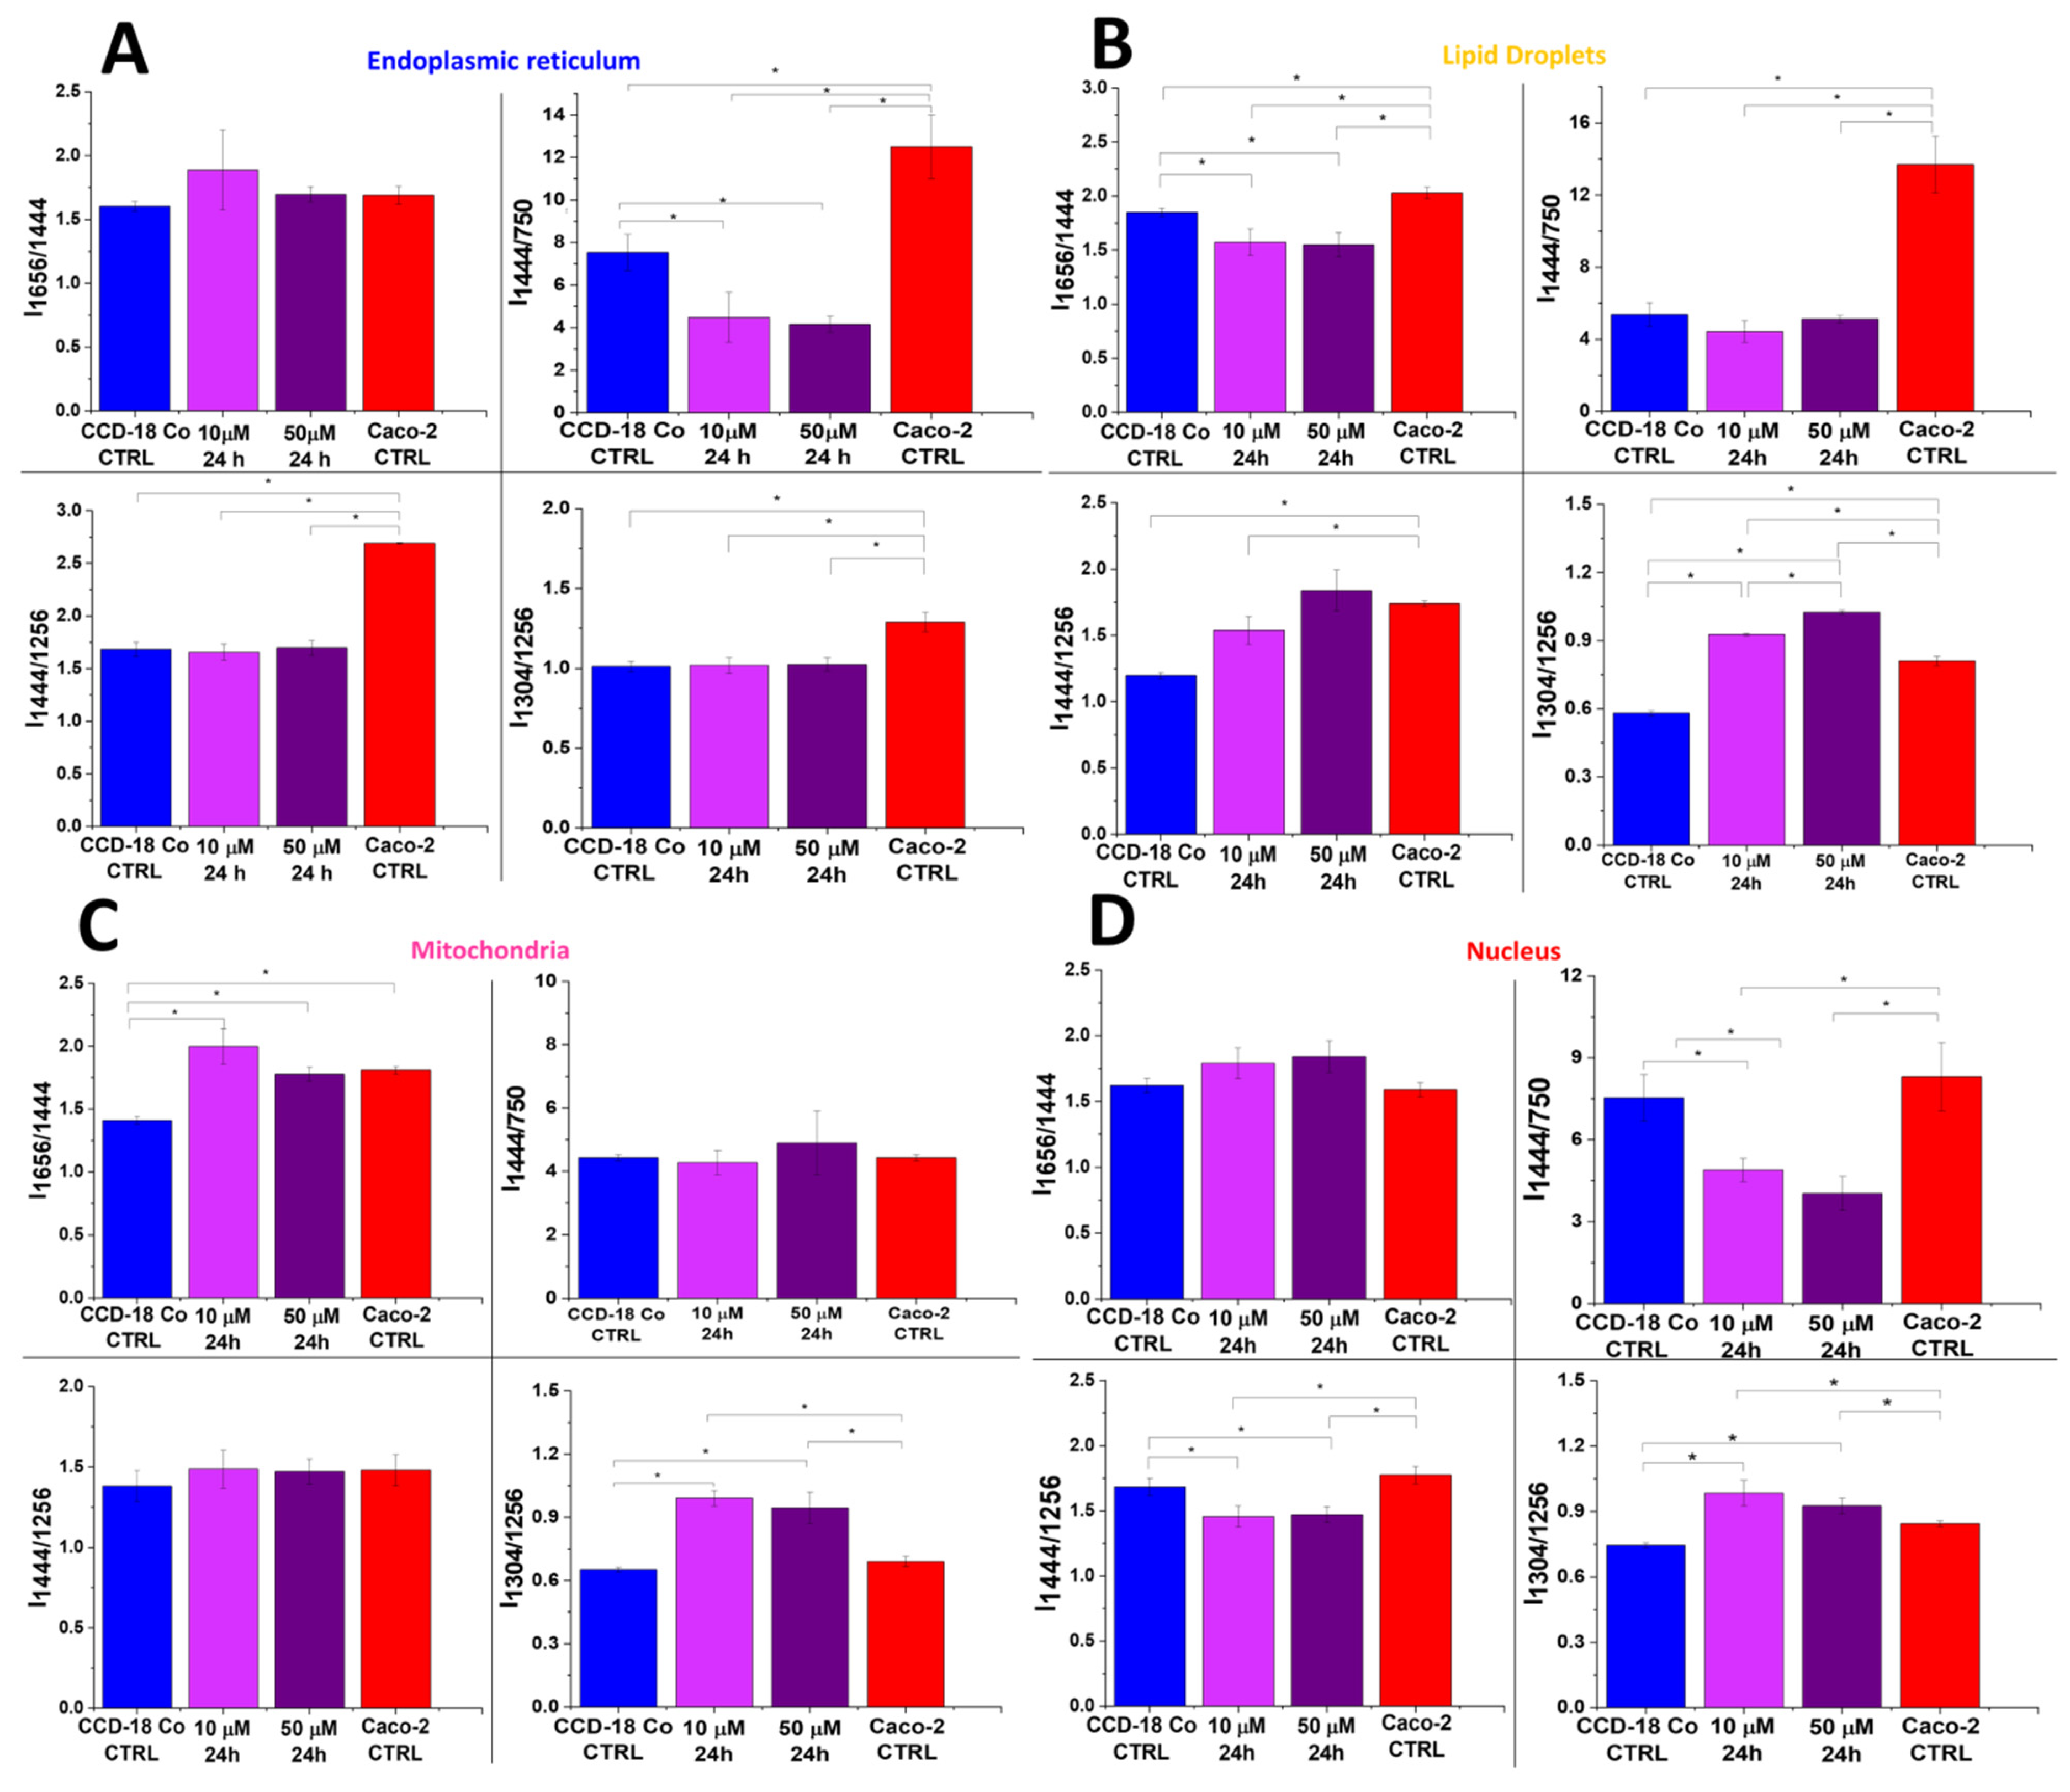
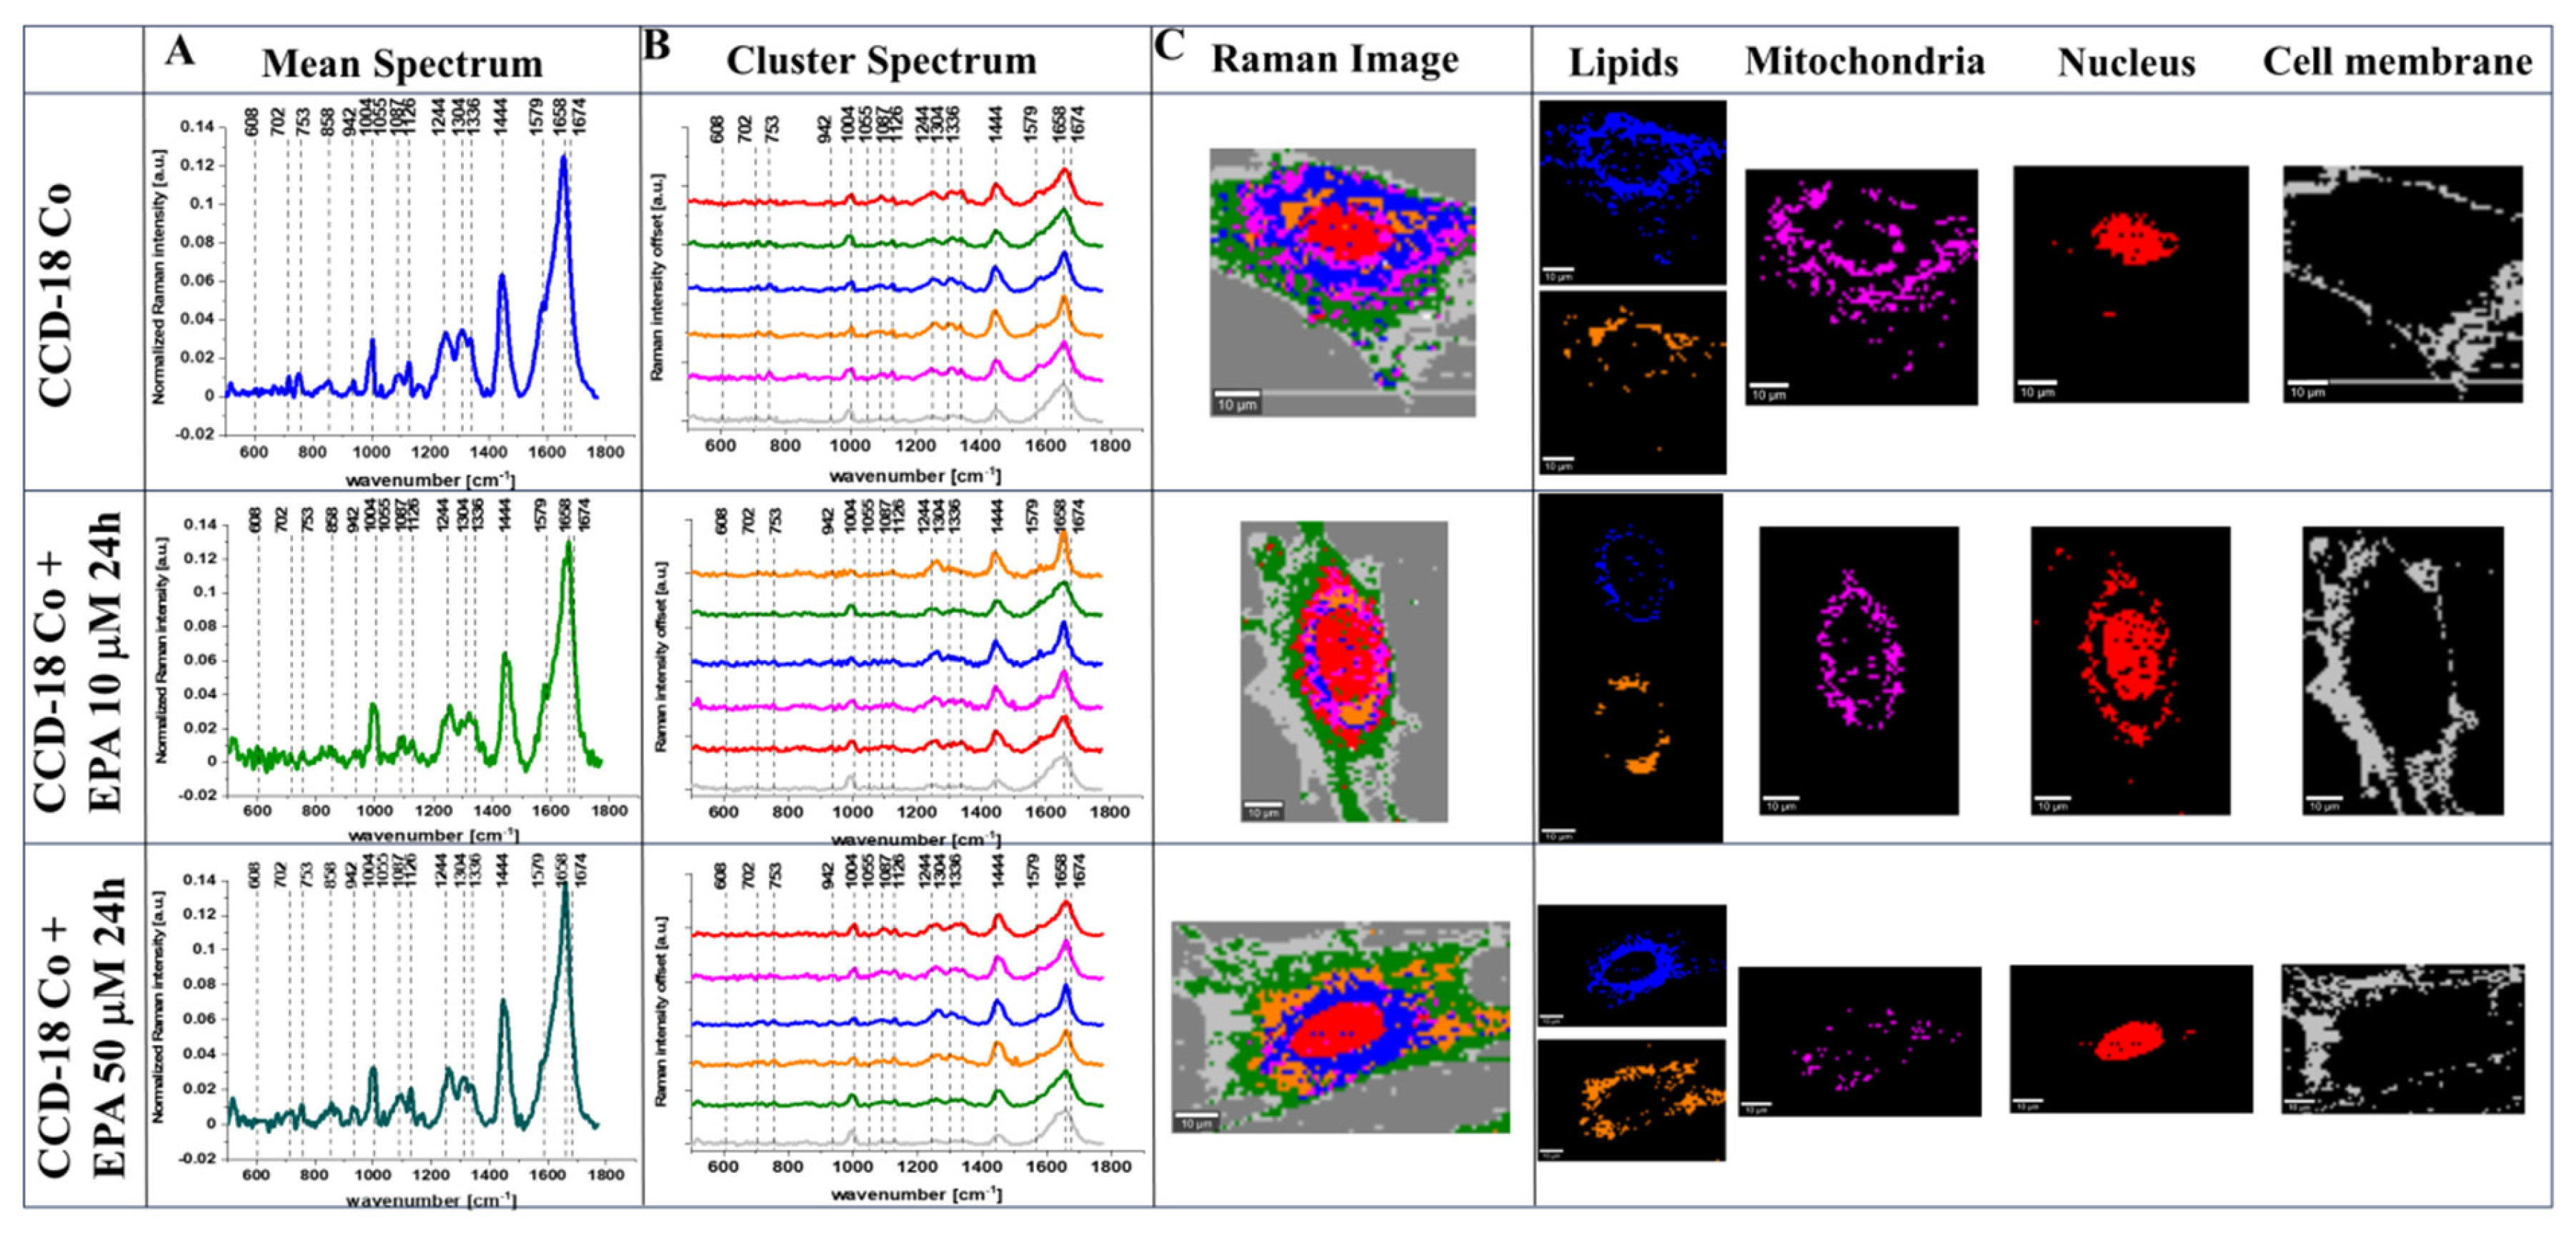
2. Results
3. Discussion
4. Materials and Methods
4.1. Cell Lines and Cell Culture
4.2. Cultivation Conditions
4.3. Raman Imaging
4.4. Determination of the Appropriate Concentration of FAs Using the XTT Test
- For PA: 1 μM, 5 μM, 10 μM, 25 μM, 50 μM, and 100 μM.
- For LA and EPA: 1 μM, 5 μM, 10 μM, 25 μM, 50 μM, and 100 μM.
5. Conclusions
Supplementary Materials
Author Contributions
Funding
Institutional Review Board Statement
Informed Consent Statement
Data Availability Statement
Acknowledgments
Conflicts of Interest
References
- Pakiet, A.; Kobiela, J.; Stepnowski, P.; Sledzinski, T.; Mika, A. Changes in lipids composition and metabolism in colorectal cancer: A review. Lipids Health Dis. 2019, 18, 29. [Google Scholar] [CrossRef] [PubMed]
- Fernández, L.P.; Gómez de Cedrón, M.; Ramírez de Molina, A. Alterations of Lipid Metabolism in Cancer: Implications in Prognosis and Treatment. Front. Oncol. 2020, 10, 577420. [Google Scholar] [CrossRef] [PubMed]
- Hamilton, S.D.; Vogelstein, B.; Kudo, S.; Riboli, E.; Nakamura, S.H.; Hainaut, P.; Rubio, C.A.; Sobin, L.H.; Fogt, F.; Winawer, S.J.; et al. Tumours of the colon and rectum: Carcinoma of the colon and rectum. In World Health Organization Classification of Tumours: Pathology and Genetics of Tumours of the Digestive System; Hamilton, S.R., Aaltonen, L.A., Eds.; IARC Press: Lyon, France, 2000; pp. 105–119. ISBN 92 832 24108. [Google Scholar]
- Laredo, V.; García-Mateo, S.; Martínez-Domínguez, S.J.; López de la Cruz, J.; Gargallo-Puyuelo, C.J.; Gomollón, F. Risk of Cancer in Patients with Inflammatory Bowel Diseases and Keys for Patient Management. Cancers 2023, 15, 871. [Google Scholar] [CrossRef] [PubMed]
- Liu, X.; Jakubowski, M.; Hunt, J.L. KRAS Gene Mutation in Colorectal Cancer Is Correlated with Increased Proliferation and Spontaneous Apoptosis. Am. J. Clin. Pathol. 2011, 135, 245–252. [Google Scholar] [CrossRef] [PubMed]
- Georgescu, C.V.; Sǎftoiu, A.; Georgescu, C.C.; Ciurea, R.; Ciurea, T. Correlations of proliferation markers, p53 expression and histological findings in colorectal carcinoma. J. Gastrointestin. Liver Dis. 2007, 16, 133–139. [Google Scholar] [PubMed]
- Koppenol, W.H.; Bounds, P.L.; Dang, C.V. Otto Warburg’s contributions to current concepts of cancer metabolism. Nat. Rev. Cancer 2011, 11, 325–337. [Google Scholar] [CrossRef]
- Xu, X.D.; Shao, S.X.; Jiang, H.P.; Cao, Y.W.; Wang, Y.H.; Yang, X.C.; Wang, Y.L.; Wang, X.S.; Niu, H.T. Warburg Effect or Reverse Warburg Effect? A Review of Cancer Metabolism. Oncol. Res. Treat. 2015, 38, 117–122. [Google Scholar] [CrossRef] [PubMed]
- LIPID MAPS®. Lipidomics Gateway. Available online: https://www.lipidmaps.org/data/classification/lipid_cns.html (accessed on 13 February 2024).
- Fahy, E.; Cotter, D.; Sud, M.; Subramaniam, S. Lipid classification, structures and tools. Biochim. Biophys. Acta Mol. Cell Biol. Lipids 2011, 1811, 637–647. [Google Scholar] [CrossRef] [PubMed]
- Goodhart, R.S.; Shils, M.E.; Maurice, E.; Goodhart, R.S. Modern Nutrition in Health and Disease, 6th ed.; Lea & Febiger: Philadelphia, PA, USA, 1980; ISBN 0812106458. [Google Scholar]
- Hidalgo, M.A.; Carretta, M.D.; Burgos, R.A. Long Chain Fatty Acids as Modulators of Immune Cells Function: Contribution of FFA1 and FFA4 Receptors. Front. Physiol. 2021, 12, 668330. [Google Scholar] [CrossRef] [PubMed]
- Mthembu, S.X.H.; Mazibuko-Mbeje, S.E.; Silvestri, S.; Orlando, P.; Marcheggiani, F.; Cirilli, I.; Nkambule, B.B.; Muller, C.J.F.; Tiano, L.; Dludla, P.V. Low levels and partial exposure to palmitic acid improves mitochondrial function and the oxidative status of cultured cardiomyoblasts. Toxicol. Rep. 2024, 12, 234–243. [Google Scholar] [CrossRef] [PubMed]
- Carta, G.; Murru, E.; Banni, S.; Manca, C. Palmitic Acid: Physiological Role, Metabolism and Nutritional Implications. Front. Physiol. 2017, 8, 902. [Google Scholar] [CrossRef]
- Murru, E.; Manca, C.; Carta, G.; Banni, S. Impact of Dietary Palmitic Acid on Lipid Metabolism. Front. Nutr. 2022, 9, 861664. [Google Scholar] [CrossRef] [PubMed]
- French, M.A.; Sundram, K.; Clandinin, M.T. Cholesterolaemic effect of palmitic acid in relation to other dietary fatty acids. Asia Pac. J. Clin. Nutr. 2002, 11 (Suppl. 7), S401–S407. [Google Scholar] [CrossRef] [PubMed]
- Annevelink, C.E.; Sapp, P.A.; Petersen, K.S.; Shearer, G.C.; Kris-Etherton, P.M. Diet-derived and diet-related endogenously produced palmitic acid: Effects on metabolic regulation and cardiovascular disease risk. J. Clin. Lipidol. 2023, 17, 577–586. [Google Scholar] [CrossRef] [PubMed]
- Zock, P.L.; De Vries, J.H.M.; Katan, M.B.; Katan, M.B. Impact of Myristic Acid Versus Palmitic Acid on Serum Lipid and Lipoprotein Levels in Healthy Women and Men. Arterioscler. Thromb. 1994, 14, 567–575. [Google Scholar] [CrossRef] [PubMed]
- Nestel, P.; Clifton, P.; Noakes, M. Effects of increasing dietary palmitoleic acid compared with palmitic and oleic acids on plasma lipids of hypercholesterolemic men. J. Lipid Res. 1994, 35, 656–662. [Google Scholar] [CrossRef] [PubMed]
- Shao, T.; Verma, H.K.; Pande, B.; Costanzo, V.; Ye, W.; Cai, Y.; Bhaskar, L.V.K.S. Physical Activity and Nutritional Influence on Immune Function: An Important Strategy to Improve Immunity and Health Status. Front. Physiol. 2021, 12, 751374. [Google Scholar] [CrossRef] [PubMed]
- Dang, Y.; Ma, C.; Chen, K.; Chen, Y.; Jiang, M.; Hu, K.; Li, L.; Zeng, Z.; Zhang, H. The Effects of a High-Fat Diet on Inflammatory Bowel Disease. Biomolecules 2023, 13, 905. [Google Scholar] [CrossRef] [PubMed]
- Tanaka, S.; Nemoto, Y.; Takei, Y.; Morikawa, R.; Oshima, S.; Nagaishi, T.; Okamoto, R.; Tsuchiya, K.; Nakamura, T.; Stutte, S.; et al. High-fat diet-derived free fatty acids impair the intestinal immune system and increase sensitivity to intestinal epithelial damage. Biochem. Biophys. Res. Commun. 2020, 522, 971–977. [Google Scholar] [CrossRef] [PubMed]
- Wang, X.; Zhang, C.; Bao, N. Molecular mechanism of palmitic acid and its derivatives in tumor progression. Front. Oncol. 2023, 13, 1224125. [Google Scholar] [CrossRef] [PubMed]
- Lin, L.; Ding, Y.; Wang, Y.; Wang, Z.; Yin, X.; Yan, G.; Zhang, L.; Yang, P.; Shen, H. Functional lipidomics: Palmitic acid impairs hepatocellular carcinoma development by modulating membrane fluidity and glucose metabolism. Hepatology 2017, 66, 432–448. [Google Scholar] [CrossRef] [PubMed]
- Sun, Q.; Yu, X.; Peng, C.; Liu, N.; Chen, W.; Xu, H.; Wei, H.; Fang, K.; Dong, Z.; Fu, C.; et al. Activation of SREBP-1c alters lipogenesis and promotes tumor growth and metastasis in gastric cancer. Biomed. Pharmacother. 2020, 128, 110274. [Google Scholar] [CrossRef] [PubMed]
- Zhang, L.; Lv, J.; Chen, C.; Wang, X. Roles of acyl-CoA synthetase long-chain family member 5 and colony stimulating factor 2 in inhibition of palmitic or stearic acids in lung cancer cell proliferation and metabolism. Cell Biol. Toxicol. 2021, 37, 15–34. [Google Scholar] [CrossRef] [PubMed]
- Pascual, G.; Domínguez, D.; Benitah, S.A. The contributions of cancer cell metabolism to metastasis. Dis. Model. Mech. 2018, 11, dmm032920. [Google Scholar] [CrossRef] [PubMed]
- Gillingham, L.G.; Harris-Janz, S.; Jones, P.J.H. Dietary Monounsaturated Fatty Acids Are Protective Against Metabolic Syndrome and Cardiovascular Disease Risk Factors. Lipids 2011, 46, 209–228. [Google Scholar] [CrossRef] [PubMed]
- Lunn, J.; Theobald, H.E. The health effects of dietary unsaturated fatty acids. Nutr. Bull. 2006, 31, 178–224. [Google Scholar] [CrossRef]
- Watkins, P.A. Fatty acids: Metabolism. Encycl. Hum. Nutr. 2013, 2–4, 220–230. [Google Scholar] [CrossRef]
- de Souza, C.O.; Teixeira, A.A.S.; Biondo, L.A.; Lima Junior, E.A.; Batatinha, H.A.P.; Rosa Neto, J.C. Palmitoleic Acid Improves Metabolic Functions in Fatty Liver by PPARα-Dependent AMPK Activation. J. Cell. Physiol. 2017, 232, 2168–2177. [Google Scholar] [CrossRef]
- Whelan, J.; Fritsche, K. Linoleic acid. Adv. Nutr. 2013, 4, 311–312. [Google Scholar] [CrossRef] [PubMed]
- Ziboh, V.A. The importance of linoleic acid metabolites in cancer metastasis and in the synthesis and actions of 13-HODE. Adv. Exp. Med. Biol. 1997, 433, 291–294. [Google Scholar] [CrossRef]
- den Hartigh, L.J. Conjugated Linoleic Acid Effects on Cancer, Obesity, and Atherosclerosis: A Review of Pre-Clinical and Human Trials with Current Perspectives. Nutrients 2019, 11, 370. [Google Scholar] [CrossRef] [PubMed]
- Ha, Y.L.; Grimm, N.K.; Pariza, M.W. Anticarcinogens from fried ground beef: Heat-altered derivatives of linoleic acid. Carcinogenesis 1987, 8, 1881–1887. [Google Scholar] [CrossRef] [PubMed]
- Ip, M.M.; Masso-Welch, P.A.; Ip, C. Prevention of mammary cancer with conjugated linoleic acid: Role of the stroma and the epithelium. J. Mammary Gland. Biol. Neoplasia 2003, 8, 103–118. [Google Scholar] [CrossRef] [PubMed]
- Liew, C.; Schut, H.A.J.; Chin, S.F.; Pariza, M.W.; Dashwood, R.H. Protection of conjugated linoleic acids against 2-amino-3-methylimidazo[4,5-f]quinoline-induced colon carcinogenesis in the F344 rat: A study of inhibitory mechanisms. Carcinogenesis 1995, 16, 3037–3043. [Google Scholar] [CrossRef] [PubMed]
- Ha, Y.L.; Storkson, J.; Pariza2, M.W. Inhibition of Benzo(a)pyrene-induced Mouse Forestomach Neoplasia by Conjugated Dienoic Derivatives of Linoleic Acid1. Cancer Res. 1990, 50, 1097–1101. [Google Scholar] [PubMed]
- Cesano, A.; Visonneau, S.; Scimeca, J.A.; Kritchevsky, D.; Santoli, D. Opposite effects of linoleic acid and conjugated linoleic acid on human prostatic cancer in SCID mice. Anticancer Res. 1998, 18, 1429–1434. [Google Scholar] [PubMed]
- Lucanic, M.; Held, J.M.; Vantipalli, M.C.; Klang, I.M.; Graham, J.B.; Gibson, B.W.; Lithgow, G.J.; Gill, M.S. N-acylethanolamine signalling mediates the effect of diet on lifespan in Caenorhabditis elegans. Nature 2011, 473, 226–229. [Google Scholar] [CrossRef] [PubMed]
- Bie, N.; Han, L.; Meng, M.; Zhang, Y.; Guo, M.; Wang, C. Anti-tumor mechanism of eicosapentaenoic acid (EPA) on ovarian tumor model by improving the immunomodulatory activity in F344 rats. J. Funct. Foods 2020, 65, 103739. [Google Scholar] [CrossRef]
- Ando, N.; Hara, M.; Shiga, K.; Yanagita, T.; Takasu, K.; Nakai, N.; Maeda, Y.; Hirokawa, T.; Takahashi, H.; Ishiguro, H.; et al. Eicosapentaenoic acid suppresses angiogenesis via reducing secretion of IL-6 and VEGF from colon cancer-associated fibroblasts. Oncol. Rep. 2019, 42, 339–349. [Google Scholar] [CrossRef] [PubMed]
- Olaf, A. Dietary fatty acids and immune reactions in synovial tissue—PubMed. Eur. J. Med. Res. 2003, 8, 381–387. [Google Scholar]
- Pappalardo, G.; Almeida, A.; Ravasco, P. Eicosapentaenoic acid in cancer improves body composition and modulates metabolism. Nutrition 2015, 31, 549–555. [Google Scholar] [CrossRef] [PubMed]
- Uematsu, M.; Kita, Y.; Shimizu, T.; Shindou, H. Multiplex fatty acid imaging inside cells by Raman microscopy. FASEB J. 2020, 34, 10357–10372. [Google Scholar] [CrossRef] [PubMed]
- Uematsu, M.; Shimizu, T. Raman microscopy-based quantification of the physical properties of intracellular lipids. Commun. Biol. 2021, 4, 1176. [Google Scholar] [CrossRef] [PubMed]
- Paramitha, P.N.; Zakaria, R.; Maryani, A.; Kusaka, Y.; Andriana, B.B.; Hashimoto, K.; Nakazawa, H.; Kato, S.; Sato, H. Raman study on lipid droplets in hepatic cells co-cultured with fatty acids. Int. J. Mol. Sci. 2021, 22, 7378. [Google Scholar] [CrossRef] [PubMed]
- Toledo, D.A.M.; Roque, N.R.; Teixeira, L.; Milán-Garcés, E.A.; Carneiro, A.B.; Almeida, M.R.; Andrade, G.F.S.; Martins, J.S.; Pinho, R.R.; Freire-de-Lima, C.G.; et al. Lipid Body Organelles within the Parasite Trypanosoma cruzi: A Role for Intracellular Arachidonic Acid Metabolism. PLoS ONE 2016, 11, e0160433. [Google Scholar] [CrossRef] [PubMed]
- Majzner, K.; Kochan, K.; Kachamakova-Trojanowska, N.; Maslak, E.; Chlopicki, S.; Baranska, M. Raman imaging providing insights into chemical composition of lipid droplets of different size and origin: In hepatocytes and endothelium. Anal. Chem. 2014, 86, 6666–6674. [Google Scholar] [CrossRef]
- Rensonnet, A.; Tipping, W.J.; Malherbe, C.; Faulds, K.; Eppe, G.; Graham, D. Spectral fingerprinting of cellular lipid droplets using stimulated Raman scattering microscopy and chemometric analysis. Analyst 2024, 149, 553–562. [Google Scholar] [CrossRef] [PubMed]
- Czamara, K.; Majzner, K.; Selmi, A.; Baranska, M.; Ozaki, Y.; Kaczor, A. Unsaturated lipid bodies as a hallmark of inflammation studied by Raman 2D and 3D microscopy. Sci. Rep. 2017, 7, 40889. [Google Scholar] [CrossRef] [PubMed]
- Fu, D.; Yu, Y.; Folick, A.; Currie, E.; Farese, R.V.; Tsai, T.H.; Xie, X.S.; Wang, M.C. In vivo metabolic fingerprinting of neutral lipids with hyperspectral stimulated raman scattering microscopy. J. Am. Chem. Soc. 2014, 136, 8820–8828. [Google Scholar] [CrossRef]
- Majzner, K.; Tott, S.; Roussille, L.; Deckert, V.; Chlopicki, S.; Baranska, M. Uptake of fatty acids by a single endothelial cell investigated by Raman spectroscopy supported by AFM. Analyst 2018, 143, 970–980. [Google Scholar] [CrossRef]
- Park, J.M.; Jeong, M.; Kim, E.H.; Han, Y.M.; Kwon, S.H.; Hahm, K.B. Omega-3 Polyunsaturated Fatty Acids Intake to Regulate Helicobacter pylori-Associated Gastric Diseases as Nonantimicrobial Dietary Approach. Biomed. Res. Int. 2015, 2015, 712363. [Google Scholar] [CrossRef]
- Park, M.; Kim, H. Anti-cancer Mechanism of Docosahexaenoic Acid in Pancreatic Carcinogenesis: A Mini-review. J. Cancer Prev. 2017, 22, 1. [Google Scholar] [CrossRef] [PubMed]
- Ding, Y.; Mullapudi, B.; Torres, C.; Mascariñas, E.; Mancinelli, G.; Diaz, A.M.; McKinney, R.; Barron, M.; Schultz, M.; Heiferman, M.; et al. Omega-3 Fatty Acids Prevent Early Pancreatic Carcinogenesis via Repression of the AKT Pathway. Nutrients 2018, 10, 1289. [Google Scholar] [CrossRef] [PubMed]
- Calviello, G.; Resci, F.; Serini, S.; Piccioni, E.; Toesca, A.; Boninsegna, A.; Monego, G.; Ranelletti, F.O.; Palozza, P. Docosahexaenoic acid induces proteasome-dependent degradation of beta-catenin, down-regulation of survivin and apoptosis in human colorectal cancer cells not expressing COX-2. Carcinogenesis 2007, 28, 1202–1209. [Google Scholar] [CrossRef] [PubMed]
- Stephenson, J.A.; Al-Taan, O.; Arshad, A.; Morgan, B.; Metcalfe, M.S.; Dennison, A.R. The Multifaceted Effects of Omega-3 Polyunsaturated Fatty Acids on the Hallmarks of Cancer. J. Lipids 2013, 2013, 261247. [Google Scholar] [CrossRef]
- Harris, E. Higher Levels of Omega-3 Fatty Acids Linked to Improved Lung Health. JAMA 2023, 330, 685. [Google Scholar] [CrossRef] [PubMed]
- Gerber, M. Omega-3 fatty acids and cancers: A systematic update review of epidemiological studies. Br. J. Nutr. 2012, 107, S228–S239. [Google Scholar] [CrossRef] [PubMed]
- Sun, H.; Berquin, I.M.; Owens, R.T.; O’Flaherty, J.T.; Edwards, I.J. Peroxisome proliferator-activated receptor gamma-mediated up-regulation of syndecan-1 by n-3 fatty acids promotes apoptosis of human breast cancer cells. Cancer Res. 2008, 68, 2912–2919. [Google Scholar] [CrossRef] [PubMed]
- Gu, Z.; Suburu, J.; Chen, H.; Chen, Y.Q. Mechanisms of omega-3 polyunsaturated fatty acids in prostate cancer prevention. Biomed. Res. Int. 2013, 2013, 824563. [Google Scholar] [CrossRef] [PubMed]
- Goncalves, M.D.; Hopkins, B.D.; Cantley, L.C. Dietary Fat and Sugar in Promoting Cancer Development and Progression. Annu. Rev. 2019, 3, 255–273. [Google Scholar] [CrossRef]
- Avgerinos, K.I.; Spyrou, N.; Mantzoros, C.S.; Dalamaga, M. Obesity and cancer risk: Emerging biological mechanisms and perspectives. Metabolism 2019, 92, 121–135. [Google Scholar] [CrossRef]
- Toporski, J.; Dieing, T.; Hollricher, O. (Eds.) Confocal Raman Microscopy, 2nd ed.; Springer Nature: Berlin/Heidelberg, Germany, 2018; Volume 66, ISBN 3319753789. [Google Scholar]
- Brozek-Pluska, B.; Beton, K. Oxidative stress induced by: T BHP in human normal colon cells by label free Raman spectroscopy and imaging. The protective role of natural antioxidants in the form of β-carotene. RSC Adv. 2021, 11, 16419–16434. [Google Scholar] [CrossRef] [PubMed]
- Beton, K.; Brozek-Pluska, B. Vitamin C—Protective Role in Oxidative Stress Conditions Induced in Human Normal Colon Cells by Label-Free Raman Spectroscopy and Imaging. Int. J. Mol. Sci. 2021, 22, 6928. [Google Scholar] [CrossRef] [PubMed]
- Beton, K.; Brożek-Płuska, B. Biochemistry and Nanomechanical Properties of Human Colon Cells upon Simvastatin, Lovastatin, and Mevastatin Supplementations: Raman Imaging and AFM Studies. J. Phys. Chem. B 2022, 126, 7088–7103. [Google Scholar] [CrossRef] [PubMed]
- Surmacki, J.M. Monitoring the effect of therapeutic doses of gamma irradiation on medulloblastoma by Raman spectroscopy. Anal. Methods 2020, 12, 383–391. [Google Scholar] [CrossRef]
- Beton-Mysur, K.; Brożek-Płuska, B. A new modality for cholesterol impact tracking in colon cancer development—Raman imaging, fluorescence and AFM studies combined with chemometric analysis. Anal. Methods 2023, 15, 5199–5217. [Google Scholar] [CrossRef] [PubMed]
- Tolstik, E.; Gongalsky, M.B.; Dierks, J.; Brand, T.; Pernecker, M.; Pervushin, N.V.; Maksutova, D.E.; Gonchar, K.A.; Samsonova, J.V.; Kopeina, G.; et al. Raman and fluorescence micro-spectroscopy applied for the monitoring of sunitinib-loaded porous silicon nanocontainers in cardiac cells. Front. Pharmacol. 2022, 13, 962763. [Google Scholar] [CrossRef] [PubMed]
- Voros, C.; Bauer, D.; Migh, E.; Grexa, I.; Végh, A.G.; Szalontai, B.; Castellani, G.; Danka, T.; Dzeroski, S.; Koos, K.; et al. Correlative Fluorescence and Raman Microscopy to Define Mitotic Stages at the Single-Cell Level: Opportunities and Limitations in the AI Era. Biosensors 2023, 13, 187. [Google Scholar] [CrossRef] [PubMed]
- Matthäus, C.; Chernenko, T.; Newmark, J.A.; Warner, C.M.; Diem, M. Label-free detection of mitochondrial distribution in cells by nonresonant Raman microspectroscopy. Biophys. J. 2007, 93, 668–673. [Google Scholar] [CrossRef] [PubMed]
- Lin, J.; Graziotto, M.E.; Lay, P.A.; New, E.J. A bimodal fluorescence-raman probe for cellular imaging. Cells 2021, 10, 1699. [Google Scholar] [CrossRef] [PubMed]
- Van Manen, H.J.; Kraan, Y.M.; Roos, D.; Otto, C. Single-cell Raman and fluorescence microscopy reveal the association of lipid bodies with phagosomes in leukocytes. Proc. Natl. Acad. Sci. USA 2005, 102, 10159–10164. [Google Scholar] [CrossRef] [PubMed]
- Tadros, S.; Shukla, S.K.; King, R.J.; Gunda, V.; Vernucci, E.; Abrego, J.; Chaika, N.V.; Yu, F.; Lazenby, A.J.; Berim, L.; et al. De Novo Lipid Synthesis Facilitates Gemcitabine Resistance through Endoplasmic Reticulum Stress in Pancreatic Cancer. Cancer Res. 2017, 77, 5503–5517. [Google Scholar] [CrossRef] [PubMed]
- Iwamoto, H.; Abe, M.; Yang, Y.; Cui, D.; Seki, T.; Nakamura, M.; Hosaka, K.; Lim, S.; Wu, J.; He, X.; et al. Cancer Lipid Metabolism Confers Antiangiogenic Drug Resistance. Cell Metab. 2018, 28, 104–117.e5. [Google Scholar] [CrossRef] [PubMed]
- Cotte, A.K.; Aires, V.; Fredon, M.; Limagne, E.; Derangère, V.; Thibaudin, M.; Humblin, E.; Scagliarini, A.; De Barros, J.P.P.; Hillon, P.; et al. Lysophosphatidylcholine acyltransferase 2-mediated lipid droplet production supports colorectal cancer chemoresistance. Nat. Commun. 2018, 9, 322. [Google Scholar] [CrossRef] [PubMed]
- Bartz, R.; Li, W.H.; Venables, B.; Zehmer, J.K.; Roth, M.R.; Welti, R.; Anderson, R.G.W.; Liu, P.; Chapman, K.D. Lipidomics reveals that adiposomes store ether lipids and mediate phospholipid traffic. J. Lipid Res. 2007, 48, 837–847. [Google Scholar] [CrossRef] [PubMed]
- Martin, S.; Parton, R.G. Caveolin, cholesterol, and lipid bodies. Semin. Cell Dev. Biol. 2005, 16, 163–174. [Google Scholar] [CrossRef] [PubMed]
- Brasaemle, D.L. Thematic review series: Adipocyte Biology. The perilipin family of structural lipid droplet proteins: Stabilization of lipid droplets and control of lipolysis. J. Lipid Res. 2007, 48, 2547–2559. [Google Scholar] [CrossRef] [PubMed]
- Kimmel, A.R.; Brasaemle, D.L.; McAndrews-Hill, M.; Sztalryd, C.; Londos, C. Adoption of PERILIPIN as a unifying nomenclature for the mammalian PAT-family of intracellular lipid storage droplet proteins. J. Lipid Res. 2010, 51, 468–471. [Google Scholar] [CrossRef] [PubMed]
- Sun, N.; Zhao, X. Therapeutic Implications of FABP4 in Cancer: An Emerging Target to Tackle Cancer. Front. Pharmacol. 2022, 13, 948610. [Google Scholar] [CrossRef] [PubMed]
- Lau, E.; Marques, C.; Pestana, D.; Santoalha, M.; Carvalho, D.; Freitas, P.; Calhau, C. The role of I-FABP as a biomarker of intestinal barrier dysfunction driven by gut microbiota changes in obesity. Nutr. Metab. 2016, 13, 31. [Google Scholar] [CrossRef] [PubMed]
- Mahmood, A.; Faisal, M.N.; Khan, J.A.; Muzaffar, H.; Muhammad, F.; Hussain, J.; Aslam, J.; Anwar, H. Association of a high-fat diet with I-FABP as a biomarker of intestinal barrier dysfunction driven by metabolic changes in Wistar rats. Lipids Health Dis. 2023, 22, 68. [Google Scholar] [CrossRef] [PubMed]
- Beton, K.; Wysocki, P.; Brozek-Pluska, B. Mevastatin in colon cancer by spectroscopic and microscopic methods—Raman imaging and AFM studies. Spectrochim. Acta Part A Mol. Biomol. Spectrosc. 2022, 270, 120726. [Google Scholar] [CrossRef] [PubMed]
- Kopec, M.; Beton-Mysur, K.; Abramczyk, H. Raman imaging and chemometric methods in human normal bronchial and cancer lung cells: Raman biomarkers of lipid reprogramming. Chem. Phys. Lipids 2023, 257, 105339. [Google Scholar] [CrossRef] [PubMed]
- Kopec, M.; Beton-Mysur, K. The role of glucose and fructose on lipid droplet metabolism in human normal bronchial and cancer lung cells by Raman spectroscopy. Chem. Phys. Lipids 2024, 259, 105375. [Google Scholar] [CrossRef] [PubMed]


| Pearson Correlation Coefficient | p-Value | |
|---|---|---|
| Mean Raman spectrum of | CCD-18 Co cells | |
| CCD-18 Co + EPA 10 μM, 24 h | 0.98592 | <0.05 |
| CCD-18 Co + EPA 50 μM, 24 h | 0.98073 | <0.05 |
| CCD-18 Co + LA 10 μM, 24 h | 0.97283 | <0.05 |
| CCD-18 Co + LA 50 μM, 24 h | 0.97381 | <0.05 |
| CCD-18 Co + PA 10 μM, 24 h | 0.98524 | <0.05 |
| CCD-18 Co + PA 50 μM, 24 h | 0.98133 | <0.05 |
| Caco-2 cells | ||
| Caco-2 + EPA 10 μM, 24 h | 0.99138 | <0.05 |
| Caco-2 + EPA 50 μM, 24 h | 0.95889 | <0.05 |
| Caco-2 + LA 10 μM, 24 h | 0.96872 | <0.05 |
| Caco-2 + LA 50 μM, 24 h | 0.96572 | <0.05 |
| CCD-18 Co + PA 10 μM, 24 h | 0.96862 | <0.05 |
| CCD-18 Co + PA 50 μM, 24 h | 0.98119 | <0.05 |
Disclaimer/Publisher’s Note: The statements, opinions and data contained in all publications are solely those of the individual author(s) and contributor(s) and not of MDPI and/or the editor(s). MDPI and/or the editor(s) disclaim responsibility for any injury to people or property resulting from any ideas, methods, instructions or products referred to in the content. |
© 2024 by the authors. Licensee MDPI, Basel, Switzerland. This article is an open access article distributed under the terms and conditions of the Creative Commons Attribution (CC BY) license (https://creativecommons.org/licenses/by/4.0/).
Share and Cite
Beton-Mysur, K.; Kopec, M.; Brozek-Pluska, B. Raman Imaging—A Valuable Tool for Tracking Fatty Acid Metabolism—Normal and Cancer Human Colon Single-Cell Study. Int. J. Mol. Sci. 2024, 25, 4508. https://doi.org/10.3390/ijms25084508
Beton-Mysur K, Kopec M, Brozek-Pluska B. Raman Imaging—A Valuable Tool for Tracking Fatty Acid Metabolism—Normal and Cancer Human Colon Single-Cell Study. International Journal of Molecular Sciences. 2024; 25(8):4508. https://doi.org/10.3390/ijms25084508
Chicago/Turabian StyleBeton-Mysur, Karolina, Monika Kopec, and Beata Brozek-Pluska. 2024. "Raman Imaging—A Valuable Tool for Tracking Fatty Acid Metabolism—Normal and Cancer Human Colon Single-Cell Study" International Journal of Molecular Sciences 25, no. 8: 4508. https://doi.org/10.3390/ijms25084508