
Free Radical–Associated Gene Signature Predicts Survival in Sepsis Patients
 , and
, and
Abstract
:
1. Introduction
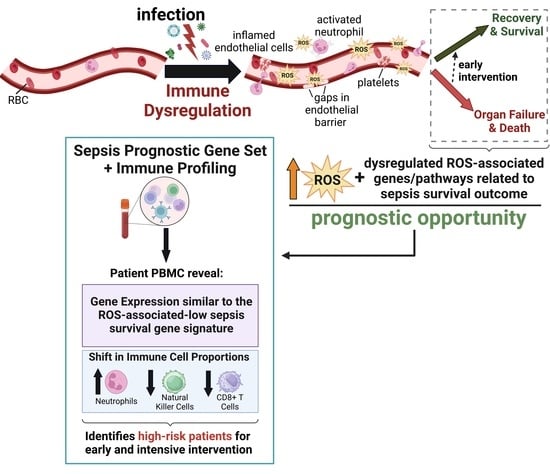
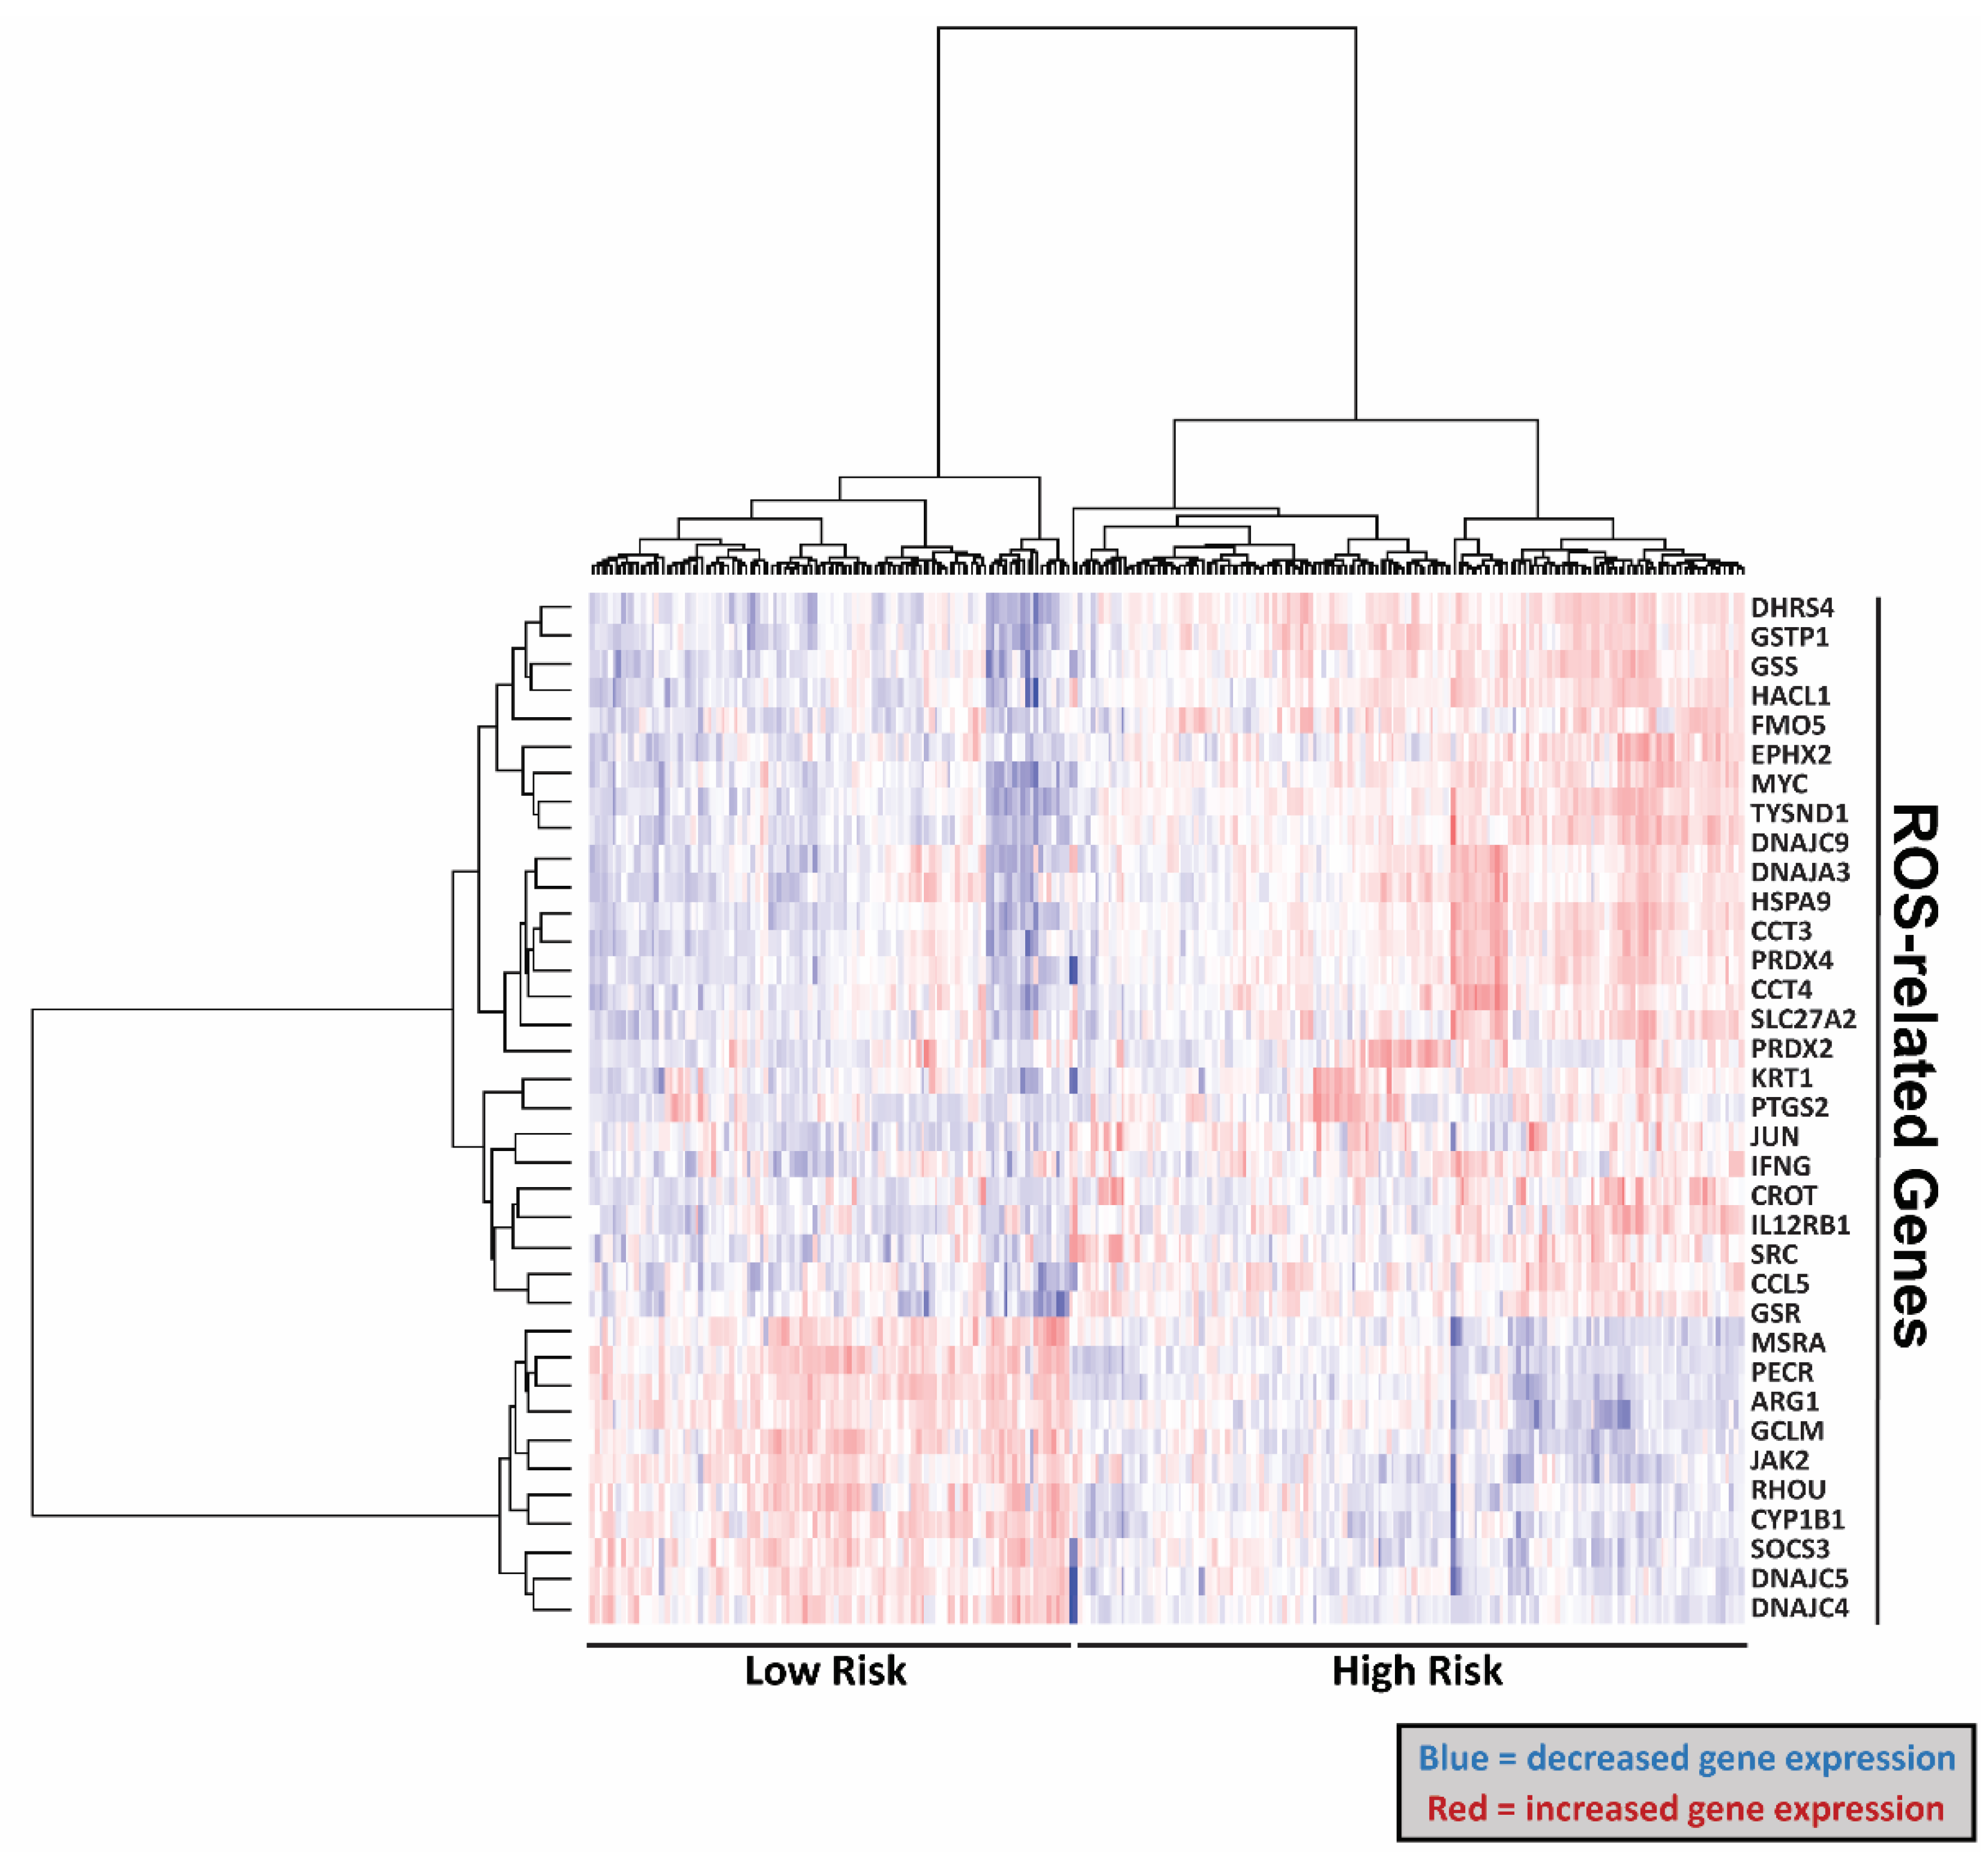
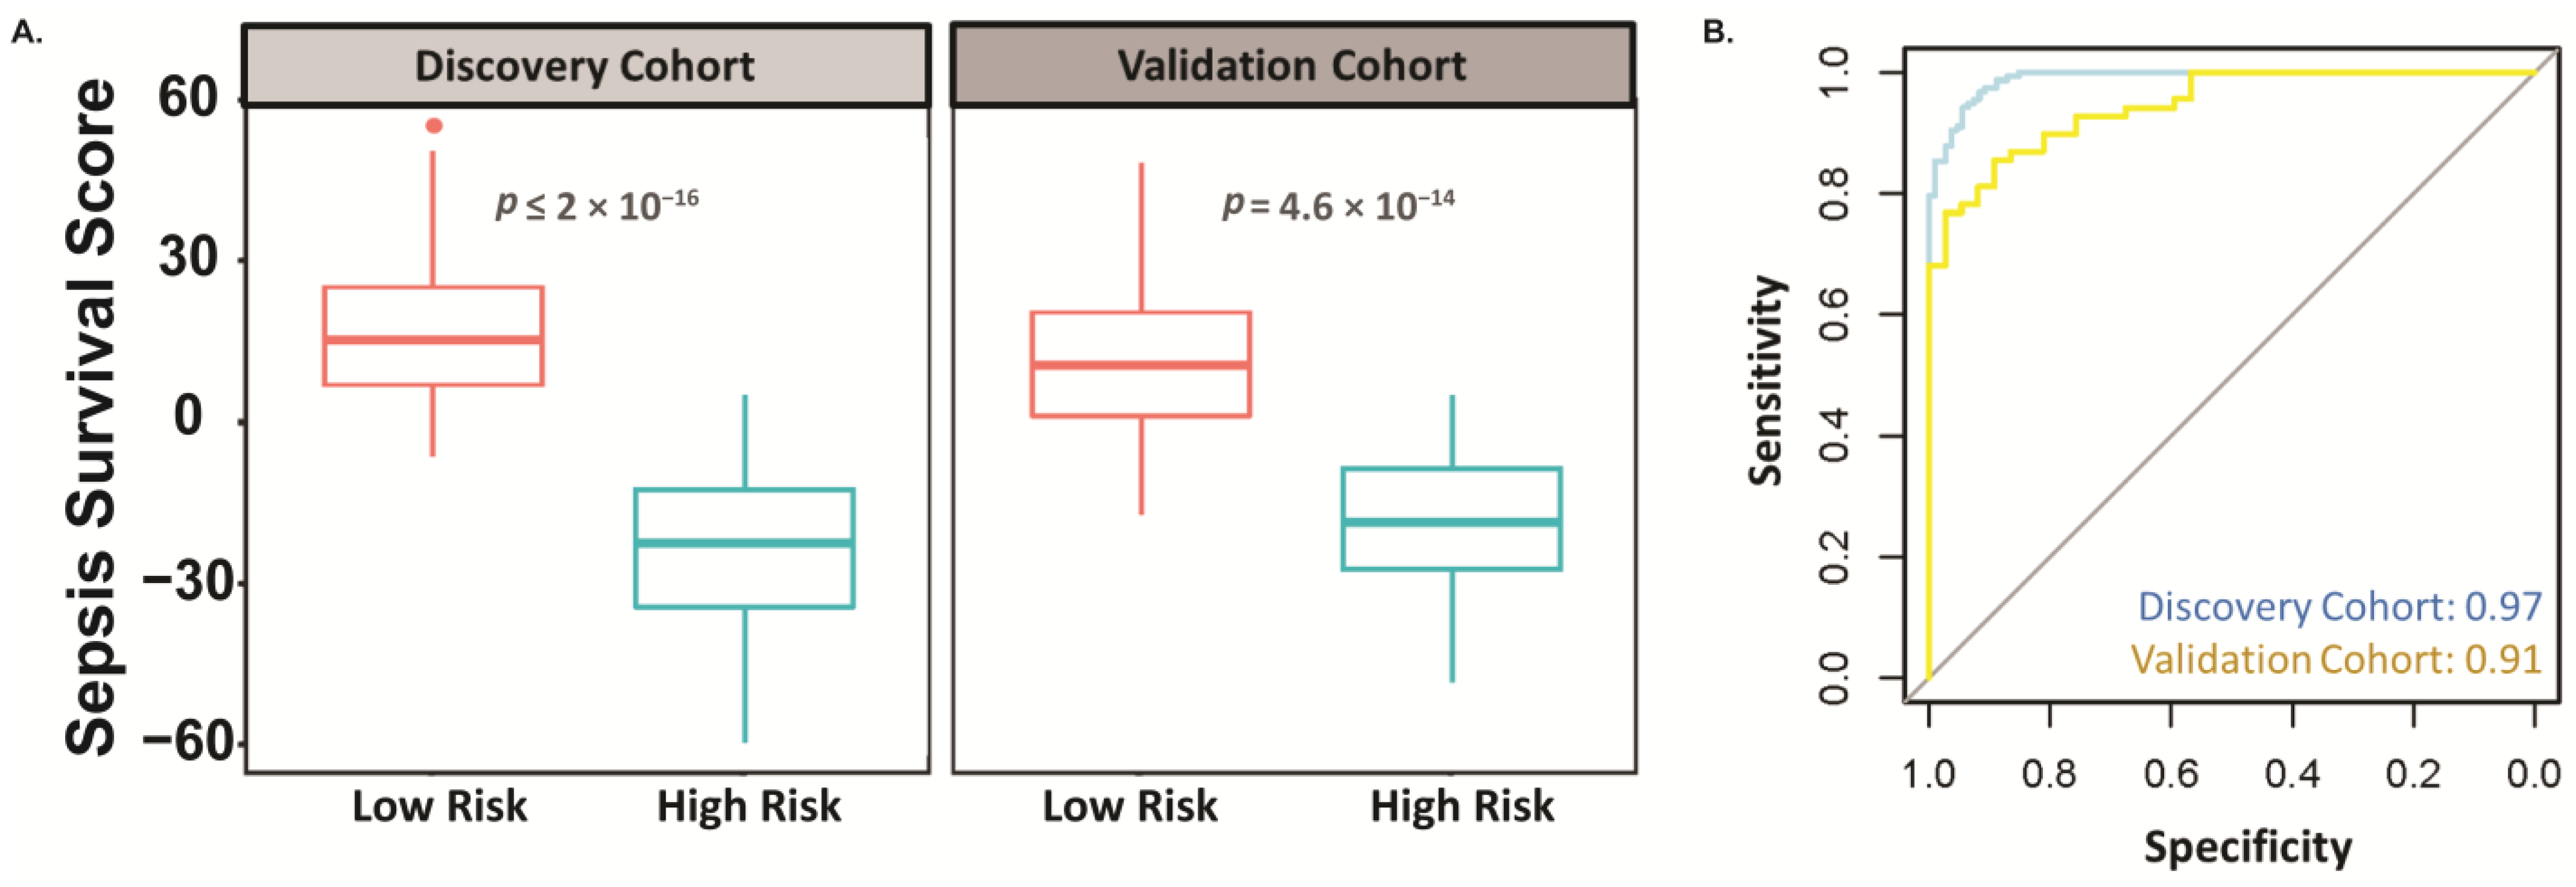
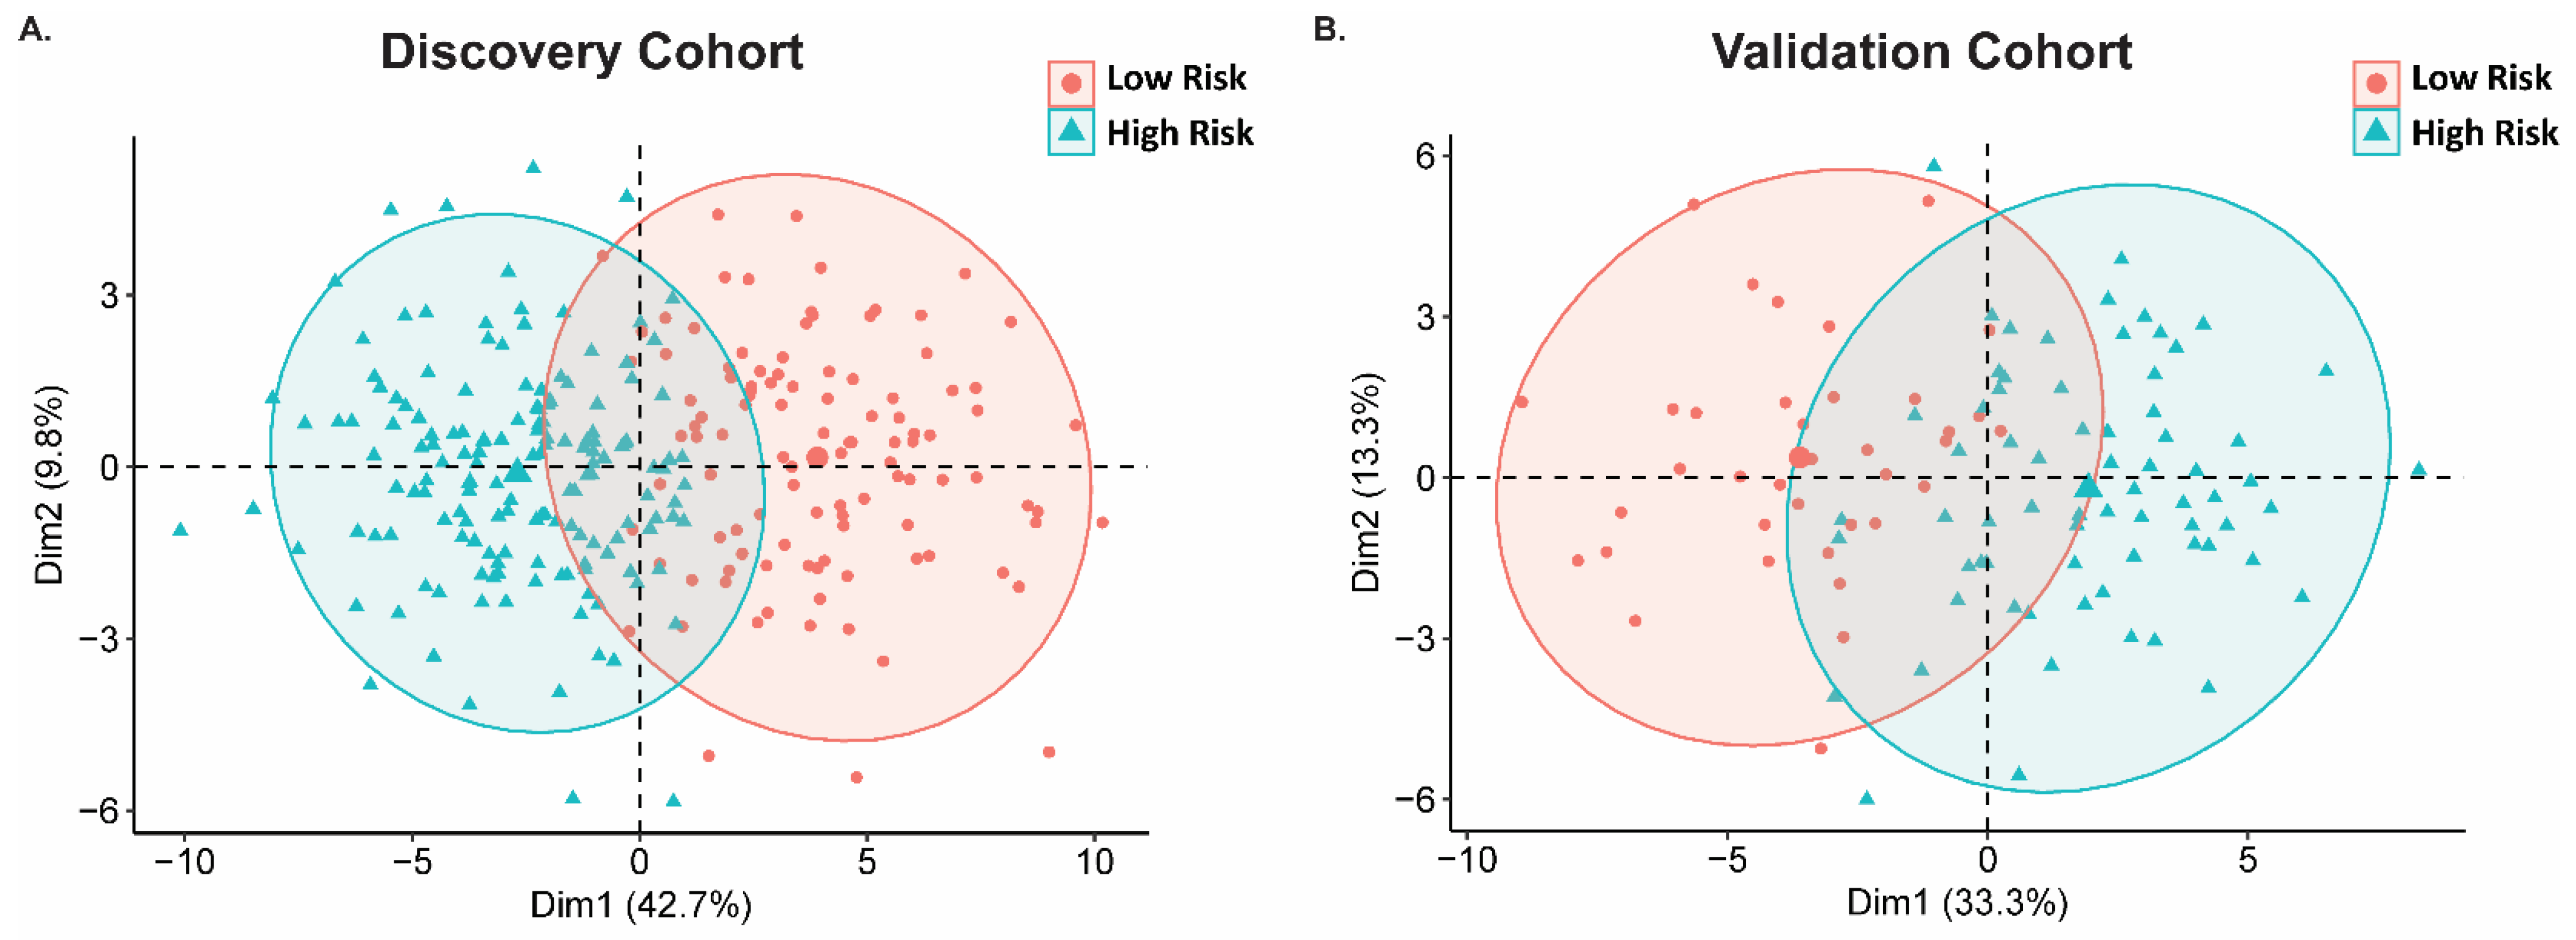
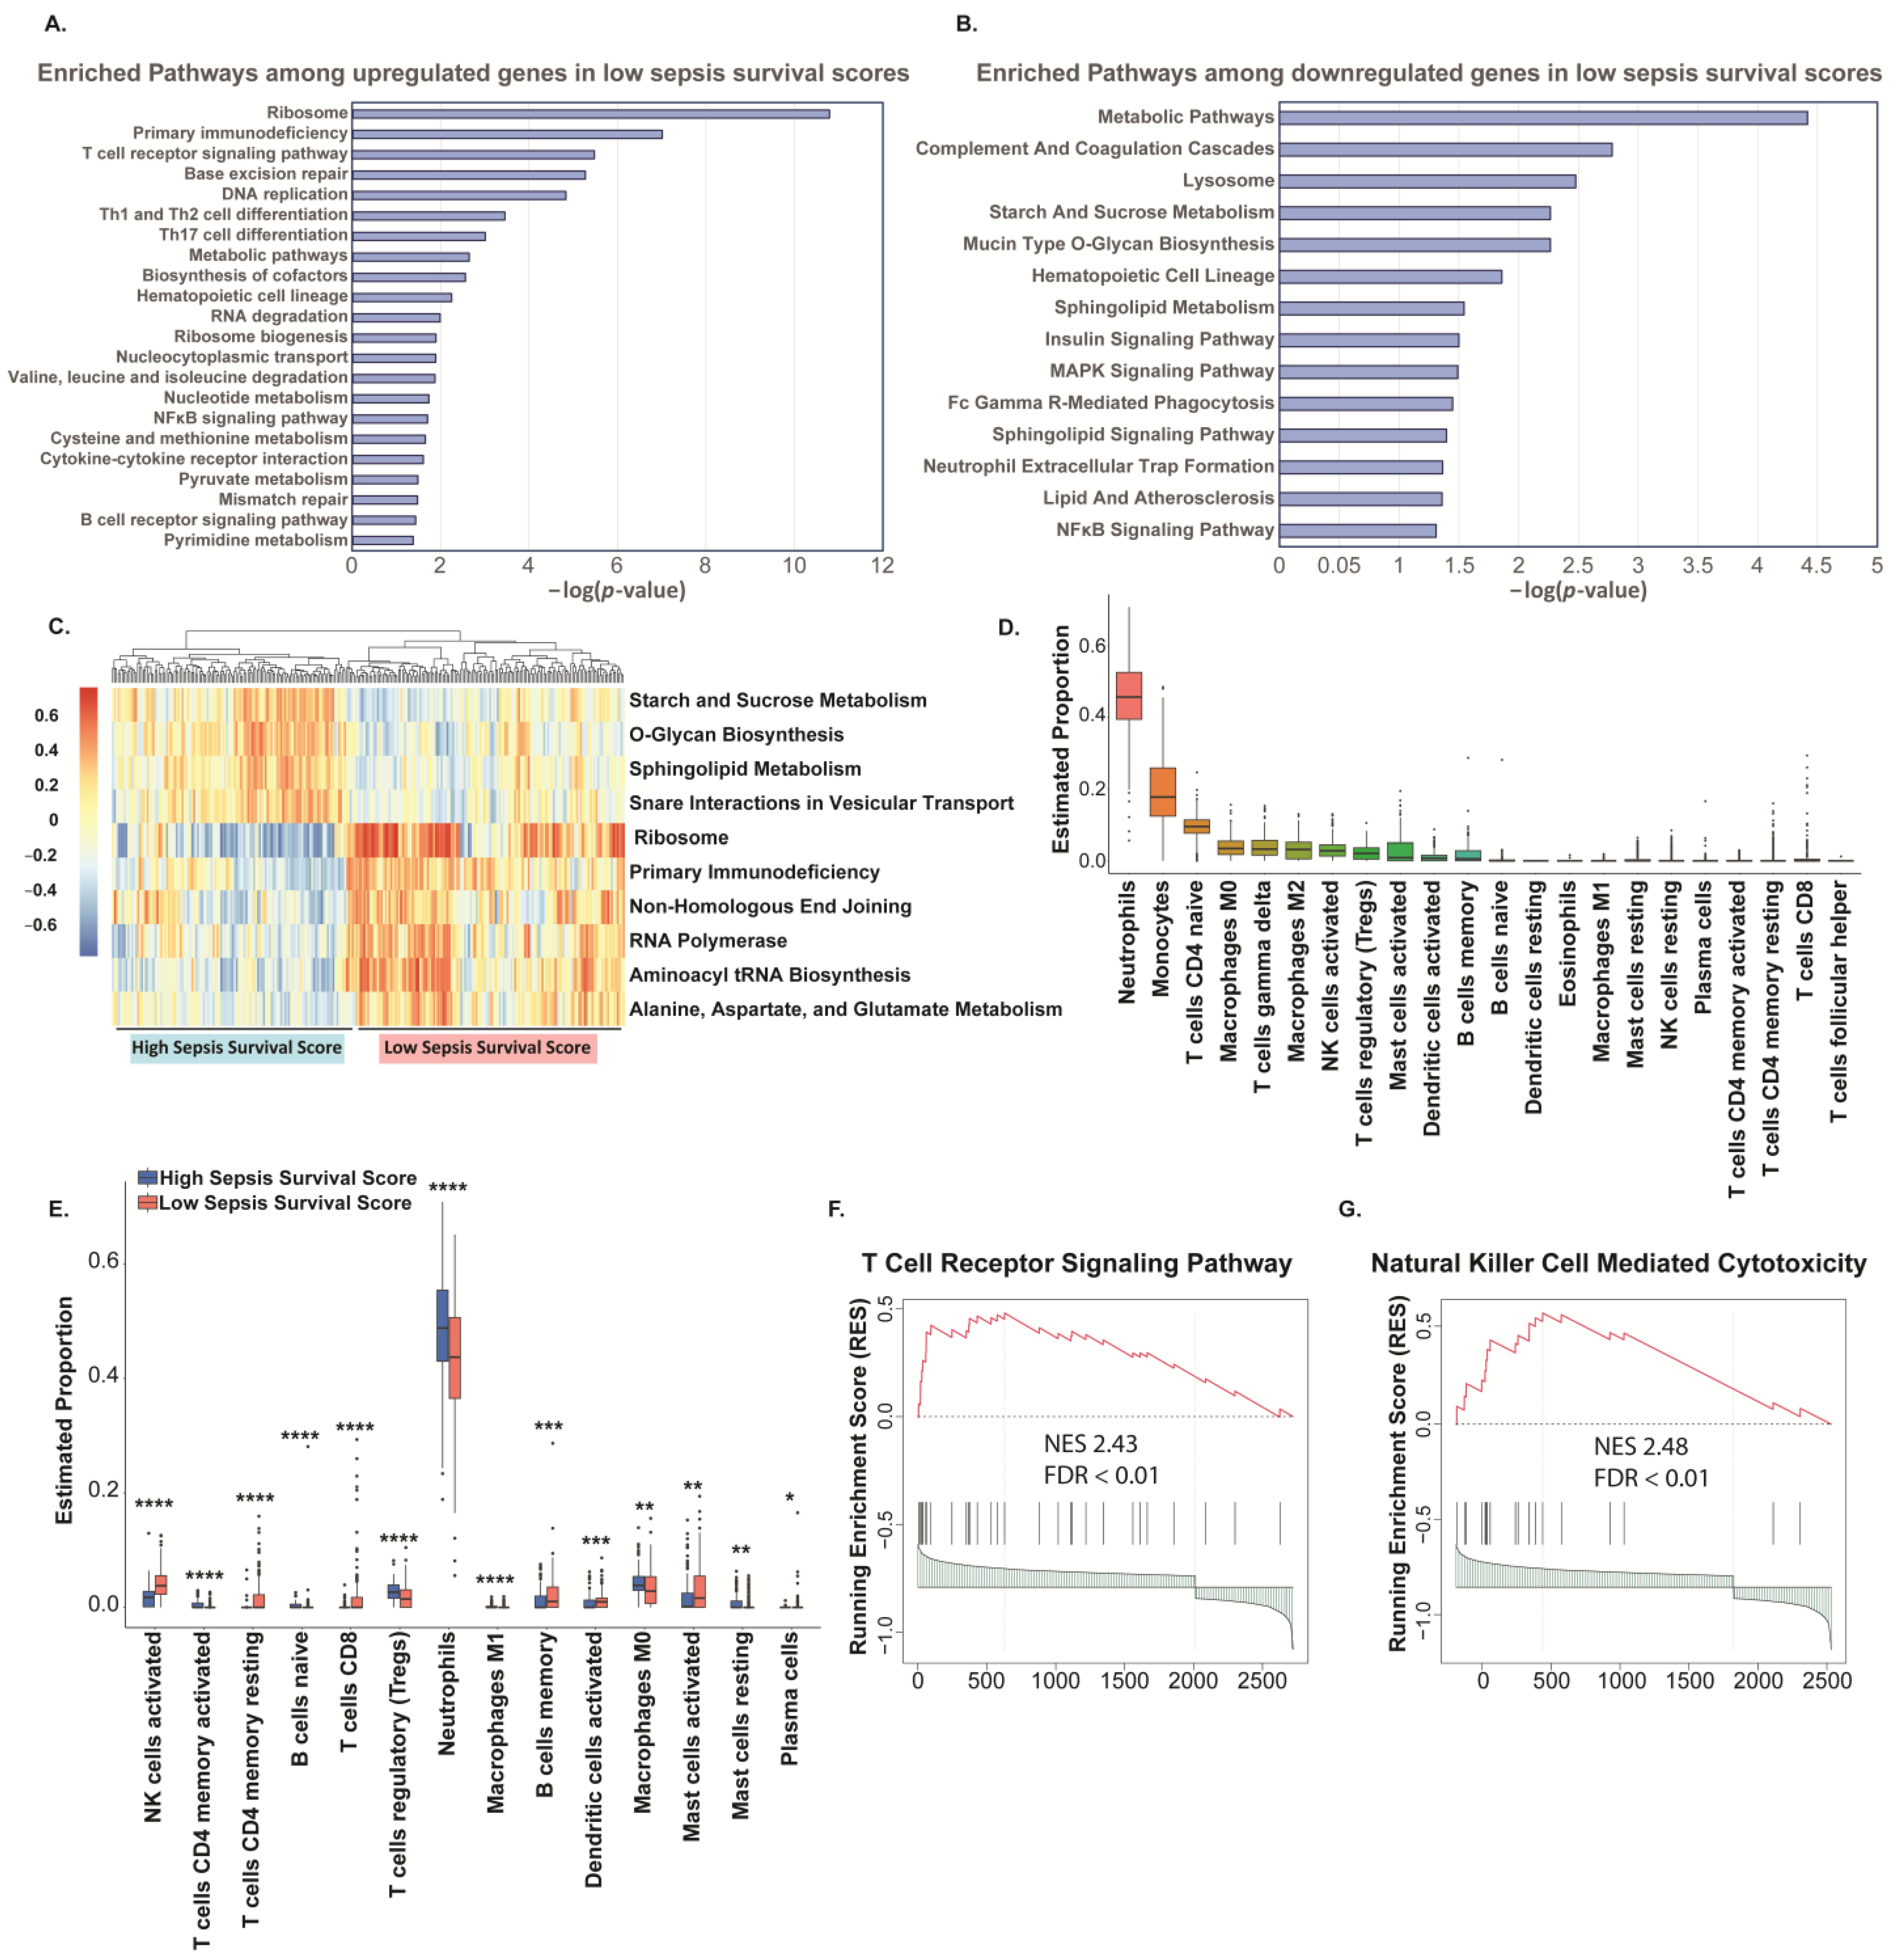
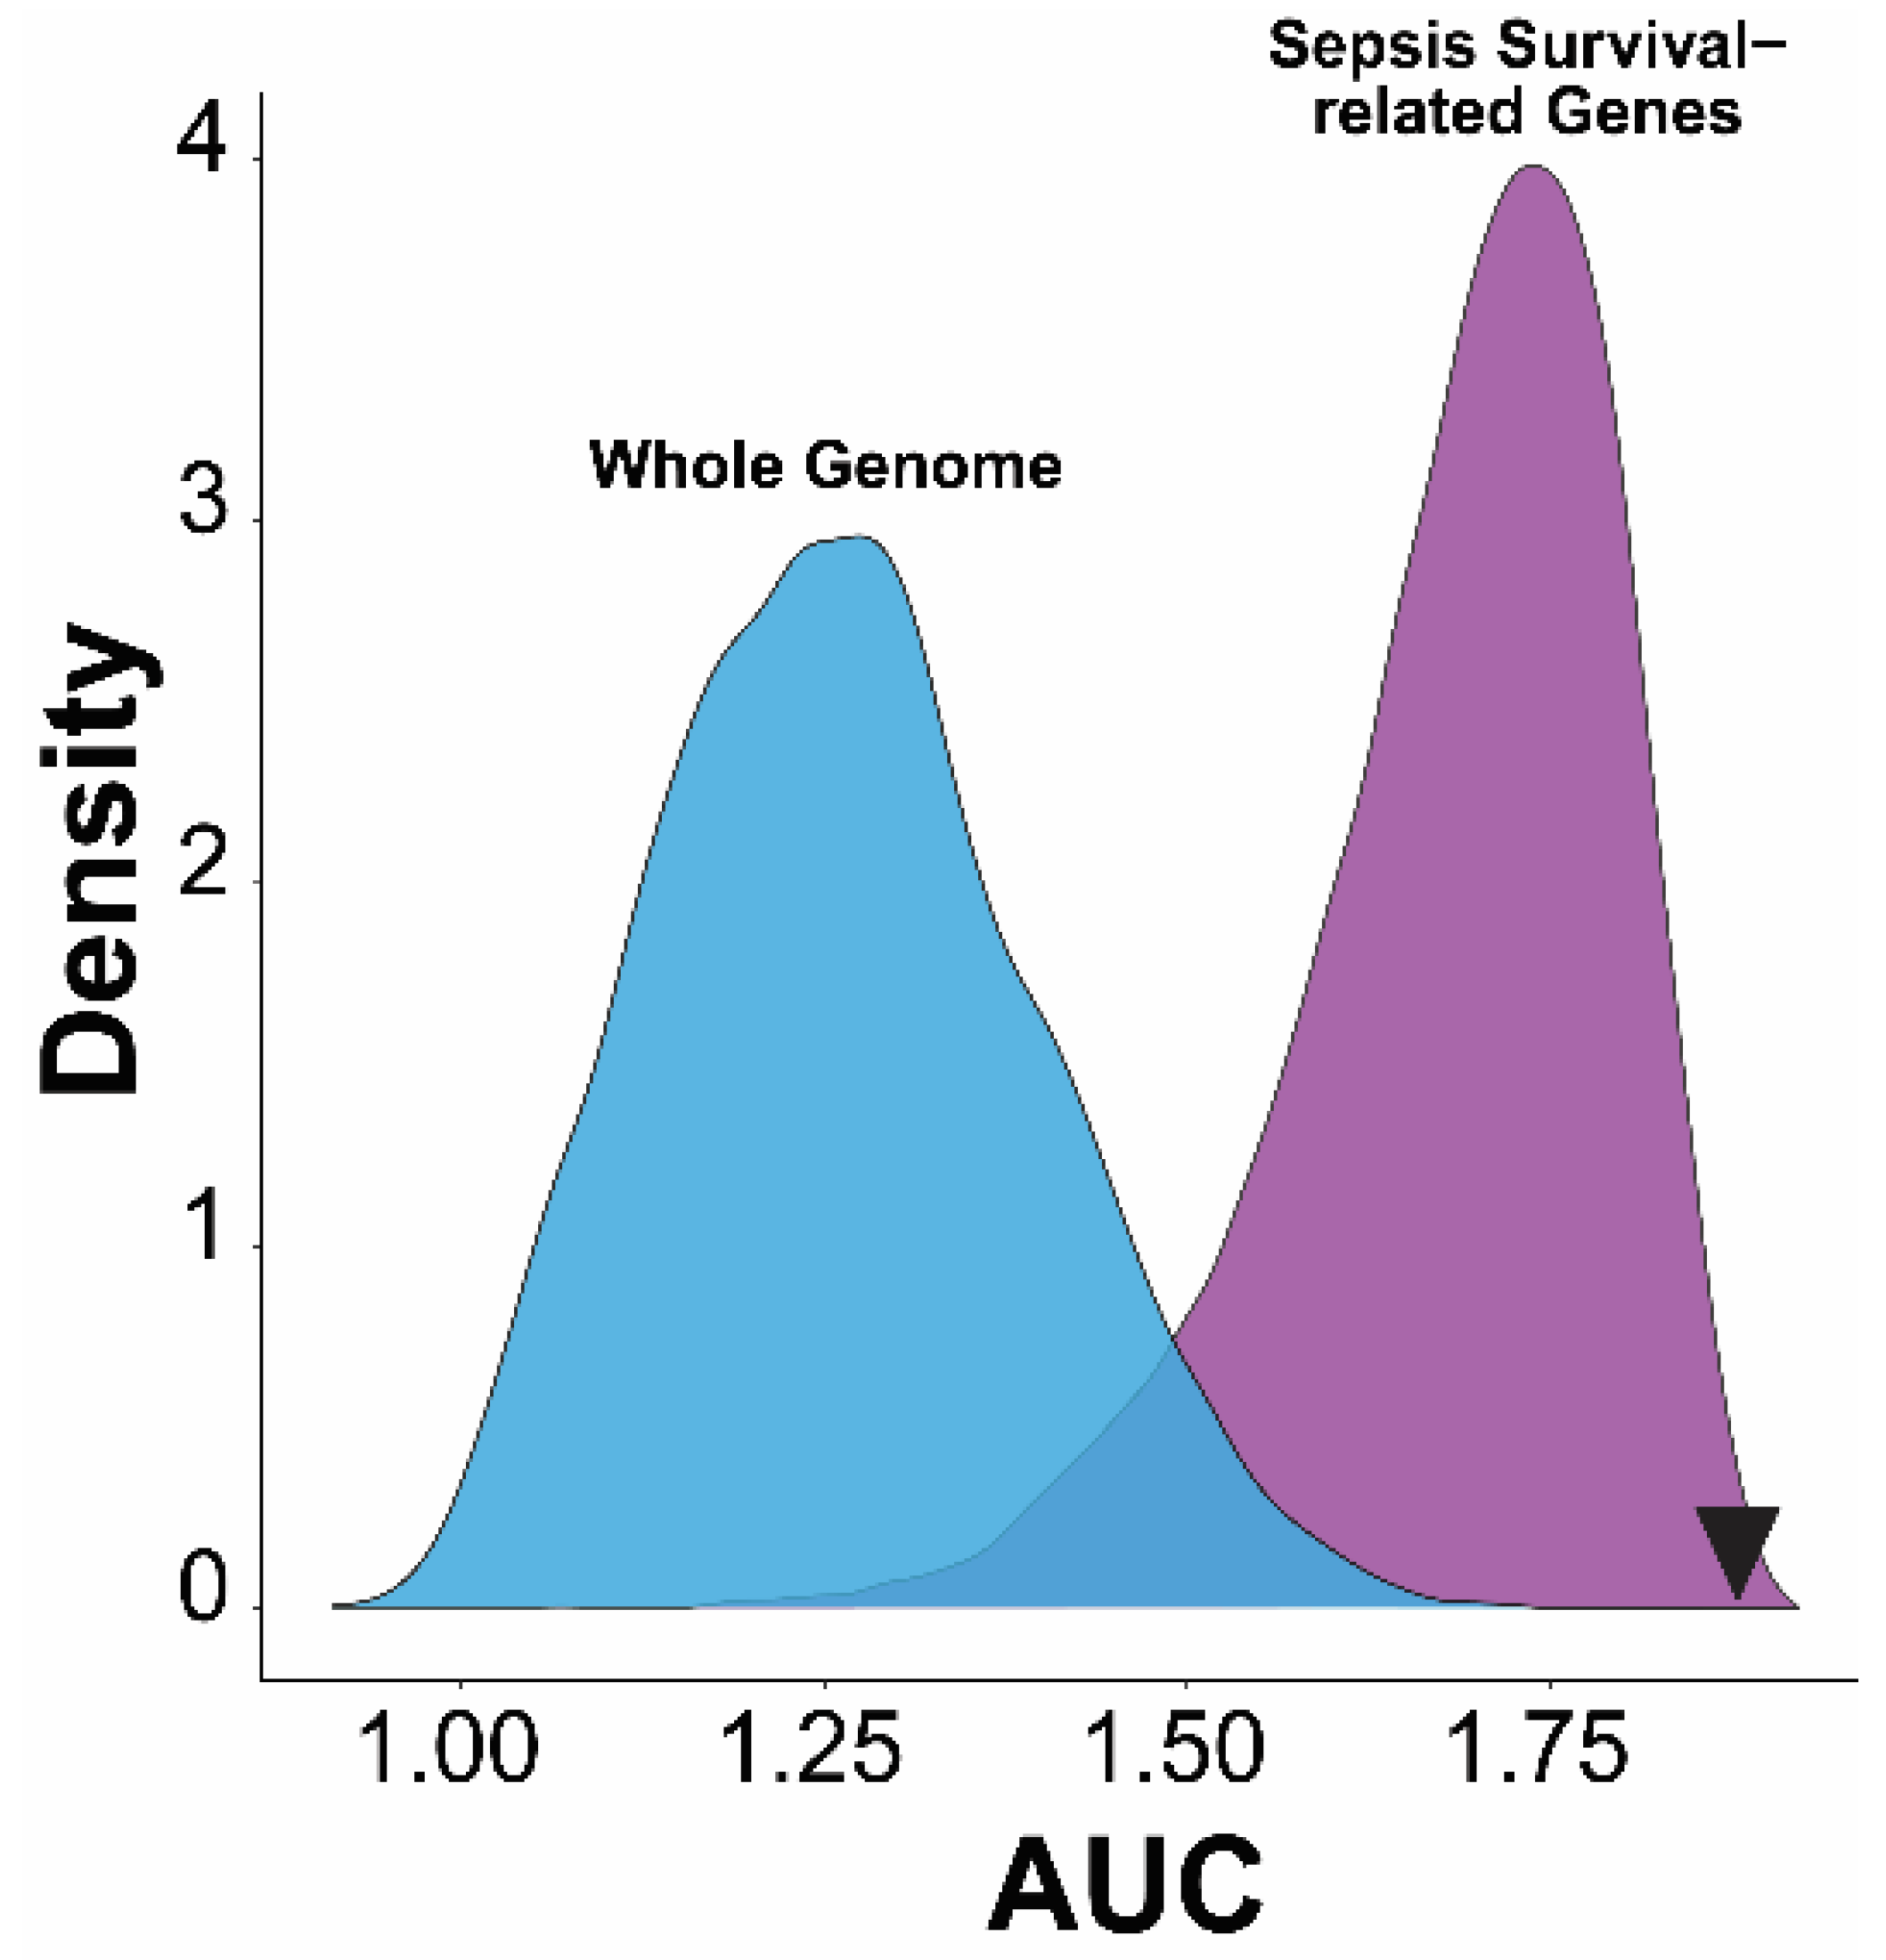
2. Results
3. Discussion
4. Materials and Methods
4.1. Transcriptomic Datasets and Sepsis Survival-Related Genes
4.2. Sepsis Survival Score
4.3. Enrichment Analysis
4.4. CIBERSORT
4.5. Running Enrichment Score
4.6. Statistical Analysis
5. Conclusions
Supplementary Materials
Author Contributions
Funding
Institutional Review Board Statement
Informed Consent Statement
Data Availability Statement
Conflicts of Interest
References
- Singer, M.; Deutschman, C.S.; Seymour, C.W.; Shankar-Hari, M.; Annane, D.; Bauer, M.; Bellomo, R.; Bernard, G.R.; Chiche, J.D.; Coopersmith, C.M.; et al. The Third International Consensus Definitions for Sepsis and Septic Shock (Sepsis-3). JAMA 2016, 315, 801–810. [Google Scholar] [CrossRef] [PubMed]
- Liu, V.; Escobar, G.J.; Greene, J.D.; Soule, J.; Whippy, A.; Angus, D.C.; Iwashyna, T.J. Hospital Deaths in Patients with Sepsis from 2 Independent Cohorts. JAMA 2014, 312, 90–92. [Google Scholar] [CrossRef] [PubMed]
- Torio, C.M.; Moore, B.J. National Inpatient Hospital Costs: The Most Expensive Conditions by Payer, 2013; Agency for Healthcare Research and Quality: Rockville, MD, USA, 2016. [Google Scholar]
- Rudd, K.E.; Johnson, S.C.; Agesa, K.M.; Shackelford, K.A.; Tsoi, D.; Kievlan, D.R.; Colombara, D.V.; Ikuta, K.S.; Kissoon, N.; Finfer, S.; et al. Global, regional, and national sepsis incidence and mortality, 1990–2017: Analysis for the Global Burden of Disease Study. Lancet 2020, 395, 200–211. [Google Scholar] [CrossRef] [PubMed]
- Tang, B.M.; Eslick, G.D.; Craig, J.C.; McLean, A.S. Accuracy of procalcitonin for sepsis diagnosis in critically ill patients: Systematic review and meta-analysis. Lancet Infect. Dis. 2007, 7, 210–217. [Google Scholar] [CrossRef] [PubMed]
- Andrades, M.; Morina, A.; Spasić, S.; Spasojević, I. Bench-to-bedside review: Sepsis–from the redox point of view. Crit. Care 2011, 15, 230. [Google Scholar] [CrossRef] [PubMed]
- Andrades, M.E.; Ritter, C.; Dal-Pizzol, F. The role of free radicals in sepsis development. Front. Biosci. (Elite Ed.) 2009, 1, 277–287. [Google Scholar] [PubMed]
- Angus, D.C.; van der Poll, T. Severe sepsis and septic shock. N. Engl. J. Med. 2013, 369, 840–851. [Google Scholar] [CrossRef] [PubMed]
- Deutschman, C.S.; Tracey, K.J. Sepsis: Current dogma and new perspectives. Immunity 2014, 40, 463–475. [Google Scholar] [CrossRef] [PubMed]
- Singer, M.; De Santis, V.; Vitale, D.; Jeffcoate, W. Multiorgan failure is an adaptive, endocrine-mediated, metabolic response to overwhelming systemic inflammation. Lancet 2004, 364, 545–548. [Google Scholar] [CrossRef]
- Delano, M.J.; Ward, P.A. The immune system’s role in sepsis progression, resolution, and long-term outcome. Immunol. Rev. 2016, 274, 330–353. [Google Scholar] [CrossRef]
- Cao, M.; Wang, G.; Xie, J. Immune dysregulation in sepsis: Experiences, lessons and perspectives. Cell Death Discov. 2023, 9, 465. [Google Scholar] [CrossRef] [PubMed]
- Hotchkiss, R.S.; Monneret, G.; Payen, D. Sepsis-induced immunosuppression: From cellular dysfunctions to immunotherapy. Nat. Rev. Immunol. 2013, 13, 862–874. [Google Scholar] [CrossRef] [PubMed]
- Feng, A.; Simpson, E.; Wu, J.; Robinson, T.; Ma, W.; Tieu, K.; Black, S.M.; Wang, T. NAMPT-associated gene signature in the prediction of severe sepsis. Am. J. Transl. Res. 2022, 14, 7090–7097. [Google Scholar] [PubMed]
- Feng, A.; Ma, W.; Faraj, R.; Kelly, G.T.; Black, S.M.; Fallon, M.B.; Wang, T. Identification of S1PR3 gene signature involved in survival of sepsis patients. BMC Med. Genom. 2021, 14, 43. [Google Scholar] [CrossRef] [PubMed]
- Feng, A.; Rice, A.D.; Zhang, Y.; Kelly, G.T.; Zhou, T.; Wang, T. S1PR1-Associated Molecular Signature Predicts Survival in Patients with Sepsis. Shock 2020, 53, 284–292. [Google Scholar] [CrossRef] [PubMed]
- Amland, R.C.; Hahn-Cover, K.E. Clinical Decision Support for Early Recognition of Sepsis. Am. J. Med. Qual. 2019, 34, 494–501. [Google Scholar] [CrossRef]
- Ferrer, R.; Martin-Loeches, I.; Phillips, G.; Osborn, T.M.; Townsend, S.; Dellinger, R.P.; Artigas, A.; Schorr, C.; Levy, M.M. Empiric antibiotic treatment reduces mortality in severe sepsis and septic shock from the first hour: Results from a guideline-based performance improvement program. Crit. Care Med. 2014, 42, 1749–1755. [Google Scholar] [CrossRef] [PubMed]
- Suliman, S.; Price, J.; Cahill, M.; Young, T.; Furmanek, S.; Galvis, J.; Shoff, H.; Parra, F.; Stevenson, G.; Cavallazzi, R. Bedside Evaluation for Early Sepsis Intervention: Addition of a Sepsis Response Team Leads to Improvement in Sepsis Bundle Compliance. Crit. Care Explor. 2021, 3, e0312. [Google Scholar] [CrossRef]
- Rhodes, A.; Evans, L.E.; Alhazzani, W.; Levy, M.M.; Antonelli, M.; Ferrer, R.; Kumar, A.; Sevransky, J.E.; Sprung, C.L.; Nunnally, M.E.; et al. Surviving Sepsis Campaign: International Guidelines for Management of Sepsis and Septic Shock: 2016. Intensive Care Med. 2017, 43, 304–377. [Google Scholar] [CrossRef]
- Casagranda, I.; Vendramin, C.; Callegari, T.; Vidali, M.; Calabresi, A.; Ferrandu, G.; Cervellin, G.; Cavazza, M.; Lippi, G.; Zanotti, I.; et al. Usefulness of suPAR in the risk stratification of patients with sepsis admitted to the emergency department. Intern. Emerg. Med. 2015, 10, 725–730. [Google Scholar] [CrossRef]
- Barre, M.; Behnes, M.; Hamed, S.; Pauly, D.; Lepiorz, D.; Lang, S.; Akin, I.; Borggrefe, M.; Bertsch, T.; Hoffmann, U. Revisiting the prognostic value of monocyte chemotactic protein 1 and interleukin-6 in the sepsis-3 era. J. Crit. Care 2018, 43, 21–28. [Google Scholar] [CrossRef] [PubMed]
- Wasyluk, W.; Zwolak, A. Metabolic Alterations in Sepsis. J. Clin. Med. 2021, 10, 2412. [Google Scholar] [CrossRef] [PubMed]
- Joffre, J.; Hellman, J. Oxidative Stress and Endothelial Dysfunction in Sepsis and Acute Inflammation. Antioxid. Redox Signal. 2021, 35, 1291–1307. [Google Scholar] [CrossRef] [PubMed]
- Chen, Y.; Zhou, Z.; Min, W. Mitochondria, Oxidative Stress and Innate Immunity. Front. Physiol. 2018, 9, 1487. [Google Scholar] [CrossRef] [PubMed]
- Fredriksson, K.; Tjäder, I.; Keller, P.; Petrovic, N.; Ahlman, B.; Schéele, C.; Wernerman, J.; Timmons, J.A.; Rooyackers, O. Dysregulation of Mitochondrial Dynamics and the Muscle Transcriptome in ICU Patients Suffering from Sepsis Induced Multiple Organ Failure. PLoS ONE 2008, 3, e3686. [Google Scholar] [CrossRef]
- Murphy, M.P.; Bayir, H.; Belousov, V.; Chang, C.J.; Davies, K.J.A.; Davies, M.J.; Dick, T.P.; Finkel, T.; Forman, H.J.; Janssen-Heininger, Y.; et al. Guidelines for measuring reactive oxygen species and oxidative damage in cells and in vivo. Nat. Metab. 2022, 4, 651–662. [Google Scholar] [CrossRef] [PubMed]
- Pablo Chapela, S.; Burgos, I.; Schiel, A.; Alonso, M.; Alberto Stella, C. Serum reactive oxygen species and apoptosis markers in septic patients. Anaesthesiol. Intensive Ther. 2021, 53, 126–133. [Google Scholar] [CrossRef] [PubMed]
- Chapela, S.P.; Burgos, I.; Congost, C.; Canzonieri, R.; Muryan, A.; Alonso, M.; Stella, C.A. Parenteral Succinate Reduces Systemic ROS Production in Septic Rats, but It Does Not Reduce Creatinine Levels. Oxid. Med. Cell. Longev. 2018, 2018, 1928945. [Google Scholar] [CrossRef] [PubMed]
- Galley, H.F. Oxidative stress and mitochondrial dysfunction in sepsis. Br. J. Anaesth. 2011, 107, 57–64. [Google Scholar] [CrossRef] [PubMed]
- Berg, R.M.; Møller, K.; Bailey, D.M. Neuro-oxidative-nitrosative stress in sepsis. J. Cereb. Blood Flow Metab. 2011, 31, 1532–1544. [Google Scholar] [CrossRef]
- Kumar, S.; Saxena, J.; Srivastava, V.K.; Kaushik, S.; Singh, H.; Abo-EL-Sooud, K.; Abdel-Daim, M.M.; Jyoti, A.; Saluja, R. The Interplay of Oxidative Stress and ROS Scavenging: Antioxidants as a Therapeutic Potential in Sepsis. Vaccines 2022, 10, 1575. [Google Scholar] [CrossRef] [PubMed]
- Piechota-Polańczyk, A.; Gorąca, A. Influence of specific endothelin-1 receptor blockers on hemodynamic parameters and antioxidant status of plasma in LPS-induced endotoxemia. Pharmacol. Rep. 2012, 64, 1434–1441. [Google Scholar] [CrossRef] [PubMed]
- Lorente, L.; Martín, M.M.; Almeida, T.; Abreu-González, P.; Ferreres, J.; Solé-Violán, J.; Labarta, L.; Díaz, C.; Jiménez, A. Association between serum total antioxidant capacity and mortality in severe septic patients. J. Crit. Care 2015, 30, e7–e12. [Google Scholar] [CrossRef]
- Martins, P.S.; Brunialti, M.K.; Martos, L.S.; Machado, F.R.; Assunçao, M.S.; Blecher, S.; Salomao, R. Expression of cell surface receptors and oxidative metabolism modulation in the clinical continuum of sepsis. Crit. Care 2008, 12, R25. [Google Scholar] [CrossRef] [PubMed]
- Heyland, D.; Muscedere, J.; Wischmeyer, P.E.; Cook, D.; Jones, G.; Albert, M.; Elke, G.; Berger, M.M.; Day, A.G. A randomized trial of glutamine and antioxidants in critically ill patients. N. Engl. J. Med. 2013, 368, 1489–1497. [Google Scholar] [CrossRef] [PubMed]
- van Zanten, A.R.; Hofman, Z.; Heyland, D.K. Consequences of the REDOXS and METAPLUS Trials: The End of an Era of Glutamine and Antioxidant Supplementation for Critically Ill Patients? JPEN J. Parenter Enter. Nutr. 2015, 39, 890–892. [Google Scholar] [CrossRef] [PubMed]
- Heyland, D.K.; Elke, G.; Cook, D.; Berger, M.M.; Wischmeyer, P.E.; Albert, M.; Muscedere, J.; Jones, G.; Day, A.G. Glutamine and antioxidants in the critically ill patient: A post hoc analysis of a large-scale randomized trial. JPEN J. Parenter Enter. Nutr. 2015, 39, 401–409. [Google Scholar] [CrossRef] [PubMed]
- Hofman, Z.; Swinkels, S.; van Zanten, A.R.H. Glutamine, fish oil and antioxidants in critical illness: MetaPlus trial post hoc safety analysis. Ann. Intensive Care 2016, 6, 119. [Google Scholar] [CrossRef] [PubMed]
- Sakr, Y.; Maia, V.P.; Santos, C.; Stracke, J.; Zeidan, M.; Bayer, O.; Reinhart, K. Adjuvant selenium supplementation in the form of sodium selenite in postoperative critically ill patients with severe sepsis. Crit. Care 2014, 18, R68. [Google Scholar] [CrossRef]
- Mishra, V. Oxidative stress and role of antioxidant supplementation in critical illness. Clin. Lab. 2007, 53, 199–209. [Google Scholar]
- Lorente, L.; Martín, M.M.; López-Gallardo, E.; Blanquer, J.; Solé-Violán, J.; Labarta, L.; Díaz, C.; Jiménez, A.; Montoya, J.; Ruiz-Pesini, E. Decrease of oxidative phosphorylation system function in severe septic patients. J. Crit. Care 2015, 30, 935–939. [Google Scholar] [CrossRef] [PubMed]
- Van Wyngene, L.; Vandewalle, J.; Libert, C. Reprogramming of basic metabolic pathways in microbial sepsis: Therapeutic targets at last? EMBO Mol. Med. 2018, 10, e8712. [Google Scholar] [CrossRef] [PubMed]
- Lopes-Pires, M.E.; Frade-Guanaes, J.O.; Quinlan, G.J. Clotting Dysfunction in Sepsis: A Role for ROS and Potential for Therapeutic Intervention. Antioxidants 2022, 11, 88. [Google Scholar] [CrossRef] [PubMed]
- Bassoy, E.Y.; Walch, M.; Martinvalet, D. Reactive Oxygen Species: Do They Play a Role in Adaptive Immunity? Front. Immunol. 2021, 12, 755856. [Google Scholar] [CrossRef] [PubMed]
- Newman, A.M.; Steen, C.B.; Liu, C.L.; Gentles, A.J.; Chaudhuri, A.A.; Scherer, F.; Khodadoust, M.S.; Esfahani, M.S.; Luca, B.A.; Steiner, D.; et al. Determining cell type abundance and expression from bulk tissues with digital cytometry. Nat. Biotechnol. 2019, 37, 773–782. [Google Scholar] [CrossRef] [PubMed]
- Li, M.; Guo, W.; Dong, Y.; Wang, X.; Dai, D.; Liu, X.; Wu, Y.; Li, M.; Zhang, W.; Zhou, H.; et al. Elevated Exhaustion Levels of NK and CD8(+) T Cells as Indicators for Progression and Prognosis of COVID-19 Disease. Front. Immunol. 2020, 11, 580237. [Google Scholar] [CrossRef]
- Rosenberg, J.; Huang, J. CD8(+) T Cells and NK Cells: Parallel and Complementary Soldiers of Immunotherapy. Curr. Opin. Chem. Eng. 2018, 19, 9–20. [Google Scholar] [CrossRef] [PubMed]
- Gelderman, K.A.; Hultqvist, M.; Holmberg, J.; Olofsson, P.; Holmdahl, R. T cell surface redox levels determine T cell reactivity and arthritis susceptibility. Proc. Natl. Acad. Sci. USA 2006, 103, 12831–12836. [Google Scholar] [CrossRef]
- Christ-Crain, M.; Morgenthaler, N.G.; Struck, J.; Harbarth, S.; Bergmann, A.; Müller, B. Mid-regional pro-adrenomedullin as a prognostic marker in sepsis: An observational study. Crit. Care 2005, 9, R816–R824. [Google Scholar] [CrossRef]
- Rey, C.; García-Hernández, I.; Concha, A.; Martínez-Camblor, P.; Botrán, M.; Medina, A.; Prieto, B.; López-Herce, J. Pro-adrenomedullin, pro-endothelin-1, procalcitonin, C-reactive protein and mortality risk in critically ill children: A prospective study. Crit. Care 2013, 17, R240. [Google Scholar] [CrossRef]
- Sara, G.; Rachel Amie, O.L.; Deborah, D.S.; Michael, P.; Allen, A.J.; Simpson, A.J.; David Ashley, P. Can mid-regional pro-adrenomedullin (MR-proADM) increase the prognostic accuracy of NEWS in predicting deterioration in patients admitted to hospital with mild to moderately severe illness? A prospective single-centre observational study. BMJ Open 2018, 8, e020337. [Google Scholar]
- Yoon, S.H.; Kim, E.H.; Kim, H.Y.; Ahn, J.G. Presepsin as a diagnostic marker of sepsis in children and adolescents: A systemic review and meta-analysis. BMC Infect. Dis. 2019, 19, 760. [Google Scholar] [CrossRef] [PubMed]
- Koh, J.S.; Kim, Y.J.; Kang, D.H.; Lee, J.E.; Lee, S.I. Usefulness of presepsin in predicting the prognosis of patients with sepsis or septic shock: A retrospective cohort study. Yeungnam Univ. J. Med. 2021, 38, 318–325. [Google Scholar] [CrossRef] [PubMed]


 | Gene Symbol | Gene Name | Log (Fold Change) | Weight |
| KRT1 | Keratin 1 | 1.39649507 | 1 | |
| BCL2 | BCL2 Apoptosis Regulator) | 1.21684097 | 1 | |
| TYSND1 | Trypsin Like Peroxisomal Matrix Peptidase 1 | 1.028826515 | 1 | |
| DHRS4 | Dehydrogenase/Reductase 4 | 1.023064207 | 1 | |
| EPHX2 | Epoxide Hydrolase 2 | 0.998809446 | 1 | |
| IFNG | Interferon Gamma | 0.990314958 | 1 | |
| CCL5 | Chemokine (C-C motif) ligand 5 | 0.978813828 | 1 | |
| MYC | Myc myelocytomatosis oncogen | 0.942214034 | 1 | |
| SRC | SRC proto-oncogene, non-receptor tyrosine kinase | 0.919788893 | 1 | |
| PRDX4 | Peroxiredoxin 4 | 0.905019227 | 1 | |
| GSS | glutathione synthetase | 0.868091871 | 1 | |
| HACL1 | 2-Hydroxyacyl-CoA Lyase 1 | 0.806398241 | 1 | |
| DNAJA3 | DnaJ Heat Shock Protein Family (Hsp40) Member A3 | 0.796338833 | 1 | |
| GSTP1 | Glutathione S-Transferase Pi 1 | 0.718004102 | 1 | |
| PRDX2 | peroxiredoxin 2 (PRDX2) | 0.709937194 | 1 | |
| PTGS2 | Prostaglandin-Endoperoxide Synthase 2 | 0.704762302 | 1 | |
| HSPD1 | 60 kDa heat shock protein, mitochondrial | 0.68481934 | 1 | |
| FMO5 | Flavin Containing Dimethylaniline Monoxygenase 5 | 0.677398254 | 1 | |
| DNAJC9 | DnaJ Heat Shock Protein Family (Hsp40) Member C9 | 0.676712675 | 1 | |
| CCT4 | Chaperonin Containing TCP1 Subunit 4 | 0.676162928 | 1 | |
| IL12RB1 | Interleukin 12 Receptor Subunit Beta 1 | 0.634905263 | 1 | |
| HSPA9 | Heat Shock Protein Family A (Hsp70) Member 9 | 0.627851503 | 1 | |
| CROT | Peroxisomal carnitine O-octanoyltransferase | 0.625008985 | 1 | |
| CCT3 | Chaperonin containing TCP1 subunit 3 (CCT3) | 0.62440571 | 1 | |
| JUN | Jun Proto-Oncogene, AP-1 Transcription Factor Subunit | 0.61663915 | 1 | |
| SLC27A2 | Solute Carrier Family 27 Member 2 | 0.595969275 | 1 | |
| GSR | Glutathione-Disulfide Reductase | −0.613066934 | −1 | |
| JAK2 | Janus Kinase 2 | −0.639496536 | −1 | |
| DNAJC5 | DnaJ Heat Shock Protein Family (Hsp40) Member C5 | −0.682604763 | −1 | |
| DNAJC4 | DnaJ Heat Shock Protein Family (Hsp40) Member C4 | −0.746858619 | −1 | |
| RHOU | Rho-related GTP-binding protein RhoU | −0.825335335 | −1 | |
| GCLM | glutamate-cysteine ligase, modifier subunit | −0.904446168 | −1 | |
| MSRA | Methionine Sulfoxide Reductase A | −0.984304987 | −1 | |
| SOCS3 | Suppressor of cytokine signaling 3 | −1.259719259 | −1 | |
| PECR | Peroxisomal Trans-2-Enoyl-CoA Reductase | −1.476257053 | −1 | |
| CYP1B1 | Cytochrome P450 Family 1 Subfamily B Member 1 | −1.517326189 | −1 | |
| ARG1 | Arginase 1 | −1.546803504 | −1 |
Disclaimer/Publisher’s Note: The statements, opinions and data contained in all publications are solely those of the individual author(s) and contributor(s) and not of MDPI and/or the editor(s). MDPI and/or the editor(s) disclaim responsibility for any injury to people or property resulting from any ideas, methods, instructions or products referred to in the content. |
© 2024 by the authors. Licensee MDPI, Basel, Switzerland. This article is an open access article distributed under the terms and conditions of the Creative Commons Attribution (CC BY) license (https://creativecommons.org/licenses/by/4.0/).
Share and Cite
Feng, A.; Pokharel, M.D.; Liang, Y.; Ma, W.; Aggarwal, S.; Black, S.M.; Wang, T. Free Radical–Associated Gene Signature Predicts Survival in Sepsis Patients. Int. J. Mol. Sci. 2024, 25, 4574. https://doi.org/10.3390/ijms25084574
Feng A, Pokharel MD, Liang Y, Ma W, Aggarwal S, Black SM, Wang T. Free Radical–Associated Gene Signature Predicts Survival in Sepsis Patients. International Journal of Molecular Sciences. 2024; 25(8):4574. https://doi.org/10.3390/ijms25084574
Chicago/Turabian StyleFeng, Anlin, Marissa D. Pokharel, Ying Liang, Wenli Ma, Saurabh Aggarwal, Stephen M. Black, and Ting Wang. 2024. "Free Radical–Associated Gene Signature Predicts Survival in Sepsis Patients" International Journal of Molecular Sciences 25, no. 8: 4574. https://doi.org/10.3390/ijms25084574