


Modification of Seurat v4 for the Development of a Phase Assignment Tool Able to Distinguish between G2 and Mitotic Cells

Abstract
:1. Introduction
2. Results
3. Discussion
4. Materials and Methods
4.1. Cell Culture
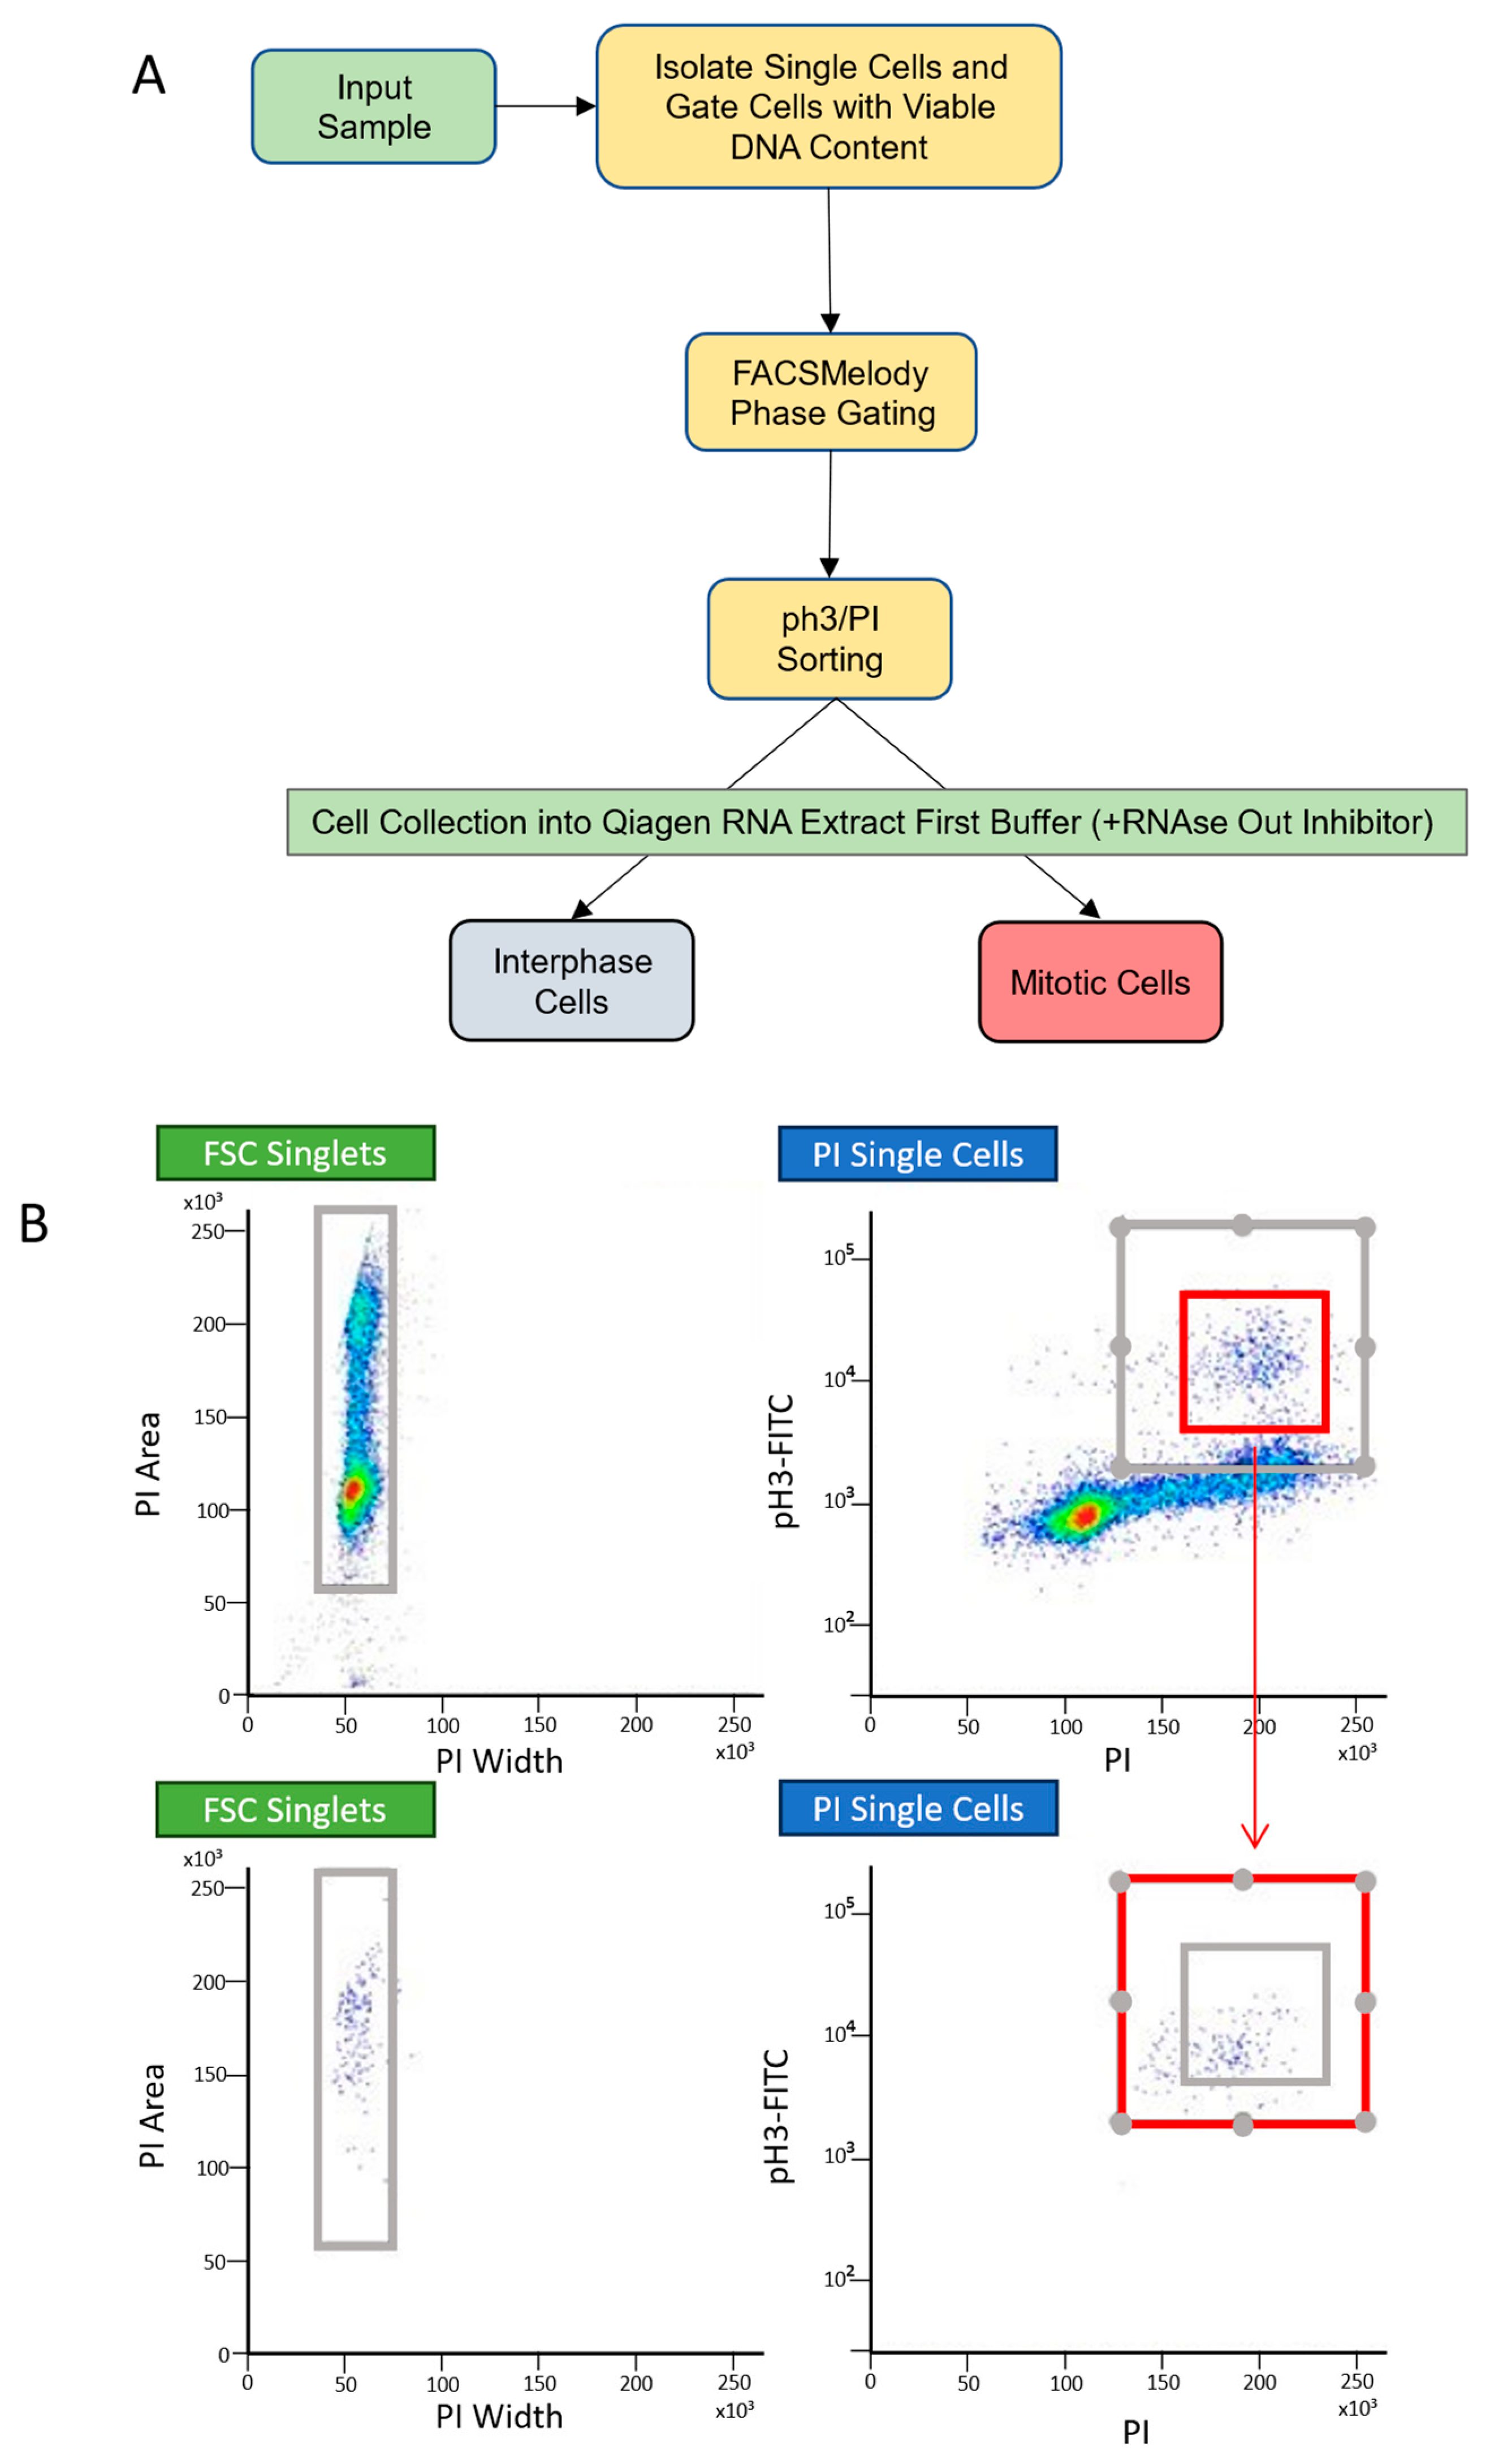
4.2. Fluorescence-Activated Cell Sorting
4.3. RNAseq Analysis
4.4. Testing Cell Phase Assignment Tools
4.5. Modified Seurat Mitotic Sort Procedure
- The count matrix is normalised via a relative count system with an appropriate scale factor the using Seurat NormalizeData function.
- Variable features are found based on the counts for the marker gene data—S and G2/M in this first instance, using the Seurat function FindVariableFeatures
- Principle component analysis using the scaled and centred counts for the variable S and G2/M marker genes is carried out. This is visualised to verify separation.
- G2/M, S and G1 phases are assigned, based on G2/M and S phase variability scores using the Seurat function CellCycleScoring
- The G2/M pool identified in step 4 then had steps 2–3 repeated and the lists of Interphase and M phase genes identified from the gene lists above
- The M phase and G2 phases are assigned to the cells assigned G2/M in the first pass using a modified CellCycleScoring function which assigns G2 or M to the G2/M population using the lists of marker genes identified above (see Extended Code 1).
- G2 and M assignments are combined with the original G1 and S assignments to assign all cells to the G1, S, G2 or M phases.
- Final phase assignments are then outputted in csv format. Following each CellCycleScoring step, assignments and the genes driving these assignments were examined using the DimPlot and RidgePlot Seurat functions, respectively.
4.6. K-Fold Testing
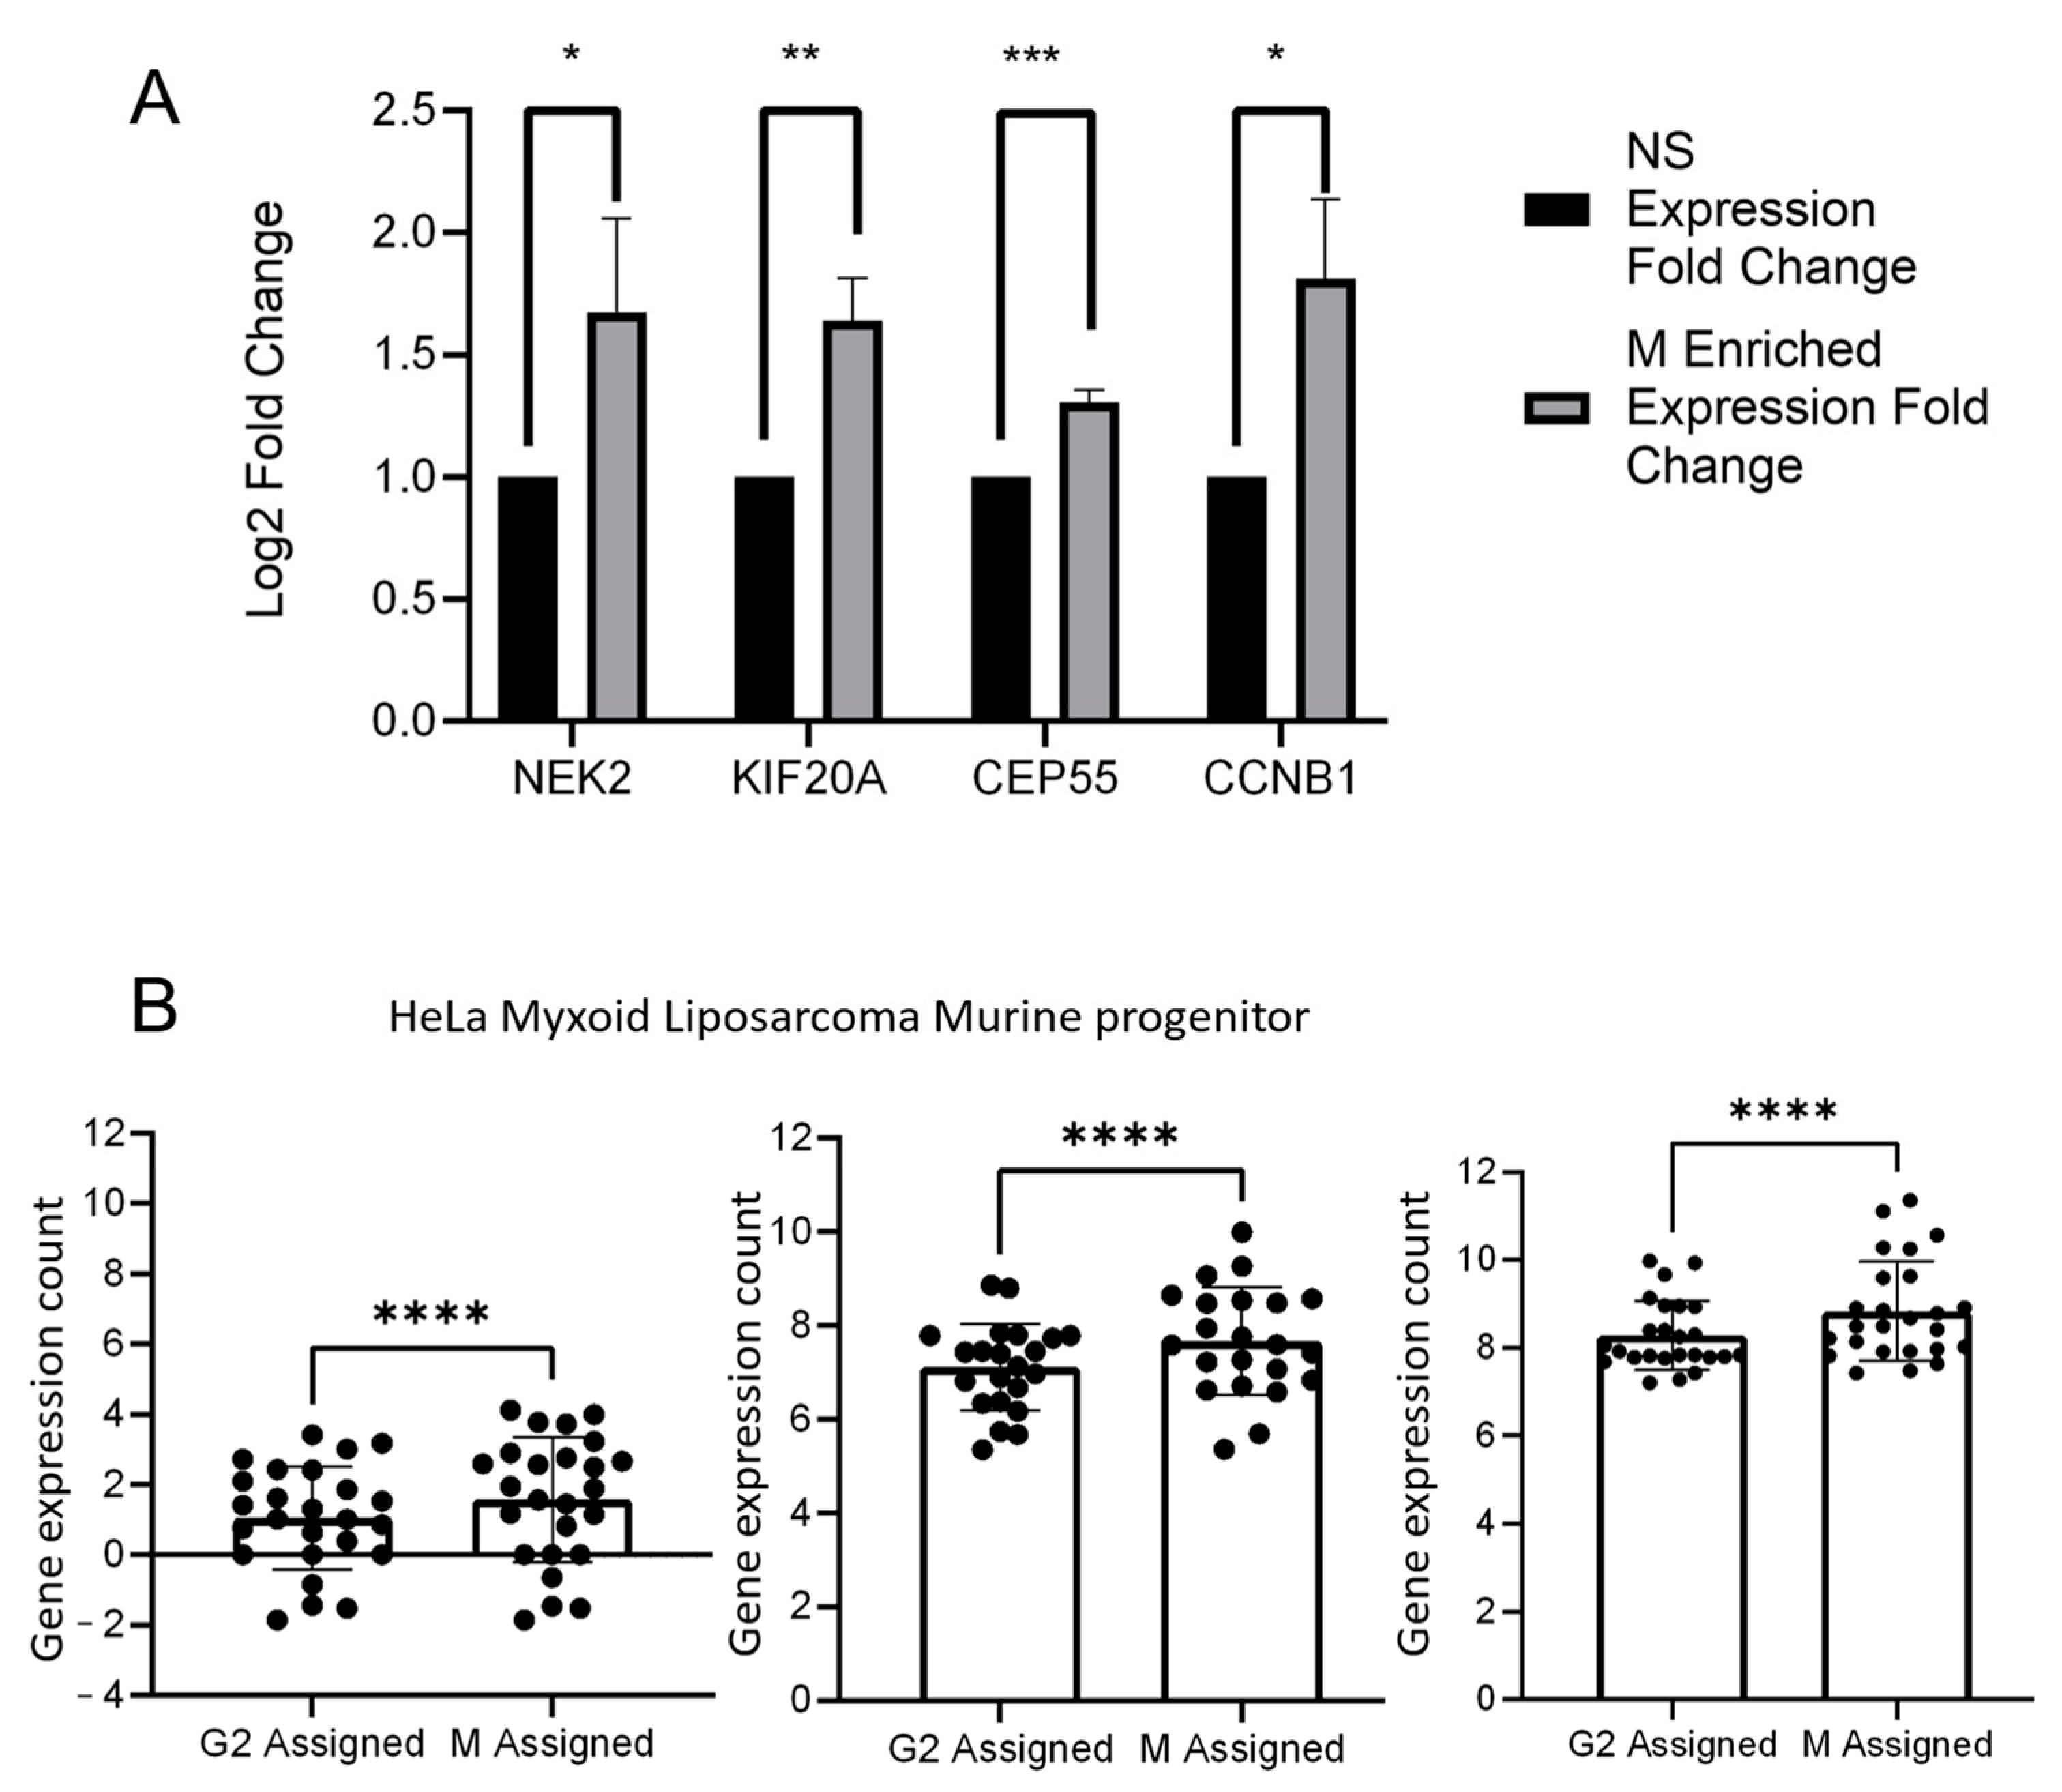
4.7. RT-qPCR
4.8. Gene Function Ontologies
4.9. Data and Code Availability
Supplementary Materials
Author Contributions
Funding
Institutional Review Board Statement
Informed Consent Statement
Data Availability Statement
Acknowledgments
Conflicts of Interest
References
- Sanchez, A.; Golding, I. Genetic determinants and cellular constraints in noisy gene expression. Science 2013, 2, 1188–1193. [Google Scholar] [CrossRef] [PubMed]
- Keren, L.; Van Dijk, D.; Weingarten-Gabbay, S.; Davidi, D.; Jona, G.; Weinberger, A.; Milo, R.; Segal, E. Noise in gene expression is coupled to growth rate. Genome Res. 2015, 25, 1893–1902. [Google Scholar] [CrossRef] [PubMed]
- Soltani, M.; Singh, A. Effects of cell-cycle-dependent expression on random fluctuations in protein levels. R. Soc. Open Sci. 2016, 3, 160578. [Google Scholar] [CrossRef] [PubMed]
- Leng, N.; Chu, L.F.; Barry, C.; Li, Y.; Choi, J.; Li, X.; Jiang, P.; Stewart, R.M.; Thomson, J.A.; Kendziorski, C. Oscope identifies oscillatory genes in unsynchronized single-cell RNA-seq experiments. Nat. Methods 2015, 12, 947–950. [Google Scholar] [CrossRef] [PubMed]
- Hsiao, C.J.; Tung, P.; Blischak, J.D.; Burnett, J.E.; Barr, K.A.; Dey, K.K.; Stephens, M.; Gilad, Y. Characterizing and inferring quantitative cell cycle phase in single-cell RNA-seq data analysis. Genome Res. 2020, 30, 611–621. [Google Scholar] [CrossRef] [PubMed]
- Liu, Z.; Lou, H.; Xie, K.; Wang, H.; Chen, N.; Aparicio, O.M.; Zhang, M.Q.; Jiang, R.; Chen, T. Reconstructing cell cycle pseudo time-series via single-cell transcriptome data. Nat. Commun. 2017, 8, 22. [Google Scholar] [CrossRef]
- Scialdone, A.; Natarajan, K.N.; Saraiva, L.R.; Proserpio, V.; Teichmann, S.A.; Stegle, O.; Marioni, J.C.; Buettner, F. Computational assignment of cell-cycle stage from single-cell transcriptome data. Methods 2015, 85, 54–61. [Google Scholar] [CrossRef] [PubMed]
- Butler, A.; Hoffman, P.; Smibert, P.; Papalexi, E.; Satija, R. Integrating single-cell transcriptomic data across different conditions, technologies, and species. Nat. Biotechnol. 2018, 36, 411–420. [Google Scholar] [CrossRef]
- Hao, Y.; Hao, S.; Andersen-Nissen, E.; Mauck, W.M., 3rd; Zheng, S.; Butler, A.; Lee, M.J.; Wilk, A.J.; Darby, C.; Zager, M.; et al. Integrated analysis of multimodal single-cell data. Cell 2021, 184, 3573–3587.e29. [Google Scholar] [CrossRef]
- Parsons, G.G.; Spencer, C.A. Mitotic repression of RNA polymerase II transcription is accompanied by release of transcription elongation complexes. Mol. Cell Biol. 1997, 17, 5791–5802. [Google Scholar] [CrossRef]
- Prescott, D.M.; Bender, M.A. Synthesis of RNA and protein during mitosis in mammalian tissue culture cells. Exp. Cell Res. 1962, 26, 260–268. [Google Scholar] [CrossRef] [PubMed]
- Taylor, J.H. Nucleic acid synthesis in relation to the cell division cycle. Ann. N. Y. Acad. Sci. 1960, 90, 409–421. [Google Scholar] [CrossRef] [PubMed]
- Palozola, K.C.; Donahue, G.; Liu, H.; Grant, G.R.; Becker, J.S.; Cote, A.; Yu, H.; Raj, A.; Zaret, K.S. Mitotic transcription and waves of gene reactivation during mitotic exit. Science 2017, 358, 119–122. [Google Scholar] [CrossRef] [PubMed]
- Liu, H.; Qu, Q.; Warrington, R.; Rice, A.; Cheng, N.; Yu, H. Mitotic Transcription Installs Sgo1 at Centromeres to Coordinate Chromosome Segregation. Mol. Cell 2015, 59, 426–436. [Google Scholar] [CrossRef] [PubMed]
- Oestergaard, V.H.; Lisby, M. Transcription-replication conflicts at chromosomal fragile sites-consequences in M phase and beyond. Chromosoma 2017, 126, 213–222. [Google Scholar] [CrossRef] [PubMed]
- Flynn, R.L.; Cox, K.E.; Jeitany, M.; Wakimoto, H.; Bryll, A.R.; Ganem, N.J.; Bersani, F.; Pineda, J.R.; Suva, M.L.; Benes, C.H.; et al. Alternative lengthening of telomeres renders cancer cells hypersensitive to ATR inhibitors. Science 2015, 347, 273–277. [Google Scholar] [CrossRef] [PubMed]
- Hu, W.E.; Zhang, X.; Guo, Q.F.; Yang, J.W.; Yang, Y.; Wei, S.C.; Su, X.D. HeLa-CCL2 cell heterogeneity studied by single-cell DNA and RNA sequencing. PLoS ONE 2019, 14, e0225466. [Google Scholar] [CrossRef]
- Juan, G.; Traganos, F.; James, W.M.; Ray, J.M.; Roberge, M.; Sauve, D.M.; Anderson, H.; Darzynkiewicz, Z. Histone H3 phosphorylation and expression of cyclins A and B1 measured in individual cells during their progression through G and mitosis. Cytometry 1998, 32, 71–77. [Google Scholar] [CrossRef]
- Nestorowa, S.; Hamey, F.K.; Pijuan Sala, B.; Diamanti, E.; Shepherd, M.; Laurenti, E.; Wilson, N.K.; Kent, D.G.; Gottgens, B. A single-cell resolution map of mouse hematopoietic stem and progenitor cell differentiation. Blood 2016, 128, e20–e31. [Google Scholar] [CrossRef]
- Karlsson, J.; Kroneis, T.; Jonasson, E.; Larsson, E.; Ståhlberg, A. Transcriptomic Characterization of the Human Cell Cycle in Individual Unsynchronized Cells. J. Mol. Biol. 2017, 429, 3909–3924. [Google Scholar] [CrossRef]
- Satija, R. Cell-Cycle Scoring and Regression Vignette. Available online: https://satijalab.org/seurat/articles/cell_cycle_vignette.html (accessed on 21 October 2022).
- Wei, Y.; Mizzen, C.A.; Cook, R.G.; Gorovsky, M.A.; Allis, C.D. Phosphorylation of histone H3 at serine 10 is correlated with chromosome condensation during mitosis and meiosis in Tetrahymena. Proc. Natl. Acad. Sci. USA 1998, 95, 7480–7484. [Google Scholar] [CrossRef] [PubMed]
- Gurley, L.R.; D’Anna, J.A.; Barham, S.S.; Deaven, L.L.; Tobey, R.A. Histone phosphorylation and chromatin structure during mitosis in Chinese hamster cells. Eur. J. Biochem. 1978, 84, 1–15. [Google Scholar] [CrossRef] [PubMed]
- Kim, J.Y.; Jeong, H.S.; Chung, T.; Kim, M.; Lee, J.H.; Jung, W.H.; Koo, J.S. The value of phosphohistone H3 as a proliferation marker for evaluating invasive breast cancers: A comparative study with Ki67. Oncotarget 2017, 8, 65064–65076. [Google Scholar] [CrossRef] [PubMed]
- Thompson, R.; Gatenby, R.; Sidi, S. How Cells Handle DNA Breaks during Mitosis: Detection, Signaling, Repair, and Fate Choice. Cells 2019, 8, 1049. [Google Scholar] [CrossRef] [PubMed]
- DeLuca, J.G.; Moree, B.; Hickey, J.M.; Kilmartin, J.V.; Salmon, E.D. hNuf2 inhibition blocks stable kinetochore-microtubule attachment and induces mitotic cell death in HeLa cells. J. Cell Biol. 2002, 159, 549–555. [Google Scholar] [CrossRef] [PubMed]
- Woods, C.M.; Zhu, J.; McQueney, P.A.; Bollag, D.; Lazarides, E. Taxol-induced mitotic block triggers rapid onset of a p53-independent apoptotic pathway. Mol. Med. 1995, 1, 506–526. [Google Scholar] [CrossRef] [PubMed]
- Kirson, E.D.; Dbaly, V.; Tovarys, F.; Vymazal, J.; Soustiel, J.F.; Itzhaki, A.; Mordechovich, D.; Steinberg-Shapira, S.; Gurvich, Z.; Schneiderman, R.; et al. Alternating electric fields arrest cell proliferation in animal tumor models and human brain tumors. Proc. Natl. Acad. Sci. USA 2007, 104, 10152–10157. [Google Scholar] [CrossRef] [PubMed]
- Antonarakis, S.E.; Avramopoulos, D.; Blouin, J.L.; Talbot, C.C., Jr.; Schinzel, A.A. Mitotic errors in somatic cells cause trisomy 21 in about 4.5% of cases and are not associated with advanced maternal age. Nat. Genet. 1993, 3, 146–150. [Google Scholar] [CrossRef] [PubMed]
- Nicolaidis, P.; Petersen, M.B. Origin and mechanisms of non-disjunction in human autosomal trisomies. Hum. Reprod. 1998, 13, 313–319. [Google Scholar] [CrossRef]
- Gisselsson, D.; Jin, Y.; Lindgren, D.; Persson, J.; Gisselsson, L.; Hanks, S.; Sehic, D.; Mengelbier, L.H.; Ora, I.; Rahman, N.; et al. Generation of trisomies in cancer cells by multipolar mitosis and incomplete cytokinesis. Proc. Natl. Acad. Sci. USA 2010, 107, 20489–20493. [Google Scholar] [CrossRef]
- Potapova, T.; Gorbsky, G.J. The Consequences of Chromosome Segregation Errors in Mitosis and Meiosis. Biology 2017, 6, 12. [Google Scholar] [CrossRef] [PubMed]
- Rasche, H.; Hiltemann, S.; De Koning, W. The Galaxy platform for accessible, reproducible and collaborative biomedical analyses: 2022 update. Nucleic Acids Res. 2022, 50, W345–W351. [Google Scholar] [CrossRef]
- Kim, D.; Paggi, J.M.; Park, C.; Bennett, C.; Salzberg, S.L. Graph-based genome alignment and genotyping with HISAT2 and HISAT-genotype. Nat. Biotechnol. 2019, 37, 907–915. [Google Scholar] [CrossRef] [PubMed]
- Putri, G.H.; Anders, S.; Pyl, P.T.; Pimanda, J.E.; Zanini, F. Analysing high-throughput sequencing data in Python with HTSeq 2.0. Bioinformatics 2022, 38, 2943–2945. [Google Scholar] [CrossRef]
- Love, M.I.; Huber, W.; Anders, S. Moderated estimation of fold change and dispersion for RNA-seq data with DESeq2. Genome Biol. 2014, 15, 550. [Google Scholar] [CrossRef]
- Livak, K.J.; Schmittgen, T.D. Analysis of relative gene expression data using real-time quantitative PCR and the 2(-Delta Delta C(T)) Method. Methods 2001, 25, 402–408. [Google Scholar] [CrossRef]


| Upregulated Genes (Mitotic) | padj | log2FoldChange | Function |
|---|---|---|---|
| CENPE | 0.000664 | 1.125147 | Centromere Protein E |
| KNL1 | 0.000959 | 1.038927 | Kinetochore Scaffold 1 |
| PIMREG | 0.000959 | 0.999074 | PICALM Interacting Mitotic Regulator |
| PLK1 | 0.000966 | 1.403274 | Polo Like Kinase 1 |
| KIF14 | 0.000966 | 0.95761 | Kinesin Family Member 14 |
| TPX2 | 0.001844 | 1.33757 | TPX2 Microtubule Nucleation Factor |
| KIF20A | 0.002307 | 1.579072 | Kinesin Family Member 20A |
| SAPCD2 | 0.003489 | 1.203906 | Suppressor APC Domain Containing 2 |
| KNSTRN | 0.003702 | 1.225519 | Kinetochore Astrin (SPAG5) Binding Protein |
| PRR11 | 0.003702 | 1.214335 | Proline Rich 11 |
| NUF2 | 0.003702 | 0.79701 | NUF2 Component Of Kinetochore Complex |
| ASPM | 0.004089 | 1.173306 | Assembly Factor For Spindle Microtubules |
| CEP55 | 0.004128 | 1.546348 | Centrosomal Protein 55 |
| BUB1 | 0.004764 | 1.183972 | BUB1 Mitotic Serine/Threonine Kinase |
| SGO2 | 0.005583 | 1.367488 | Shugoshin 2 |
| GAS2L3 | 0.005583 | 0.932372 | Growth Arrest Specific 2 Like 3 |
| NEK2 | 0.005939 | 1.737096 | NIMA Related Kinase 2 |
| HMMR | 0.005939 | 1.470353 | Hyaluronan Mediated Motility Receptor |
| DEPDC1 | 0.006015 | 1.184454 | DEP Domain Containing 1 |
| DLGAP5 | 0.007283 | 1.286611 | DLG Associated Protein 5 |
| ARL6IP1 | 0.007283 | 1.211374 | ADP Ribosylation Factor Like GTPase 6 Interacting Protein 1 |
| NUSAP1 | 0.007283 | 0.770366 | Nucleolar and Spindle Associated Protein 1 |
| CCNA2 | 0.007506 | 1.448108 | Cyclin A2 |
| VANGL1 | 0.008325 | 0.875813 | VANGL Planar Cell Polarity Protein 1 |
| CDC20 | 0.008993 | 1.462092 | Cell Division Cycle 20 |
| KIF4A | 0.009799 | 1.454416 | Kinesin Family Member 4A |
| KIF20B | 0.01 | 1.224597 | Kinesin Family Member 20B |
| Downregulated Genes (Interphase) | padj | log2FoldChange | Function |
|---|---|---|---|
| E2F1 | 2.84 × 10⁻⁷ | −2.17369 | E2F Transcription Factor 1 |
| CCNE1 | 2.97 × 10⁻⁵ | −2.2646 | Cyclin E1 |
| FBXL20 | 0.000966 | −1.54022 | F-box And Leucine-Rich Repeat Protein 20 |
| DTL | 0.000966 | −1.53821 | Denticleless E3 Ubiquitin Ligase Homolog |
| ENSG00000273759 | 0.001844 | −2.59207 | Uncategorised |
| RMI2 | 0.001844 | −1.63698 | Recq Mediated Genome Instability 2 |
| ZMYND19 | 0.003489 | −0.79722 | Zinc Finger Mynd-Type Containing 19 |
| MCM5 | 0.003702 | −1.53998 | Minichromosome Maintenance Component 5 |
| ZNF367 | 0.003809 | −1.44647 | Zinc Finger Protein 367 |
| FRAT1 | 0.004089 | −1.81741 | FRAT Regulator Of WNT Signalling Pathway 1 |
| BRD2 | 0.005583 | −1.7275 | Bromodomain Containing 2 |
| ENSG00000272106 | 0.007283 | −2.14137 | Uncategorised |
| PPP1R3C | 0.007283 | −1.51771 | Protein Phosphatase 1 Regulatory Subunit 3C |
| ENSG00000275484 | 0.008993 | −2.31626 | Uncategorised |
| UNG | 0.009006 | −1.44849 | Uracil DNA Glycosylase |
| IFI27L1 | 0.009278 | −2.29293 | Interferon Alpha Inducible Protein 27 Like 1 |
| CDC6 | 0.009799 | −0.95402 | Cell Division Cycle 6 |
| Mitotic Gene of Interest Grouped via GO Function | |||
|---|---|---|---|
| GO Linked Ontology | p-Value | Ensembl | Gene Symbol |
| Anaphase-Promoting Complex Binding (GO Function) | 6.06 × 10⁻⁵ | ENSG00000117399. ENSG00000166851. | CDC20. PLK1. |
| ATP Binding (GO Function) | 6.0 × 10⁻⁴ | ENSG00000112984. ENSG00000138182. ENSG00000118193. ENSG00000090889. ENSG00000166851. ENSG00000169679. ENSG00000117650. ENSG00000138778. | KIF20A. KIF20B. KIF14. KIF4A. PLK1. BUB1. NEK2. CENPE. |
| Kinetochore (GO Component) | 7.67 × 10⁻¹² | ENSG00000166851. ENSG00000169679. ENSG00000143228. ENSG00000138778. ENSG00000117650. ENSG00000163535. ENSG00000128944. ENSG00000137812. | PLK1. BUB1. NUF2. CENPE. NEK2. SGOL2. KNSTRN. CASC5. |
| Microtubule Motor Activity (GO Function) | 3.73 × 10⁻⁸ | ENSG00000138182. ENSG00000138778. ENSG00000112984. ENSG00000118193. ENSG00000090889. | KIF20B. CENPE. KIF20A. KIF14. KIFA. |
| Microtubule Binding (GO Function) | 3.28 × 10⁻¹⁴ | ENSG00000118193. ENSG00000112984. ENSG00000138182. ENSG00000090889. ENSG00000128944. ENSG00000137804. ENSG00000166851. ENSG00000088325. ENSG00000138778. ENSG00000126787. ENSG00000139354. | KIF14. KIF20A. KIF20B. KIF4A. KNSTRN. NUSAP1. PLK1. TPX2. CENPE. DLGAP5. GAS2L3. |
| Tubulin Binding (GO Function) | 9.51 × 10⁻¹³ | ENSG00000118193. ENSG00000112984. ENSG00000138182. ENSG00000090889. ENSG00000128944. ENSG00000137804. ENSG00000166851. ENSG00000088325. ENSG00000138778. ENSG00000126787. ENSG00000139354. | KIF14. KIF20A. KIF20B. KIF4A. KNSTRN. NUSAP1. PLK1. TPX2. CENPE. DLGAP5. GAS2L3. |
| Mitotic Spindle Pole (GO Component) | 1.61 × 10⁻⁵ | ENSG00000166851. ENSG00000138182. ENSG00000066279. | PLK1. KIF20B. ASPM. |
| Protein Binding (GO Function) | 9.12 × 10⁻⁴ | ENSG00000169679. ENSG00000129195. ENSG00000072571. ENSG00000173218. ENSG00000163535. ENSG00000128944. ENSG00000118193. ENSG00000138180. ENSG00000186193. ENSG00000166851. ENSG00000126787. ENSG00000137804. ENSG00000143228. ENSG00000145386. ENSG00000090889. ENSG00000137812. ENSG00000138182. ENSG00000170540. ENSG00000117650. ENSG00000066279. ENSG00000112984. ENSG00000088325. ENSG00000139354. ENSG00000117399. ENSG00000138778. ENSG00000024526. | BUB1. FAM64A. HMMR. VANGL1. SGOL2. KNSTRN. KIF14. CEP55. SAPCD2. PLK1. DLGAP5. NUSAP1. NUF2. CCNA2. KIF4A. CASC5. KIF20B. ARL6IP1. NEK2. ASPM. KIF20A. TPX2. GAS2L3. CDC20. CENPE. DEPDC1. |
Disclaimer/Publisher’s Note: The statements, opinions and data contained in all publications are solely those of the individual author(s) and contributor(s) and not of MDPI and/or the editor(s). MDPI and/or the editor(s) disclaim responsibility for any injury to people or property resulting from any ideas, methods, instructions or products referred to in the content. |
© 2024 by the authors. Licensee MDPI, Basel, Switzerland. This article is an open access article distributed under the terms and conditions of the Creative Commons Attribution (CC BY) license (https://creativecommons.org/licenses/by/4.0/).
Share and Cite
Watson, S.; Porter, H.; Sudbery, I.; Thompson, R. Modification of Seurat v4 for the Development of a Phase Assignment Tool Able to Distinguish between G2 and Mitotic Cells. Int. J. Mol. Sci. 2024, 25, 4589. https://doi.org/10.3390/ijms25094589
Watson S, Porter H, Sudbery I, Thompson R. Modification of Seurat v4 for the Development of a Phase Assignment Tool Able to Distinguish between G2 and Mitotic Cells. International Journal of Molecular Sciences. 2024; 25(9):4589. https://doi.org/10.3390/ijms25094589
Chicago/Turabian StyleWatson, Steven, Harry Porter, Ian Sudbery, and Ruth Thompson. 2024. "Modification of Seurat v4 for the Development of a Phase Assignment Tool Able to Distinguish between G2 and Mitotic Cells" International Journal of Molecular Sciences 25, no. 9: 4589. https://doi.org/10.3390/ijms25094589