Evaluating Amphibian Declines with Site Revisits and Occupancy Models: Status of Montane Anurans in the Pacific Northwest USA

Abstract
:1. Introduction
2. Methods
2.1. Study Region and Amphibians
2.2. Data Collection

| Variable | Group | B. boreas | R. cascadae | ||
|---|---|---|---|---|---|
| Continuous variables | x (SD) | Range | x (SD) | Range | |
| Vegetation | Pond | 29.8 (32.3) | 0–100 | 37.0 (33.0) | 0–97 |
| Forest 1 | Local | 83.3 (21.6) | 20–100 | – | – |
| Elevation | Regional | 1539.7 (321.2) | 609–2070 | 1528.9 (323.6) | 755–2022 |
| EastING | Regional | 567210 (41337) | 418810– 615777 | 576744 (26262) | 532075– 615777 |
| NorthING | Regional | 4826589 (111968) | 4652849– 5038052 | 4857576 (98053) | 4713503– 5044414 |
| Categorical variables | Found (%) | Not Found (%) | Found (%) | Not Found (%) | |
| Fish | Pond | 68.5 | 31.5 | 26.7 | 73.3 |
| Manmade | Pond | 11.1 | 88.9 | 10.5 | 89.5 |
| Permanent | Pond | 88.9 | 11.1 | 55.8 | 44.2 |
| Forest 1 | Local | – | – | 69.6 | 30.3 |
| PavedRoad | Local | 16.7 | 83.3 | 8.1 | 91.9 |
| AnyRoad | Local | 53.7 | 46.3 | 46.5 | 53.5 |
| Age | Age | 68.5 <10 yr 7.4 11–20 yr 1.9 21–30 yr 5.6 31–40 yr 11.1 41–50 yr 5.6 >50 yr | 1–53 | 74.2 <10 yr 13.6 11–20 yr 1.5 21–30 yr 4.5 31–40 yr 4.5 41–50 yr 1.5 >50 yr | 1–51 |
2.3. Analysis
3. Results
3.1. Bufo Boreas

| Model | AIC | ΔAIC | No. Par. | -2 log[L] |
|---|---|---|---|---|
| Detectability | ||||
| ψ(.), p(.,YEAR1,FISH) | 113.07 | 0.00 | 4 | 105.07 |
| ψ(.), p(.,FISH) | 116.04 | 2.97 | 3 | 110.04 |
| ψ(.), p(.,YEAR1,VEGETATION) | 117.92 | 4.85 | 4 | 109.92 |
| ψ(.), p(.,VEGETATION) | 122.09 | 9.02 | 3 | 116.09 |
| ψ(.), p(.,YEAR1) | 124.38 | 11.31 | 3 | 118.38 |
| ψ(.), p(.) | 125.93 | 12.86 | 2 | 121.93 |
| Pond | ||||
| ψ(.), p(.,YEAR1, FISH) | 113.07 | 0.00 | 4 | 105.07 |
| ψ(.,FISH), p(.,YEAR1, FISH) | 113.53 | 0.46 | 5 | 103.53 |
| ψ(.,Manmade), p(.,YEAR1, FISH) | 114.00 | 0.93 | 5 | 104.00 |
| ψ(.,VegETATION), p(.,YEAR1, FISH) | 114.30 | 1.23 | 5 | 104.30 |
| ψ(.,Permanent), p(.,YEAR1, FISH) | 114.93 | 1.86 | 5 | 104.93 |
| Local Landscape | ||||
| ψ(.,PavedRoad), p(.,YEAR1,Fish) | 112.41 | 0.00 | 5 | 102.41 |
| ψ(.), p(.,Year1,Fish) | 113.07 | 0.66 | 4 | 105.07 |
| ψ(.,AnyRoad), p(.,YEAR1,Fish) | 113.54 | 1.13 | 5 | 103.54 |
| ψ(.,Forest), p(.,YEAR1,Fish) | 114.73 | 2.32 | 5 | 104.73 |
| Regional Location | ||||
| ψ(.,Easting), p(.,YEAR1,Fish) | 106.95 | 0.00 | 5 | 96.95 |
| ψ(.,Elevation×Northing), p(.,YEAr1,Fish) | 113.06 | 6.11 | 7 | 99.06 |
| ψ(.), p(.,YEAR1,Fish) | 113.07 | 6.12 | 4 | 105.07 |
| ψ(.,Northing), p(.,YEAr1,Fish) | 113.17 | 6.22 | 5 | 103.17 |
| ψ(.,Elevation), p(.,YEAR1,Fish) | 115.06 | 8.11 | 5 | 105.06 |
| Final Models | ||||
| ψ(.,Age, Easting), p(.,YEAR1,Fish) | 106.62 | 0.00 | 6 | 94.62 |
| ψ(.,Easting), p(.,YEAr1,Fish) | 106.95 | 0.33 | 5 | 96.95 |
| ψ(.,Age), p(.,YEAR1,Fish) | 111.67 | 5.05 | 5 | 101.67 |
| ψ(.), p(.,YEAr1,Fish) | 113.07 | 6.45 | 4 | 105.07 |
3.2. Rana Cascadae

| Model | AIC | ΔAIC | No. Par. | –2 log[L] |
|---|---|---|---|---|
| Detectability | ||||
| ψ(.), p(.,Fish) | 133.27 | 0.00 | 3 | 127.27 |
| ψ(.), p(.) | 134.37 | 1.10 | 2 | 130.37 |
| ψ(.), p(.,Year1,Fish) | 135.16 | 1.89 | 4 | 127.16 |
| ψ(.), p(.,Fish×VEGETATION) | 135.54 | 2.27 | 5 | 125.54 |
| ψ(.), p(.,Year1) | 135.76 | 2.49 | 3 | 129.76 |
| ψ(.), p(.,VEGETATION) | 136.28 | 3.01 | 3 | 130.28 |
| ψ(.), p(.,Year1, VEGETATION) | 137.11 | 3.84 | 4 | 129.11 |
| ψ(.), p(.,Year1,Fish×VEGETATION) | 137.26 | 3.99 | 6 | 125.26 |
| Pond | ||||
| ψ(.), p(.,Fish) | 133.27 | 0.00 | 3 | 127.26 |
| ψ(.,Fish), p(.,Fish) | 134.71 | 1.44 | 4 | 126.71 |
| ψ(.,VEGETATION), p(.,Fish) | 135.24 | 1.97 | 4 | 127.24 |
| ψ(.,Permanent), p(.,Fish) | 135.25 | 1.98 | 4 | 127.25 |
| ψ(.,Manmade), p(.,Fish) | 135.26 | 1.99 | 4 | 127.26 |
| ψ(.,Fish×VEGETATION), p(.,Fish) | 138.69 | 5.42 | 6 | 126.69 |
| Local Landscape | ||||
| ψ(.), p(.,FISH) | 133.27 | 0.00 | 3 | 127.26 |
| ψ(.,PAVEDROAD), p(.,FISH) | 133.40 | 0.13 | 4 | 125.40 |
| ψ(.,ANYROAD), p(.,FISH) | 133.95 | 0.68 | 4 | 125.95 |
| ψ(.,FOREST), p(.,FISH) | 134.43 | 1.16 | 4 | 126.43 |
| Regional Location | ||||
| ψ(.), p(.,FISH) | 133.27 | 0.00 | 3 | 127.26 |
| ψ(.,Northing), p(.,FISH) | 134.69 | 1.42 | 4 | 126.69 |
| ψ(.,Elevation), p(.,FISH) | 134.92 | 1.65 | 4 | 126.92 |
| ψ(.,Easting), p(.,FISH) | 134.96 | 1.69 | 4 | 126.96 |
| ψ(.,Elevation×Northing), p(.,FISH) | 136.72 | 3.45 | 6 | 124.72 |
| Final Models | ||||
| ψ(.), p(.,FISH) | 133.27 | 0.00 | 3 | 127.27 |
| ψ(.,Age), p(.,FISH) | 135.26 | 1.99 | 4 | 127.26 |
4. Discussion
| B. boreas | R. cascadae | Latitudinal range (UTM) | Hydrographic basins | |
|---|---|---|---|---|
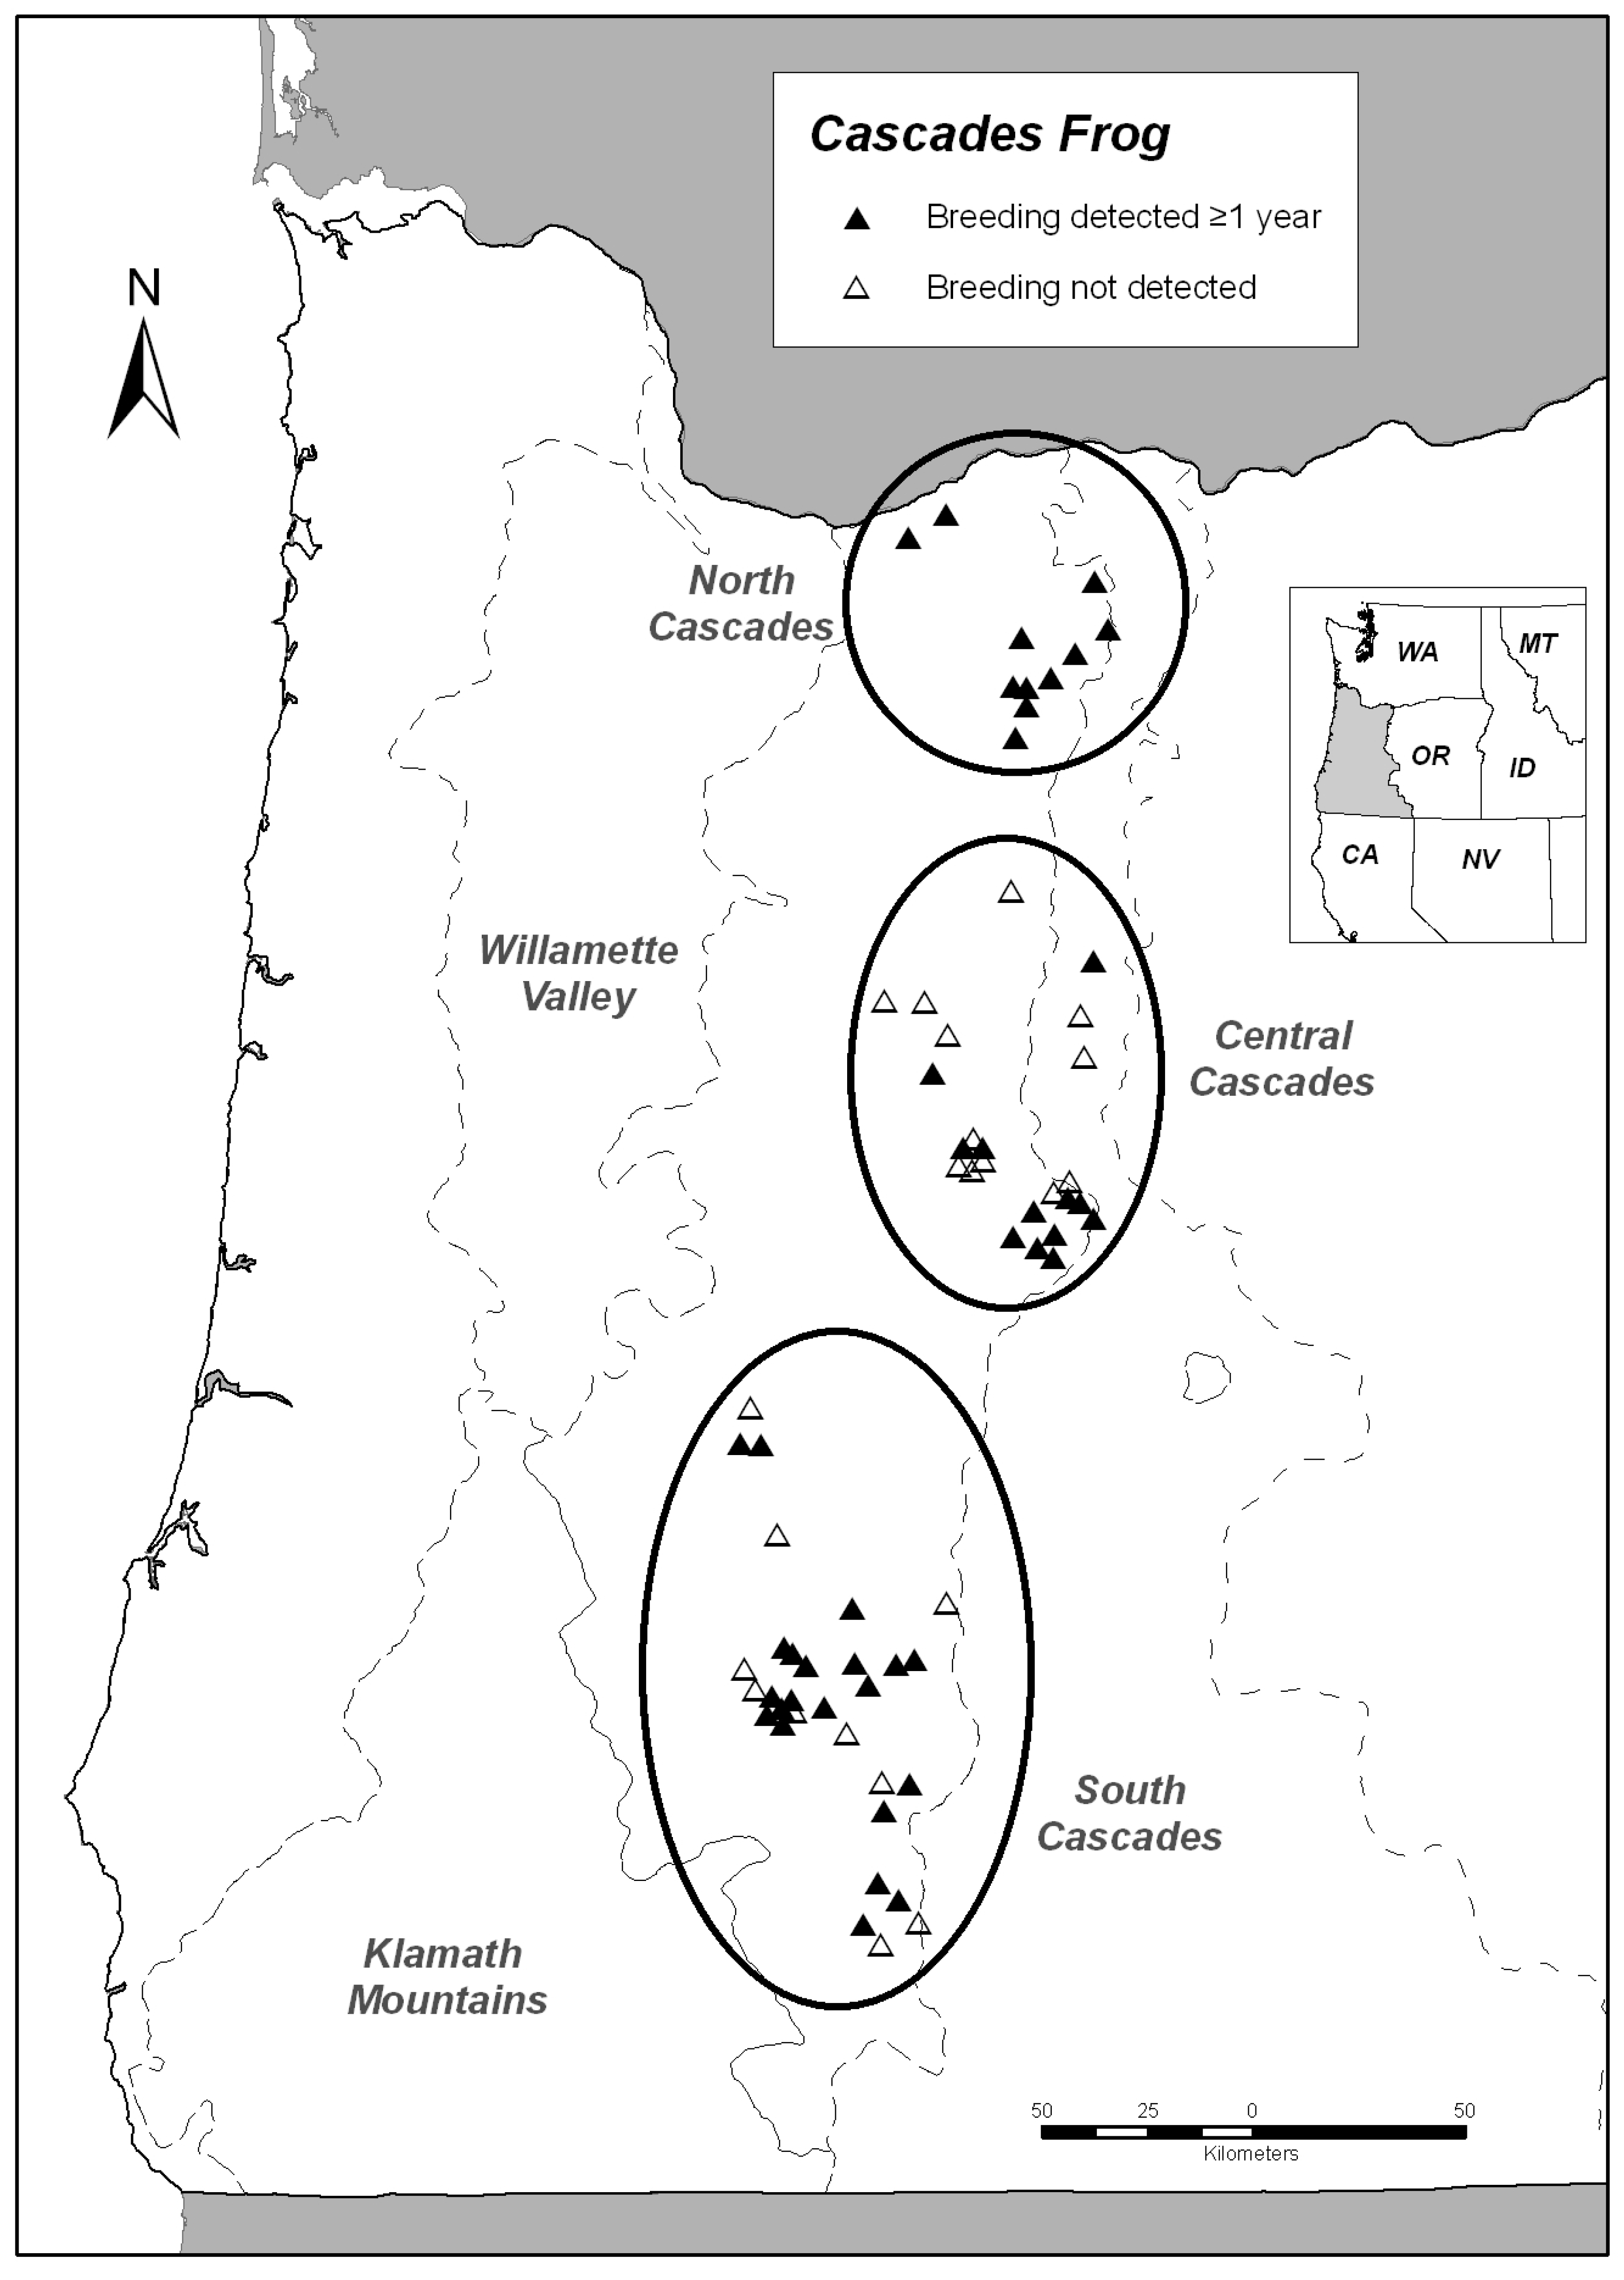
| North Cascades | 100% (7/7) | 100% (11/11) | 5044414–4999658 | Willamette, Deschutes, Columbia |
| Central Cascades | 88.2% (15/17) | 50.0% (12/24) | 4957389–4862946 | McKenzie, Deschutes, Santiam |
| South Cascades | 77.3% (17/22) | 67.7% (21/31) | 4835513–4713495 | Umpqua, Rogue, Klamath |
| Klamath Mountains | 37.5% (3/8) | 0 (0/0) | 4671782–4652849 | Rogue, Illinois, Chetco |
Acknowledgements
References
- Stuart, S.N.; Chanson, J.S.; Cox, N.A.; Young, B.E.; Rodrigues, A.S.L.; Fischman, D.L.; Waller, R.W. Status and trends of amphibian declines and extinctions worldwide. Science 2004, 306, 1783–1786. [Google Scholar] [CrossRef] [PubMed]
- Fellers, G.M.; Drost, C.A. Disappearance of the Cascades frog Rana cascadae at the southern end of its range, California, USA. Biol. Conserv. 1993, 65, 177–181. [Google Scholar]
- Kiesecker, J.M.; Blaustein, A.R.; Belden, L.K. Complex causes of amphibian population declines. Nature 2001, 410, 681–684. [Google Scholar] [CrossRef] [PubMed]
- Davidson, C.; Shaffer, H.B.; Jennings, M.R. Spatial tests of the pesticide drift, habitat destruction, UV-B, and climate-change hypotheses for California amphibian declines. Conserv. Biol. 2002, 16, 1588–1601. [Google Scholar] [CrossRef]
- Blaustein, A.R.; Wake, D.B. Declining amphibian populations: a global phenomenon? Trends Ecol. Evol. 1990, 5, 203–204. [Google Scholar]
- Olson, D.H. Ecology and management of montane amphibians of the US Pacific Northwest. Biota 2001, 2, 51–74. [Google Scholar]
- Corn, P.S.; Stolzenburg, W.; Bury, R.B. Acid precipitation studies in Colorado and Wyoming: interim report of surveys of montane amphibians and water chemistry; US Fish and Wildlife Service Biological Report: Washington, DC, USA, 1989; p. 56. [Google Scholar]
- Skelly, D.K.; Yurewicz, K.L.; Werner, E.E.; Relyea, R.A. Estimating decline and distributional change in amphibians. Conserv. Biol. 2003, 17, 744–751. [Google Scholar] [CrossRef]
- Drost, C.A.; Fellers, G.M. Collapse of a regional frog fauna in the Yosemite area of the California Sierra Nevada, USA. Conserv. Biol. 1996, 10, 414–425. [Google Scholar] [CrossRef]
- Fisher, R.N.; Shaffer, H.B. The decline of amphibians in California's great central valley. Conserv. Biol. 1996, 10, 1387–1397. [Google Scholar] [CrossRef]
- Wente, W.H.; Adams, M.J.; Pearl, C.A. Evidence of decline for Bufo boreas and Rana luteiventris in and around the northern Great Basin, western USA. Alytes 2005, 22, 95–108. [Google Scholar]
- MacKenzie, D.I.; Nichols, J.D.; Lachman, G.B.; Droege, S.; Royle, A.; Langtimm, C.A. Estimating site occupancy rates when detection probabilities are less than one. Ecology 2002, 83, 2248–2255. [Google Scholar] [CrossRef]
- Grinnell, J.; Dixon, J.; Linsdale, J.M. Vertebrate Natural history of a Section of Northern California through the Lassen Peak Region. University of California Publ. Zoology 1930, 35, 1–594. [Google Scholar]
- Nussbaum, R.A.; Brodie, E.D., Jr.; Storm, R.M. Amphibians and reptiles of the Pacific Northwest; University of Idaho Press: Moscow, ID, USA, 1983; p. 332. [Google Scholar]
- Blaustein, A.R.; Hokit, D.G.; O’Hara, R.K. Pathogenic fungus contributes to amphibian losses in the Pacific northwest. Biol. Conserv. 1994, 67, 251–254. [Google Scholar] [CrossRef]
- Fite, K.V.; Blaustein, A.R.; Bengston, L.; Hewitt, H.E. Evidence of retinal light damage in Rana cascadae: a declining amphibian species. Copeia 1998, 1998, 906–914. [Google Scholar] [CrossRef]
- Fellers, G.M.; Pope, K.L.; Stead, J.E.; Koo, M.S.; Welsh, H.H., Jr. Turning population trend monitoring into active conservation: can we save the Cascades Frog in the Lassen region of California? Herpetol. Conserv. Biol. 2008, 3, 28–39. [Google Scholar]
- Muths, E.; Corn, P.S.; Pessier, A.P.; Green, D.E. Evidence for disease-related amphibian decline in Colorado. Biol. Conserv. 2003, 110, 357–365. [Google Scholar] [CrossRef]
- Bahls, P. The status of fish populations and management of high montane lakes in the western United States. Northwest Sci. 1992, 66, 183–193. [Google Scholar]
- Porter, S.C.; Pierce, K.L.; Hamilton, T.D. Late Wisconsin mountain glaciation in the western United States. In Late-Quaternary environments of the United States; Porter, S.C., Ed.; Univ. Minnesota Press: Minneapolis, MN, USA, 1983; Volume 1, pp. 70–111. [Google Scholar]
- Olson, D.H. Ecological susceptibility of amphibians to population declines. In Proceedings of the Symposium on Biodiversity of Northwestern California, Univ. California Press, Berkeley, CA, USA; Kerner, H.M., Ed.; Wildland Resources Center Report No. 29.. 1992; pp. 55–62. [Google Scholar]
- Muths, E.; Nanjappa, P. Western Toad. Bufo boreas Baird and Girard, 1852. In Amphibian Declines: The Conservation Status of United States Species; Lannoo, M.J., Ed.; Univ. California Press: Berkeley, CA, USA, 2005; pp. 64–83. [Google Scholar]
- Pearl, C.A.; Bowerman, J. Observations of rapid colonization of constructed ponds by western toads (Bufo boreas) in Oregon, USA. West. North Amer. Nat. 2006, 3, 397–401. [Google Scholar] [CrossRef]
- Goebel, A.M.; Ranker, T.A.; Corn, P.S.; Olmstead, R.G. Mitochondrial DNA evolution in the Anaxyrus boreas species group. Mol. Phylog. Evol. 2009, 50, 209–225. [Google Scholar] [CrossRef]
- Sredl, M.J.; Collins, J.P. The interaction of predation, competition, and habitat complexity in structuring an amphibian community. Copeia 1992, 1992, 607–614. [Google Scholar] [CrossRef]
- Welsh, H.H.; Pope, K.L.; Boiano, D. Sub-alpine amphibian distributions related to species palatability to non-native salmonids in the Klamath mountains of northern California. Diversity and Distributions 2006, 12, 298–309. [Google Scholar] [CrossRef]
- Snodgrass, J.W.; Komoroski, M.J.; Bryan, A.L., Jr.; Burger, J. Relationships among wetland size, hydroperiod, and amphibian species richness: implications for wetland regulations. Conserv. Biol. 2000, 14, 414–419. [Google Scholar] [CrossRef]
- Vos, C.C.; Chardon, J.P. Effects of habitat fragmentation and road density on the distribution pattern of the moor frog Rana arvalis. J. Appl. Ecology 1998, 35, 44–56. [Google Scholar] [CrossRef]
- Knutson, M.G.; Sauer, J.R.; Olsen, D.A.; Mossman, M.J.; Hemesath, L.M.; Lannoo, M.J. Effects of landscape composition and wetland fragmentation on frog and toad abundance and species richness in Iowa and Wisconsin, USA. Conserv. Biol. 1999, 13, 1437–1446. [Google Scholar] [CrossRef]
- Corn, P.S.; Hossack, B.R.; Muths, E.; Patla, D.A.; Peterson, C.R.; Gallant, A.L. Status of amphibians on the Continental Divide: surveys on a transect from Montana to Colorado, USA. Alytes 2005, 22, 85–94. [Google Scholar]
- Nash, M.S.; Bradford, D.F. Parametric and nonparametric logistic regressions for prediction of presence/absence of an amphibian; EPA/600/R-01/081; United States Environmental Protection Agency: Washington, DC, USA, 2001; p. 40. [Google Scholar]
- Peterson, J.A.; Blaustein, A.R. Unpalatability in anuran larvae as a defense against natural salamander predators. Ethol. Ecol. Evol. 1991, 3, 63–72. [Google Scholar] [CrossRef]
- Kiesecker, J.M.; Chivers, D.P.; Blaustein, A.R. The use of chemical cues in predator recognition by western toad tadpoles. Anim. Behav. 1996, 52, 1237–1245. [Google Scholar] [CrossRef]
- Skelly, D.K.; Werner, E.E.; Cortwright, S.A. Long-term distributional dynamics of a Michigan amphibian assemblage. Ecology 1999, 80, 2326–2337. [Google Scholar] [CrossRef]
- Crisafulli, C.M.; Trippe, L.S.; Hawkins, C.P.; MacMahon, J.A. Amphibian responses to the 1980 eruption of Mount St. Helens. In Ecological Responses to the 1980 Eruption of Mount St. Helens; Dale, V.H., Swanson, F.J., Crisafulli, C.M., Eds.; Springer: New York, NY, USA, 2005; pp. 163–182. [Google Scholar]
- Hossack, B.R.; Corn, P.S. Responses of pond-breeding amphibians to wildfire: short-term patterns in occupancy and colonization. Ecol. Appl. 2007, 17, 1403–1410. [Google Scholar] [CrossRef] [PubMed]
- Bury, R.B.; Pearl, C.A. Klamath-Siskiyou herpetofauna: biogeographic patterns and conservation strategies. Nat. Areas J. 1999, 19, 341–350. [Google Scholar]
- Blaustein, A.R. Chicken little of nero's fiddle? A perspective on declining amphibian populations. Herpetologica 1994, 50, 85–97. [Google Scholar]
- Stuart, J.N.; Painter, C.W. A review of the distribution and status of the Boreal Toad, Bufo boreas boreas, in New Mexico. Bull. Chicago Herpetol. Soc. 1994, 29, 113–116. [Google Scholar]
- Tyler, T.; McIntire, C.D.; Samora, B.; Hoffman, R.L.; Larson, G.L. Inventory of aquatic breeding amphibians, Mount Rainer National Park, 1994-1999; US Geological Survey, Forest and Rangeland Ecosystem Science Center: Corvallis, OR, USA, 2003; p. 94. [Google Scholar]
- Adams, M.J.; Schindler, D.E.; Bury, R.B. Association of amphibians with attenuation of ultraviolet-b radiation in montane ponds. Oecologia 2001, 128, 519–525. [Google Scholar] [CrossRef]
- Peterson, J.A.; Blaustein, A.R. Relative palatabilities of anuran larvae to natural aquatic insect predators. Copeia 1992, 1992, 577–584. [Google Scholar] [CrossRef]
- Banks, B.; Beebee, T.J.C.; Denton, J.S. Long-term management of a natterjack toad (Bufo calamita) population in southern Britain. Amphibia-Reptilia 1993, 14, 155–168. [Google Scholar]
- Olson, D.H. Ecological susceptibility of amphibians to population declines. In Proceedings of the Symposium on Biodiversity of Northwestern California; Kerner, H.M., Ed.; Wildland Resources Center Report No. 29.. University California Press: Berkeley, CA, USA, 1992; pp. 55–62. [Google Scholar]
- Muths, E.; Scherer, R.D.; Corn, P.S.; Lambert, B.A. Estimation of temporary emigration in male toads. Ecology 2006, 87, 1048–1056. [Google Scholar] [CrossRef] [PubMed]
- Holland, A.A.; Wilson, K.R.; Jones, M.S. Characteristics of boreal toad (Bufo boreas) breeding habitat in Colorado. Herpetol. Rev. 2006, 37, 157–159. [Google Scholar]
- Marsh, D.M.; Trenham, P.C. Metapopulation dynamics and amphibian conservation. Conserv. Biol. 2001, 15, 40–49. [Google Scholar] [CrossRef]
© 2009 by the authors; licensee Molecular Diversity Preservation International, Basel, Switzerland. This article is an open access article distributed under the terms and conditions of the Creative Commons Attribution license (http://creativecommons.org/licenses/by/3.0/).
Share and Cite
Pearl, C.A.; Adams, M.J.; Bury, R.B.; Wente, W.H.; McCreary, B. Evaluating Amphibian Declines with Site Revisits and Occupancy Models: Status of Montane Anurans in the Pacific Northwest USA. Diversity 2009, 1, 166-181. https://doi.org/10.3390/d1020166
Pearl CA, Adams MJ, Bury RB, Wente WH, McCreary B. Evaluating Amphibian Declines with Site Revisits and Occupancy Models: Status of Montane Anurans in the Pacific Northwest USA. Diversity. 2009; 1(2):166-181. https://doi.org/10.3390/d1020166
Chicago/Turabian StylePearl, Christopher A., Michael J. Adams, R. Bruce Bury, Wendy H. Wente, and Brome McCreary. 2009. "Evaluating Amphibian Declines with Site Revisits and Occupancy Models: Status of Montane Anurans in the Pacific Northwest USA" Diversity 1, no. 2: 166-181. https://doi.org/10.3390/d1020166
APA StylePearl, C. A., Adams, M. J., Bury, R. B., Wente, W. H., & McCreary, B. (2009). Evaluating Amphibian Declines with Site Revisits and Occupancy Models: Status of Montane Anurans in the Pacific Northwest USA. Diversity, 1(2), 166-181. https://doi.org/10.3390/d1020166