Trophic Diversity of Plankton in the Epipelagic and Mesopelagic Layers of the Tropical and Equatorial Atlantic Determined with Stable Isotopes


1
Instituto Español de Oceanografía, Centro Oceanográfico de A Coruña, Apdo 130, 15080 A Coruña, Spain
2
Instituto de Oceanografía y Cambio Global (IOCAG), Universidad de las Palmas de Gran Canaria, Campus de Taliarte, Telde, Gran Canaria, 35214 Islas Canarias, Spain
*
Author to whom correspondence should be addressed.
Diversity 2018, 10(2), 48; https://doi.org/10.3390/d10020048
Submission received: 30 April 2018
/
Revised: 25 May 2018
/
Accepted: 12 June 2018
/
Published: 13 June 2018
(This article belongs to the Special Issue Trophic Ecology)
Abstract
:Plankton living in the deep ocean either migrate to the surface to feed or feed in situ on other organisms and detritus. Planktonic communities in the upper 800 m of the tropical and equatorial Atlantic were studied using the natural abundance of stable carbon and nitrogen isotopes to identify their food sources and trophic diversity. Seston and zooplankton (>200 µm) samples were collected with Niskin bottles and MOCNESS nets, respectively, in the epipelagic (0–200 m), upper mesopelagic (200–500 m), and lower mesopelagic layers (500–800 m) at 11 stations. Food sources for plankton in the productive zone influenced by the NW African upwelling and the Canary Current were different from those in the oligotrophic tropical and equatorial zones. In the latter, zooplankton collected during the night in the mesopelagic layers was enriched in heavy nitrogen isotopes relative to day samples, supporting the active migration of organisms from deep layers. Isotopic niches showed also zonal differences in size (largest in the north), mean trophic diversity (largest in the tropical zone), food sources, and the number of trophic levels (largest in the equatorial zone). The observed changes in niche size and overlap (up to 71% between the mesopelagic layers but <50% between the epipelagic and upper mesopelagic layers) support the prevalence of in situ feeding at deep layers in tropical and equatorial zooplankton.
1. Introduction
The food of zooplankton is ultimately provided by the production of phytoplankton in the upper layer of the ocean [1]. Only part of this production is consumed in the surface while the rest is remineralized on its way down the water column by prokaryotes and pelagic fauna. A fraction of these animals (including zooplankton) is composed by vertical migrants feeding at shallow ocean layers and releasing carbon through respiration, defecation, excretion, molting, lipid consumption and mortality, also supporting deep-sea food webs [2,3,4]. Thus, the active transport of the surface production by the migrant organisms complements the gravitational flux of the settling organic matter in the sequestration of carbon in the deep ocean [5]. However, while the passive flux of particulate and dissolved organic matter has received considerable attention (for example, References [1,6]) the influence of the vertical migrations of pelagic organisms on the biogeochemistry and on the food webs of the deep layers of the ocean is still poorly known.
There is a large variability in vertical migrations. Migrating organisms include phyto- and zooplankton [7,8], fish [9,10], cephalopods, seabirds, mammals, and even reptiles [11]. Most migrations have been related to the daily light cycle but also to the lunar [12] and seasonal periods [13]. One of the major drivers of these migrations is food [9]. Consumers migrate to the layers where resources are more abundant (generally near the surface) and predators follow their prey. Prey species, in turn, migrate to layers were predation can be avoided (generally in deep layers of the dark ocean). Migration towards the surface occurs mainly during the night (as most predators in the epipelagic layer rely on visual cues) while downward migration occurs during the daylight period [7,8]. As mobility depends on organism size and type, the concept of a “migration ladder” was applied to describe the vertical movement of zooplankton in the deep ocean [7]. Each organism would have a certain mobility range and, thus, could reach the resources mostly in nearby layers. This concept was extended by taking into account the trophic implications to the hypothesis of “cascading migrations” [8], where the search for trophic resources by organisms in a given trophic level prey triggers the migrations of organisms in upper trophic levels.
Analysis of food sources and trophic structure can be made through the analysis of the natural abundance of stable isotopes in organisms [14]. As light isotopes are preferentially mobilized in chemical reactions, heavy isotopes accumulate in some substrates and through the food web. For instance, the different sources of inorganic nitrogen sustaining primary production in the ocean had distinct isotopic signatures that can be traced in consumers [15] while carbon isotopes can trace the phytoplankton composition [14]. One application of stable isotopes is the characterization of the trophic niche (that is, the multidimensional space of the feeding resources used) by the quantitative estimation of different metrics of the isotopic niche (that is, the multidimensional space defined by the stable isotope abundance of the main elements) either considering individual species, communities or whole ecosystems [16,17]. Spatial and temporal variations in the resources available for the same or different species or whole communities and the degree of overlap between different trophic niches can be estimated by this method [18]. In the case of trophic migrations in the ocean, a large overlap in the trophic niche of organisms collected in different layers would indicate intense and active migration between layers, while low niche overlap would apply to non-migrating, in situ feeders. Previous studies with zooplankton reported an increase in heavy nitrogen isotopes with depth that was interpreted as the result of changes in the quality of the organic matter (that is, microbial reworking) and trophic structure (that is, an increase of carnivory) from the surface to deep ocean layers [19,20,21]. These findings suggest that migration is restricted to adjacent layers. However, some organisms (as Mysidacea) are able to perform large migrations [7] and large clusters of mesopelagic fish move periodically to feed on surface prey [22], thus, in agreement with the “cascading migration” hypothesis. To our knowledge, isotopic niche metrics were not yet applied to the study of vertical migrations of zooplankton in the ocean.
The tropical and equatorial regions of the Atlantic include regions of contrasting productivity. Oligotrophic waters dominate in the western sector [23] while upwelling near the North African coast and its interaction with the Canary Current and the islands favors the existence of diverse habitats in the transition from the highly productive shelf waters to the oceanic region [24,25]. Additional environmental variability is provided by the influence of diazotrophy (atmospheric nitrogen fixation) in the subtropical region, generally more important in the western waters but occasionally affecting also waters near Canary Islands [26,27,28,29,30]. Zooplankton composition and biomass in this region reflect the productivity of the surface waters (for example, References [21,25]) and previous studies on the vertical migrations of zooplankton [12,25] and mesopelagic fish [31] showed a measurable impact of these movements on carbon fluxes and export to deep ocean layers. Stable isotopes revealed that some of the most abundant mesopelagic fish (as myctophids) greatly depend on zooplankton [32], while copepods (one of the most abundant zooplankton taxa) showed a marked increase in heavy nitrogen isotopes with depth [21].
The objectives of the present study are (1) to identify differences in the sources of carbon and nitrogen for regional plankton food webs, and (2) to analyze the isotopic niche characteristics of plankton in the epipelagic and mesopelagic layers across the tropical and equatorial Atlantic in the context of trophic migrations. Specifically, the size and overlap between niche estimations in the different layers and zones are examined to ascertain whether local plankton food webs share the same resources (that is, large niche size and overlap) or are the result of local feeding (that is, small niche size and overlap).
2. Materials and Methods
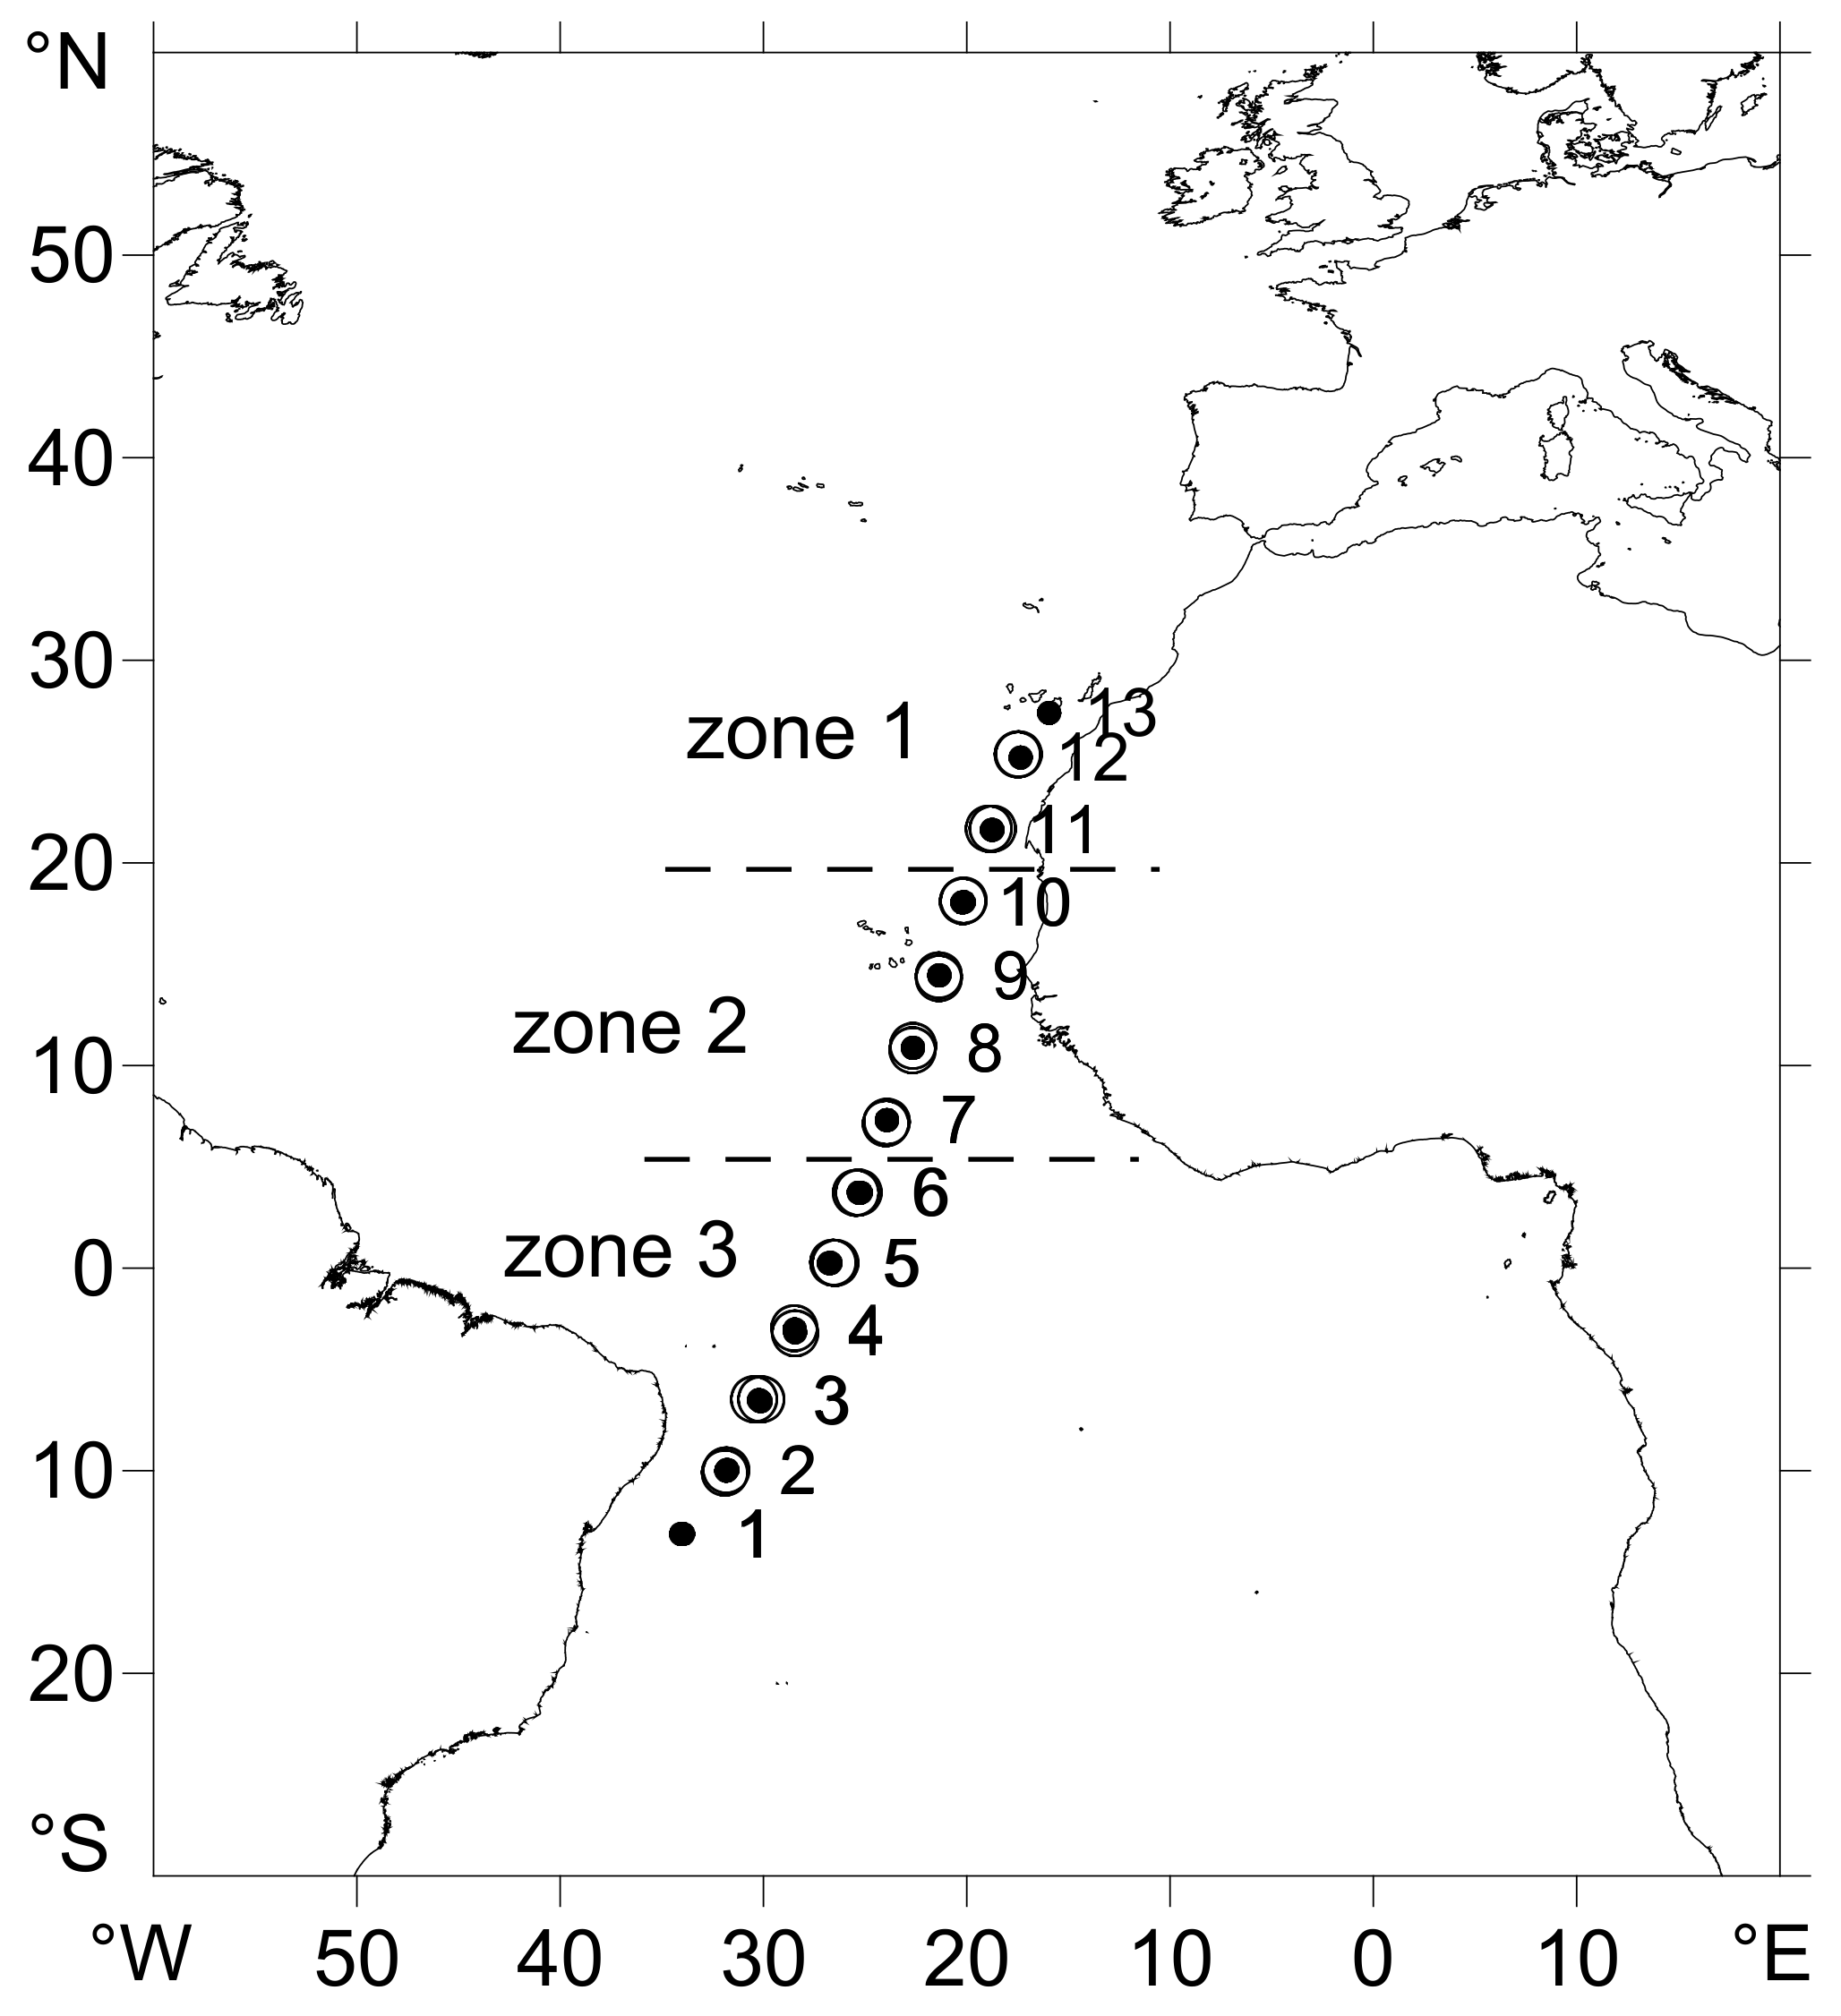
Plankton samples and water observations were obtained from stations occupied during the “Migrants and Active Flux In the Atlantic ocean” (MAFIA) cruise, between 5th and 28th April 2015, in a transect from Brazil to the Canary Islands (Figure 1). For the purposes of this study, the sampling stations were grouped into 3 zones of characteristic oceanographic conditions [30,32]. Vertical profiles of temperature, salinity, and fluorescence down to 3000 m were obtained at each of the 13 stations using a Seabird 911 Plus conductivity-temperature-depth (CTD) instrument equipped with a Seapoint Chlorophyll Fluorometer Sensor and attached to a Niskin bottle rosette for water sampling. Plankton samples included phytoplankton, small zooplankton, detritus (seston, 0.7 to 200 µm), and mesozooplankton (200 µm) consumers. Seston was obtained from up to 4 L of seawater collected at 5, 200, 500, and 1000 m depths and at the deep chlorophyll maximum, pre-filtered through a 200 µm mesh to remove mesozooplankton, and subsequently filtered onto glass fiber filters (Whatman GF/F, nominal pore size 0.7 µm). Filters with seston were stored dry (50 °C, 24 h) until processed for isotopic analysis in the laboratory.
Zooplankton samples were collected with a MOCNESS-1 net (1 m2 of the mouth area and 200 µm mesh size) during both daylight and night periods (one haul per period) at up to 8 depth layers between 800 m and the surface. In this study, three water layers were considered: epipelagic (surface to 200 m depth), upper mesopelagic (200–500 m), and lower mesopelagic (500–800 m). Subsamples (5–10% of the total sample volume for each level) were stored frozen (−20 °C) for subsequent separation of individual organisms and stable isotope determinations in the laboratory. Specimens were determined at the lowest taxonomic level possible (Supplementary Table S2) for each water layer sample and analyzed at this level for stable isotopes. Individual taxa were further grouped in trophic guilds, according to the literature [21,33]: herbivorous copepods (Family Calanidae), omnivorous and carnivorous copepods (genera Candacia, Centropages, Paraeuchaeta, Pleuromamma, Metridia, Euchirella, and Corycaeus), large crustacean mesozooplankton (Euphausiacea, Amphipoda, and Decapoda), and Chaetognatha.
Determinations of the natural abundance of carbon and nitrogen isotopes were made on dried (50 °C, 48 h) seston and plankton samples ground to a fine and homogeneous powder with mortar and pestle, packed into tin capsules which were fed into an elemental analyzer (Carlo Erba CHNSO 1108) coupled to an isotope-ratio mass spectrometer (Finnigan Matt Delta Plus). Individual specimens of each low-level taxonomic group were pooled until obtaining ca. 1 mg dry weight for isotopic determinations. Values of natural abundance of stable isotopes were reported as δ13C or δ15N (‰) relative to Vienna Pee Dee Belemnite or atmospheric nitrogen, respectively [34]. International Atomic Energy Agency USGS40 and L-alanine isotope standards were analyzed with the samples along with internal acetanilide and sample standards with offsets between certified and measured values <0.1‰. The precision of replicate determinations of standards and samples for both isotopes was <0.1‰ and <0.3‰ (n = 3), respectively. Isotopic determinations were made in the Servicio de Análisis Instrumental of the Universidade da Coruña (Spain). Due to the variable lipid content of plankton samples, δ13C values were normalized using a linear regression with the sample C: N value determined for aquatic animals [35]. Values for seston were not corrected because there is no significant relationship between algal C: N and δ13C ([35]) and, furthermore, the mean ± SE C: N mass ratio was 10.14 ± 0.03 (n = 61), indicative of a low lipid content, and was homogeneous for all zones (ANOVA, p > 0.05, Supplementary Table S3). Further details on sampling and analysis can be found in previous articles on the MAFIA cruise [30,32]. The original isotopic and elemental composition dataset used in the present study is available at PANGAEA (https://doi.pangaea.de/10.1594/PANGAEA.890257).
Preliminary analysis of the differences in stable isotope signatures between zones and layers were made using ANOVA and post-hoc paired tests. It was assumed that their variability in the epipelagic layer reflected the diversity of carbon and nitrogen sources within each zone. The analysis of isotopic niche width was made in the isospace defined by δ15N vs. δ13C plots of each seston or plankton guild samples using the software package SIBER [18]. The standard ellipses were computed for each combination of depth layer and oceanographic zone thus representing the variability in foraging habits and resource use in these spatial domains [16,17]. For this analysis, night and day samples were combined for each layer to increase the number of data points and reduce the effects of sample size [18]. Several metrics (Layman metrics) were computed to characterize the ellipses [16]: NR: δ15N range (diversity of trophic levels and nitrogen sources), CR: δ13C range (diversity of carbon sources), TA: total area of the convex hull encompassing all data points (a measure of trophic diversity and size of the isotopic niche), CD: mean distance to the centroid (averaged measure of trophic diversity among consumers), MNND: mean distance to the nearest neighbor (trophic redundancy, lower when isotopic niches are similar) and SDNND: standard deviation of the distance to the nearest neighbor (trophic evenness). Final analysis of niche overlap and width between layers and zones were made using Bayesian inference of the standard ellipse areas (a better estimator of trophic niche size than TA) to account for the uncertainty in sample data [18]. Ellipse statistics were computed from 104 estimations per water layer while for graphic representation, only the maximum likelihood ellipses were used.
3. Results
3.1. Oceanographic Zones
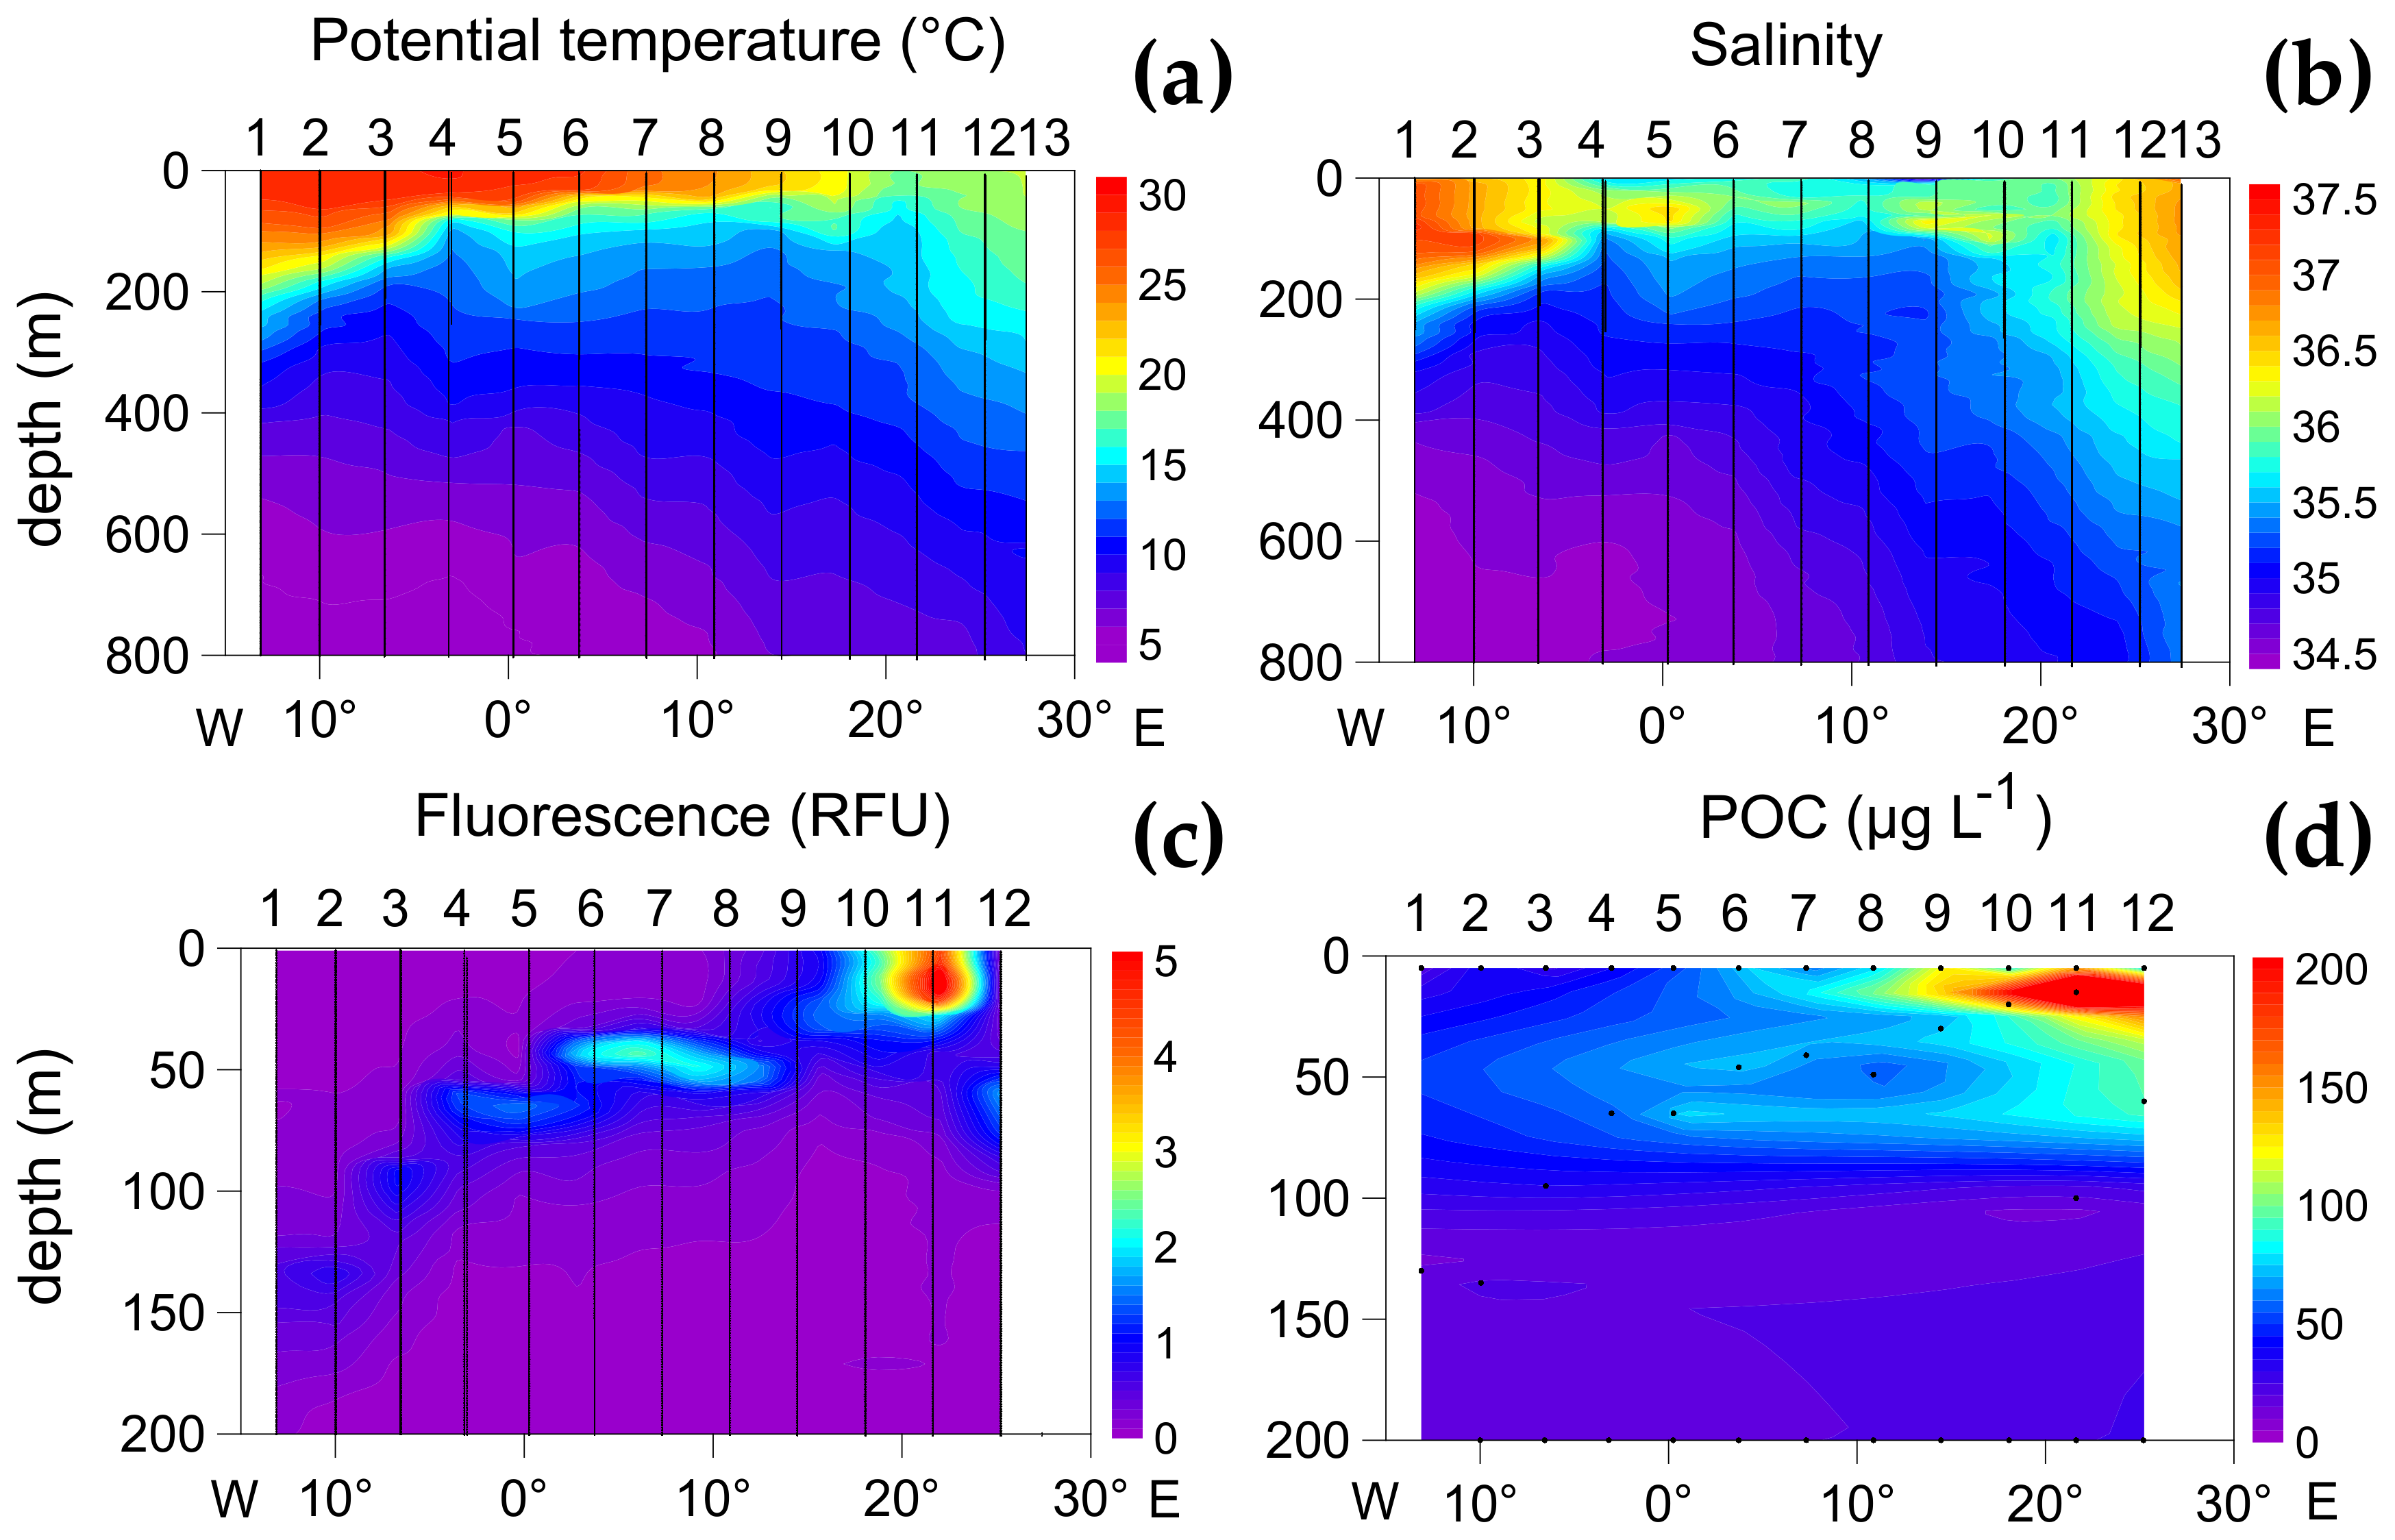
The sampled transect was characterized by marked thermohaline stratification, with high surface temperature, deep fluorescence maxima, and low POC concentrations in most stations (Figure 2). The exceptions were the northernmost three stations (particularly St. 11) with surface temperature values below 20 °C and high surface fluorescence and POC.
Based on previous interpretations of the oceanographic conditions and, particularly, taking into account the mean values of temperature, POC, PON, and fluorescence in the epipelagic layer (Supplementary Table S1), the plankton sampling stations were grouped in three zones. Zone 1 included the stations with high surface POC and fluorescence (St. 11 and 12). Zone 2 comprised the tropical zone (St. 7, 8, 9, and 10) characterized by a sharp thermal gradient between the surface and ca. 50 m depth, where there were weak fluorescence and POC maxima. Zone 3 included the equatorial domain and stations near South America (St. 6, 5, 4, 3, and 2); all characterized by very low fluorescence and POC values.
3.2. Zonal Variability of Carbon and Nitrogen Sources
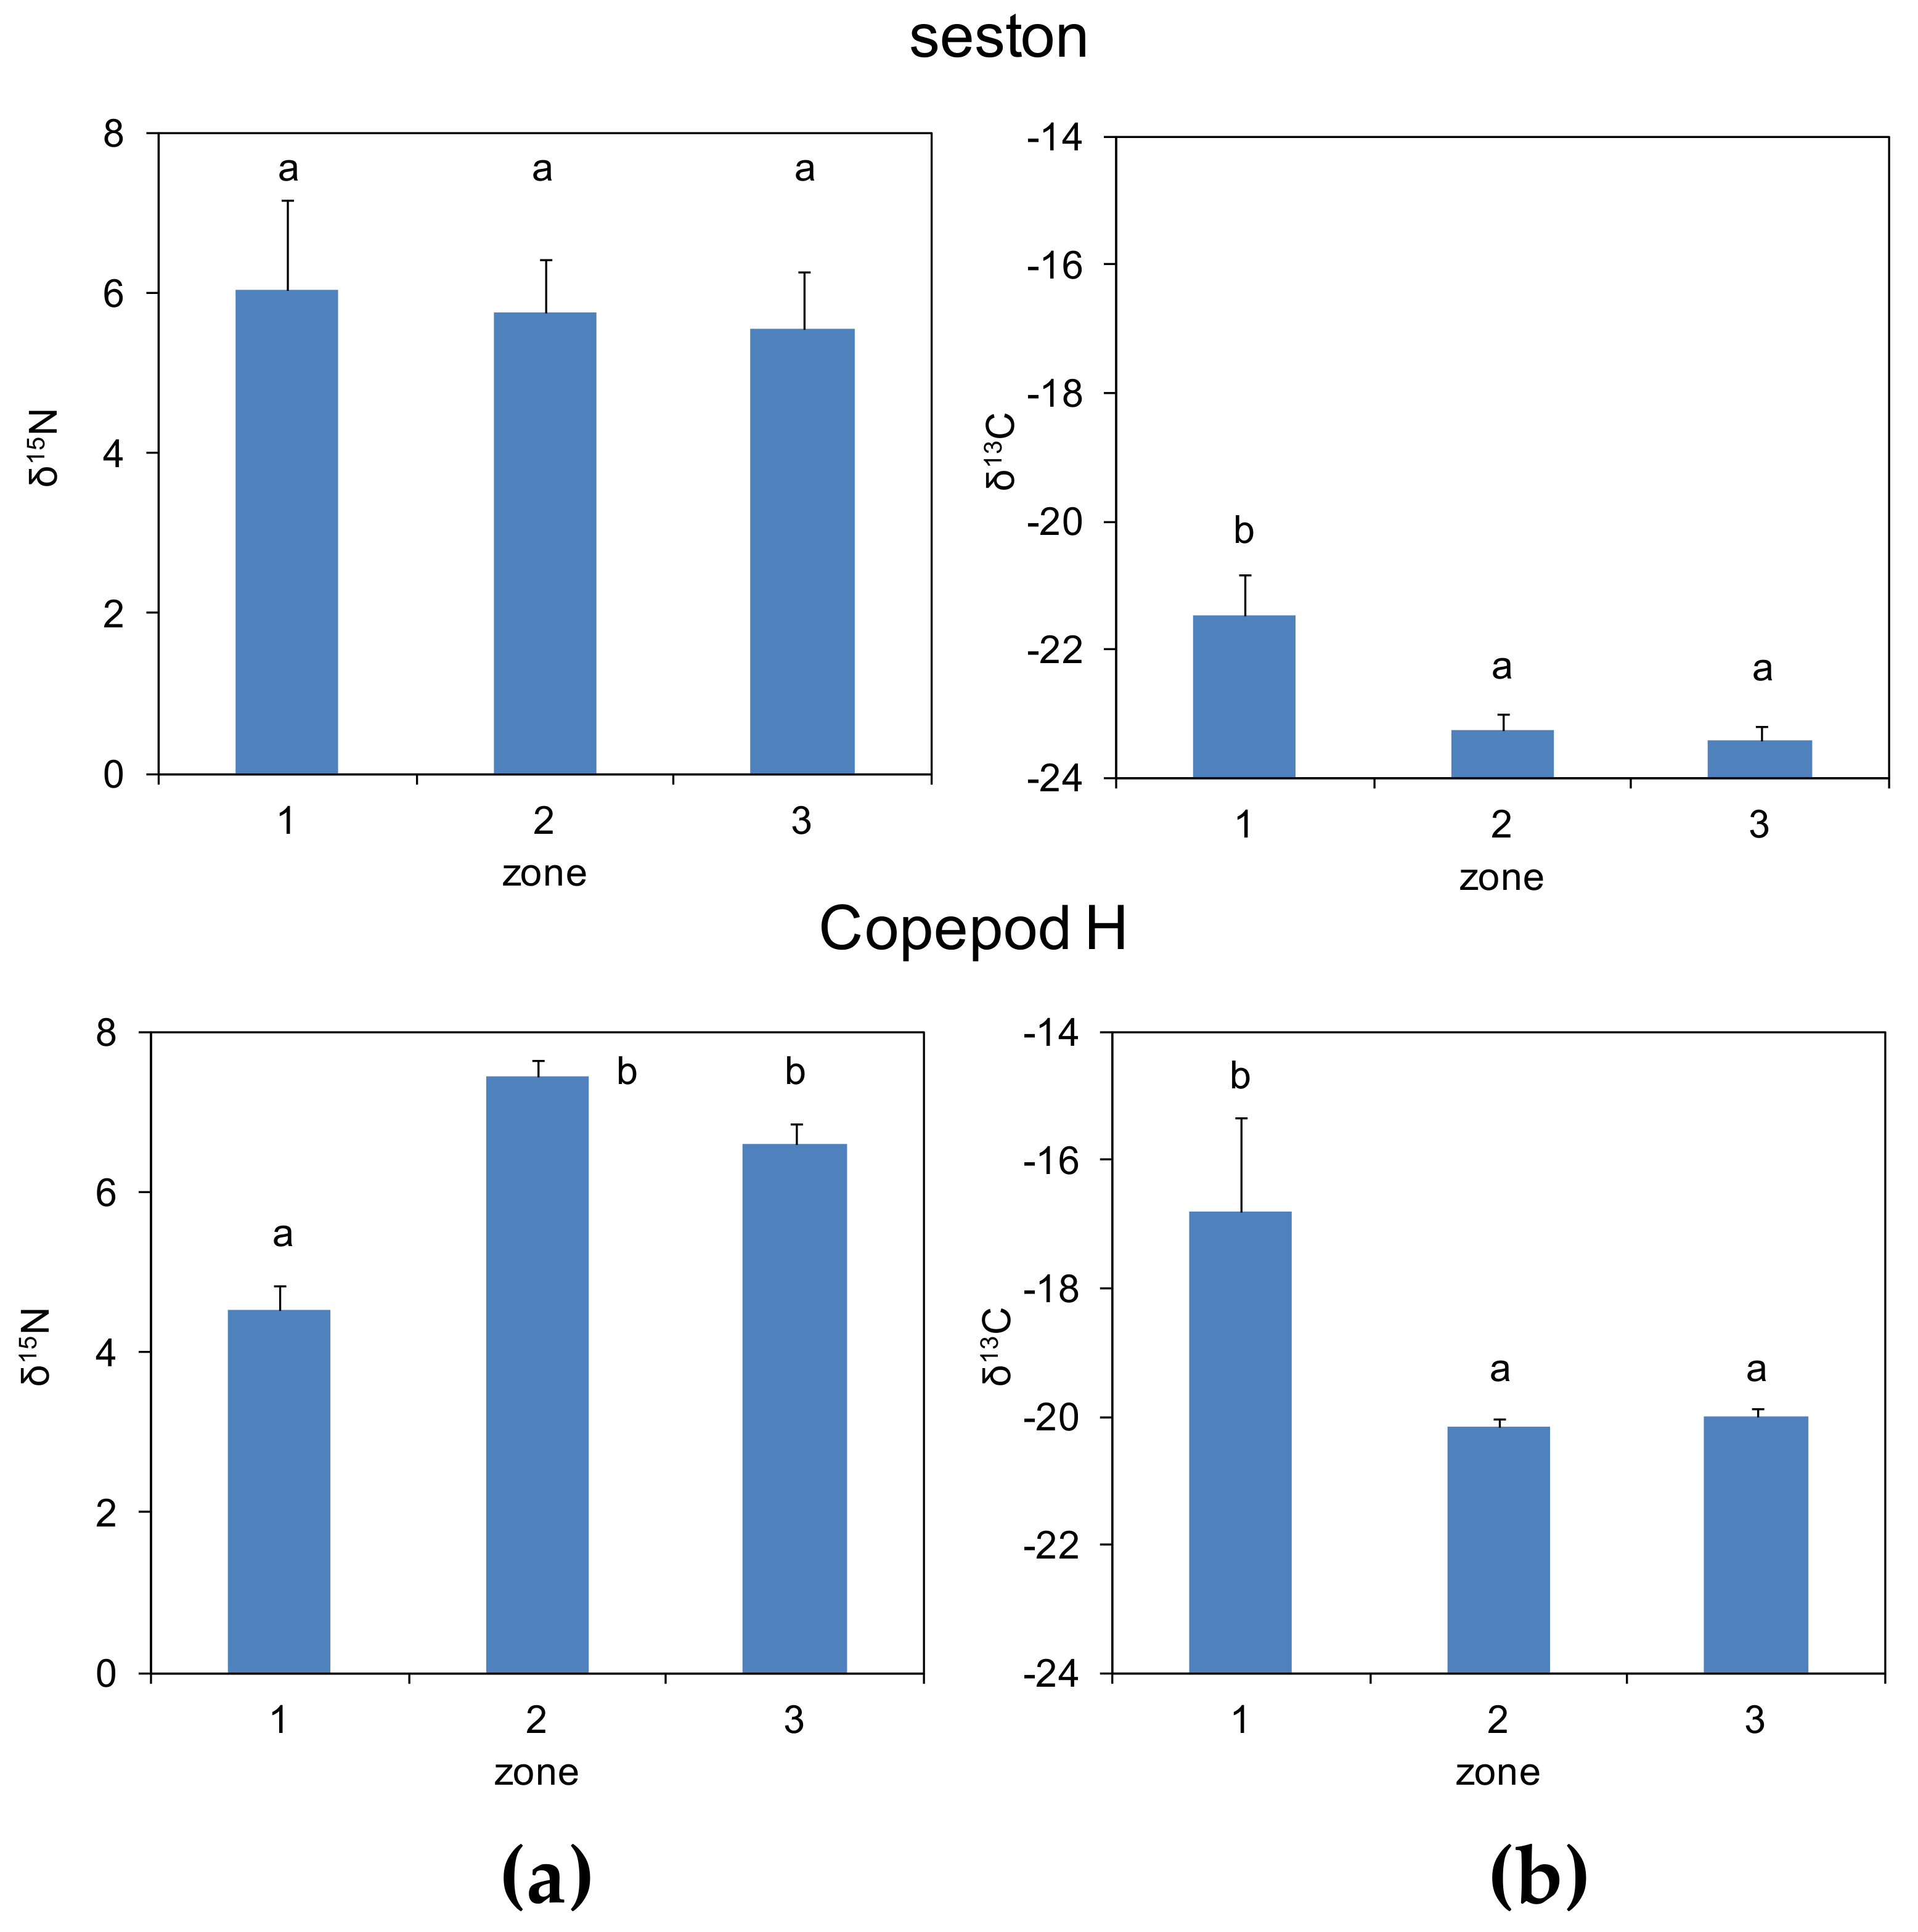
In the epipelagic layer, there were no significant differences in the mean δ15N of seston among zones (Figure 3). However, herbivorous copepods showed a lower δ15N mean in zone 1, lower indeed than the corresponding mean in seston. It must be noted that all δ15N values were positive, with mean values >4‰. In turn, the mean δ13C for both seston and copepods in zones 2 and 3 were lower than in zone 1.
3.3. Day-Night Variability of Nitrogen Isotopes Among Plankton Guilds
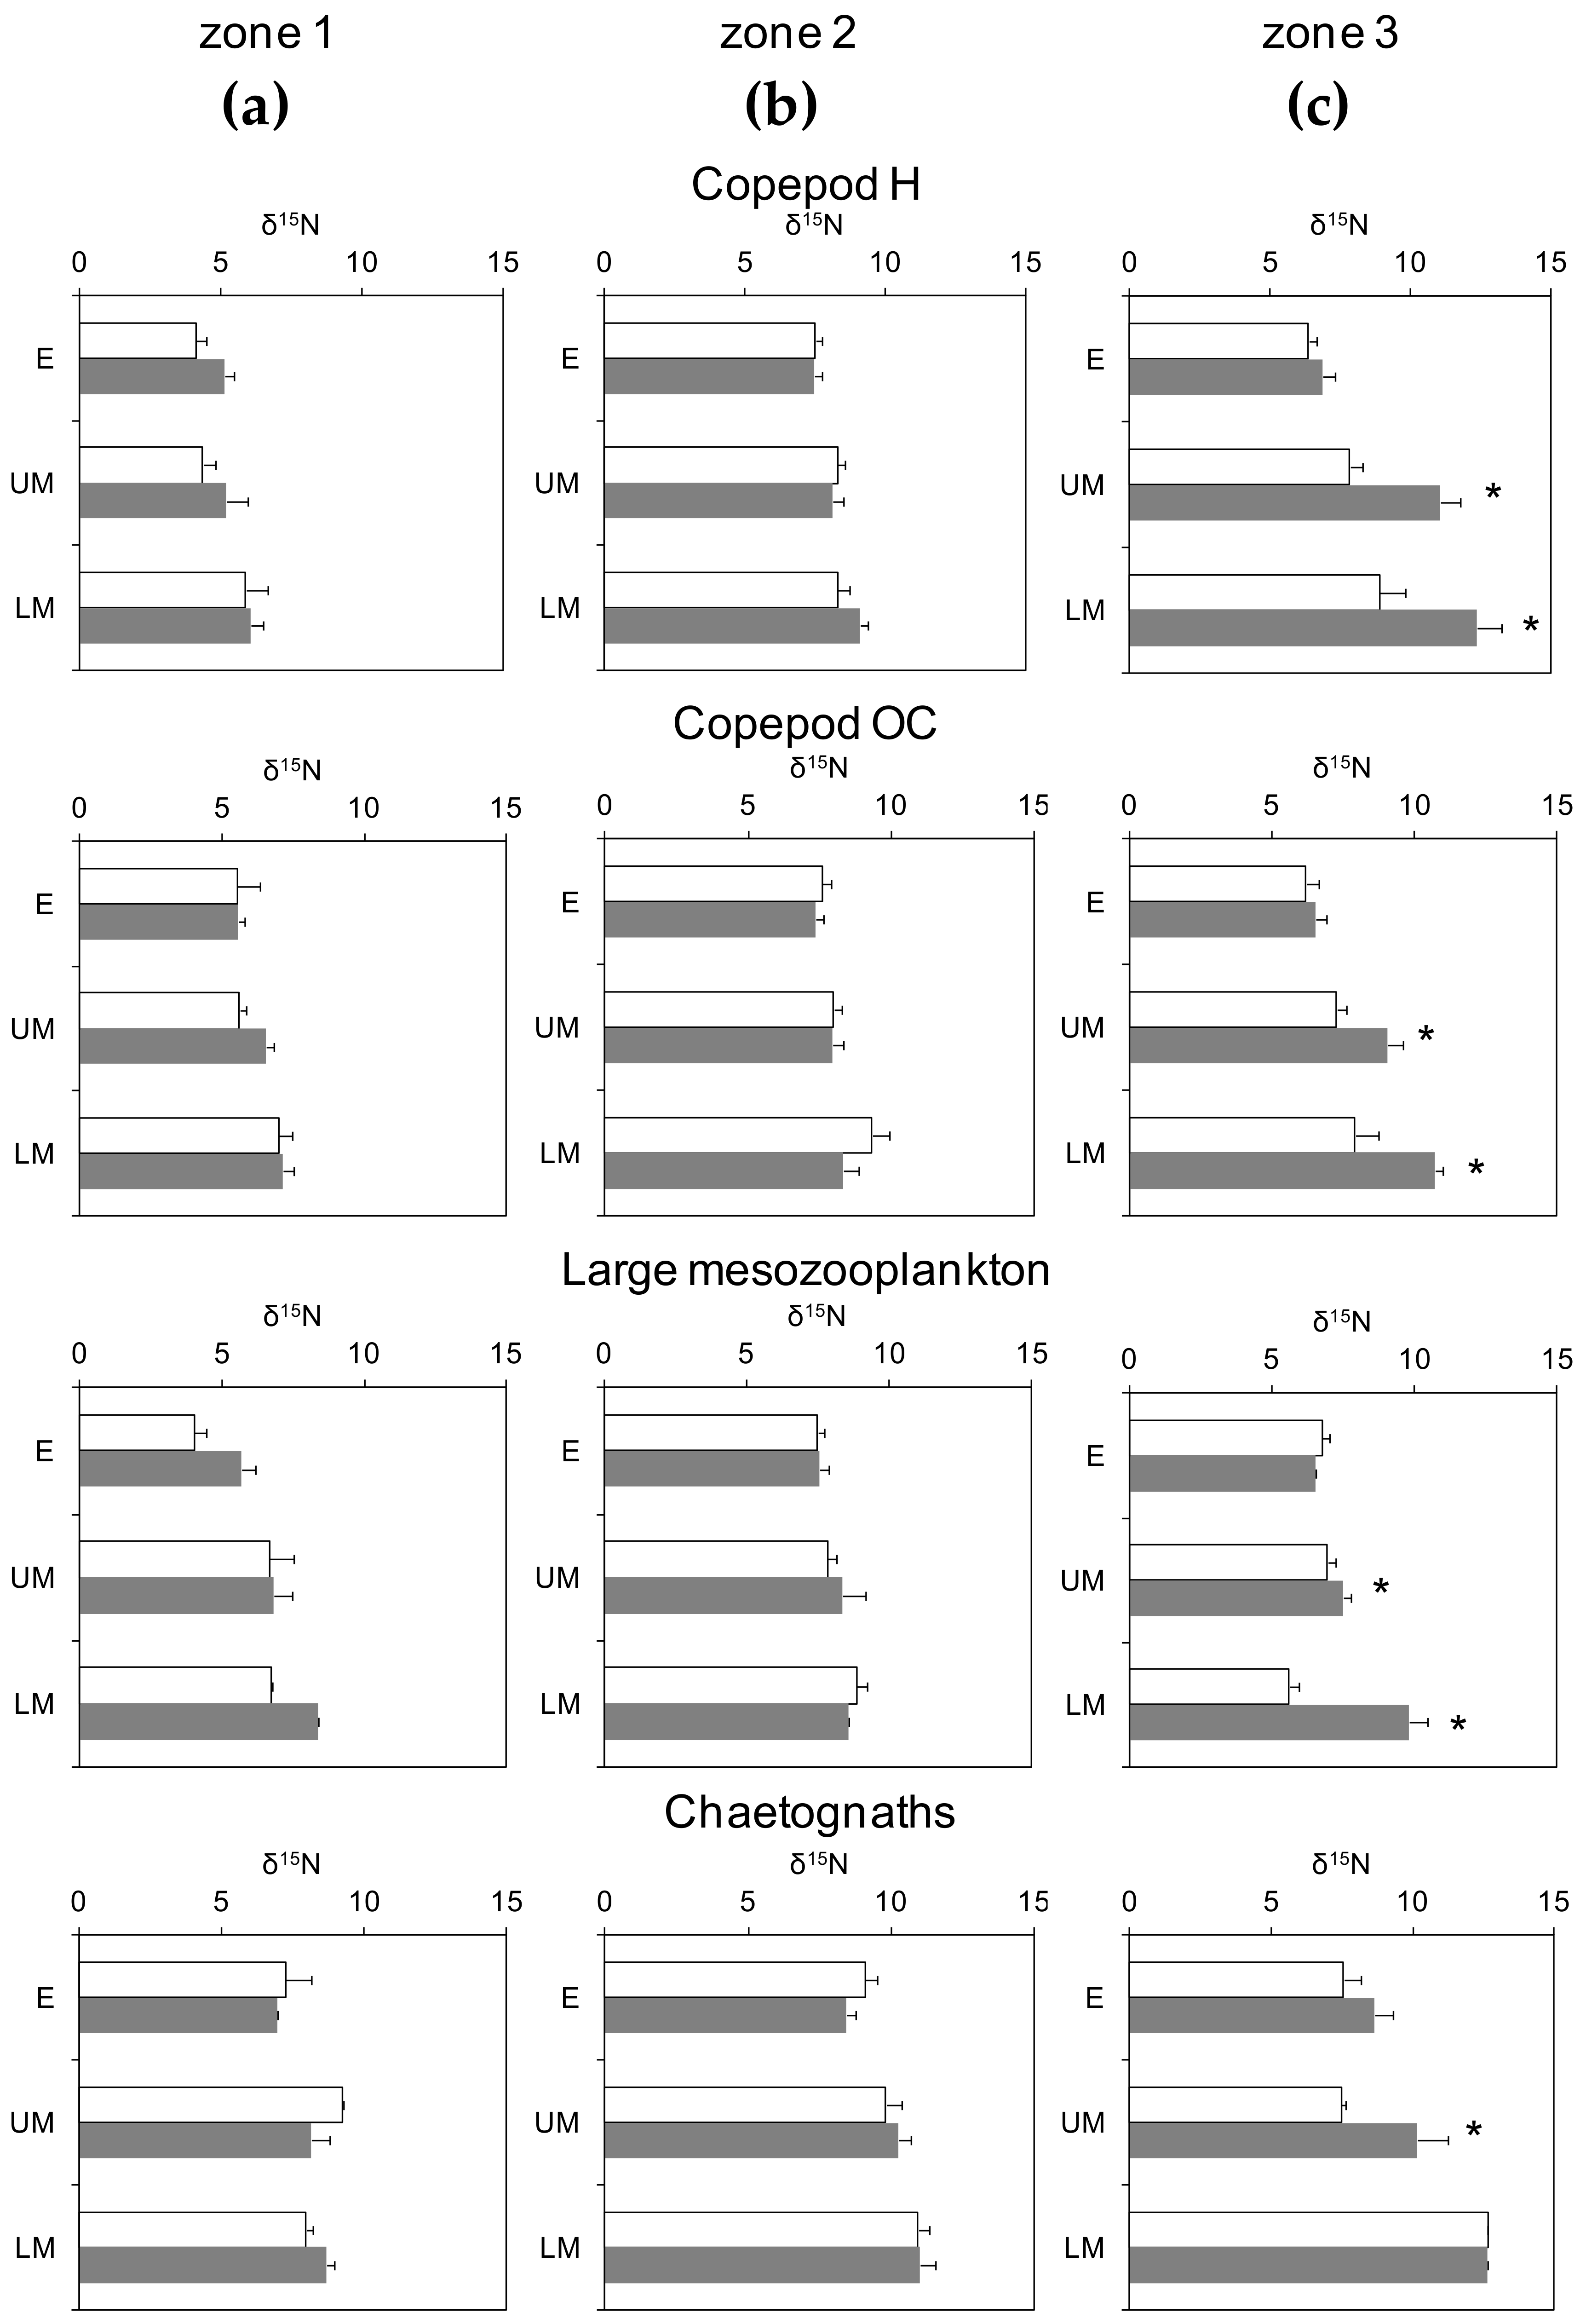
Values of δ15N of all plankton guilds increased with depth in all zones (Figure 4). Such an increase was significant for all layers considered (ANOVA, p < 0.001, n = 631). Chaetognaths had always had the highest values but the lowest values were not always observed in herbivorous copepods. Additionally, there was a large overlap in the ranges observed for the pre-defined guilds. Within the layer day and night samples, similar δ15N means for all guilds in zones 1 and 2 were shown but there were significant differences in the means for the upper and lower mesopelagic layers in zone 3 (Figure 4c). In the latter case, δ15N measured in night samples was higher than the values measured in day samples, while no differences were observed in the epipelagic zone for any guild.
3.4. Isotopic Niche Estimations
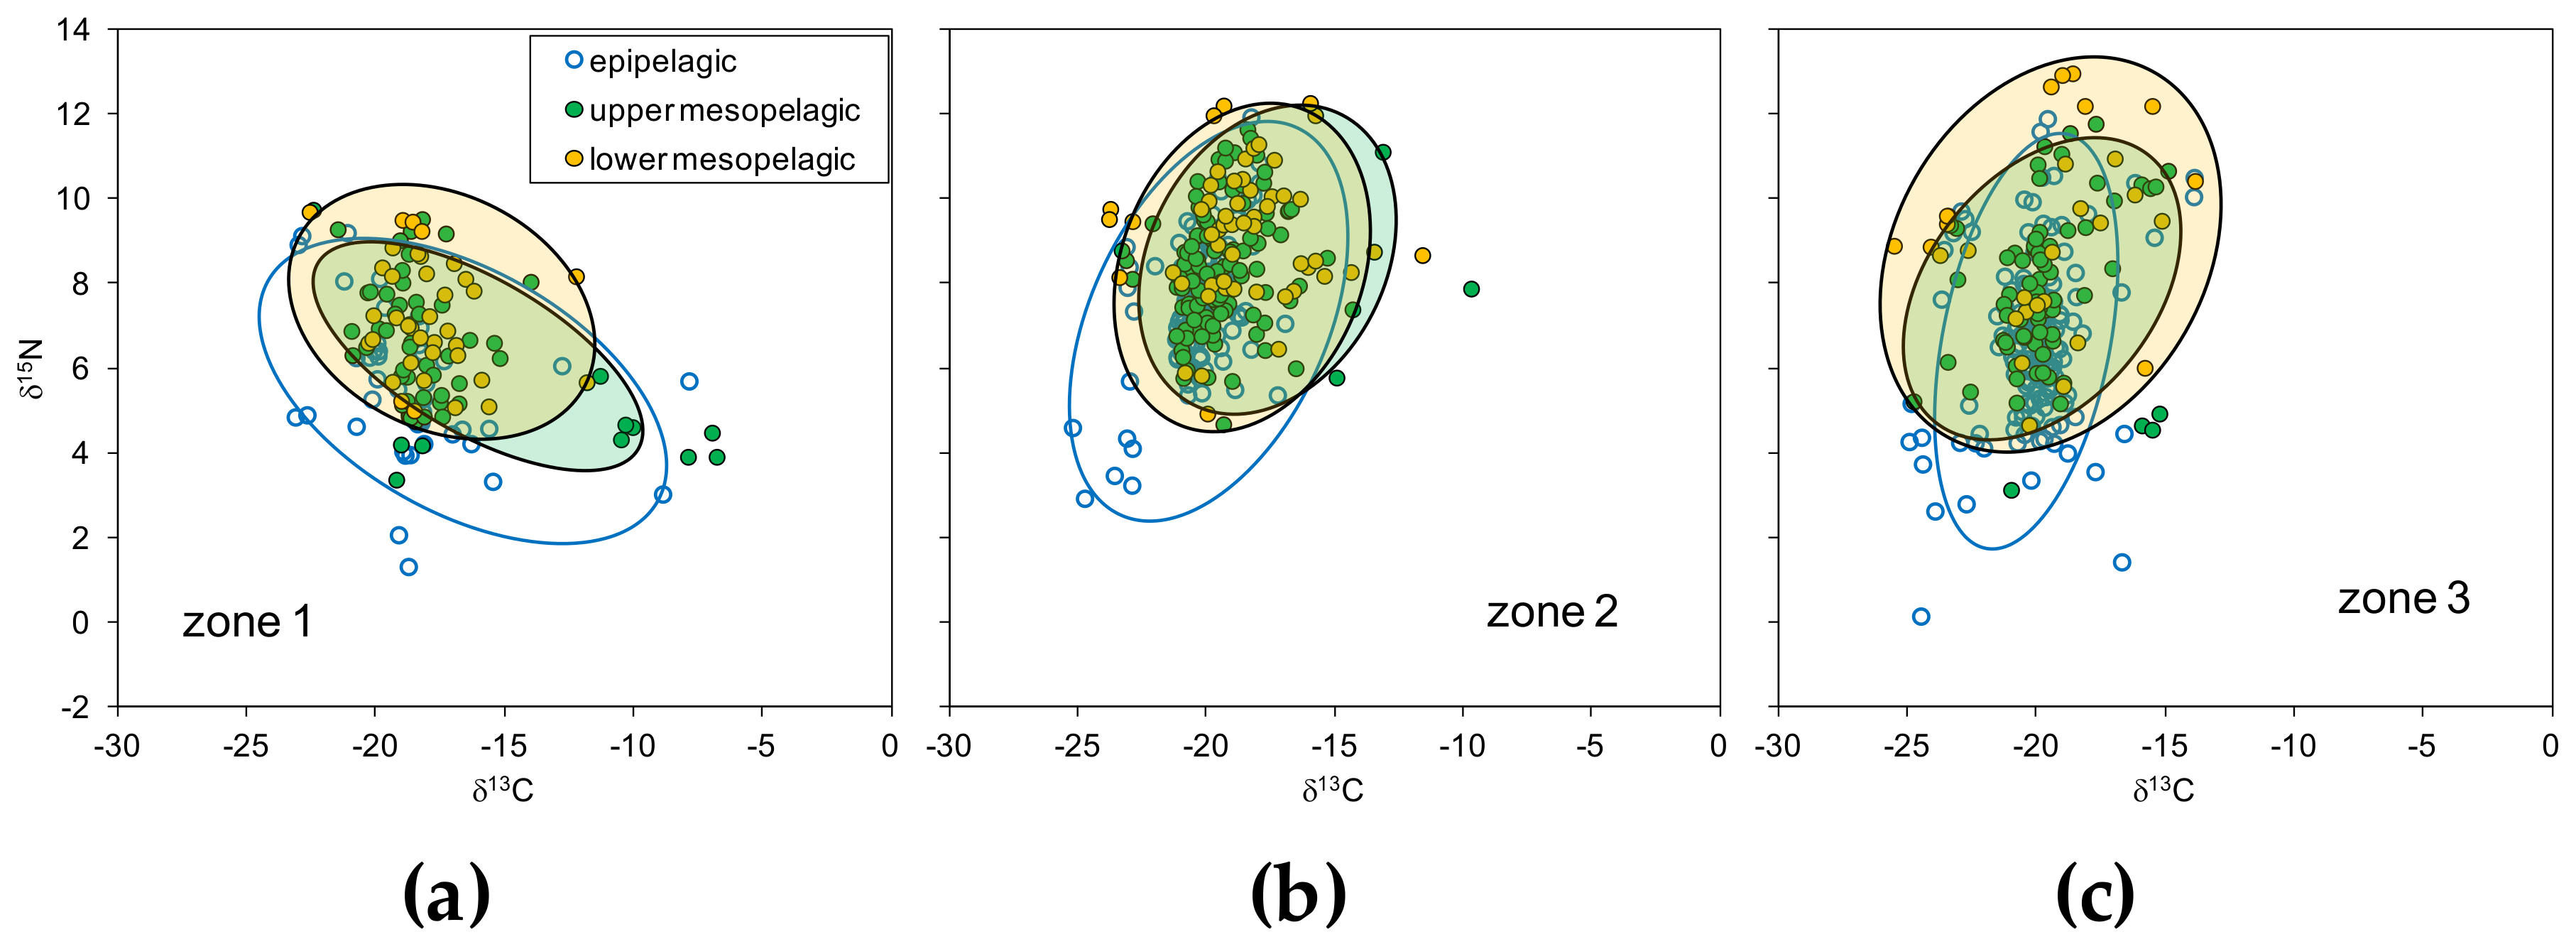
The isospace defined by δ15N and δ13C revealed also differences among zones with the largest δ13C ranges in zones 1 and 2 and maximum δ15N in zone 3 (Figure 5). In general δ15N values were >4‰, but in some samples of zones 1 and 3 values were <2‰. The distribution of data resulted in distinct ellipses by layers but with relatively large overlap between them.
The Layman metrics computed from Bayesian estimates of the corresponding ellipses by zones confirmed the largest diversity of trophic levels in zone 3 (that is, highest NR), while zones 1 and 2 had a larger variability in carbon sources (that is, larger CR) than the former. According to the values of TA, zone 1 showed the largest isotopic niche, while that of zones 2 and 3 was of a much lower size (Table 1). The mean trophic diversity (indicated by CD) was of similar magnitude in all zones but slightly higher in zone 3. All zones showed similar values of trophic redundancy (indicated by MNND) while the distribution of trophic diversity (indicated by SDNND) was more even in zone 1 than in zones 2 and 3.
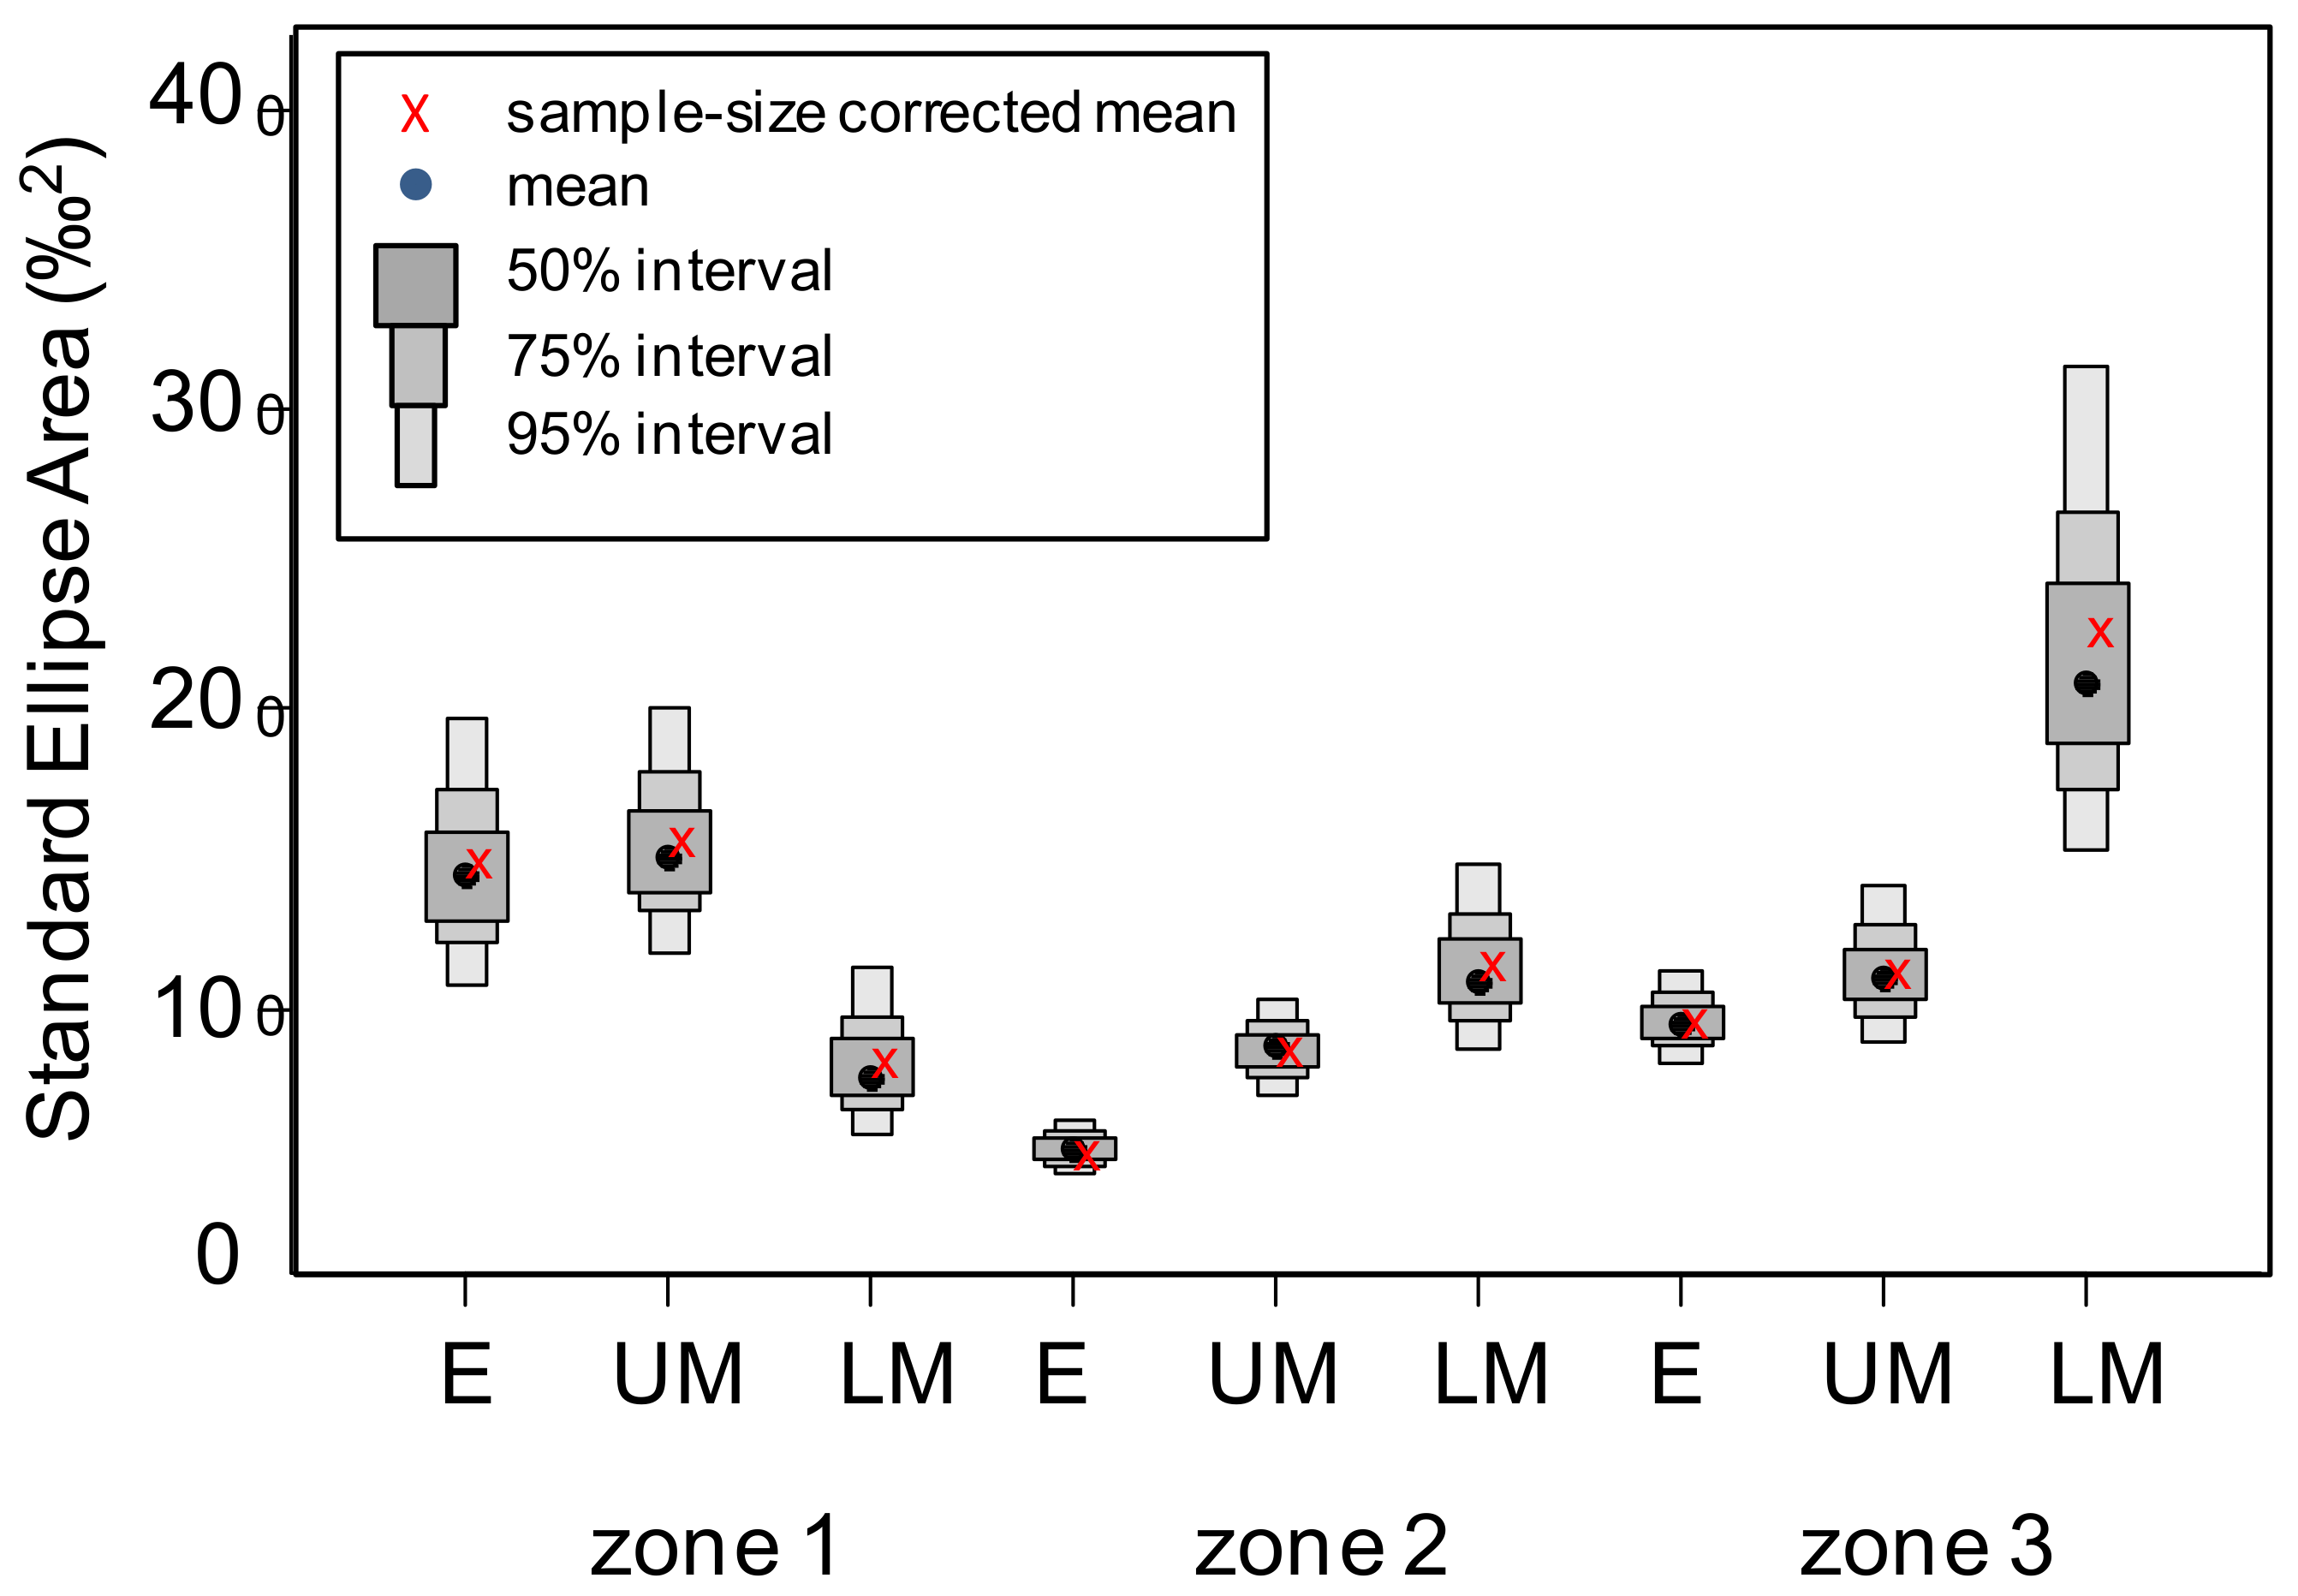
The size of the isotopic niche estimated by the standard ellipse areas was highest for the lower mesopelagic layer of zone 3 and lowest for the epipelagic layer of zone 2 (Figure 6, Supplementary Table S4). The niche size decreased from the upper to lower mesopelagic layers in zone 1 but increased with depth in zones 2 and 3. In the latter zones, the variability in the estimations of niche size in the epipelagic and upper mesopelagic layers was quite low, indicating a large homogeneity in resources and trophic diversity in these layers, while the lower mesopelagic layer (particularly in zone 3) had much larger variability.
The similarity between isotopic niches, indicated by the overlap between the corresponding ellipses, was highest in case of the upper and lower mesopelagic layer of zone 2, and lowest for the epipelagic and upper mesopelagic layers of zone 1 (Table 2). Minimum overlap (< 50% of the non–overlapping area) was found between the epipelagic and upper mesopelagic layers in all zones. There was a moderate overlap (34 to 47%) between the epipelagic and lower mesopelagic layers. In contrast, the overlap between the upper and lower mesopelagic layers was always high (> 50%) in all zones.
4. Discussion
In this study, the food sources and trophic diversity of epipelagic and mesopelagic plankton in the tropical and equatorial Atlantic were investigated using stable carbon and nitrogen isotopes. The differences found in the zones sampled in this study are consistent with the surface productivity regimes, in agreement with previous descriptions of the same cruise [30,32], and entail marked differences in the trophic resources available within each zone. Stations in zone 1 were affected by the northwest African upwelling and by the high salinity of the Canary Current. These oceanographic features favored high productivity in surface waters related to high inputs of nutrients. Zone 2 had the characteristics of strongly stratified tropical waters, with low productivity and phytoplankton biomass in the surface, but a relative increase in phytoplankton fluorescence near 50 m depth near the equator. In zone 3, thermohaline stratification was high in the upper 200 m, particularly in the southernmost stations, with very low phytoplankton and seston concentrations and a weak fluorescence maximum that deepened to the south of the equator. These characteristics, along with the change in the mode of central waters found between 200 and 500 m in the region north of the equator [30], justify the separation of these zones adopted in this study. The observed changes in stable isotope composition of seston and plankton are consistent with the differences in productivity and likely in the phytoplankton composition between these zones The enrichment in heavy carbon isotopes (that is, less negative δ13C values) found in seston and zooplankton in zone 1 is indicative of the dominance of diatoms [14], also characteristically associated with phytoplankton blooms induced by the upwelling [24]. In contrast, low δ13C values of the same compartments in the tropical and equatorial zones agree with the dominance of picophytoplankton and other non-diatom phytoplankton groups in these waters [36]. For instance, δ13C values for seston fractions dominated by picophytoplankton (0.7–2 µm) were 2–3‰ lower than those dominated by diatoms (2–64 µm) in the western Mediterranean [37]
Nitrogen sources may also vary between zones, even when the observed δ15N values for seston in the epipelagic layer suggest otherwise. The low δ15N values observed in epipelagic copepods of zone 1 could be interpreted as indirect evidence of diazotrophy because the atmospheric nitrogen has δ15N = 0 and this low value can be transmitted up the food web [38,39]. However, while nitrogen fixation has been reported in this zone, it showed relatively large variability in space and time [28,40]. Alternatively, low δ15N values in plankton can be caused by isotopic fractionation during phytoplankton uptake when dissolved nitrogen concentrations are high, as during upwelling pulses [41]. In any case, these low δ15N values of epipelagic copepods were not observed in seston collected concurrently, thus, indicating a temporal mismatch between the composition of zooplankton and the available particles. Such a mismatch can be expected as the turnover time of isotopes in different organisms and is closely linked to their growth rates [42]. Seston samples would likely include phytoplankton and bacteria, along with their decay products, with generation times from hours to days [43] while those of typical herbivorous copepods would be ca. 30 d at the water surface temperatures observed in the survey stations, as estimated from physiologically–based models [44]. Because of the different turnover rates, the change in stable isotope signature of zooplankton often shows a substantial time lag with those observed in seston, as reported in other studies in this region [21]. Therefore, the use of multiple nitrogen sources cannot be excluded in the northernmost zone, while the homogeneity in nitrogen signatures observed for seston and herbivorous copepods in the oligotrophic zones implies the dominance of one single source, likely related with diffusive inputs of nitrate across the pycnocline [26,45].
Notwithstanding the effect of different nitrogen sources in each zone, the pre-assigned guilds showed a large overlap in δ15N values within zones and depth layers suggested a large plasticity in their trophic positions. Copepods were particularly variable, either as species that were reported as typical filter feeders or as carnivores [33]. Previous studies of copepods from the tropical and subtropical Atlantic also reported a large variability in δ15N that was closely related to their migratory or non-migratory behavior [21,46]. For instance, ontogenetic migrations of Calanoides carinatus, a typical filter feeder on surface phytoplankton, carried its low δ15N values to deep water layers affecting the isotopic signature of non-migrating carnivorous species [46]. In the case of large mesozooplankton, their relative high mobility would facilitate access to various prey types, thus, enhancing zonal δ15N variability, as reported for euphausiids [47] and decapods [48]. Only chaetognaths always had the highest δ15N values in agreement with their carnivore feeding and high trophic position in planktonic food webs [49,50,51]. These results point out to the importance of omnivory in pelagic food webs, as the access to prey distributed over several trophic levels enhances trophic connectivity and likely also ecosystem stability and resilience to perturbations [52]. Intermediate trophic positions, as those expected in plankton and their direct consumers, display a large range of diet variation among individuals, thus, increasing their range of individual trophic positions [53]. Therefore, the existence of a large degree of omnivory in plankton consumers across water layers would facilitate survival in an environment where the ultimate source of food (that is, the phytoplankton) is scarce. Opportunistic feeding on either phytoplankton, detritus, or other organisms greatly enlarges the isotopic niche of zooplankton species, either for those performing vertical migrations or for non-migrants. In the first case, because the migrants can access different prey types in different water layers, as chaetognaths. In the latter, because the migrant prey are accessible to deep-dwelling carnivores, as exemplified by the ontogenetic migrant C. carinatus [21,46].
A general increase of δ15N with depth, as found in all guilds in this study, was also reported in other studies with zooplankton [19,20,21]. Such an increase was interpreted as the consequence of the growing importance of omnivory and carnivory in deep layers depleted in phytoplankton. Furthermore, feeding on detritus contributes to the elevated δ15N values as settling organic particles become progressively depleted of light isotopes during microbial decay [54,55]. Increased omnivory and carnivory is also supported by the high-protein specific respiration rates and increase in protein catabolism measured in zooplankton from oligotrophic zones [56,57] and expected in deep water layers.
The other major implication of the increase of the zooplankton δ15N signal with depth is that most zooplankters feed at the same layer where they are collected, either because they do not migrate to other layers or because they only feed in deep layers. Our results support, in part, the non-migratory feeding strategy, particularly in zones 1 and 2 where similar δ15N values were observed in samples collected in the same layer during the day and those collected during the night. However, the significant increase in δ15N observed in night samples in mesopelagic layers of the oligotrophic zone 3 suggests the migration of species feeding below these layers (that is, at bathypelagic layers). Because isotopic equilibration for most of the zooplankton groups considered in this study would require more than the few hours spent between day and night samplings [58] it must be concluded that, at least for oligotrophic zones, zooplankton feeding in bathypelagic layers migrate during the night to mesopelagic layers. This is supported by the increase in the intensity of vertical migrations by myctophid fish species (consumers of plankton), from north to south, reported for the same MAFIA cruise sampled in the present study [32]. According to the “cascading migration” hypothesis, these predators would follow their prey in their migrations through the different layers. The large availability of resources in the productive zones (particularly in zone 1) would make the vertical migration to the surface unnecessary for deep-dwelling zooplankton species as these zones would also have high rates of particle export to deep layers [54]. In addition, the dominance of protein catabolism and excretion over assimilation processes in deep water layers would increase δ15N values of zooplankton living in these layers, as the light nitrogen isotopes would be preferentially mobilized [4]. This interpretation agrees with the results reported for the eastern tropical Pacific where the zooplankton showed a strong depth gradient in δ15N below the oxycline implying an increase in trophic cycling below a layer of minimum oxygen concentration, while the δ15N values in the epipelagic layer were consistent with a primary feeding on surface seston [59]. However, in the latter study, not all species followed the pattern indicated by in situ feeding, as migratory species showed intermediate δ15N values. Studies in other zooplankton taxa also revealed that only some species, generally those of large size, perform vertical migrations (for example, krill) [60].
Active feeding migrations between layers would imply the homogenization of the isotopic composition of plankton and, thus, a large overlap in the isotopic niche for adjacent layers. Our extended analysis with δ13C revealed a low overlap between upper mesopelagic and epipelagic niches, where almost half of the plankton do not migrate (niche overlap ≤ 50%). However, high migration (overlap > 50%) was observed within the mesopelagic layer, particularly in the tropical zone. The latter result contrasts with the situation reported in the eastern tropical Pacific where the isotopic niche of zooplankton above or below the oxygen minimum zone did not overlap [58]. Such a difference could be explained by the smaller magnitude of the oxygen decrease in our study zone relative to the reported for the Pacific, even when taking into account the layer of low oxygen concentration detected in zone 2 [30]. The high variability in niche overlap between the epipelagic and lower mesopelagic layers in all zones, with values exceeding those found between the epipelagic and upper mesopelagic layers, further supports the partial migratory behavior of zooplankton. Migration would explain the increase in the size of the isotopic niche with depth in oligotrophic zones (Figure 6), as the migrants would have access to a large variety of prey. In contrast, the high availability of resources in the upper layers of the productive zones would favor in situ feeding (that is, feeding at the same water layer where the organism is found) and low migration rates for zooplankton living in productive regions. However, large niche overlap does not imply a competition for food as the competition may be alleviated by a different use of resources [61]. For instance, lipid profiles and stable isotopes revealed a major contribution of phytoplankton for some copepod species (for example, Calanoides carinatus) while other species (for example, Pleuromamma abdominalis) showed a significant contribution of bacteria, likely through the feeding on ciliates and bacterivorous plankton [21]. A study with samples of the same MAFIA cruise concluded that some of the most abundant mesopelagic fish species had a similar trophic position but different and variable diets due to the availability of planktonic prey in each zone [32].
The relatively large overlap of the isotopic niches within the mesopelagic zone (200–800 m) found in this study supports in part the “cascading migrations” hypothesis [8] but also suggests that such migrations would depend on food availability at each zone. Zooplankton living in the lower mesopelagic and bathypelagic layers of the oligotrophic ocean would need to complement the local diet with prey from the upper layers, where prey concentration and variety increases. The migration of a given species would trigger the migration of their predators, as illustrated by the parallel change in δ15N in all guilds found in zone 3 (Figure 4c).
Our results align with those of previous studies with stable isotopes suggesting a major importance of in situ feeding for deep zooplankton, mainly supported by the progressive increase of δ15N with depth in most species and groups [19,20,21]. However, the large variability observed in the niche overlap between layers, along with the increase in niche size with depth in oligotrophic zones, suggests that feeding migrations depend on the availability of prey, ultimately determined by the magnitude of zonal primary production. While deep zooplankton δ15N can increase by the consumption of detrital particles progressively altered by microbial reworking, the role of enhanced catabolism and excretion needs to be examined, as the latter processes also contribute to the increase. Therefore, it is possible that studies using only δ15N measurements have underestimated vertical migrations of deep zooplankton if the consumption of low δ15N prey in surface layers do not compensate the increase due to feeding and excreting at depth. Future studies would require specific measurements of zooplankton metabolism in deep layers to clarify this issue, either through experiments [4] or enzymatic assays [56,57]. Otherwise, the application of isotopic niche metrics provided additional tools to the study of vertical migrations of zooplankton and a trophic framework to interpret the changes observed with single isotopes.
Supplementary Materials
The following are available online at https://www.mdpi.com/1424-2818/10/2/48/s1, Table S1: Mean values of temperature, fluorescence, POC and PON across zones and layers. Table S2: Summary of samples collected for stable isotope determinations. Table S3: ANOVA of seston C: N ratio across zones and depth layers. Table S4: ANOVA of Bayesian estimates of standard ellipse areas by zones and layers.
Author Contributions
S.H.-L. conceived the study and leaded the cruise. A.B. designed the plankton sampling and analyzed stable isotope data. A.B. wrote the paper with contributions of S.H.-L.
Funding
This research has been funded by the Spanish Ministerio de Economía y Competitividad through projects CTM2012–39587–C04 and CTM2016–78853–R.
Acknowledgments
The authors are most grateful to the captain, crew, scientists, and technicians who worked with them on board the RV “Hesperides”. Special mention is due to M. Teresa Álvarez-Ossorio and M. Luz Fernández de Puelles for their help with the plankton samples, and to Ángel F. Lamas, Elena Rey and Gelines Louro for the preparation of isotope samples.
Conflicts of Interest
The authors declare no conflict of interest. The founding sponsors had no role in the design of the study; in the collection, analyses, or interpretation of data; in the writing of the manuscript, and in the decision to publish the results.
References
- Sanders, R.; Henson, S.A.; Koski, M.; De La Rocha, C.L.; Painter, S.C.; Poulton, A.J.; Riley, J.; Salihoglu, B.; Visser, A.; Yool, A.; et al. The biological pump in the North Atlantic. Prog. Oceanogr. 2014, 129, 200–218. [Google Scholar] [CrossRef]
- Angel, M.V. Does mesopelagic biology affect the vertical flux. In Productivity of the Ocean: Present and Past; Berger, W.H., Smetacek, V.S., Wefer, G., Eds.; Wiley: New York, NY, USA, 1989; pp. 155–173. [Google Scholar]
- Longhurst, A.R.; Bedo, A.W.; Harrison, W.G.; Head, E.J.H.; Sameoto, D.D. Vertical flux of respiratory carbon by oceanic diel migrant biota. Deep Sea Res. 1990, 37, 685–694. [Google Scholar] [CrossRef]
- Steinberg, D.K.; Goldwaith, S.A.; Hansell, D.A. Zooplankton vertical migration and the active transport of dissolved organic and inorganic nitrogen in the Sargasso Sea. Deep Sea Res. 2002, 49, 1445–1461. [Google Scholar] [CrossRef] [Green Version]
- Siegel, D.A.; Buesseler, K.O.; Behrenfeld, M.J.; Benitez-Nelson, C.R.; Boss, E.; Brzezinski, M.A.; Burd, A.; Carlson, C.A.; D’Asaro, E.A.; Doney, S.C.; et al. Prediction of the export and fate of global ocean net primary production: The EXPORTS science plan. Front. Mar. Sci. 2016, 3, 22. [Google Scholar] [CrossRef]
- Aristegui, J.; Duarte, C.M.; Agusti, S.; Doval, M.; Alvarez-Salgado, X.A.; Hansell, D.A. Dissolved organic carbon support of respiration in the dark ocean. Science 2002, 298, 1967. [Google Scholar] [CrossRef] [PubMed] [Green Version]
- Vinogradov, M.E. Feeding of the deep sea zooplankton. Rapp. Cons. Int. Expl. de la Mer. 1962, 153, 114–120. [Google Scholar]
- Bollens, S.M.; Rollwagen-Bollens, G.; Quenette, J.A.; Bochdansky, A.B. Cascading migrations and implications for vertical fluxes in pelagic ecosystems. J. Plankton Res. 2011, 33, 349–355. [Google Scholar] [CrossRef]
- Pearre, S., Jr. Eat and run? The hunger/satiation hypothesis in vertical migration: History, evidence and consequences. Biol. Rev. 2003, 78, 1–79. [Google Scholar] [CrossRef] [PubMed]
- Olivar, M.P.; González-Gordillo, J.I.; Salat, J.; Chust, G.; Cózar, A.; Hernández León, S.; Fernández de Puelles, M.L.; Irigoien, X. The contribution of migratory mesopelagic fishes to neuston fish assemblages across the Atlantic, Indian and Pacific oceans. Mar. Freshw. Res. 2016, 67, 1114–1127. [Google Scholar] [CrossRef]
- Hays, G.C. A review of the adaptive significance and ecosystem consequences of zooplankton diel vertical migrations. Hydrobiologia 2003, 503, 163–170. [Google Scholar] [CrossRef]
- Hernández-León, S.; Franchy, G.; Moyano, M.; Menéndez, I.; Schmoker, C.; Putzeys, S. Carbon sequestration and zooplankton lunar cycles: Could we be missing a major component of the biological pump? Limnol. Oceanogr. 2010, 55, 2503–2512. [Google Scholar] [CrossRef] [Green Version]
- Visser, A.W.; Grønning, J.; Jónasdóttir, S.H. Calanus hyperboreus and the lipid pump. Limnol. Oceanogr. 2017, 62, 1155–1165. [Google Scholar] [CrossRef]
- Fry, B.; Wainright, S.C. Diatom sources of 13C-rich carbon in marine food webs. Mar. Ecol. Prog. Ser. 1991, 76, 149–157. [Google Scholar] [CrossRef]
- Sigman, D.M.; Karsh, K.L.; Casciotti, K.L. Ocean process tracers: Nitrogen isotopes in the ocean. In Encyclopedia of Ocean Sciences (Second Edition); Steele, J.H., Ed.; Academic Press: Oxford, UK, 2009; pp. 40–54. [Google Scholar]
- Layman, C.A.; Arrington, D.A.; Montaña, C.G.; Post, D.M. Can stable isotope ratios provide for community–wide measurements of trophic structure? Ecology 2007, 88, 42–48. [Google Scholar] [CrossRef]
- Layman, C.A.; Araujo, M.S.; Boucek, R.; Hammerschlag-Peyer, C.M.; Harrison, E.; Jud, Z.R.; Matich, P.; Rosenblatt, A.E.; Vaudo, J.J.; Yeager, L.A.; et al. Applying stable isotopes to examine food-web structure: An overview of analytical tools. Biol. Rev. 2012, 87, 545–562. [Google Scholar] [CrossRef] [PubMed]
- Jackson, A.L.; Inger, R.; Parnell, A.C.; Bearhop, S. Comparing isotopic niche widths among and within communities: SIBER—Stable isotope bayesian ellipses in R. J. Anim. Ecol. 2011, 80, 595–602. [Google Scholar] [CrossRef] [PubMed]
- Koppelmann, R.; Boöttger-Schnack, R.; Möbius, J.; Weickert, H. Trophic relationships of zooplankton in the Eastern Mediterranean based on stable isotope measurements. J. Plankton Res. 2009, 31, 669–686. [Google Scholar] [CrossRef]
- Polunin, N.V.C.; Morales-Nin, B.; Pawsey, W.E.; Cartes, J.E.; Pinnegar, J.K.; Moranta, J. Feeding relationships in Mediterranean bathyal assemblages elucidated by stable nitrogen and carbon isotope data. Mar. Ecol. Prog. Ser. 2001, 220, 13–23. [Google Scholar] [CrossRef]
- Bode, M.; Hagen, W.; Schukat, A.; Teuber, L.; Fonseca-Batista, D.; Dehairs, F.; Auel, H. Feeding strategies of tropical and subtropical calanoid copepods throughout the Eastern Atlantic Ocean: Latitudinal and bathymetric aspects. Prog. Oceanogr. 2015, 138, 268–282. [Google Scholar] [CrossRef]
- Gartner, J.V.; Hopkins, T.L.; Baird, R.C.; Milliken, D.M. The lanternfishes (pisces, myctophidae) of the Eastern Gulf of Mexico. Fish. Bull. 1987, 85, 81–98. [Google Scholar]
- Morel, A.; Claustre, H.; Gentili, B. The most oligotrophic subtropical zones of the global ocean: Similarities and differences in terms of chlorophyll and yellow substance. Biogeosciences 2010, 7, 3139–3151. [Google Scholar] [CrossRef] [Green Version]
- Arístegui, J.; Alvarez-Salgado, X.A.; Barton, E.D.; Figueiras, F.G.; Hernández-León, S.; Roy, C.; Santos, A.M.P. Oceanography and fisheries of the Canary Current/Iberian region of the Eastern North Atlantic (18a, e). In The Global Coastal Ocean: Interdisciplinary Regional Studies and Syntheses; Robinson, A.R., Brink, K., Eds.; Harvard University Press: Boston, MA, USA, 2006; pp. 877–931. [Google Scholar]
- Hernández-León, S.; Gómez, M.; Arístegui, J. Mesozooplankton in the Canary Current System: The coastal–ocean transition zone. Prog. Oceanogr. 2007, 74, 397–421. [Google Scholar] [CrossRef]
- Mouriño-Carballido, B.; Graña, R.; Fernández, A.; Bode, A.; Varela, M.; Domínguez, J.F.; Escánez, J.; De Armas, D.; Marañón, E. Importance of N2 fixation vs. nitrate eddy diffusion along a latitudinal transect in the Atlantic Ocean. Limnol. Oceanogr. 2011, 56, 999–1007. [Google Scholar] [CrossRef]
- Mompeán, C.; Bode, A.; Benítez-Barrios, V.M.; Domínguez-Yanes, J.F.; Escánez, J.; Fraile-Nuez, E. Spatial patterns of plankton biomass and stable isotopes reflect the influence of the nitrogen-fixer Trichodesmium along the subtropical North Atlantic. J. Plankton Res. 2013, 35, 513–525. [Google Scholar] [CrossRef]
- Fernández, A.; Marañón, E.; Bode, A. Large-scale meridional and zonal variability in the nitrogen isotopic composition of plankton in the Atlantic Ocean. J. Plankton Res. 2014, 36, 1060–1073. [Google Scholar] [CrossRef] [Green Version]
- Ariza, A.; Garijo, J.C.; Landeira, J.M.; Bordes, F.; Hernández-León, S. Migrant biomass and respiratory carbon flux by zooplankton and micronekton in the subtropical Northeast Atlantic Ocean (Canary Islands). Prog. Oceanogr. 2015, 134, 330–342. [Google Scholar] [CrossRef]
- Olivar, M.P.; Bode, A.; López-Pérez, C.; Hulley, P.A.; Hernández-León, S. Trophic position of lanternfishes (pisces: Myctophidae) of the tropical and equatorial Atlantic estimated using stable isotopes. ICES J. Mar. Sci. 2018. [Google Scholar] [CrossRef]
- Karstensen, J.; Stramma, L.; Visbeck, M. Oxygen minimum zones in the Eastern Tropical Atlantic and Pacific Oceans. Prog. Oceanogr. 2008, 77, 331–350. [Google Scholar] [CrossRef] [Green Version]
- Olivar, M.P.; Hulley, P.A.; Castellón, A.; Emelianov, M.; López, C.; Tuset, V.M.; Contreras, T.; Molí, B. Mesopelagic fishes across the tropical and equatorial Atlantic: Biogeographical and vertical patterns. Prog. Oceanogr. 2017, 151, 116–137. [Google Scholar] [CrossRef]
- Benedetti, F.; Gasparini, S.; Ayata, S.-D. Identifying copepod functional groups from species functional traits. J. Plankton Res. 2016, 38, 159–166. [Google Scholar] [CrossRef] [PubMed] [Green Version]
- Coplen, T.B. Guidelines and recommended terms for expression of stable isotope-ratio and gas-ratio measurement results. Rapid Commun. Mass Spectrom. 2011, 25, 2538–2560. [Google Scholar] [CrossRef] [PubMed]
- Post, D.M.; Layman, C.A.; Arrington, D.A.; Takimoto, G.; Quattrochi, J.; Montaña, C.G. Getting to the fat of the matter: Models, methods and assumptions for dealing with lipids in stable isotope analyses. Oecologia 2007, 152, 179–189. [Google Scholar] [CrossRef] [PubMed]
- Estrada, M.; Delgado, M.; Blasco, D.; Latasa, M.; Cabello, A.M.; Benítez-Barrios, V.; Fraile-Nuez, E.; Mozetic, P.; Vidal, M. Phytoplankton across tropical and subtropical regions of the Atlantic, Indian and Pacific oceans. PLoS ONE 2016, 11, e0151699. [Google Scholar] [CrossRef] [PubMed]
- Hunt, B.P.V.; Carlotti, F.; Donoso, K.; Pagano, M.; D’Ortenzio, F.; Taillandier, V.; Conan, P. Trophic pathways of phytoplankton size classes through the zooplankton food web over the spring transition period in the north-west Mediterranean Sea. J. Geophys. Res. 2017, 122, 6309–6324. [Google Scholar] [CrossRef]
- McClelland, J.W.; Holl, C.M.; Montoya, J.P. Relating low δ15N values of zooplankton to N2-fixation in the tropical North Atlantic: Insights provided by stable isotope ratios of amino acids. Deep Sea Res. 2003, 50, 849–861. [Google Scholar] [CrossRef]
- Mompeán, C.; Bode, A.; Gier, E.; McCarthy, M.D. Bulk vs. aminoacid stable N isotope estimations of metabolic status and contributions of nitrogen fixation to size-fractionated zooplankton biomass in the subtropical N Atlantic. Deep Sea Res. 2016, 114, 137–148. [Google Scholar] [CrossRef]
- Agawin, N.S.R.; Tovar-Sanchez, A.; Knoth de Zarruck, K.; Duarte, C.M.; Agusti, S. Variability in the abundance of Trichodesmium and nitrogen fixation activities in the subtropical NE Atlantic. J. Plankton Res. 2013, 35, 1126–1140. [Google Scholar] [CrossRef]
- Waser, N.A.D.; Harrison, W.G.; Head, E.J.H.; Nielsen, B.; Lutz, V.A.; Calvert, S.E. Geographic variations in the nitrogen isotope composition of surface particulate nitrogen and new production across the North Atlantic Ocean. Deep Sea Res. 2000, 47, 1207–1226. [Google Scholar] [CrossRef]
- Jennings, S.; Maxwell, T.A.D.; Schratzberger, M.; Milligan, S.P. Body-size dependent temporal variations in nitrogen stable isotope ratios in food webs. Mar. Ecol. Prog. Ser. 2008, 370, 199–206. [Google Scholar] [CrossRef] [Green Version]
- Bode, A.; Barquero, S.; Varela, M.; Braun, J.G.; de Armas, D. Pelagic bacteria and phytoplankton in oceanic waters near the Canary Islands in summer. Mar. Ecol. Prog. Ser. 2001, 209, 1–17. [Google Scholar] [CrossRef] [Green Version]
- Hirst, A.G.; Bunker, A.J. Growth of marine planktonic copepods: Global rates and patterns in relation to chlorophyll a, temperature, and body weight. Limnol. Oceanogr. 2003, 48, 1988–2010. [Google Scholar] [CrossRef] [Green Version]
- Fernández-Castro, B.; Mouriño-Carballido, B.; Marañón, E.; Chouciño, P.; Gago, J.; Ramírez, T.; Vidal, M.; Bode, A.; Blasco, D.; Royer, S.J.; et al. Importance of salt fingering for new nitrogen supply in the oligotrophic ocean. Nat. Commun. 2015, 6, 8002. [Google Scholar] [CrossRef] [PubMed] [Green Version]
- Teuber, L.; Schukat, A.; Hagen, W.; Auel, H. Trophic interactions and life strategies of epi- to bathypelagic calanoid copepods in the tropical Atlantic Ocean. J. Plankton Res. 2014, 36, 1109–1123. [Google Scholar] [CrossRef] [Green Version]
- Agersted, M.D.; Bode, A.; Nielsen, T.G. Trophic position of coexisting krill species: A stable isotope approach. Mar. Ecol. Prog. Ser. 2014, 516, 136–151. [Google Scholar] [CrossRef] [Green Version]
- Cartes, J.E.; Huguet, C.; Parra, S.; Sanchez, F. Trophic relationships in deep-water decapods of le Danois Bank (Cantabrian Sea, NE Atlantic): Trends related with depth and seasonal changes in food quality and availability. Deep Sea Res. 2007, 54, 1091–1110. [Google Scholar] [CrossRef]
- Pearre, S., Jr. Feeding by chaetognatha: Aspects of inter- and intra-specific predation. Mar. Ecol. Prog. Ser. 1982, 7, 33–45. [Google Scholar]
- Kehayias, G.; Lykakis, J.; Fragopoulu, N. The diets of the chaetognaths Sagitta enflata, S. serratodentata atlantica and S. bipunctata at different seasons in Eastern Mediterranean coastal waters. ICES J. Mar. Sci. 1996, 53, 837–846. [Google Scholar] [CrossRef]
- Baier, C.T.; Purcell, J.E. Trophic interactions of chaetognaths, larval fish, and zooplankton in the South Atlantic Bight. Mar. Ecol. Prog. Ser. 1997, 146, 43–53. [Google Scholar] [CrossRef] [Green Version]
- Madigan, D.J.; Carlisle, A.B.; Dewar, H.; Snodgrass, O.E.; Litvin, S.Y.; Micheli, F.; Block, B.A. Stable isotope analysis challenges wasp-waist food web assumptions in an upwelling pelagic ecosystem. Sci. Rep. 2012, 2, 654. [Google Scholar] [CrossRef] [PubMed]
- Svanback, R.; Quevedo, M.; Olsson, J.; Eklov, P. Individuals in food webs: The relationships between trophic position, omnivory and among-individual diet variation. Oecologia 2015, 178, 103–114. [Google Scholar] [CrossRef] [PubMed]
- Altabet, M.A.; François, R. Sedimentary nitrogen isotopic ratio as a recorder for surface ocean nitrate utilization. Glob. Biogeochem. Cycles 1994, 8, 103–116. [Google Scholar] [CrossRef]
- Holmes, E.; Lavik, G.; Fischer, G.; Segl, M.; Ruhland, G.; Wefer, G. Seasonal variability of δ15N in sinking particles in the Benguela upwelling region. Deep Sea Res. 2002, 49, 377–394. [Google Scholar] [CrossRef]
- Hernández-León, S.; Almeida, C.; Portillo-Hahnefeld, A.; Gómez, M.; Rodríguez, J.M.; Arístegui, J. Zooplankton biomass and indices of feeding and metabolism in relation to an upwelling filament off Northwest Africa. J. Mar. Res. 2002, 60, 327–346. [Google Scholar] [CrossRef]
- Fernández-Urruzola, I.; Osma, N.; Packard, T.T.; Gómez, M.; Postel, L. Distribution of zooplankton biomass and potential metabolic activities across the northern Benguela upwelling system. Deep Sea Res. 2014, 140, 138–139. [Google Scholar] [CrossRef]
- Sommer, F.; Hansen, T.; Sommer, U. Transfer of diazotrophic nitrogen to mesozooplankton in kiel fjord, western baltic sea: A mesocosm study. Mar. Ecol. Prog. Ser. 2007, 324, 105–112. [Google Scholar] [CrossRef]
- Williams, R.L.; Wakeham, S.; McKinney, R.; Wishner, K.F. Trophic ecology and vertical patterns of carbon and nitrogen stable isotopes in zooplankton from oxygen minimum zone regions. Deep Sea Res. 2014, 90, 36–47. [Google Scholar] [CrossRef]
- Harris, B.P.; Young, J.W.; Revill, A.T.; Taylor, M.D. Understanding diel-vertical feeding migrations in zooplankton using bulk carbon and nitrogen stable isotopes. J. Plankton Res. 2014, 36, 1159–1163. [Google Scholar] [CrossRef] [Green Version]
- Layman, C.A.; Allgeier, J.E. Characterizing trophic ecology of generalist consumers: A case study of the invasive lionfish in the Bahamas. Mar. Ecol. Prog. Ser. 2012, 448, 131–141. [Google Scholar] [CrossRef]
Figure 1.
The position of the studied stations in April 2015. Dots indicate conductivity-temperature-depth (CTD) profiles and bottle casts and circles the stations where plankton samples were collected. Stations were grouped in three zones according to the distribution of hydrographic and chemical variables (see Figure 2 and Supplementary Table S1).

Figure 2.
The surface to 800 m sections of potential temperature (°C) (a), salinity (b), surface to 200 m profiles of fluorescence (RFU: relative fluorescence units) (c) and particulate organic carbon (POC, µg L−1) (d). Station numbers are indicated in the upper axis of each panel.
Figure 2.
The surface to 800 m sections of potential temperature (°C) (a), salinity (b), surface to 200 m profiles of fluorescence (RFU: relative fluorescence units) (c) and particulate organic carbon (POC, µg L−1) (d). Station numbers are indicated in the upper axis of each panel.

Figure 3.
The mean ± SE (a) δ15N and (b) δ13C of seston and herbivorous copepods (Copepod H) in the epipelagic layer (surface to 200 m) for the three zones marked in Figure 1. Different letters indicate significantly different zonal means (ANOVA and Dunnett-C post hoc tests, p < 0.05).
Figure 3.
The mean ± SE (a) δ15N and (b) δ13C of seston and herbivorous copepods (Copepod H) in the epipelagic layer (surface to 200 m) for the three zones marked in Figure 1. Different letters indicate significantly different zonal means (ANOVA and Dunnett-C post hoc tests, p < 0.05).

Figure 4.
The mean (± se) δ15N of plankton guilds (H: herbivores, OC: omnivores-carnivores) for the epipelagic (E, 0–200 m), upper mesopelagic (UM, 200–500 m), and lower mesopelagic (LM, 500–900 m) layers in (a) zone 1, (b) zone 2 and (c) zone 3 for day (white bars) and night (grey bars) samples. Asterisks indicate significant differences (ANOVA, p < 0.05) between day and night samples at each layer.
Figure 5.
The depth layer isospaces of δ13C and δ15N including individual sample measurements for seston and plankton for (a) zone 1, (b) zone 2, and (c) zone 3. The maximum likelihood estimates of standard ellipse areas (thick lines) for each layer are indicated.
Figure 5.
The depth layer isospaces of δ13C and δ15N including individual sample measurements for seston and plankton for (a) zone 1, (b) zone 2, and (c) zone 3. The maximum likelihood estimates of standard ellipse areas (thick lines) for each layer are indicated.

Figure 6.
The standard ellipse areas for the food webs observed in the epipelagic (E), upper mesopelagic (UM), and lower mesopelagic (LM) layers of the zones marked in Figure 1 computed from the Bayesian multivariate normal distributions fitted to the original isotope data. The uncorrected (black dots) and sample–size corrected mode values (red crosses), along with the intervals encompassing 50%, 75%, and 95% of the estimations (shaded boxes) are indicated.


Table 1.
The mean and standard error (SE) of Layman metrics of the Bayesian estimates of the areas defined by δ15N and δ13C of seston and plankton for each zone identified in Figure 1 (all depth layers combined). NR: δ15N range, CR: δ13C range, TA: total area of the convex hull, CD: mean distance to the centroid, MNND: mean distance to the nearest neighbor, SDNND: standard deviation of the distance to the nearest neighbor. All metrics are expressed as ‰, except for TA, which corresponds to standardized values.
| Zone 1 | Zone 2 | Zone 3 | ||||
|---|---|---|---|---|---|---|
| Metric | Mean | SE | Mean | SE | Mean | SE |
| NR | 1.716 | 0.004 | 1.706 | 0.003 | 2.504 | 0.003 |
| CR | 1.095 | 0.003 | 1.703 | 0.003 | 0.714 | 0.003 |
| TA | 0.711 | 0.003 | 0.155 | 0.002 | 0.154 | 0.002 |
| CD | 0.819 | 0.001 | 0.854 | 0.001 | 0.914 | 0.001 |
| MNND | 1.161 | 0.003 | 1.170 | 0.002 | 1.271 | 0.002 |
| SDNND | 0.220 | 0.002 | 0.169 | 0.002 | 0.148 | 0.002 |
Table 2.
The mean and standard error (SE) overlap of Bayesian ellipses between layers by the zones marked in Figure 1. Overlap is expressed as a fraction (%) of the non-overlapping area. E: epipelagic layer, UM: upper mesopelagic layer, LM: lower mesopelagic layer.
Table 2.
The mean and standard error (SE) overlap of Bayesian ellipses between layers by the zones marked in Figure 1. Overlap is expressed as a fraction (%) of the non-overlapping area. E: epipelagic layer, UM: upper mesopelagic layer, LM: lower mesopelagic layer.
| E | UM | ||||
|---|---|---|---|---|---|
| Zone | Layer | Mean | SE | Mean | SE |
| zone 1 | UM | 27.94 | 0.33 | --- | --- |
| LM | 47.17 | 0.45 | 54.46 | 0.54 | |
| zone 2 | UM | 38.70 | 0.38 | --- | --- |
| LM | 43.93 | 0.39 | 70.98 | 0.71 | |
| zone 3 | UM | 43.88 | 0.52 | --- | --- |
| LM | 33.94 | 0.57 | 52.16 | 1.01 | |
© 2018 by the authors. Licensee MDPI, Basel, Switzerland. This article is an open access article distributed under the terms and conditions of the Creative Commons Attribution (CC BY) license (http://creativecommons.org/licenses/by/4.0/).
Share and Cite
MDPI and ACS Style
Bode, A.; Hernández-León, S. Trophic Diversity of Plankton in the Epipelagic and Mesopelagic Layers of the Tropical and Equatorial Atlantic Determined with Stable Isotopes. Diversity 2018, 10, 48. https://doi.org/10.3390/d10020048
AMA Style
Bode A, Hernández-León S. Trophic Diversity of Plankton in the Epipelagic and Mesopelagic Layers of the Tropical and Equatorial Atlantic Determined with Stable Isotopes. Diversity. 2018; 10(2):48. https://doi.org/10.3390/d10020048
Chicago/Turabian StyleBode, Antonio, and Santiago Hernández-León. 2018. "Trophic Diversity of Plankton in the Epipelagic and Mesopelagic Layers of the Tropical and Equatorial Atlantic Determined with Stable Isotopes" Diversity 10, no. 2: 48. https://doi.org/10.3390/d10020048
Note that from the first issue of 2016, this journal uses article numbers instead of page numbers. See further details here.