Article

Hyperdiverse Macrofauna Communities Associated with a Common Sponge, Stylissa carteri, Shift across Ecological Gradients in the Central Red Sea

1
Red Sea Research Center, Division of Biological and Environmental Science and Engineering, King Abdullah University of Science and Technology, Thuwal 23955-6900, Saudi Arabia
2
Smithsonian Institution, National Museum of Natural History, Washington, DC 20013-7012, USA
3
Naturalis Biodiversity Center, 2333 CR Leiden, The Netherlands
4
Environmental Biology Department, Institute of Environmental Sciences, CML, Leiden University, 2333 CC Leiden, The Netherlands
5
Florida Museum of Natural History, Gainesville, Florida, FL 32611, USA
*
Author to whom correspondence should be addressed.
Current Address: School of Biological Sciences, Victoria University of Wellington, Wellington 6012, New Zealand.
Current Address: Smithsonian Tropical Research Institute, Balboa, Ancon 03092, Panama.
Diversity 2019, 11(2), 18; https://doi.org/10.3390/d11020018
Submission received: 31 December 2018 / Revised: 23 January 2019 / Accepted: 24 January 2019 / Published: 29 January 2019

Abstract

:
Sponges act as important microhabitats in the marine environment and promote biodiversity by harboring a wide variety of macrofauna, but little is known about the magnitude and patterns of diversity of sponge-associated communities. This study uses DNA barcoding to examine the macrofaunal communities associated with Stylissa carteri in the central Saudi Arabian Red Sea, an understudied ecosystem with high biodiversity and endemism. In total, 146 operational taxonomic units (OTUs) were distinguished from 938 successfully-sequenced macrofauna individuals from 99 sponges. A significant difference was found in the macrofaunal community composition of S. carteri along a cross-shelf gradient using OTU abundance (Bray–Curtis dissimilarity index), with more amphipods associated with offshore sponges and more brittle stars and fishes associated with inshore sponges. The abundance of S. carteri also showed a gradient, increasing with proximity to shore. However, no significant differences in macrofaunal community composition or total macrofauna abundance were observed between exposed and sheltered sides of the reefs and there was no significant change in total macrofauna abundance along the inshore–offshore gradient. As climate change and ocean acidification continue to impact coral reef ecosystems, understanding the ecology of sponges and their role as microhabitats may become more important for understanding their full ramifications for biodiversity.

Graphical Abstract

1. Introduction

Tropical coral reefs are among the most diverse ecosystems on the planet. Studying biodiversity in these environments is important not only for gaining knowledge about the variety of organisms present, but also for understanding how the environment shifts and is affected by climate change and anthropogenic stresses. Recent studies show that between 33 and 91 percent of marine species are currently undescribed [1,2], making baseline data for studies involving environmental change very difficult to obtain. The majority of these undescribed species are invertebrates from tropical coastal environments [2].
Sponges are often dominant members of sessile macrobenthos, but they are also often overlooked in biodiversity studies (or lumped into very coarse taxonomic groups) because they are character-poor and typically require microstructural study for identification, thus are taxonomically challenging [3,4]. Nevertheless, sponges serve as one of the most diverse components of reef systems [3,5,6], with their complex structure providing a range of microhabitats for associated epifauna and infauna. Pearse [7] describes large sponges with substantial internal canals as “veritable living hotels”. Several studies show a positive correlation between sponge volume and macrofaunal abundance or species richness [8,9,10,11,12,13]. Others emphasize morphological features, particularly the importance of large and distinct internal canals [12,14,15,16,17]. In many cases, macrofauna take refuge in sponges for protection from predators or for camouflage, thereby increasing their chances of survival [18]. Some species spend most of their life cycles inside their hosts [19] and may use them as breeding grounds [11,20].
In addition to protection, many symbionts rely on sponges for food either directly or indirectly. Sponges may provide food indirectly by creating water flow that can be utilized by associated suspension feeders, including some polychaetes, barnacles, porcelain crabs, and brittle stars [20,21]. Fish may receive both food and oxygen from water currents [22]. Sponges are a direct food source for both resident and roving predators, including nudibranchs [23], various shelled gastropods (e.g., cypraeids, triphorids, pleurotomariids, fissurellids; [24]), chitons [14], sea stars [25], and snapping shrimps [26], the latter having specialized mouthparts and claws for feeding on their hosts. The regenerative properties of sponges may provide a continual food source for this type of grazing species [26]. Although most symbiotic relationships with sponges seem to be commensal or parasitic, it is possible for the hosts to benefit as well. For example, in what Swain [27] suggests is a mutualistic association, zoanthid colonization of some reef sponges increases host growth and function. The bathsponge Spongia sp. and the bivalve Vulsella vulsella have what has been termed a “filtering mutualism” during which sponge hosts use the exhaled water of the bivalves to increase their own filtering rates [28]. Snapping shrimps defend their sponge hosts, as available habitats may be scarce [29]. However, the nature of most relationships is not fully understood and requires further examination.
The macrofaunal community composition and diversity associated with a single sponge species may change between different sites or reefs of a general region [7,8,20]. Westinga and Hoetjes [8] showed no difference in the overall number of macrofauna, but did find that the abundances of various taxa changed among locations. Abdo [20] suggested predator/prey interactions as the cause of macrofaunal composition and density differences while Voultsiadou-Koukoura et al. [30] suggested the influence of environmental factors such as total vegetation cover and exposure on macrofaunal diversity.
In addition to promoting biodiversity, sponges themselves are diverse and abundant on coral reefs, and important players in space competition. In the Caribbean, sponges may rival coral both in terms of abundance [3] and biomass [31]. While coral abundance has been declining through recent decades, the abundance of some sponges has been increasing [32,33,34]. These changes are commonly attributed to high coral mortality due to runoff, overfishing, disease, and bleaching, compared with the release in predation pressure as a result of overfishing and resilience in many sponges (e.g., [35]). Bell et al. [32] proposed the potential for sponges to replace coral reefs in some locations as a result of ocean acidification and rising sea surface temperatures. As sponges are an under-appreciated group hosting complex communities of rich biodiversity, it is becoming increasingly important to establish baselines and study the impacts of changing ocean conditions on sponges and their role as habitats to marine communities.
The Red Sea is a region of high biodiversity with levels of endemism recently found to be even higher than previously thought (e.g., [36,37]). For fishes, annelids, arthropods, and tunicates, >10% of the Red Sea species are endemic, and more than 60 endemic species have been described in the past two decades [36]. Increased research efforts in some Red Sea sites, combined with studies utilizing molecular-morphological approaches, are likely responsible for this enhanced understanding of regional biodiversity. The Red Sea is a unique body of water with extremely high temperatures (20–32 °C) and salinity (37–42‰) [38]. Despite these characteristics, the Red Sea remains an understudied region. The global challenge of the lack of sponge research is only accentuated in the Red Sea. As of 2013, the number of studies conducted on sponges in the Red Sea was approximately four times lower than that in the Great Barrier Reef system and approximately seven times lower than that in the Caribbean [39]. From those studies in the Red Sea, the majority occurred inside the Gulf of Aqaba, and only two of those outside the gulf involved studies of symbiotic interactions of sponges with associated macrofauna [19,39,40]. Although sponge cover is much lower in the Red Sea and other parts of the world than in the Caribbean (summarized by Pawlik et al. [41]), sponges play important functional roles in all locations.
The aim of this study is to assess the patterns of community composition of macrofauna associated with Stylissa carteri in the central Saudi Arabian Red Sea. We use DNA barcoding techniques to estimate the number of symbiotic species in these taxonomically challenging groups. Our study focuses on S. carteri [42], an abundant and readily-identifiable sponge in coastal waters of the Red Sea, with a complex three-dimensional morphology. Its characteristic folds and ridges form canals and protected areas which, together with its water vascular system, offer a potential habitat for many symbionts. The diversity of epifauna and infauna were examined on a fine scale, across various ecological gradients. We hypothesized a change in the macrofaunal communities of S. carteri across both a cross-shelf gradient and an even finer-scale difference of wave exposure. Offshore reefs in coastal Red Sea waters are normally characterized by near-vertical reef walls surrounded by deep water (i.e., 100s of meters deep). Some midshelf reefs have a similar structure, but are positioned on the continental shelf and have surrounding water depths ranging from ~30 m to ~80 m. Inshore reefs of the central Red Sea tend to be located in shallower water and may not have prominent wall structures. Inshore reefs, closer to the dry, dusty terrains on the coast, frequently have higher levels of turbidity than the offshore reefs and the oligotrophic waters of the Red Sea. The seaward side of a reef (typically the western side of Saudi Arabian reefs) is more exposed to wave action than the sheltered side. The leeward side of Saudi Arabian reefs may have less vertical reef structures than the windward (i.e., exposed) side, especially on midshelf and inshore reefs. The environmental differences are known to be associated with changes in fish and benthic community composition along this gradient [43], but the response of communities that live protected on or inside a host has never been investigated. We hypothesize that differences in a combination of factors such as wave energy, turbidity, ecological conditions, and the associated general reef community changes across ecological gradients also affect the distribution of poorly studied host-associated fish and invertebrates. The results of this study provide valuable information concerning the role of S. carteri as a host and its potential role in promoting or maintaining biodiversity in these coral reef systems.

2. Materials and Methods

2.1. Sample Collection

The study was conducted on coral reefs of the central Red Sea, off the coast of Thuwal, Saudi Arabia (Figure 1). We focused on the exposed (west) and sheltered (east) sides of ten reefs along an inshore–offshore gradient: Three offshore, three midshelf, three inshore, and one intermediate reef (Table 1). The intermediate reef (QG) is approximately the same distance from the coast as midshelf reefs, but is surrounded by deep water more typical of offshore reefs. A latitudinal (north–south) gradient is also present within the sampling area, but had a negligible effect on sponge abundance and macrofaunal communities (as also shown by Roberts et al. [44] for fish and benthic assemblages), so will not be a focus of this study. Before samples were collected, surveys were conducted in order to estimate the abundance of the focus sponge species, Stylissa carteri (order Scopalinida: Family Scopalinidae). At two sites per reef, three replicate 25 × 4-meter belt transects were laid at 8–14 m depths, and all S. carteri were counted.
Five S. carteri individuals were collected by divers in June 2015 from each site at 8–25 m depths (average depth = 12.7 m).A significant difference in sample depth was found between shelf positions (p < 0.001), with an increase in average sample depth at offshore sites as opposed to all other shelf locations (mean ± SE; offshore = 14.7 ± 0.7 m, intermediate = 11.6 ± 0.4 m, midshelf = 12 ± 0.7 m, inshore = 11.9 ± 0.4 m). Each sponge (in most cases the entire individual) was photographed underwater, covered with a plastic bag in situ, and removed from the substratum using a dive knife. Immediately upon return to the lab, each sponge was immersed in filtered seawater to obtain volume by displacement before being carefully cut into ~1 cm3 pieces and dissected to avoid cutting or tearing macrofauna which remained on or within the sponge tissue. The filtered seawater and any water from the plastic bags were examined for escaped fauna. All visible (~>1 mm) epifauna and infauna were collected, photographed alive, and stored in 80 percent ethanol at −20 degrees Celsius. No distinction was made between epifauna and infauna due to our inability to confirm where the organisms originated within the sample. We observed some individual organisms emerging from the sponge samples after the pieces were removed from the reef, but could not make systematic observations of this. We identified specimens to the lowest taxonomic level and sent high-resolution photographs of a representative of each suspected morphological species to taxonomic experts for confirmation or assignment to higher taxonomic levels.

2.2. DNA Barcoding

A small piece of tissue was sub-sampled from each epifaunal and infaunal specimen and placed in 96-well plates. We sampled small body parts that were considered less useful for taxonomy (e.g., tissue from the sides of fishes, a leg from crabs, a small portion of the disc of brittle stars, etc.). In cases where the individual was very small (~<2 mm), the entire specimen was used for DNA extraction. Total genomic DNA was extracted with phenol chloroform on an AutoGenprep 965 instrument (Autogen). PCR amplification and Sanger sequencing used standard protocols and previously published primers (jgLCO1490 and jgHCO2198) to sequence a 658bp region of the mitochondrial cytochrome c oxidase subunit I (COI) gene in both forward and reverse directions [45,46]. Additional primer pair mlCOIintF/jgHCO was used on 63 samples that did not amplify with the initial primer set [47]. These samples represented a wide range of taxonomic groups, but consisted primarily of worms and amphipods, with amphipods constituting over half of the samples.

2.3. Sequence Analysis

Raw sequences were uploaded to Geneious 8.1.6 for forward and reverse assembly, alignment, and checks for stop codons and frameshifts to produce one high-quality dataset of DNA barcodes for all macrofauna collected. Sequences were then assigned to Operational Taxonomic Units (OTUs) based on various distance-based approaches to test for the consistency of diversity estimates. First, we delineated OTUs using the Bayesian approach implemented in Clustering 16S rRNA for OTU Prediction (CROP) v1.33 [48]. CROP was originally designed for 16S datasets but it is now commonly used to delineate OTUs from other gene sequences (e.g., internal transcribed spacer (ITS) [49], COI [46]). It uses a Gaussian mixture model to produce clusters with different standard deviations that reflect the natural variability of sequence dissimilarities in the dataset. It bypasses subjective settings of a hard cutoff to account for differences in rates of sequence evolution among taxonomic groups. We set lower and upper bound variance thresholds to three and four, respectively, because these have been shown to generate OTUs that closely reflect species groupings among marine invertebrates [lowest frequency of false positives (splitting of taxa) and false negatives (lumping of taxa)] [47]. Second, we delineated OTUs using the Barcode Index Number (BIN) approach implemented in the Barcode of Life Data System (BOLD) [50]. The BIN system employs a clustering algorithm which uses graph theoretic methods to generate OTUs. Barcode clusters are registered in an online database of specimen and taxonomic identifications [51]. Third, we delineated OTUs using the furthest neighbor method implemented by Mothur v.1.36.1 [52]. This method clusters sequences into OTUs based on a maximum distance from all other sequences within each cluster. We set a maximum genetic distance of five percent in accordance with previous studies showing that this threshold provides a reliable estimate of the number of species in taxonomically diverse sequence datasets [53,54].
The three OTU delineation approaches (CROP, BIN, and Mothur) provided very consistent numbers of OTUs (see Results section); hence the method of sequence clustering had negligible effects on the results. We decided to use the output of CROP for downstream analysis because a flexible dissimilarity cutoff is particularly well suited for this type of dataset. The CROP output was used to build a “sample by observation table” (or OTU table) and one representative sequence per OTU was compared to reference barcodes in GenBank via BLASTn searches for taxonomic identification. We considered that OTU and reference barcodes belonged to the same species when the level of similarity across the local alignment was greater than 97 percent.

2.4. Statistical Analysis

The OTU table was modified to create a second dataset in which the five replicate samples were pooled to create a single entry for each collection site because many sponge samples contained very few macrofauna individuals. Both datasets were used to calculate the estimated diversity of OTUs and both individual- and sample-based rarefaction curves in EstimateS 9.1.0 [55]. The pooled samples were input to MacQIIME 1.9.1 [56]. Phylum- and order-level taxonomy tables were constructed, showing the relative and absolute abundance of sponge macrofauna. The absolute abundance of macrofauna per sponge sample was standardized by the sponge volume, showing the number of macrofauna individuals of each phylum per 10 mL of sponge for each sponge sample. The Bray–Curtis dissimilarity index was used to examine the differences in beta diversity, which was visualized using Principal Coordinate Analysis (PCoA). The differences in macrofaunal community composition between sites were tested using PERMANOVA [57] to determine whether or not the differences found were significant. The Bray–Curtis index was chosen due to its sensitivity to the differences in abundance of OTUs and its use in similar studies [11,20].

3. Results

3.1. Sample Summary

The abundance surveys of Stylissa carteri revealed a trend following the offshore–inshore environmental gradient (Figure 2). The abundance generally increased from offshore to inshore, with the exception of the sheltered side of an offshore reef (SN), which had an unusually high number of S. carteri individuals relative to the trend. In addition, all but two reefs (QG and FE) showed a higher abundance of S. carteri on the sheltered side as opposed to the exposed side of the reef.
The total number of sampled sponges was 100, with volume ranging from 10 mL to 260 mL (Table S1). In total, 964 epifauna and infauna individuals from 99 sponges were collected and sequenced (one sponge did not contain any macrofauna; Figure 3). Barnacles and a mollusk from the family Haminoeidae were also found, but were not sampled due to difficulty of extraction from the sponges without destroying the specimen. Sequencing was successful for 937 macrofauna samples (>97% success). The unsuccessful 3% were spatially and taxonomically heterogeneous. There was an average of 9 (± 1 SE) successfully-sequenced macrofauna specimens per sponge (minimum = 1, maximum = 53, median = 7). Although the sampled sponges exhibited a large range of volume, there was no correlation between the absolute abundance of macrofauna and the sponge volume (R2 = 0.1005). All COI sequences were deposited in GenBank (accession numbers KY262577-KY263513) and BOLD (doi: dx.doi.org/10.5883/DS-STYMACRO).

3.2. Summary Statistics

The three approaches used for OTU delineation (CROP, BOLD, and Mothur) were consistent and classified the obtained sequences into 146, 150, and 142 OTUs/BINs, respectively. Continuing with the results from the OTU table which was produced using the CROP output (Table S2), as recommended for marine invertebrates by Leray et al. [47], Arthropoda and Annelida were the most diverse groups (66 and 61 OTUs, respectively), with Chordata (7 OTUs), Echinodermata (5 OTUs), Mollusca (4 OTUs), Cnidaria (1 OTU), Platyhelminthes (1 OTU), and Sipuncula (1 OTU) being much less diverse. The most common OTU (143 sequences) was identified as a brittle star of the genus Ophiothrix, with nearly twice the number of sequences as the second most common OTU (78 sequences), identified as an isopod of the family Sphaeromatidae. Only 10 OTUs matched sequences in GenBank at >97 percent similarity, providing a species-level match: Four Arthropoda, three Chordata, two Echinodermata, and one Sipuncula. Rarefaction curves did not reach an asymptote for any of the four reef classifications constituting the cross-shelf gradient (Figure 4).

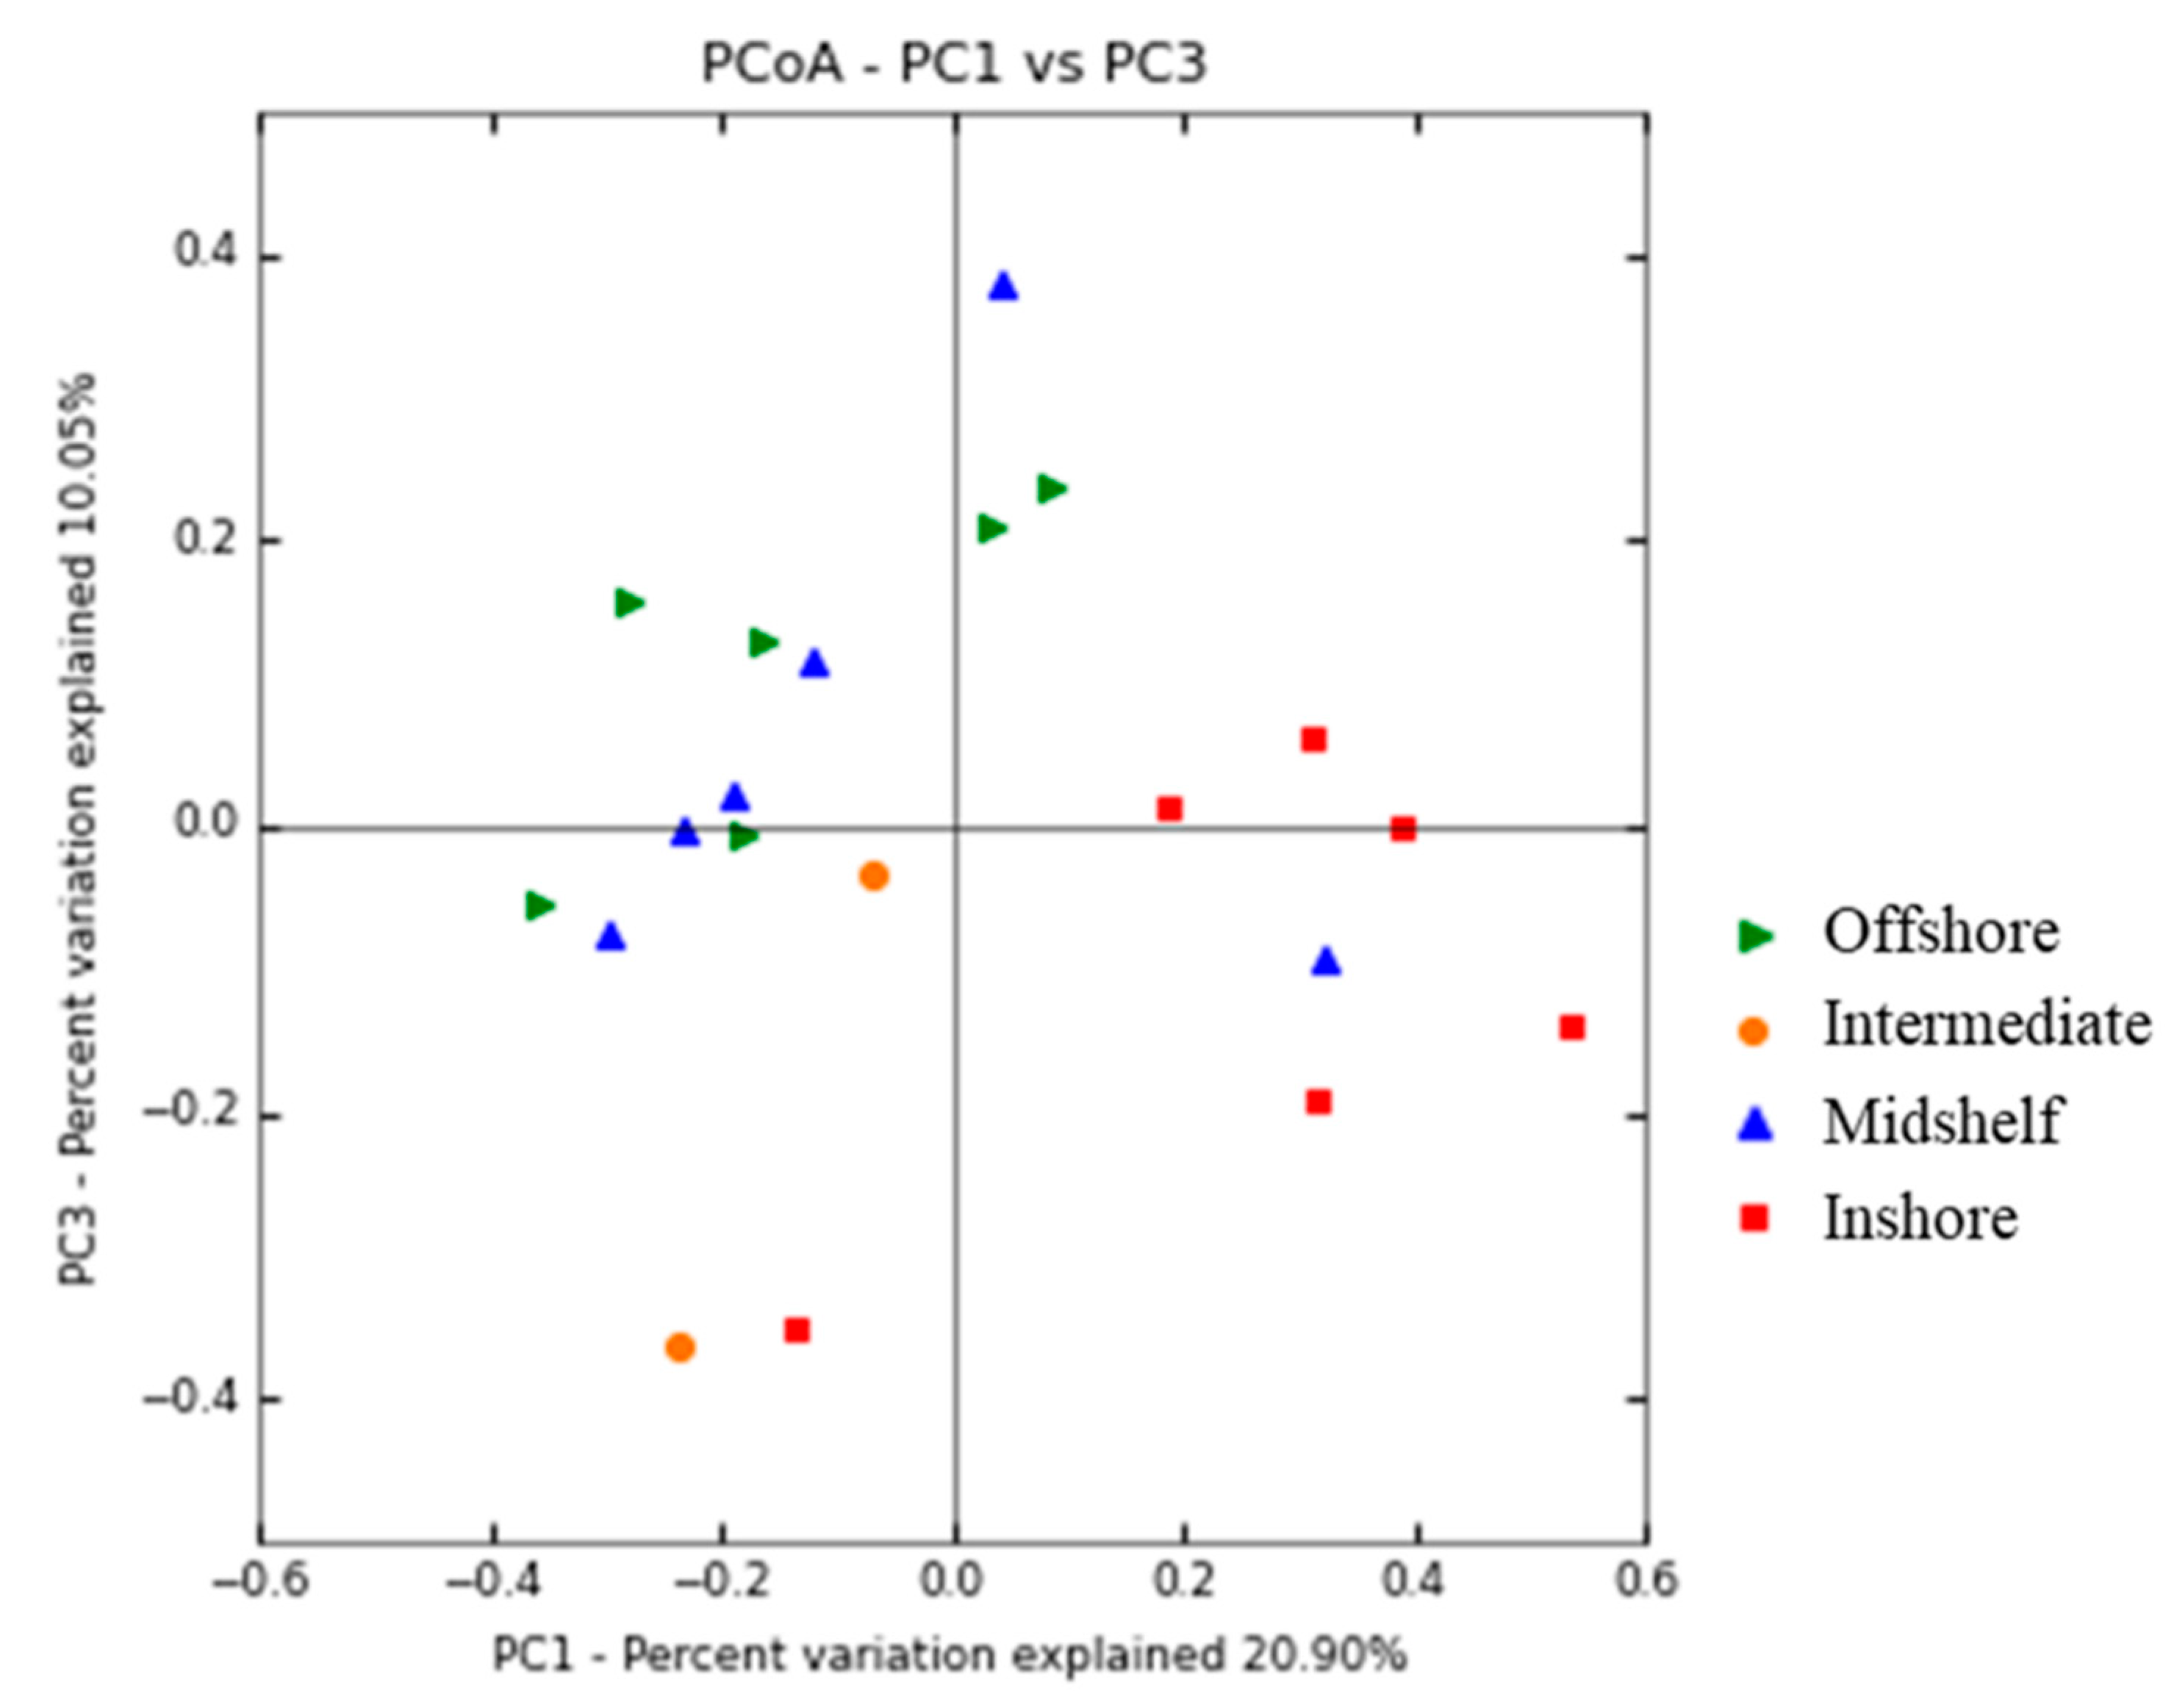
3.3. Spatial Patterns

PERMANOVA analysis using the Bray–Curtis dissimilarity index found a significant difference between macrofaunal communities of S. carteri from different reef classifications (offshore, intermediate, midshelf, inshore, p = 0.021), but not from different sides of the reefs (exposed, sheltered, p = 0.155). The two-dimensional PCoA plot of PC1 vs. PC3 shows a classification-based separation, particularly of samples from inshore and intermediate reefs versus offshore and midshelf reefs (Figure 5). Bray–Curtis pairwise comparisons showed a similarity value lower than 0.1 for 28 pairs of collection sites, including ten inshore/offshore, six inshore/midshelf, and six midshelf/offshore.
There is no clear trend in the total macrofauna abundance along the cross-shelf gradient or between the exposed and sheltered sides of the reefs. As absolute abundance mirrors the relative abundance at the order level, only the relative abundance is depicted here (Figure 6). Along the cross-shelf gradient, Amphipoda constituted a larger proportion of communities offshore (mean ± SE for offshore, intermediate, midshelf, inshore; 13 ± 4% vs. 5 ± 3%, 8 ± 1%, 4 ± 2%). Ophiurida (10 ± 5%, 10 ± 2%, 11 ± 5% vs. 40 ± 11%) and Perciformes (1 ± 1%, 1 ± 1%, 1 ± 1% vs. 3 ± 1%) constituted a larger proportion of communities inshore. The latter were found at five of the six inshore sites and only two midshelf sites and one site of each remaining reef classification. Mollusca (Littorinimorpha, Limoida, and Nudibranchia) were found only at the intermediate reef and/or the exposed sides of the three inshore reefs. Between the exposed and sheltered sides of the reefs, Isopoda constituted a larger proportion of sheltered communities (mean ± SE for exposed, sheltered; 3 ± 1% vs. 20 ± 6%).

4. Discussion

This study used DNA barcoding techniques to examine the macrofaunal communities associated with Stylissa carteri in the central Red Sea to gain knowledge of how these communities change at a local scale. The 937 successfully-sequenced macrofauna individuals collected from 99 sponges were clustered into 146 OTUs from eight phyla. While there is no ‘perfect’ barcode marker, COI has proven to be a very valuable marker for a wide range of taxa. The low percentage of OTUs that received a species-level match (6.8%) in GenBank likely indicates the large amount of work still needed to characterize and barcode host-associated macrofauna in the Red Sea and globally [58,59]. Significant differences in community composition were found along the cross-shelf gradient, but not the finer difference of exposure to wave action. Inshore reefs seemed particularly different from the other reef classifications, showing a higher relative abundance of macrofauna from Ophiurida, Perciformes, and various Mollusca. S. carteri abundance in the study area generally showed a gradient as well, increasing with proximity to shore.
The changes in the macrofaunal community composition of S. carteri across an inshore–offshore gradient may be attributed to a number of environmental factors. Samples collected from the offshore reefs originated from significantly greater depths on average than those collected from all other sites. However, the largest distinction between shelf positions appears to occur between inshore reefs and the rest, providing some assurance that depth is not the primary cause of macrofaunal community composition shifts reported here. The similar vertical structure of offshore and midshelf reefs may contribute to the close grouping of these samples and similarity in the relative abundance of macrofaunal orders between offshore and midshelf samples. Although some macrofauna are found inside the sponge hosts (e.g., many worms and shrimps), others are found primarily on the outer surface (e.g., many crabs and echinoderms). Therefore, epifauna are subject to surrounding environmental conditions. Infauna which rely on the flow of water through a sponge’s aquiferous system may be affected by these factors as well. The offshore sites are subject to stronger currents and higher wave action because they lack the protection of reef structures farther from shore. Midshelf reefs have some protection from the offshore sites, while inshore reefs have much more protection and the benefits of more horizontal substrates.
The higher abundance of brittle stars and fishes within S. carteri at inshore sites may be influenced by the more sheltered environment and horizontal substrate, as well as predation, larval supply, and juvenile survival. Perhaps one of the most important factors is the availability of suspended solids and food, which collect much more readily on a flat surface, especially with the lower rate of water flow at inshore sites. Wooster et al. [60] found a significantly higher level of dissolved organic carbon (DOC), live particulate organic carbon (LPOC), and detritus at inshore reefs than offshore reefs in the central Red Sea. The higher abundance of organic matter inshore [60,61] is most likely beneficial to suspension-feeding and deposit-feeding brittle stars and other organisms. The feeding habits and food sources of macrofauna groups have not been examined in this study, but may be a valuable contribution to cross-shelf studies. The trend in fishes associated with S. carteri is supported by Pearse [7], who found a greater variety of fishes associated with sponges in a shallow, enclosed sound of Bimini as opposed to the open ocean of the Tortugas. Mollusks (snails, nudibranchs, and a bivalve) were only found associated with sponges on the exposed side of inshore reefs as well as both sites at the intermediate reef (QG). Mastaller et al. [62] found that gastropods and bivalves, particularly those associated with corals, in the reef zones of Port Sudan showed a lower abundance in areas of low water exchange, high sedimentation, and turbid waters. Qita al-Girsh (QG) is a small reef surrounded by deep water, hence, epifaunal mollusks in this location, as well as on the exposed sides of the inshore reefs, would be subject to a high flow of water with little sedimentation and low turbidity. Biological factors such as predation and larval dispersal may also play a role, although very little is known about larval supply and dispersal within the Red Sea (however, see Reference [63]). Future studies of invertebrate larval abundances would help to resolve questions of supply vs. survivorship in terms of determining community composition across the cross-shelf gradient.
Stylissa carteri abundance in the study area generally follows the inshore–offshore gradient as well. As with macrofauna, food availability should be considered a major influence. McClanahan and Obura [64] found a higher abundance of sponges in areas with more sediment, which generally has a positive correlation with POC and supports the observation of higher numbers of S. carteri with a closer proximity to shore. Available ambient POC in our study area shows a 42.6% decrease from inshore to offshore reefs (mean 11.5 vs. 6.6 µmol C Lseawater−1, respectively [60]). Some studies attribute a lower biomass of sponges offshore to lower levels of organic matter, which may be carried away by the stronger flow of water, and nutrients, which may originate from shore [61,65]. Larval supply and patterns of connectivity should also be considered (see Reference [66]), although sponge communities generally depend most on environmental conditions such as light, currents, turbulence, slope, and suitable substrate availability [67,68]. Another influence on S. carteri abundance patterns could be the Red Sea bleaching event of 2010. Coral bleaching was significantly higher at inshore sites than at midshelf and offshore sites, and was followed by a general decrease in coral cover within the next year [69]. With a lower abundance of corals, space competition would have decreased and allowed sponges more room to settle and grow, particularly on the more highly affected inshore reefs. A similar pattern has been reported in other locations, such as the Caribbean [70].
Mass global bleaching events are becoming more common [71]. Although studies have been focused on the impacts on coral populations, sponges deserve increased attention. More extensive sampling is required to obtain the baseline data necessary for further studies on how sponges and their associated communities react to such climatic events. This study shows that S. carteri harbors diverse macrofaunal communities and has the potential to promote or maintain biodiversity as coral reef systems continue to change.

Supplementary Materials

The following are available online at https://www.mdpi.com/1424-2818/11/2/18/s1, Table S1: details of the 100 Stylissa carteri samples collected, Table S2: table showing the number of macrofauna individuals of each operational taxonomic unit (OTU) found within each sponge sample.

Author Contributions

Conceptualization, N.M.K., M.L., N.J.d.V. and M.L.B.; data curation, N.M.K., M.L. and G.P.; formal analysis, N.M.K.; funding acquisition, M.L.B.; investigation, N.M.K. and M.K.W.; resources, M.L., N.K. and M.L.B.; writing—original draft, N.M.K.; writing—review & editing, N.M.K., M.K.W., M.L., N.K., N.J.d.V., G.P. and M.L.B.

Funding

Fieldwork was supported by the King Abdullah University of Science and Technology Office of Competitive Research Funds under grant number CRG-1-2012-BER-002 and baseline research funds to MLB.

Acknowledgments

We would like to thank the KAUST Coastal and Marine Resources Core Lab for fieldwork and logistic support. We thank Royale Hardenstine for her help in the field and contribution of Figure 3a. We thank Rodrigo Villalobos Vazquez de la Parra and Héloïse Rouzé for their assistance with lab and analysis procedures. All of the laboratory analyses were conducted in and with the support of the L.A.B. facilities of the Smithsonian National Museum of Natural History (Washington, DC, USA). We give much thanks and appreciation to Michael Campbell for creating the map used as Figure 1.

Conflicts of Interest

The authors declare no conflict of interest. The funders had no role in the design of the study; in the collection, analyses, or interpretation of data; in the writing of the manuscript, or in the decision to publish the results.

References

  1. Mora, C.; Tittensor, D.P.; Adl, S.; Simpson, A.G.B.; Worm, B. How Many Species Are There on Earth and in the Ocean? PLoS Biol. 2011, 9, e1001127. [Google Scholar] [CrossRef] [PubMed]
  2. Appeltans, W.; Ahyong, S.T.; Anderson, G.; Angel, M.V.; Artois, T.; Bailly, N.; Bamber, R.; Barber, A.; Bartsch, I.; Berta, A. The magnitude of global marine species diversity. Curr. Biol. 2012, 22, 2189–2202. [Google Scholar] [CrossRef]
  3. Diaz, M.C.; Rützler, K. Sponges: An essential component of Caribbean coral reefs. Bull. Mar. Sci. 2001, 69, 535–546. [Google Scholar]
  4. Wulff, J. Assessing and monitoring coral reef sponges: Why and how? Bull. Mar. Sci. 2001, 69, 831–846. [Google Scholar]
  5. Przeslawski, R.; Alvarez, B.; Kool, J.; Bridge, T.; Caley, M.J.; Nichol, S. Implications of sponge biodiversity patterns for the management of a marine reserve in northern Australia. PLoS ONE 2015, 10, e0141813. [Google Scholar] [CrossRef] [PubMed]
  6. Fromont, J.; Abdul Wahab, M.A.; Gomez, O.; Ekins, M.; Grol, M.; Hooper, J.N.A. Patterns of sponge biodiversity in the Pilbara, northwestern Australia. Diversity 2016, 8, 21. [Google Scholar] [CrossRef]
  7. Pearse, A. Notes on the inhabitants of certain sponges at Bimini. Ecology 1950, 31, 149–151. [Google Scholar] [CrossRef]
  8. Westinga, E.; Hoetjes, P. The intrasponge fauna of Spheciospongia vesparia (Porifera, Demospongiae) at Curacao and Bonaire. Mar. Biol. 1981, 62, 139–150. [Google Scholar] [CrossRef]
  9. Villamizar, E.; Laughlin, R. Fauna associated with the sponges Aplysina archeri and Aplysina lacunosa in a coral reef of the Archipielago de Los Roques, National Park, Venezuela. In Fossil and Recent Sponges; Springer: Berlin/Heidelberg, Germany, 1991; pp. 522–542. [Google Scholar]
  10. Gherardi, M.; Giangrande, A.; Corriero, G. Epibiontic and endobiontic polychaetes of Geodia cydonium (Porifera, Demospongiae) from the Mediterranean Sea. Hydrobiologia 2001, 443, 87–101. [Google Scholar] [CrossRef]
  11. Ribeiro, S.M.; Omena, E.P.; Muricy, G. Macrofauna associated to Mycale microsigmatosa (Porifera, Demospongiae) in Rio de Janeiro State, SE Brazil. Estuar. Coast. Shelf Sci. 2003, 57, 951–959. [Google Scholar] [CrossRef]
  12. Hultgren, K.M.; Duffy, J.E. Sponge host characteristics shape the community structure of their shrimp associates. Mar. Ecol. Prog. Ser. 2010, 407, 1–12. [Google Scholar] [CrossRef] [Green Version]
  13. Padua, A.; Lanna, E.; Klautau, M. Macrofauna inhabiting the sponge Paraleucilla magna (Porifera: Calcarea) in Rio de Janeiro, Brazil. J. Mar. Biol. Assoc. UK 2013, 93, 889–898. [Google Scholar] [CrossRef]
  14. Klitgaard, A.B. The fauna associated with outer shelf and upper slope sponges (Porifera, Demospongiae) at the Faroe Islands, northeastern Atlantic. Sarsia 1995, 80, 1–22. [Google Scholar] [CrossRef] [Green Version]
  15. Duffy, J.E. Eusociality in a coral-reef shrimp. Nature 1996, 381, 512–514. [Google Scholar] [CrossRef]
  16. Koukouras, A.; Russo, A.; Voultsiadou-Koukoura, E.; Arvanitidis, C.; Stefanidou, D. Macrofauna Associated with Sponge Species of Different Morphology. Mar. Ecol. 1996, 17, 569–582. [Google Scholar] [CrossRef]
  17. Kersken, D.; Göcke, C.; Brandt, A.; Lejzerowicz, F.; Schwabe, E.; Seefeldt, M.A.; Veit-Köhler, G.; Janussen, D. The infauna of three widely distributed sponge species (Hexactinellida and Demospongiae) from the deep Ekström Shelf in the Weddell Sea, Antarctica. Deep Sea Res. Part II Top. Stud. Oceanogr. 2014, 108, 101–112. [Google Scholar] [CrossRef]
  18. Bell, J.J. The functional roles of marine sponges. Estuar. Coast. Shelf Sci. 2008, 79, 341–353. [Google Scholar] [CrossRef]
  19. Magnino, G.; Sarà, A.; Lancioni, T.; Gaino, E. Endobionts of the Coral Reef Sponge Theonella swinhoei (Porifera, Demospongiae). Invertebr. Biol. 1999, 118, 213–220. [Google Scholar] [CrossRef]
  20. Abdo, D.A. Endofauna differences between two temperate marine sponges (Demospongiae; Haplosclerida; Chalinidae) from southwest Australia. Mar. Biol. 2007, 152, 845–854. [Google Scholar] [CrossRef]
  21. Wendt, P.; Van Dolah, R.; O’Rourke, C. A comparative study of the invertebrate macrofauna associated with seven sponge and coral species collected from the South Atlantic Bight. J. Elisha Mitchell Sci. Soc. 1985, 101, 187–203. [Google Scholar]
  22. Tyler, J.C.; Böhlke, J.E. Records of Sponge-Dwelling Fishes, Primarily of the Caribbean. Bull. Mar. Sci. 1972, 22, 601–642. [Google Scholar]
  23. Proksch, P. Defensive roles for secondary metabolites from marine sponges and sponge-feeding nudibranchs. Toxicon 1994, 32, 639–655. [Google Scholar] [CrossRef]
  24. Kohn, A. Feeding biology of gastropods. Mollus. Physiol. Part 1983, 2, 2–64. [Google Scholar]
  25. Wulff, L. Sponge-feeding by the Caribbean starfish Oreaster reticulatus. Mar. Biol. 1995, 123, 313–325. [Google Scholar] [CrossRef]
  26. Ďuriš, Z.; Horka, I.; Juračka, P.J.; Petrusek, A.; Sandford, F. These squatters are not innocent: The evidence of parasitism in sponge-inhabiting shrimps. PLoS ONE 2011, 6, e21987. [Google Scholar] [CrossRef] [PubMed]
  27. Swain, T.D. Context-dependent effects of symbiosis: Zoanthidea colonization generally improves Demospongiae condition in native habitats. Mar. Biol. 2012, 159, 1429–1438. [Google Scholar] [CrossRef]
  28. Tsubaki, R.; Kato, M. A novel filtering mutualism between a sponge host and its endosymbiotic bivalves. PLoS ONE 2014, 9, e108885. [Google Scholar] [CrossRef] [PubMed]
  29. Bornbusch, S.L.; Lefcheck, J.S.; Duffy, J.E. Allometry of individual reproduction and defense in eusocial colonies: A comparative approach to trade-offs in social sponge-dwelling Synalpheus shrimps. PLoS ONE 2018, 13, e0193305. [Google Scholar] [CrossRef] [PubMed]
  30. Voultsiadou-Koukoura, H.; Koukouras, A.; Eleftheriou, A. Macrofauna associated with the sponge Verongia aerophoba in the North Aegean Sea. Estuar. Coast. Shelf Sci. 1987, 24, 265–278. [Google Scholar] [CrossRef]
  31. Rützler, K. Sponges in coral reefs. In Coral Reefs: Res. Methods; Stoddart, D.R., Johannes, R.E., Eds.; UNESCO (Monogr. Oceanogr. Methodol. 5): Paris, France, 1978; pp. 299–313. Available online: https://repository.si.edu/bitstream/handle/10088/7849/iz_Ruetzler_1978b.pdf (accessed on 15 November 2015).
  32. Bell, J.J.; Davy, S.K.; Jones, T.; Taylor, M.W.; Webster, N.S. Could some coral reefs become sponge reefs as our climate changes? Glob. Chang. Biol. 2013, 19, 2613–2624. [Google Scholar] [CrossRef]
  33. Ruzicka, R.; Colella, M.; Porter, J.; Morrison, J.; Kidney, J.; Brinkhuis, V.; Lunz, K.; Macaulay, K.; Bartlett, L.; Meyers, M. Temporal changes in benthic assemblages on Florida Keys reefs 11 years after the 1997/1998 El Niño. Mar. Ecol. Prog. Ser. 2013, 489, 125–141. [Google Scholar] [CrossRef] [Green Version]
  34. McMurray, S.E.; Finelli, C.M.; Pawlik, J.R. Population dynamics of giant barrel sponges on Florida coral reefs. J. Exp. Mar. Biol. Ecol. 2015, 473, 73–80. [Google Scholar] [CrossRef] [Green Version]
  35. Loh, T.-L.; McMurray, S.E.; Henkel, T.P.; Vicente, J.; Pawlik, J.R. Indirect effects of overfishing on Caribbean reefs: Sponges overgrow reef-building corals. PeerJ 2015, 3, e901. [Google Scholar] [CrossRef] [PubMed]
  36. DiBattista, J.D.; Berumen, M.L.; Gaither, M.R.; Rocha, L.A.; Eble, J.A.; Choat, J.H.; Craig, M.T.; Skillings, D.J.; Bowen, B.W. After continents divide: Comparative phylogeography of reef fishes from the Red Sea and Indian Ocean. J. Biogeogr. 2013, 40, 1170–1181. [Google Scholar] [CrossRef]
  37. DiBattista, J.D.; Howard Choat, J.; Gaither, M.R.; Hobbs, J.P.A.; Lozano-Cortés, D.F.; Myers, R.F.; Paulay, G.; Rocha, L.A.; Toonen, R.J.; Westneat, M.W. On the origin of endemic species in the Red Sea. J. Biogeogr. 2016, 43, 13–30. [Google Scholar] [CrossRef]
  38. Raitsos, D.; Hoteit, I.; Prihartato, P.; Chronis, T.; Triantafyllou, G.; Abualnaja, Y. Abrupt warming of the Red Sea. Geophys. Res. Lett. 2011, 38. [Google Scholar] [CrossRef] [Green Version]
  39. Berumen, M.L.; Hoey, A.; Bass, W.; Bouwmeester, J.; Catania, D.; Cochran, J.E.; Khalil, M.; Miyake, S.; Mughal, M.; Spaet, J. The status of coral reef ecology research in the Red Sea. Coral Reefs 2013, 32, 737–748. [Google Scholar] [CrossRef] [Green Version]
  40. Ilan, M.; Loya, Y.; Kolbasov, G.; Brickner, I. Sponge-inhabiting barnacles on Red Sea coral reefs. Mar. Biol. 1999, 133, 709–716. [Google Scholar] [CrossRef]
  41. Pawlik, J.R.; Burkepile, D.E.; Thurber, R.V. A Vicious Circle? Altered Carbon and Nutrient Cycling May Explain the Low Resilience of Caribbean Coral Reefs. Bioscience 2016, 66, 470–476. [Google Scholar] [CrossRef] [Green Version]
  42. Dendy, A. IX—Report on a second collection of sponges from the Gulf of Manaar. J. Nat. Hist. 1889, 3, 73–99. [Google Scholar] [CrossRef]
  43. Khalil, M.T.; Bouwmeester, J.; Berumen, M.L. Spatial variation in coral reef fish and benthic communities in the central Saudi Arabian Red Sea. PeerJ 2017, 5, e3410. [Google Scholar] [CrossRef] [PubMed]
  44. Roberts, M.B.; Jones, G.P.; McCormick, M.I.; Munday, P.L.; Neale, S.; Thorrold, S.; Robitzch, V.S.; Berumen, M.L. Homogeneity of coral reef communities across 8 degrees of latitude in the Saudi Arabian Red Sea. Mar. Pollut. Bull. 2016, 105, 558–565. [Google Scholar] [CrossRef] [PubMed] [Green Version]
  45. Geller, J.; Meyer, C.; Parker, M.; Hawk, H. Redesign of PCR primers for mitochondrial cytochrome c oxidase subunit I for marine invertebrates and application in all-taxa biotic surveys. Mol. Ecol. Resour. 2013, 13, 851–861. [Google Scholar] [CrossRef] [PubMed]
  46. Leray, M.; Knowlton, N. DNA barcoding and metabarcoding of standardized samples reveal patterns of marine benthic diversity. Proc. Natl. Acad. Sci. USA 2015, 112, 2076–2081. [Google Scholar] [CrossRef] [PubMed] [Green Version]
  47. Leray, M.; Yang, J.Y.; Meyer, C.P.; Mills, S.C.; Agudelo, N.; Ranwez, V.; Boehm, J.T.; Machida, R.J. A new versatile primer set targeting a short fragment of the mitochondrial COI region for metabarcoding metazoan diversity: Application for characterizing coral reef fish gut contents. Front. Zool. 2013, 10, 34. [Google Scholar] [CrossRef] [PubMed]
  48. Hao, X.; Jiang, R.; Chen, T. Clustering 16S rRNA for OTU prediction: A method of unsupervised Bayesian clustering. Bioinformatics 2011, 27, 611–618. [Google Scholar] [CrossRef] [PubMed]
  49. Yang, C.; Schaefer, D.A.; Liu, W.; Popescu, V.D.; Yang, C.; Wang, X.; Wu, C.; Douglas, W.Y. Higher fungal diversity is correlated with lower CO2 emissions from dead wood in a natural forest. Sci. Rep. 2016, 6, 31066. [Google Scholar] [CrossRef] [PubMed]
  50. Ratnasingham, S.; Hebert, P.D. BOLD: The Barcode of Life Data System (http://www.barcodinglife.org). Mol. Ecol. Notes 2007, 7, 355–364. [Google Scholar] [CrossRef] [PubMed]
  51. Ratnasingham, S.; Hebert, P.D. A DNA-based registry for all animal species: The Barcode Index Number (BIN) system. PLoS ONE 2013, 8, e66213. [Google Scholar] [CrossRef] [PubMed]
  52. Schloss, P.D.; Westcott, S.L.; Ryabin, T.; Hall, J.R.; Hartmann, M.; Hollister, E.B.; Lesniewski, R.A.; Oakley, B.B.; Parks, D.H.; Robinson, C.J. Introducing mothur: Open-source, platform-independent, community-supported software for describing and comparing microbial communities. Appl. Environ. Microbiol. 2009, 75, 7537–7541. [Google Scholar] [CrossRef] [PubMed]
  53. Plaisance, L.; Caley, M.J.; Brainard, R.E.; Knowlton, N. The diversity of coral reefs: What are we missing? PLoS ONE 2011, 6, e25026. [Google Scholar] [CrossRef] [PubMed]
  54. Leray, M.; Agudelo, N.; Mills, S.C.; Meyer, C.P. Effectiveness of annealing blocking primers versus restriction enzymes for characterization of generalist diets: Unexpected prey revealed in the gut contents of two coral reef fish species. PLoS ONE 2013, 8, e58076. [Google Scholar] [CrossRef] [PubMed]
  55. Colwell, R.K. EstimateS: Statistical Estimation of Species Richness and Shared Species from Samples. Version 7.5. User’s Guide and Application. 2005. Available online: http://purl.oclc.org/estimates (accessed on 15 October 2015).
  56. Caporaso, J.G.; Kuczynski, J.; Stombaugh, J.; Bittinger, K.; Bushman, F.D.; Costello, E.K.; Fierer, N.; Pena, A.G.; Goodrich, J.K.; Gordon, J.I. QIIME allows analysis of high-throughput community sequencing data. Nat. Methods 2010, 7, 335–336. [Google Scholar] [CrossRef] [PubMed] [Green Version]
  57. Anderson, M.J. A new method for non-parametric multivariate analysis of variance. Austral Ecol. 2001, 26, 32–46. [Google Scholar]
  58. Al-Rshaidat, M.M.; Snider, A.; Rosebraugh, S.; Devine, A.M.; Devine, T.D.; Plaisance, L.; Knowlton, N.; Leray, M. Deep COI sequencing of standardized benthic samples unveils overlooked diversity of Jordanian coral reefs in the northern Red Sea. Genome 2016, 59, 724–737. [Google Scholar] [CrossRef] [PubMed]
  59. Pearman, J.K.; Leray, M.; Villalobos, R.; Machida, R.; Berumen, M.L.; Knowlton, N.; Carvalho, S. Cross-shelf investigation of coral reef cryptic benthic organisms reveals diversity patterns of the hidden majority. Sci. Rep. 2018, 8, 8090. [Google Scholar] [CrossRef]
  60. Wooster, M.K.; McMurray, S.E.; Pawlik, J.R.; Moran, X.A.G.; Berumen, M.L. Feeding and respiration by giant barrel sponges across a gradient of food abundance in the Red Sea. Limnol. Oceanogr. 2019. under review. [Google Scholar]
  61. Wilkinson, C.R.; Cheshire, A.C. Patterns in the distribution of sponge populations across the central Great Barrier Reef. Coral Reefs 1989, 8, 127–134. [Google Scholar] [CrossRef]
  62. Mastaller, M. The marine molluscan assemblages of Port Sudan, Red Sea. Zool. Meded. 1978, 53, 117–144. [Google Scholar]
  63. Nanninga, G.B.; Saenz-Agudelo, P.; Zhan, P.; Hoteit, I.; Berumen, M.L. Not finding Nemo: Limited reef-scale retention in a coral reef fish. Coral Reefs 2015, 34, 383–392. [Google Scholar] [CrossRef]
  64. McClanahan, T.; Obura, D. Sedimentation effects on shallow coral communities in Kenya. J. Exp. Mar. Biol. Ecol. 1997, 209, 103–122. [Google Scholar] [CrossRef]
  65. Wilkinson, C.R. Interocean differences in size and nutrition of coral reef sponge populations. Science 1987, 236, 1654–1657. [Google Scholar] [CrossRef] [PubMed]
  66. Giles, E.C.; Saenz-Agudelo, P.; Hussey, N.E.; Ravasi, T.; Berumen, M.L. Exploring seascape genetics and kinship in the reef sponge Stylissa carteri in the Red Sea. Ecol. Evol. 2015, 5, 2487–2502. [Google Scholar] [CrossRef] [PubMed]
  67. Villamizar, E.; Díaz, M.C.; Rützler, K.; Nóbrega, R. Biodiversity, ecological structure, and change in the sponge community of different geomorphological zones of the barrier fore reef at Carrie Bow Cay, Belize. Mar. Ecol. 2014, 35, 425–435. [Google Scholar] [CrossRef]
  68. Wahab, M.A.A.; Radford, B.; Cappo, M.; Colquhoun, J.; Stowar, M.; Depczynski, M.; Miller, K.; Heyward, A. Biodiversity and spatial patterns of benthic habitat and associated demersal fish communities at two tropical submerged reef ecosystems. Coral Reefs 2018, 37, 327–343. [Google Scholar] [CrossRef]
  69. Furby, K.A.; Bouwmeester, J.; Berumen, M.L. Susceptibility of central Red Sea corals during a major bleaching event. Coral Reefs 2013, 32, 505–513. [Google Scholar] [CrossRef]
  70. Norström, A.V.; Nyström, M.; Lokrantz, J.; Folke, C. Alternative states on coral reefs: Beyond coral–macroalgal phase shifts. Mar. Ecol. Prog. Ser. 2009, 376, 295–306. [Google Scholar] [CrossRef]
  71. Hughes, T.P.; Anderson, K.D.; Connolly, S.R.; Heron, S.F.; Kerry, J.T.; Lough, J.M.; Baird, A.H.; Baum, J.K.; Berumen, M.L.; Bridge, T.C. Spatial and temporal patterns of mass bleaching of corals in the Anthropocene. Science 2018, 359, 80–83. [Google Scholar] [CrossRef]
Figure 1. Stylissa carteri collection sites in the central Saudi Arabian Red Sea. Ten reefs were sampled at both the sheltered (S) and exposed (E) sides of each reef for a total of 20 sampling sites. AR, SN, and AM are considered offshore reefs, QG is an intermediate reef, AF, UK, and AH are midshelf reefs, and TN, TS, and FE are inshore reefs. Site abbreviations follow Table 1.
Diversity 11 00018 g001
Figure 2. Mean abundance of Stylissa carteri at each collection site. Values are the mean (± SE) of three replicate 100 m2 (25 × 4 m) transects. Order of sites follows the cross-shelf gradient, from offshore to inshore. Site abbreviations follow Table 1.
Diversity 11 00018 g002
Figure 3. Photos of (a) the study sponge species, Stylissa carteri, and select macrofauna individuals. Identifications are as follows: (b) Operational taxonomic unit (OTU) 49—Thalamitoides sp.; (c) OTU 93—Caprellidae; (d) OTU 10—Alpheus sp.; (e) OTU 14—Eunicidae; (f) OTU 63—Sphaeromatidae; (g) OTU 143—Pseudocheilinus sp.; (h) OTU 77—Polynoidae; (i) OTU 171—Caloria indica; (j) OTU 7—Ophiothrix sp.; (k) OTU 180—Columbellidae; (l) OTU 6—Amphipoda.
Diversity 11 00018 g003
Figure 4. Individual- (a) and sample-based (b) rarefaction curves. Data were produced using EstimateS and the mean number of observed OTUs is plotted against the number of macrofauna individuals and number of sponges sampled, respectively, with 95% confidence intervals included.
Diversity 11 00018 g004
Figure 5. Two-dimensional principal coordinates analysis (PCoA) plot of the pooled Stylissa carteri samples. Similarity in community composition based on OTU abundance using the Bray–Curtis diversity index is depicted. Data were produced using QIIME.
Diversity 11 00018 g005
Figure 6. Relative abundance of macrofauna individuals found in pooled Stylissa carteri samples, classified at order level. Collection sites are organized in order of the cross-shelf gradient, from offshore to inshore. Site abbreviations follow Table 1.
Diversity 11 00018 g006
Table 1. Details of the 20 Stylissa carteri collection sites. The full name of each reef is provided along with the reef classification (i.e., shelf position), the site’s exposure to dominant wave direction, and the location’s coordinates.
LabelReefClassificationExposureLatitude (N)Longitude (E)
AR.EAbu RomahOffshoreExposed22°34.034′38°55.541′
SN.EShi’b NazarOffshoreExposed22°19.317′38°51.252′
AM.EAbu MadafiOffshoreExposed22°04.594′38°46.505′
AR.SAbu RomahOffshoreSheltered22°33.833′38°55.717′
SN.SShi’b NazarOffshoreSheltered22°20.434′38°51.227′
AM.SAbu MadafiOffshoreSheltered22°04.258′38°46.433′
QG.EQita al-GirshIntermediateExposed22°26.105′38°59.638′
QG.SQita al-GirshIntermediateSheltered22°25.796′38°59.855′
AF.EAl-FahalMidshelfExposed22°18.316′38°57.648′
UK.EUmm al-KiethlMidshelfExposed22°09.467′38°56.336′
AH.EAbu HenshanMidshelfExposed22°03.723′38°52.085′
AF.SAl-FahalMidshelfSheltered22°18.341′38°57.930′
UK.SUmm al-KiethlMidshelfSheltered22°09.471′38°56.470′
AH.SAbu HenshanMidshelfSheltered22°03.863′38°52.636′
TN.ETahla NorthInshoreExposed22°17.545′39°03.562′
TS.ETahla SouthInshoreExposed22°15.927′39°02.899′
FE.EFsar EastInshoreExposed22°14.390′39°01.817′
TN.STahla NorthInshoreSheltered22°17.151′39°03.530′
TS.STahla SouthInshoreSheltered22°15.679′39°03.154′
FE.SFsar EastInshoreSheltered22°13.980′39°02.181′

