
Climate Change Impacts on Species Composition and Floristic Regions in Thailand

1
Faculty of Forestry, Kasetsart University, Bangkok 10900, Thailand
2
Moore Center for Science, Conservation International, Arlington, VA 22202, USA
3
Department of National Parks, Wildlife and Plant Conservation, Bangkok 10900, Thailand
*
Author to whom correspondence should be addressed.
Diversity 2023, 15(10), 1087; https://doi.org/10.3390/d15101087
Submission received: 20 September 2023
/
Revised: 29 September 2023
/
Accepted: 4 October 2023
/
Published: 15 October 2023
(This article belongs to the Section Biogeography and Macroecology)
Abstract
:Tropical forests are vulnerable to climate change including increased temperatures and changes to rainfall variation. Here, we use Thailand as a case study for assessing the impacts of the shared socio-economic pathway and climate scenarios on changes to the distribution and extent of floristic regions. To address this question, we assigned floristic regions based on a structured cluster analysis of modeled species ranges, and evaluated how those regions respond under scenarios of climate change. A total of 201 plant species with sufficient occurrence data obtained from the systematic forest inventory plots across the country and global datasets were chosen for distribution modeling. Environmental variables, including soils, topography and bioclimatic variables were compiled to model both current and 2050 distributions. Potential floristic regions were classified using a clustering algorithm on the pixel-wise species compositions—resulting in 12 floristic regions representative of both current climate species compositions and projected future species assemblages. Five floristic regions are projected to experience little change in their geographic distribution, while the remainder are projected to be substantially displaced spatially. Additionally, two of the identified floristic regions are not well represented in protected areas—with less than 50% of the current geographic distribution in each region in some form of protected status.
1. Introduction
Tropical forests, which are comprised of rainforests and seasonally dry forests, cover about 15 to 20% of the Earth’s land surface [1]. They are distributed over three continents, i.e., Southeast Asia (SEA), Central and Southern America, and parts of sub-Saharan Africa. Tropical forests are recognized as global centers of biodiversity, providing habitats for fauna and flora, and significantly contributing to global climate regulation. Myers et al. [2] showed that 15 out of 25 of global biodiversity hotspots, which collectively hold nearly 35% of terrestrial vertebrate species and 44% of vascular plant species, are located in the tropical forest ecosystems. In addition, living tropical trees are globally important reservoirs of carbon and are estimated to hold about one-third of the levels of CO2 in the atmosphere [3,4]. Tropical forests also play an important role for rural livelihoods and deliver other ecosystem services such as food, water resources, and income [5].
Agricultural expansion and unsustainable logging are listed as the most prominent drivers of tropical deforestation, followed by wood fuels, forest fires, and livestock grazing [6,7]. However, there are significant differences between regions globally [8]. In some regions, the rate of deforestation is declining in recent decades due to large-scale plantation establishment in some countries (i.e., China, Vietnam) and strict protection measures [9]. A recent assessment using high-resolution imagery showed that the forest cover in Thailand during 2000–2019 remained almost stable at 32–33% [10], suggesting climate change as a more salient pressure moving forward.
Global climate models project increased temperatures across the tropics, with accompanying variability in rainfall and with more extreme events such as droughts and wildfires [11,11,12,13,14]. The fifth assessment report of the Intergovernmental Panel on Climate Change (IPCC) compiled evidence that mean annual temperatures in SEA will increase by 2–4 °C by 2100 in addition to instances of prolonged droughts juxtaposed against periods of excessive precipitation driven by the re-occurrence of irregular patterns of the El Nino Southern Oscillation (ENSO) cycle [15,16]. The sixth assessment report added evidence that monsoon precipitation is projected to intensify in the mid- to long-term over South Asia and SEA [17].
Recent studies have indicated that climate change is likely to overtake land use change in the next century as a primary driver of ecosystem disruption [18,19]. Altered climatic conditions will potentially cause shifts in ecosystems, species distributions, and species compositions [11,20,21,22,23,24,25,26] with the level of impact variable depending on the individual responses of ecosystems and their constituent species [27]. Many global climate models project a significant geographical shift and an increase in the extent of transition areas between tropical forests and savanna [28,29], but this is not the case for most tropical cloud forest species due to their restricted distributions [30]. Land species are often projected to shift to cooler-temperature areas and higher altitudes [31,32]. In addition, studies suggest tropical lowland species may contract their distribution or shift in phenotypes (plasticity) as mean or extreme temperatures increase above their heat tolerance, but this scenario could also lead to novel communities of heat-tolerant species [26,33,34]. The impacts of climate change are projected to be greater for Dipterocarpaceae, Meliaceae, and Moraceae families that are dominant in tropics [35,36] as these families are characterized by recalcitrant seeds or short storage longevity [37].
The population dynamic processes of tree growth, mortality, and regeneration are leading to changes in species composition and ecosystem structure and function. The impact of climate change on tropical tree distributions has been substantially studied [35,37,38,39,40]. However, studies on the consequences of species shifts may have on species composition and floristic regions are lacking for tropical forests compared with temperate forests [41] and grassland [18].
Thailand is recognized as a country with high species richness of both of flora and fauna. Situated in the center of SEA, the country is at the crossroads of two major bio-geographical regions, namely the Indochinese and Malaysian regions that are influenced by tropical monsoons, and the entire area is included in the Indo-Burma biodiversity hotspots [42]. A long-term systematic study of the flora of Thailand, initiated in 1970, identified and described about 14,000 species, of which 30–40% are angiosperm species [43,44]. Forest ecosystems are classified into 11 forest types [45]. Mixed deciduous and dry deciduous dipterocarp forests are dominating. Based on long-term botanical research and expert judgment [46], Thailand has seven floristic regions in Thailand (Figure S1). Meanwhile, the most recent WWF ecoregion maps show that Thailand contains 15 distinct eco-regions [47].
This research aims to answer three questions: (1) how will tropical tree species in Thailand spatially respond to projected climate change; (2) how many floristic regions can be delineated from the species distribution; and (3) how do the floristic regions respond to projected climate change. The results of this research will significantly support the current Thai government policy on national biodiversity master plan [48].
2. Methods
2.1. Study Area
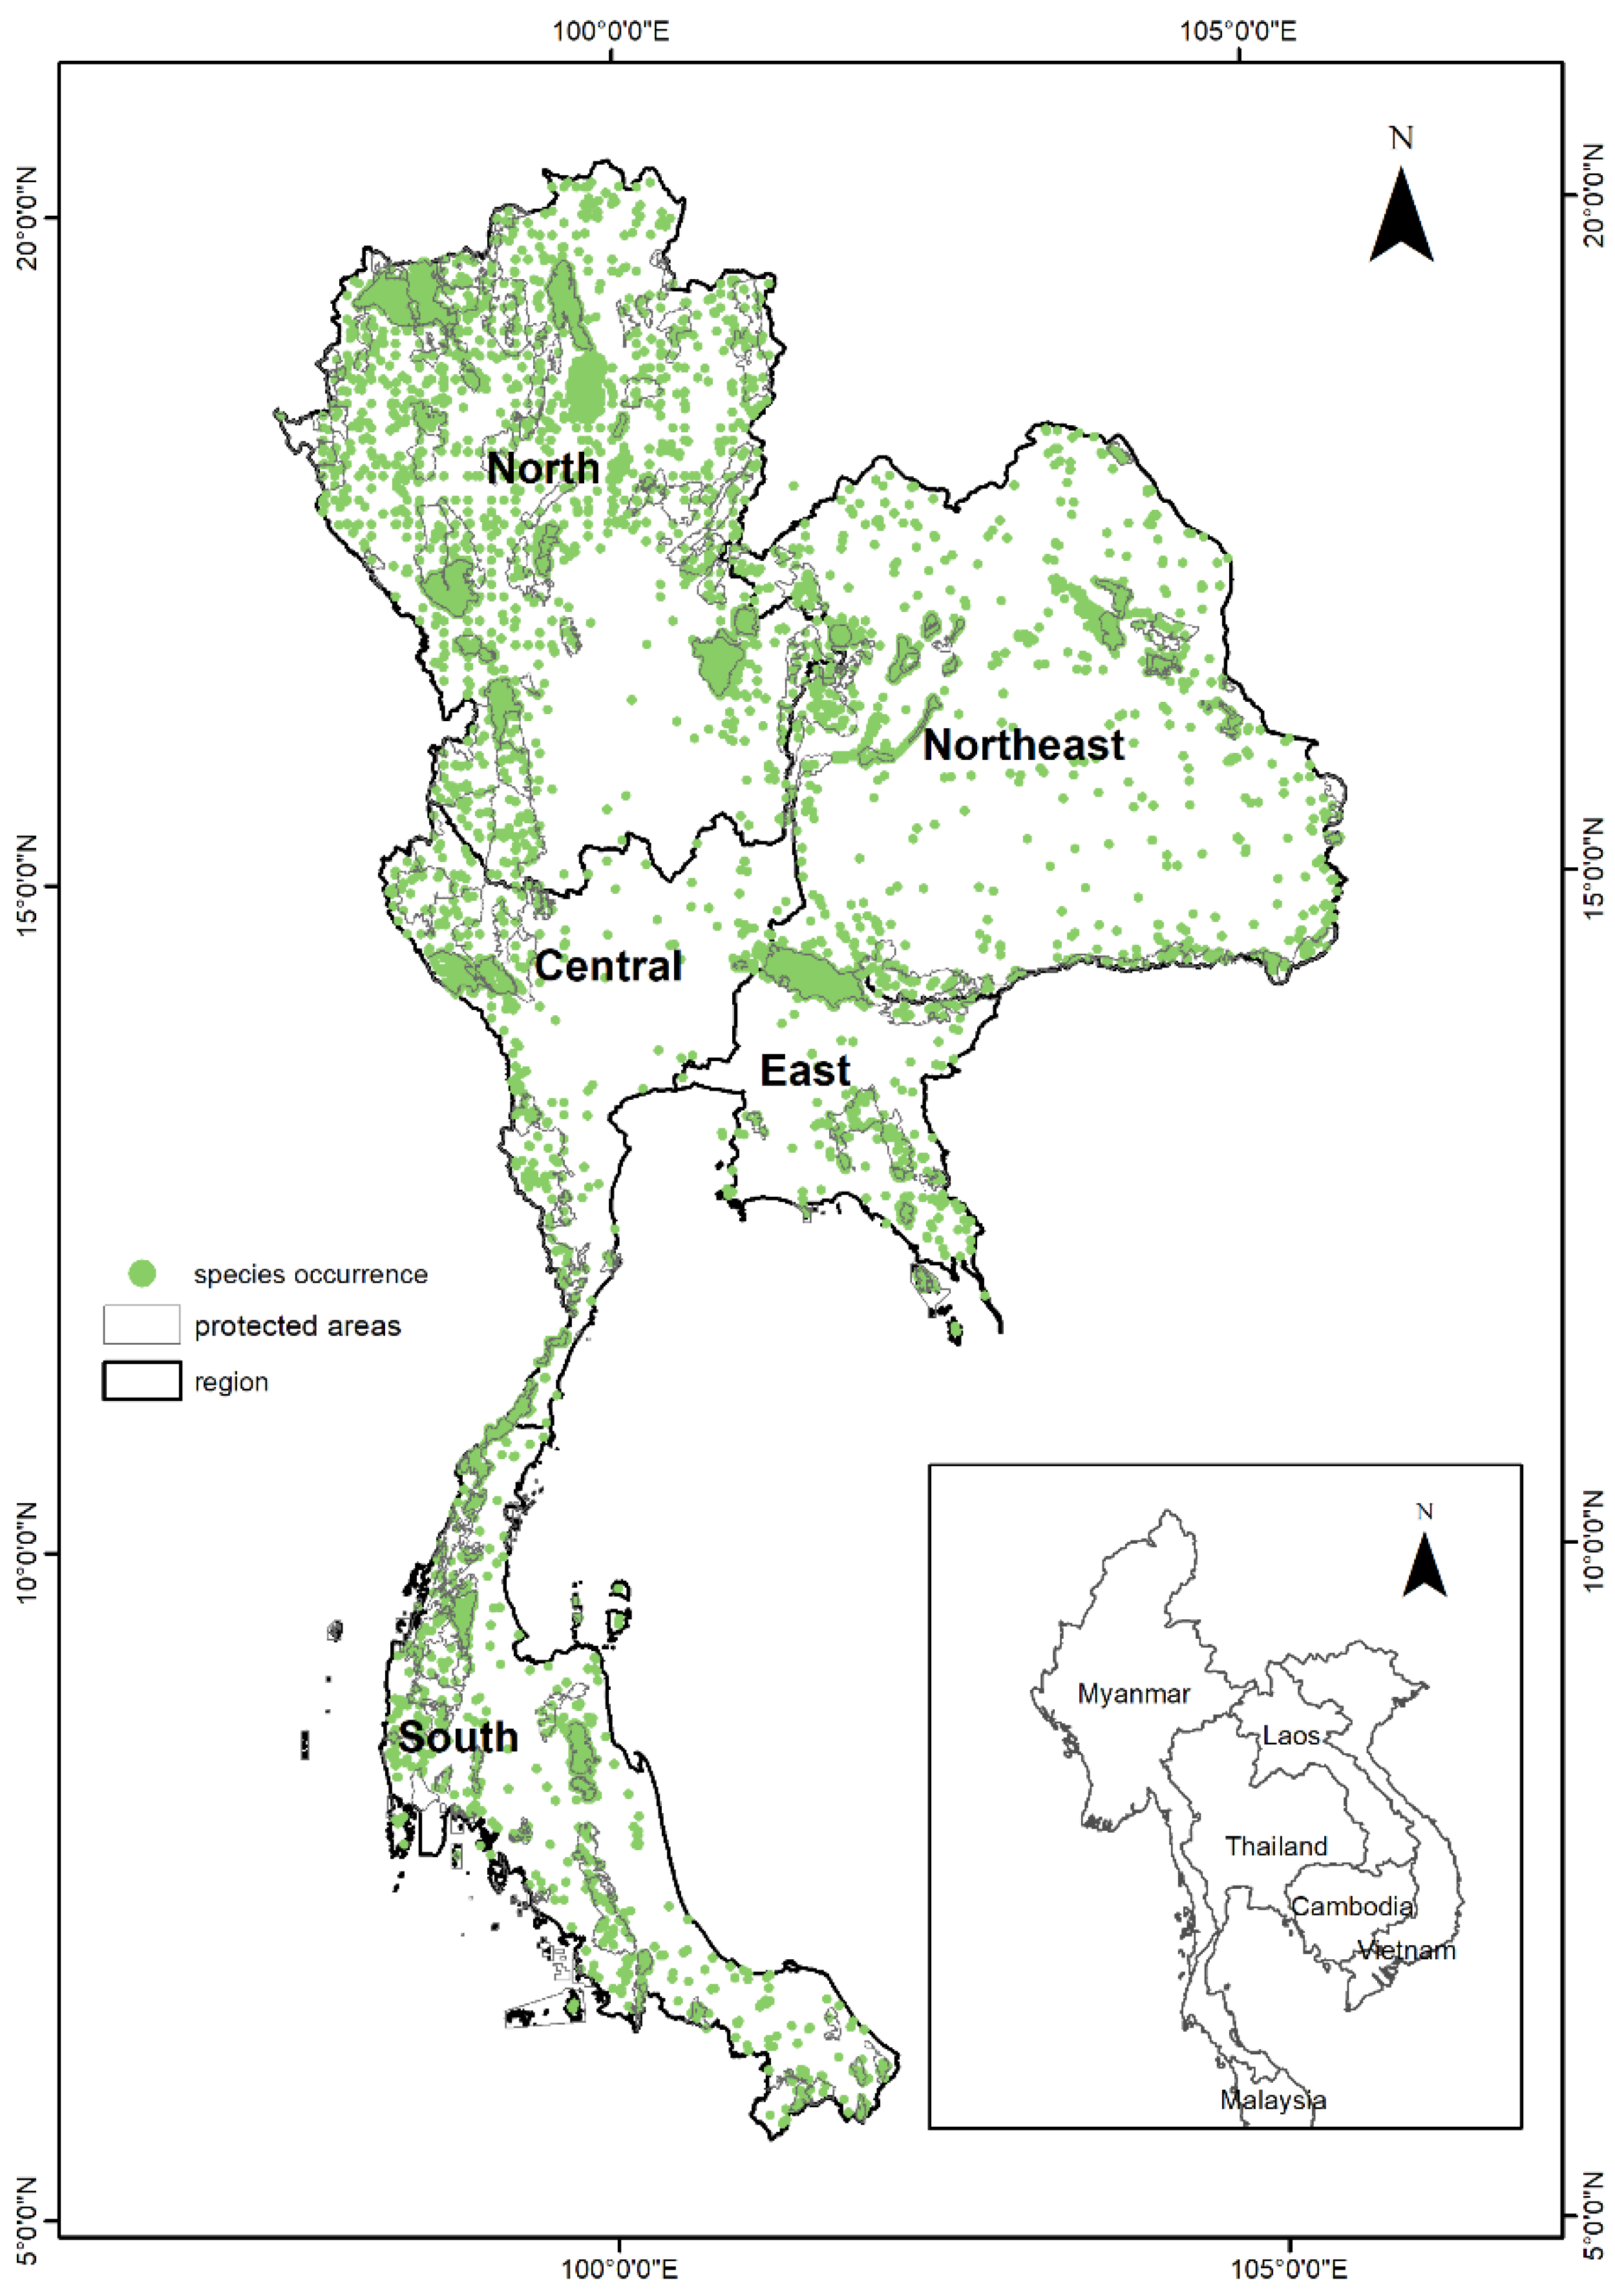
Thailand is located in the middle of mainland SEA between latitude 5°27′ and 20°27′ N and longitude 97°27′ and 105°37′ E, covering 513,115 km2 (“https://www.countryreports.org/country/Thailand/geography.htm (accessed on 19 September 2023)”; Figure 1). The topography in the north of the country is composed of high mountains along the borders with Myanmar and Lao PDR. The central plain is a lowland area comprised of alluvial deposits; therefore, it has deep and fertile soils. The geography of eastern Thailand is characterized by short mountain ranges, while the western region is characterized by high mountains and steep river valleys (Figure S2). The northeastern section of the country, located on the Khorat Plateau, has gently rolling low hills and shallow lakes. Plants in this region experience seasonal water deficit due to the monsoon cycle and sandy soil. Peninsular Thailand is an extension of the western mountains from the north, with the western coast more rugged than the eastern coast of the peninsula. The climate of Thailand is tropical and mainly influenced by two seasonal monsoon systems: the southwest monsoon and the northeast monsoon. Based on the 1981–2010 climatic data record in Thailand (Thai Meteorological Department n.d.), the mean annual temperature ranges from 23 °C in winter to 29 °C in summer (Figure S3) and average annual rainfall ranges from 1200–1600 mm (Figure S4). Highest rainfall is observed in the eastern region of the country mainland and western coast of the Peninsula, due to their location in the windward side.
The process of defining and mapping floristic regions comprised four main steps: (1) species selection, (2) acquisition and selection of explanatory environmental variables, (3) generating of distributions, (4) clustering of floristic or phyto-geographic regions. They are described as follows:
2.2. Species Selection
The localities of tree occurrence data were primarily obtained from the systematically fixed plots ranging from 2.5 km × 2.5 km to 20 km × 20 km implemented by the Department of National Parks, Wildlife and Plant Conservation [49].
It should be noted that the inventory data were limited in the three southernmost provinces as the result of security concerns. To minimize the problem of insufficient presence points data in the southern range limits and along the national borders, the study area extends 30 km beyond the national boundary. In addition, plant distribution data obtained from the Global Biodiversity Information Facility (GBIF: “https://www.gbif.org/ (accessed on 12 February 2022)”, the Botanical Information and Ecology Network (BIEN: http://bien.nceas.ucsb.edu/bien/ (accessed on 29 March 2022)”), and specimen data from the Bangkok Forest Herbarium were incorporated in the species distribution models (SDMs).
To address the sampling bias in species occurrence data resulted from the different systematically inventory plots [49], we filtered the spatially auto-correlated occurrence records at 10 km2 using the SDM tool [50] to reduce overfitting in ecological niche models [27] at the landscape level. These clustered areas of high sample density were not the result ecological factors, but were a result of the intensive systematically fixed plots of 2.5 km × 2.5 km in some protected areas. This spatial thinning procedure avoids the spatially auto-correlated occurrence records [51]. In addition, candidate tree species for distribution modeling were required to have a minimum of 20 occurrence records in total to be sufficient for generating species distribution models and testing the model performance [35,52,53,54].
2.3. Environmental Variables
Environmental variables that directly or indirectly affect the patterns of forest tree distribution within the landscape were selected and geo-processed to a consistent grid for modeling. Non-climatic variables include topography, geology, soil properties, climate, and forest type. Topographic (altitude and slope) and climatic variable were continuous numerical data, while forest type, soil taxonomy, and geology were categorical data. Topographic variables were obtained from Shuttle Radar Topography Mission—(SRTM). Geology type was derived from Thailand’s Mineral Resources Department, while forest type was given by the Thailand Royal Forest Department (RFD) [10]. Soil properties, including soil organic carbon (g kg−1), soil pH, sand, silt, and clay fraction (%), bulk density (kg m−3), coarse fragments (%), soil organic carbon stock (t ha−1), and depth to bedrock (cm), as well as USDA soil taxonomy orders were obtained from Harmonized world soil database (version 1.2) [55]. The spatial resolution of topography, soil properties, and climate are 30 s or roughly 927 m, while map scales of forest type and geology type are 1:25,000 and 1:250,000. All environmental variables were converted to grid of 1 km resolution for species distribution modeling at the national level.
The 19 bioclimatic variables (BIO) developed from monthly rainfall (precipitation) and monthly temperature represent biologically meaningful characteristics of climate in addition to mean annual temperature and annual precipitation (Table 1). We obtained the bioclimatic variables at present (averaged over 30 years 1970–2000 version 2.1) and in 2050 (averaged over 20 years [2041–2060]) from WorldClim (“https://www.worldclim.org/ (accessed on 5 January 2022)”. Three projected climate scenarios were selected for this analysis including very high (SSP5-8.5), high (SSP3-7.0), and intermediate greenhouse gas (GHG) emissions (SSP2-4.5)—all of which were generated from the Coupled Model Intercomparison Project Phase 6 (CMIP6) of the World Climate Research Program [17]. A scenario with very low and low GHG emissions and CO2 emissions declining to net zero around or after 2050, followed by varying levels of net negative CO2 emissions (SSP1-2.6), is unlikely to occur in in the Mekong Region [24] and therefore was not chose for this analysis. CMIP6-era models include new and better representation of physical, chemical and biological processes, as well as higher resolution, compared to CMIP5 [17]. They also show a higher average climate sensitivity than CMIP5 models used in the previous reports. The projected climatic data were modeled with the Canadian Earth System Model version 5 (CanESM5) [56]. CanESM5 was selected because it exhibits good performance in the region and well captures the observed annual precipitation cycle [57].
All bioclimatic and topographic variables were evaluated for collinearity using Pearson’s correlation analysis to limit highly correlated or colinear variables in the analysis [58]. If any pair of variables had correlation greater than 0.8, one variable (less meaningful) was removed in the distribution modeling [35].
2.4. Generation of Species Distribution
The maximum entropy method (Maxent) was used to generate species distribution [59] because it is well suited for presence-only occurrence data. The occurrence data of selected tree species (>20 records) were sub-divided into two datasets. Seventy-five percent of the occurrence data were used to generate species distribution models, while the remaining 25% were used as independent data for the performance assessment [60].
We used a default Maxent setting of 10,000 background points [59] to execute Maxent for 10 replications to avoid sampling errors and to obtain stable patterns. The Maxent outputs are the continuous probability of the model species, ranging between 0.0–1.0. The percentage contribution of each environmental variable to species distribution was also obtained. It is often more practical in conservation and environmental management practice to transform the continuous probability maps binary presence/absence projections [60]. There are many approaches to determining the threshold to use in producing a binary range map. In this study, we evaluated five threshold values, namely a maximum training sensitivity plus specificity, 10 percentile training presence thresholds, equal training sensitivity and specificity, equal test sensitivity and specificity, and maximum test sensitivity plus specificity [35,38,61]. The presence–absence map that yields the highest accuracy as evaluated by the confusion matrix was chosen for binary classification. Future distributions were generated using the projected climatic variables in 2050, while other variables were treated as stable. In addition, the binary distributions of all 201 species were superimposed and reclassed into five richness classes in current climate and in all future climate change scenarios. These classes were ‘none’ (0 species), ‘low richness’ (1–50 species), ‘moderate richness’ (51–100 species), ‘high richness’ (101–150 species), and ‘very high richness’ (151–201 species).
2.5. Clustering Floristic Regions Based on SDMs
Cluster analysis was used to group each individual grid cells’ species composition, derived from the projected presences–absence maps of the 201 species (current and future climatic conditions). The projected presence and absence maps of the 201 target species were grouped using R statistical software (ver 4.1.0) and particularly the ‘terra’ (ver 1.5–21) and ‘cluster’ (ver 2.1.2).
We used Ward’s method of hierarchical cluster analysis with a flexible beta (β = −0.25) method and squared Euclidean distance to perform cluster analyses on the projected present-absence of plant species at the current time and in the future. This method was chosen to minimize the within-cluster differences and to avoid problems with chaining of the observations found in the single linkage method. Up to 20 potential clusters were explored, and the optimum number of clusters (floristic regions) was determined using agglomeration coefficient [62]. Small coefficients indicate more homogeneous clusters, thus no further separation. Furthermore, we evaluated the presence of modeled species found in each cluster group at the current and in the future scenarios to assess change in species composition (Supplement Materials). The defined clusters were also compared with the forest-type map [10] and 15 defined WWF eco-regions found in Thailand [47].
3. Results
3.1. Candidate Tree Species for Modeling
Based on the combined systematic inventory data [49], whole distribution data (GBIF, BIEN and specimen data from the Bangkok Forest Herbarium) and additional surveys, there were 64,554 records available belonging to 157 families, 679 genera and 2000 species or 14% of the total described species in Thailand [63]. The dominant families were Rubiceae, Fabaceae, Euphobiaceae, Annonaceae, Rutaceae, Lauraceae, Phyllanthaceae, Dipterocarpaceae, and Rutaceae, they had more than 2000 occurrences. High occurrence density per species was observed for Rutaceae, Lamiaceae, Salicaceae, Pentaphylacaceae, and Dipterocarpaceae. The most abundant species was Pterocarpus macrocarpus of the Fabaceae family, for which more than 800 occurrences were recorded, followed by Canarium subulatum of the Burseraceae family (700 occurrences), Tectona grandis of the Lamiacea family (661 occurrences), Xylia xylocarpa var. kerri, Facility Fabaceae (616 occurrences), Shorea siamensis (559 occurrences), and S. obtusa (544 occurrences) of the Dipterocarpaceae family. In contrast, 475 species had only one occurrence record e.g., Rinorea hornei, Dendrocnide stimulans, and Enkleia malaccensis.
Dense occurrence records were found in protected areas, with markedly less concentrated occurrence data outside protected areas (Figure 1). Moreover, there were fewer plots distributed in the northeast and the central of Thailand, due to the survey only having been conducted in forest areas and remnant forests remaining in these regions. In addition, few records were observed in the three southernmost provinces due to a lack of inventory data for security reasons. Based on the pre-established criterion of modeled species having occurrence data comprising more than 20 records for distribution modeling, 201 species belonging to 56 families and 134 genera were ultimately selected. Among the total modeled species, 106 species are classified as deciduous species, 72 species are evergreen, and 23 species are semi-deciduous or semi-evergreen.
3.2. Selected Environmental Variables and Their Contributions
The results of the Pearson’s correlation analysis showed that eight bioclimatic variables were highly correlated (r values > 0.8), including (1) mean diurnal range, (2) isothermality, (3) temperature seasonality, (4) maximum temperature of warmest month, (5) minimum temperature of coldest month, (6) precipitation of wettest month, (7) precipitation of driest month, and Precipitation of driest quarter. Therefore, they were excluded from distribution modeling. Altitude had a very high correlation with annual mean temperature (−0.96) but low to moderate correlation with other temperature variables. In addition, it was negatively and highly correlated (r values > 0.84) with mean temperatures of the wettest, driest, warmest, and coldest quarters. Therefore, the remaining 10 bioclimatic variables (annual mean temperature, mean temperatures of the wettest quarter, mean temperature of driest quarter, mean temperature of warmest quarter, mean temperature of coldest quarter, annual precipitation, precipitation of wettest quarter, precipitation of driest quarter, precipitation of warmest quarter, precipitation of coldest quarter), geology, soil properties, forest types, and topographic variables were then selected as the input variables in the Maxent model.
Altitude (16.2%), geology (15.1%), forest type (13.4%), and slope (12.4%) were identified as the strongest variables for the selected plant distribution at the landscape level. In addition, among the 10 selected bioclimatic variables (BIO), precipitation of wettest quarter (BIO16: 4.4%), precipitation of coldest quarter (BIO19: 8.3%), mean temperature of the coldest quarter bio11 (2%), the precipitation of driest quarter (BIO17: 2.5%) were moderate contributors. The remaining bioclimatic variables had comparatively low contributions (Figure 2). However, the relative contribution of these variables differed widely among the selected species. For example, the contribution of altitude for Castanopsis tribuloides was 65%, but it contributed 0% for 30 species or about 15% of all target species.
The Maxent models derived from the training dataset showed good to excellent performance for defining the distributions of all selected plant species. The AUC values varied from 0.70 (Lophopetalum duperreanum) to 0.98 (Monoon membranifolium) with the average value of 0.90. The continuous logistic values derived from the Maxent model were reclassified into a binary prediction using the five chosen threshold values based on the model performance. The results show that the 10-percentile training presence (10P) generated the highest accuracy for 93 species, or 46% of total species used, followed by equal training sensitivity and specificity (45 species), maximum training sensitivity plus specificity (35 species), equal test sensitivity and specificity (20 species), and the maximum test sensitivity and specificity (8 species).
3.3. Projected Species Ranges
The results of Maxent models for 201 plant species indicated that the maximum extent of occurrence at current is projected for Dipterocarpus obtusifolius and Lophopetalum duperreanum, covering 34% of the country area (Figure S5). In addition, eight species have a projected geographical extent greater than 20% of the study area. These species are Gluta glabra, Artocarpus nitidus, Shorea roxburghii, Magnolia baillonii, Chukrasia tabularis, Wrightia pubescens, and Crypteronia paniculate – all of which are classified as common species [63]. In contrast, 37 species have suitable habitats in less than 5% of the study area and the minimum range is projected for Ardisia sanguinolenta var. sanguinolenta, covering less than 1%.
3.4. Changes in Suitable Range for the Modeled Species
Under SSP2-4.5 and SSP3-7.0 scenarios, 85 species or 42% of modeled plant species are projected to decline in the extent of their current suitable habitats. However, only a few species would lose more than 20% of their current habitats. For example, a significant decline is suitable range is projected for Garcinia cowa in which more than 80% of its habitat is projected to become unsuitable. In addition, about 100 species or 41% are projected to gain suitable range, while about 10% of all target species would have similar extents. The model results indicated that 18 species would gain more than 30% of their current distribution range (e.g., Careya arborea, Careya arborea, Helicia nilagirica) under SSP3-7.0 and increase to 20 species under SSP2-4.5.
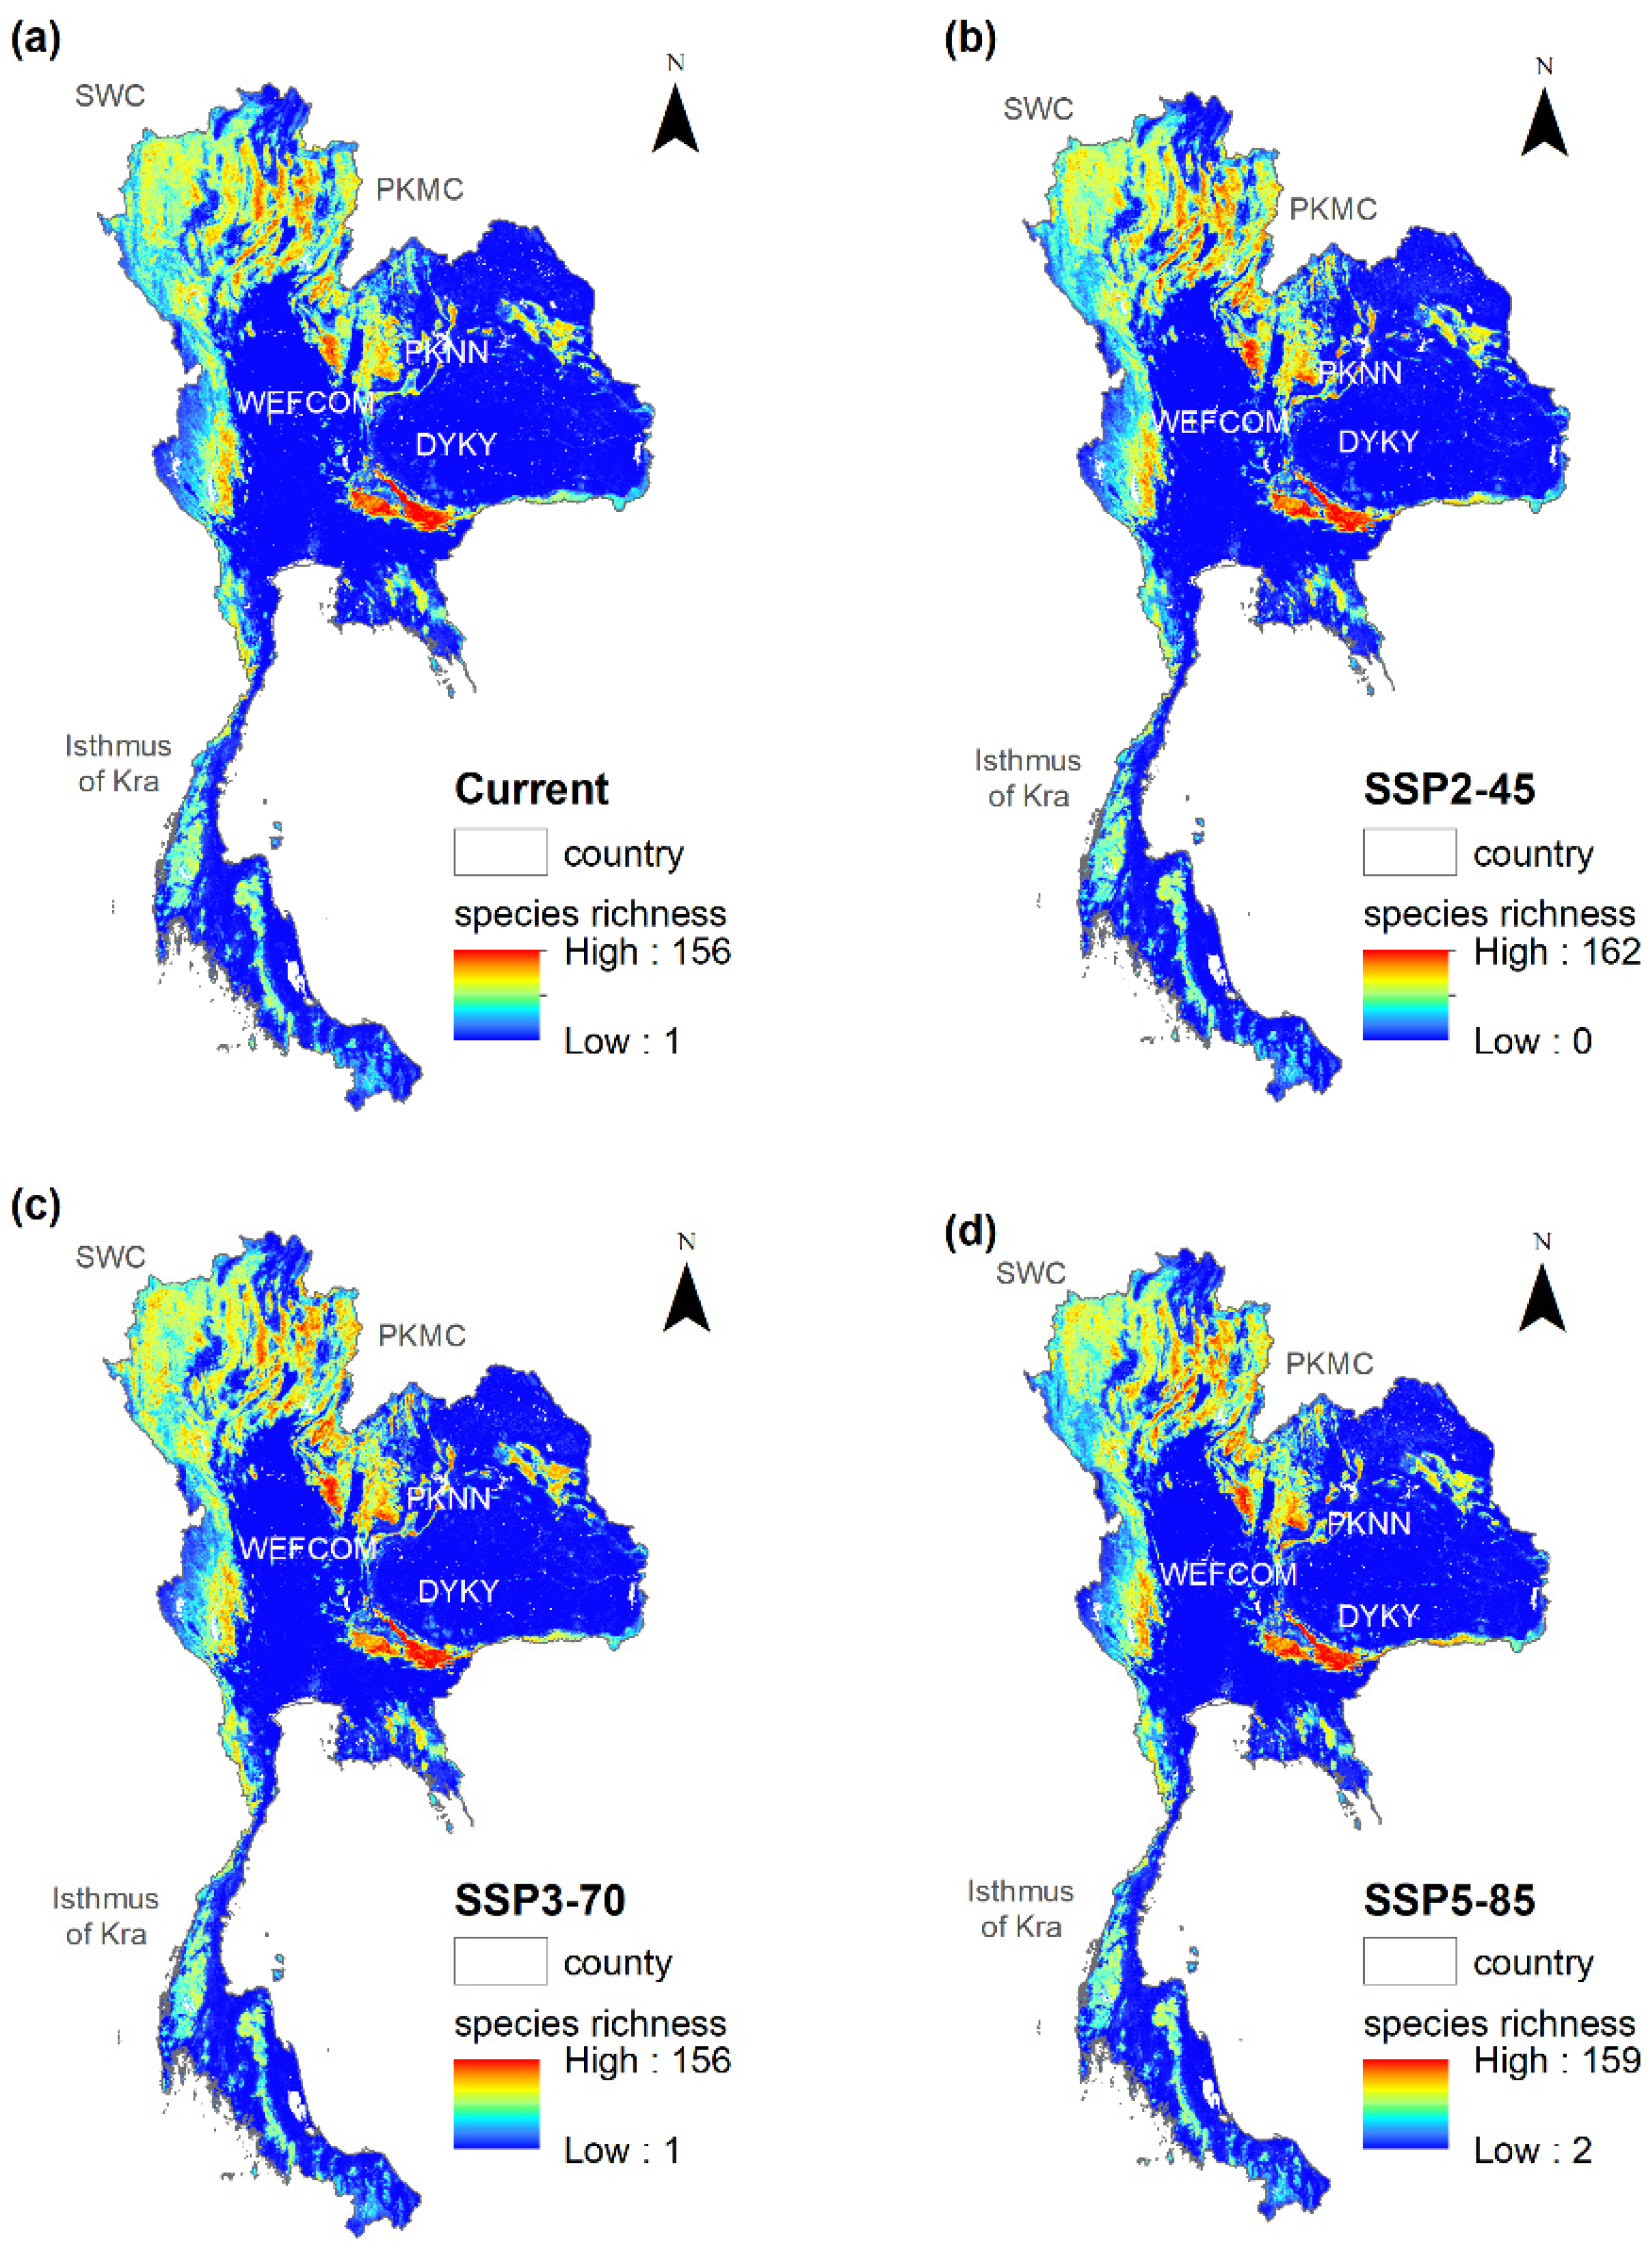
About 56% of modeled species (114 species) are projected to lose all currently suitable range under SSP5-8.5 scenario in 2050. Additionally the number of the species that were projected to gain additional suitable habitats under SSP5-8.5 scenario is also the lowest among scenarios – 86 species as compared to f102 species under SSP3-7.0 and 110 species under SSP2-4.5 in 2050.The areas with species richness are at the current and in the future under projected climate change show similar patterns. They are concentrated in the Central (Dong Phayayen-Khao Yai Complex: DYKY), West (Western Forest Complex: WEFCOM), North (Phu Kha-Mae Chaem Complex: PKMC), and Northeast (Phu Khieo-Nam Nao Complex: PKNN) (Figure 3). The maximum number of species in a grid cell increases from 151 species at the current to 162 species under SSP3-7.0. However, the areas within high (100–150 species) and very high species richness (151–200 species) are likely to increase from 3.1% of the country land area to 4.3%, 4.0% and 4.6% under SSP2-4.5, SSP3-7.0 and SSP5-8.5, respectively. In addition, high concentration areas in the north (Salawin Complex: SWC) are likely to shift from the west toward the east. Lastly, the areas projected as non-suitable for all target species will increase from 21% at the current to 75% under the SSP5-8.5 scenario.
3.5. Potential Floristic Regions
Based on the optimal number of cluster groups using the agglomeration coefficient, floristic regions in Thailand can be divided into 12 regions, excluding agricultural and built-up areas (identified as cluster 1). The geographical distributions of the 12 regions are presented in Figure 4. Cluster 1 is simple, defined as non-forest area (agricultural and built-up areas) associated with remnant forests, covering about two-third of the study area or 78% (Table 2) and widespread across the country.
Cluster 2 is recognized as seasonal evergreen forest or dry evergreen forest, covering approximately 10% of the country land area. It is dominant in the west, north of Thailand. Small remnants are projected along the Cambodian borders. Floristic regions in the northern and northeastern regions are more complex due to heterogeneous topographic features and climatic conditions. Three floristic regions or clusters were projected, including clusters 3, 4, and 5. Cluster 3 is scattered throughout the mountain forest of the upper northern Thailand (SWC), covering 4.5%. It is associated with mixed deciduous forest, especially teak (Tectona grandis). Cluster 4 is ranked third (approximately 7%) after cluster 0 and combined clusters 1 and 3. It is widespread in western and in the northern Thailand (Tenasserim range or Western Forest Complex). This cluster is mainly associated and recognized as moist dry evergreen forest. Cluster 5 is scattered in northern Thailand along the border with Laos (Phu Kha-Mae Chaem) and in northeast Thailand. It is influenced by the Indo-Chinese flora. Typical vegetation types include deciduous species found in dry dipterocarp forest and partially lower montane forest such as Gmelina arborea, Dolichandrone serrulata, Shorea gratissima, Pometia pinnata and Canarium denticulatum, where Pinus mekusii is detected at higher elevations.
Peninsular Thailand is split into two distinct floristic regions (clusters 7 and 12). Cluster 7 is recognized as Peninsular Wet Seasonal Evergreen Dipterocarp Forest [45], found in the norther part of the peninsular and eastern Thailand. The remaining area of cluster 7 is less than 1% due to huge conversion to rubber and oil palm plantation [10]. Dominant species include Anneslea fragrans, Parkia speciosa, Dipterocarpus baudii, and Hopea pierrei. Cluster 12 is restricted in the southern part below Isthmus of Kra at 10 degree north latitude, covering 1.87%. Dominant species found in cluster 12 include Parashorea stellate, Dipterocarpus kerrii, Parkia sumatrana subsp. streptocarpa, and Shorea gratissima.
Besides cluster 5, northeast Thailand also comprises additional three main floristic regions or clusters (9, 10 and 11). Cluster 9 is distinctly and entirely located in Khao Yai National Park, which is a part of Dong Phrayayen-Khao Yai. It covers approximately 0.9% of the country land area. This floristic region is influenced by the Central and Southern Indo-Chinese flora and dominated by members of the Dipterocarpaceae family such as Dipterocarpus obtusifolius, D. alatus, D.tuberculatus, Shorea obtusa, and S. siamensis. Cluster 10 is widespread in the Korat plateau, especially in the Dong Phrayayen-Khao Yai, which covers 1.3% of the country area. It contains 123 species, which is the highest among the 12 clusters (Figure 3). Cluster 11 is mainly distributed in the northeast and only small remnants remain. It covers an area of 1.9% of the country. The remaining clusters encompass small percentages of the country and are scattered in the northeast and north regions of Thailand.
The remaining clusters encompass small percentages of the country and scattered in the northeast and north of Thailand. For example, cluster 8 is scattered in the mountain forest of the upper northern Thailand. This cluster is dominated by species found in mountain temperate forest associated with pine forest, which are influenced by Indo-Burmese flora [46].
Among the 201 species, Shorea roxburghii and Afzelia xylocarpa are found most of the defined cluster, except clusters 1 and 3, and cluster 11, respectively. In contrast, 17 species such as Mallotus philippensis, Sterculia pexa, Careya arborea, S. gratissima, Callicarpa arborea, Quercus brandisiana are recognized as indicator species for each cluster. This is due to them being present in only one designed cluster. For example, Mallotus philippensis only present in cluster 1, while Sterculia pexa is only projected in cluster 10.
3.6. Changes in Habitat of Individual Potential Floristic Regions
The future climatic conditions would make changes in plant composition and alter the extent of floristic regions (clusters) due to gaining or losing extent of suitable range. The projected SSP2-4.5 climate scenario favors floristic regions 2, 5, 6, 10, 11, and 12, especially the floristic regions in which the extent of occurrences would increase from 2.57% (floristic region 2) to 19% for floristic region 5. However, substantial losses are projected for the floristic regions 7 (−11.20), 8 (−11.60%), and 9 (−21.40%) (Table 2, Figure S6). The patterns of geographical change under SSP3-7.0 and SSP5-8.5 are similar, but SSP2-4.5 favors floristic region 5, while SSP5-85 supports floristic regions 8 and 10. Approximately, 42% of floristic region 7 is projected to be transferred to other regions under the SSP2-4.5. The Sankey transition plots (Figure S6) shows that about 50% of floristic region 9 can remain in the same area, the rest will be transferred to floristic regions 5 and 10. Meanwhile, about 60% of floristic regions 6, 7, and 8 can persist in the same locations. Under SSP3-7.0, about 50% of current extents of floristic regions 6 and 7 will be transferred to other floristic regions. The projected climatic data on SSP5-8.5 indicate similar transformation patterns of floristic regions.
4. Discussion
4.1. How Do Tropical Tree Species in Thailand Spatially Response to Future Climate Change?
To our knowledge, this is the first attempt to evaluate the climate change impact using high resolution of CMIP6 dataset [17] on plant species distributions and floristic regions in the Mekong region. We were able to produce distribution models for 201 terrestrial plant species under three scenarios of change out of the over 2000 species with occurrence records in the database. Scenarios of change included very high (SSP5-8.5), high (SSP3-7.0), and intermediate GHG emissions (SSP2-4.5) to cover a range of possible future climate trajectories in the region.
The vulnerability of tropical tree species to the three future climate data projections, varies among tree species. The modeled results showed that 89% of the modeled deciduous species, 61% of modeled evergreen species, and 74% of the modeled semi-deciduous or semi-evergreen species would experience >30% change in distribution relative to their current range. This result is consistent with previous studies conducted in northern Thailand using CMIP3 era projections including the HadCM3A2 scenario [38] and in Peninsular Thailand using the HadCM3 B2a scenario [35]. Under both scenarios, the mean annual temperature is projected to increase by more than 2 °C by 2050 [64]. Greater impacts in terms of loss of suitable habitats and shifts in distribution were projected under the SSP5-8.5 scenario, where annual mean temperature would increase 2.7 °C, the maximum temperature of the warmest month and the minimum temperature of the coldest month would increase by 3.4 °C and 3.5 °C by 2050, respectively (Table 1). This projected temperature increase is far in excess of the Paris Agreement goal of 1.5 °C [65] and is beyond the tipping point at which many plant species are able to adapt and would have substantial impacts on tropical plant species and/or vegetation communities.
Some plant species may be more resilient to projected climate change due to plasticity in facing recurrent drought conditions and then enhanced growth rates, and recovery when favorable conditions return. However, many of the species, in particular, Dipterocarps, which are a dominant family of species modeled in this study (10% of all species) are comparatively recalcitrant and are not expected to demonstrate plasticity to warming/drought conditions [66,67,68,69].
4.2. How Many Optimum Floristic Regions Can Be Delineated in Thailand Based on the Current Species Distribution?
Seven floristic regions in Thailand were previously defined using administration boundary [46]. These regions include the (1) Northern Region, (2) North-Eastern Region, (3) Eastern Region, (4) South-Western Region, (5) Central Region, (6) South-Eastern Region, and (7) Peninsular Region [46]. In addition, WWF Global 200 eco-regions recently defined 15 eco-regions in Thailand based on biomes and biogeographic realms [47,70].
Based on quantitative analysis and projected species distribution modeling [59] of 201 species, we can define 12 potential floristic regions. Our results are a data-driven alternative to the previous phyto-geographic regions, which were delineated by using the administration boundary and expert judgments [46]. All defined clusters are related to terrestrial floristic region, with freshwater and estuary/marine floristic regions lacking sufficient observation data to model distributions in this study [44,49]. Moreover, there may be gaps in observations/sampling density resulting from limited accessibility to the remote areas along the national boundaries due to rugged terrain and security issues.
4.3. Which Floristic Regions Are Vulnerable to Climate Change?
More than 80% of the distribution of floristic regions 1, 2, 4, 10, and 12 would remain stable under the three scenarios of the CMIP6 dataset used in this study. Floristic regions 5, 8, 10, and 12 would benefit from increased rainfall (SSP3-7.0 and SSP5-8.5), especially in the west parts of the country. In contrast, floristic regions 6, 7, and 9 are projected to lose more than 40% of their current distribution. Although average annual precipitation is projected to increase by 120 mm (SSP2-4.5 and SPP5-8.5) and 35 mm (SSP3-7.0) (Table 1), the rainfall increases are predominantly limited to dry months and are concurrent with projected increases in temperature. This seasonal timing of the projected changes in climate will have negative impacts on evergreen species associated with floristic regions 7 and 9 found in the Peninsular and the Dong Phayayen-Khao Yai Complex, respectively. The centroid of clusters 3, 5, 10, and 11 (dry evergreen forests) are projected to move to lower altitudes, potentially responding to greater moisture content during the dry months. In contrast, the remaining clusters associated with deciduous forests are projected to move towards higher altitudes and compete with or supplant evergreen floristic regions. These results are consistent with previous studies in the region, which have shown that extremely hot and moist, extremely hot and xeric, and extremely hot and mesic climate classifications would expand in the Lower Mekong Sub-region [24] and in Yunnan, China [28], and the expansion of forests and treeless vegetation in tropical and subtropical Americas [28], while there is a substantial decrease predicted in the warm temperate/mesic bioclimatic zone.
4.4. Conservation Implications
A collection of government policies at national [48], regional [13], and international [71] levels enhance efforts to conserve biodiversity and protect vulnerable areas affected by underlying climate and non-climate drivers. For example, the Target 3 of the Kunming-Montreal Global Biodiversity Framework (GBF) agreed on at the 15th COP to the UN Convention on Biological Diversity [72] called members to increase protected areas from the 17% of the planet mentioned in the Aichi target to at least 30% of the planet by 2030 through a well-connected and effective system of protected areas and through other effective land-based conservation measures [70].
The existing protected areas in Thailand, such as national parks and wildlife sanctuaries, cover more than 21% of the country land area, which is greater than the 17% defined in the CBD Aichi target 11 by 2020. However, the current protected areas are largely located at higher elevations and do not well represent all natural ecosystems of Thailand. In addition, the protected area network is also highly fragmented [70]. Presently, more than 90% of floristic regions 7, 8, 9, and 10 are located inside protected areas. However, the projections of climate change (SSP5-85) decrease the representation of floristic region 10. The model results of this study also suggest that a half of floristic region 4 and less than a half of regions 6, 1, and 3 are located inside protected areas, and their representations in the future under all scenarios are projected to decline (Table 2 and Figure S7). This is due to their shift distributions to more suitable locations in the future, while the boundaries of protected areas are static.
The Thai Government aims to increase protected area coverage to 25% and potentially may consider expanding to meet the proposed area target of 30% through a well-connected and effective system of protected areas and through other effective land-based conservation measures [70] by 2030 as mentioned in the CBD’s Kunming-Montreal GBF targets (www.cbd.int/sp/targets/). It is strongly recommended that future protected area expansion should address unrepresented ecoregions and the climatically vulnerable floristic regions suggested by this study.
5. Conclusions
This research evaluates the impacts of three scenarios of climate forcing and socio-economic development (SSP2-4.5, SSP3-7.0 and SSP5-8.5) generated from the CMIP6. Based on the occurrence data gathered from systematic forest inventory plots and global database, 201 candidate tree species were selected for distribution modeling. The results of vegetation community cluster analysis revealed 12 potential floristic regions under the current and future scenarios of climate chage, excluding non-nature areas, covering 67% of the country area. Floristic regions in Peninsular Thailand, and central, western, and eastern Thailand are quite distinct, but they are complex in the north because of heterogenous topography and variation of climatic conditions. The cluster analysis of the projected species distributions for the year 2050 show substantial changes. Five floristic regions (1, 2, 4, 10 and 12) would maintain their distributions in the same areas while the remaining regions would shift from the current more than 40% of their current extents. In addition, the composition of indicator species for most floristic regions are projected to change from the current conditions. At present, floristic regions 5–10 account for less than 2% of the country area for each region. In addition, approximately 50% of floristic regions 4 and 6 are located inside protected areas, and they are likely to be less represented in the future. Therefore, the expansion of Thailand’s protected areas to achieve the Kunming-Montreal Global Biodiversity Framework by 2030 should address the unrepresented species and floristic regions, which are vulnerable to climate change.
Supplementary Materials
The following supporting information can be downloaded at: https://www.mdpi.com/article/10.3390/d15101087/s1, Figure S1: Seven floristic regions of Thailand; Figure S2: Topography of Thailand; Figure S3: Current and predicted annual mean temperature; Figure S4: Current and predicted annual precipitation; Figure S5 Predicted distribution of Lophopetalum duperreanum at the current; Figure S6: Sankey transition plots of floristic regions between the current and future climatic conditions Note: Excluding non-nature areas; Figure S7: Predicted floristic regions and protected areas; Table S1: Selected species for distribution modeling; Table S2: A matrix of correlation coefficients between each explanation variable; Table S3: Presence of tree species in the floristic regions.
Author Contributions
Conceptualization, Y.T. and P.R.R.; Methodology, Y.T. and P.R.R.; Software, P.R.R.; Validation, Y.T.; Formal Analysis, Y.T. and N.S.; Investigation, P.R.R.; Resources, A.C.; Data Curation, N.S. and A.C.; Writing—Original Draft Preparation, Y.T.; Writing—Review and Editing, P.R.R.; Visualization, Y.T.; Funding Acquisition, Y.T. All authors have read and agreed to the published version of the manuscript.
Funding
The authors extend their appreciation to the Thailand Research Fund (TRF) and the Chinese Academy of Sciebces (CAS) for funding this research project (DBG6080017).
Institutional Review Board Statement
Not applicable.
Informed Consent Statement
Not applicable.
Data Availability Statement
Not applicable.
Acknowledgments
The authors are grateful to the Royal Forest Department (RFD), the Department of National Parks, Wildlife and Plant Conservation (DNP), and the International Tropical Timber Organization (ITTO) for providing the forest tree occurrence dataset.
Conflicts of Interest
The authors declare no conflict of interest.
References
- Murphy, B.P.; Bowman, D. What controls the distribution of tropical forest and savanna? Ecol. Lett. 2012, 15, 748–758. [Google Scholar] [CrossRef]
- Myers, N.; Mittermeier, R.A.; Mittermeier, C.G.; Da Fonseca, G.A.; Kent, J. Biodiversity hotspots for conservation priorities. Nature 2000, 403, 853–858. [Google Scholar] [CrossRef] [PubMed]
- Mitchard, E.T.A. The tropical forest carbon cycle and climate change. Nature 2018, 559, 527–534. [Google Scholar] [CrossRef] [PubMed]
- Qie, L.; Lewis, S.L.; Sullivan, M.J.; Lopez-Gonzalez, G.; Pickavance, G.C.; Sunderland, T.; Ashton, P.; Hubau, W.; Abu Salim, K.; Aiba, S.I.; et al. Long-term carbon sink in Borneo’s forests halted by drought and vulnerable to edge effects. Nat. Commun. 2017, 8, 1966. [Google Scholar] [CrossRef] [PubMed]
- Law, E.A.; Bryan, B.A.; Meijaard, E.; Mallawaarachchi, T.; Struebig, M.J.; Watts, M.E.; Wilson, K.A. Mixed policies give more options in multifunctional tropical forest landscapes. J. Appl. Ecol. 2017, 54, 51–60. [Google Scholar] [CrossRef]
- Curtis, P.G.; Slay, C.M.; Harris, N.L.; Tyukavina, A.; Hansen, M.C. Classifying drivers of global forest loss. Science 2018, 361, 1108–1111. [Google Scholar] [CrossRef] [PubMed]
- Hosonuma, N.; Herold, M.; De Sy, V.; De Fries, R.S.; Brockhaus, M.; Verchot, L.; Romijn, E. An assessment of deforestation and forest degradation drivers in developing countries. Environ. Res. Lett. 2012, 7, 044009. [Google Scholar] [CrossRef]
- Seymour, F.; Harris, N.L. Reducing tropical deforestation. Science 2019, 365, 756–757. [Google Scholar] [CrossRef]
- FAO; UNEP. The State of the World’s Forests 2020; FAO: Rome, Italy; UNEP: Rome, Italy, 2020. [Google Scholar]
- RFD. Forest Statistic Report 2019; Royal Forest Department, Bangkok: Bangkok, Thailand, 2019. [Google Scholar]
- Brando, P.M.; Paolucci, L.; Ummenhofer, C.C.; Ordway, E.M.; Hartmann, H.; Cattau, M.E.; Rattis, L.; Medjibe, V.; Coe, M.T.; Balch, J. Droughts, wildfires, and forest carbon cycling: A pantropical synthesis. Annu. Rev. Earth Planet. Sci. 2019, 47, 555–581. [Google Scholar] [CrossRef]
- Malhi, Y.; Gardner, T.A.; Goldsmith, G.R.; Silman, M.R.; Zelazowski, P. Tropical forests in the Anthropocene. Annu. Rev. Environ. Resour. 2014, 39, 125–159. [Google Scholar] [CrossRef]
- Von Rintelen, K.; Arida, E.; Häuser, C. A review of biodiversity-related issues and challenges in megadiverse Indonesia and other Southeast Asian countries. Res. Ideas Outcomes 2017, 3, e20860. [Google Scholar] [CrossRef]
- Zelazowski, P.; Malhi, Y.; Huntingford, C.; Sitch, S.; Fisher, J.B. Changes in the potential distribution of humid tropical forests on a warmer planet. Philos. Trans. R. Soc. A Math. Phys. Eng. Sci. 2011, 369, 137–160. [Google Scholar] [CrossRef] [PubMed]
- IPCC. Climate Change 2014 Synthesis Report; Intergovernmental Panel on Climate Change (IPCC): Geneva, Switzerland, 2014. [Google Scholar]
- Zebiak, S.E.; Orlove, B.; Muñoz, Á.G.; Vaughan, C.; Hansen, J.; Troy, T.; Thomson, M.C.; Lustig, A.; Garvin, S. Investigating El Niño-Southern Oscillation and society relationships. Wiley Interdisciplinary Reviews. Clim. Chang. 2015, 6, 17–34. [Google Scholar]
- IPCC. Summary for policymakers. In Climate Chang. 2021: The Physical Science Basis; Masson-Delmotte, V., Zhai, P., Pirani, A., Connors, S.L., Péan, C., Berger, S., Caud, N., Chen, Y., Goldfarb, L., Gomis, M.I., et al., Eds.; Contribution of Working Group I to the Sixth Assessment Report of the Intergovernmental Panel on Climate Change; Cambridge University Press: Cambridge, UK, 2021. [Google Scholar]
- Liu, H.; Mi, Z.; Lin, L.I.; Wang, Y.; Zhang, Z.; Zhang, F.; Wang, H.; Liu, L.; Zhu, B.; Cao, G.; et al. Shifting plant species composition in response to climate change stabilizes grassland primary production. Proc. Natl. Acad. Sci. USA 2018, 115, 4051–4056. [Google Scholar] [CrossRef] [PubMed]
- Zhou, Z.Q.; Xie, S.P. Effects of climatological model biases on the projection of tropical climate change. J. Clim. 2015, 28, 9909–9917. [Google Scholar] [CrossRef]
- Aguirre-Gutiérrez, J.; Oliveras, I.; Rifai, S.; Fauset, S.; Adu-Bredu, S.; Affum-Baffoe, K.; Baker, T.R.; Feldpausch, T.R.; Gvozdevaite, A.; Hubau, W.; et al. Drier tropical forests are susceptible to functional changes in response to a long-term drought. Ecol. Lett. 2019, 22, 855–865. [Google Scholar] [CrossRef] [PubMed]
- Bartlett, M.K.; Detto, M.; Pacala, S.W. Predicting shifts in the functional composition of tropical forests under increased drought and CO 2 from trade-offs among plant hydraulic traits. Ecol. Lett. 2019, 22, 67–77. [Google Scholar] [CrossRef]
- Corlett, R.T. The impacts of droughts in tropical forests. Trends Plant Sci. 2016, 21, 584–593. [Google Scholar] [CrossRef] [PubMed]
- Fontes, C.G.; Dawson, T.E.; Jardine, K.; McDowell, N.; Gimenez, B.O.; Anderegg, L.; Negrón-Juárez, R.; Higuchi, N.; Fine, P.V.; Araújo, A.C.; et al. Dry and hot: The hydraulic consequences of a climate change–type drought for Amazonian trees. Philos. Trans. R. Soc. B Biol. Sci. 2018, 373, 20180209. [Google Scholar] [CrossRef] [PubMed]
- Johnston, J.M.; Zomer, R.J.; Wang, M.C. Predicting future vegetated landscapes under climate change: Application of the environmental stratification methodology to protected areas in the Lower Mekong Basin. In Ecosystem-Based Management, Ecosystem Services and Aquatic Biodiversity; O’Higgins, T., Lago, M., DeWitt, T., Eds.; Springer: Cham, Switzerland, 2020. [Google Scholar] [CrossRef]
- Pomoim, N.; Hughes, A.C.; Trisurat, Y.; Corlett, R.T. Vulnerability to climate change of species in protected areas in Thailand. Sci. Rep. 2022, 12, 5705. [Google Scholar] [CrossRef]
- Zomer, R.J.; Trabucco, A.; Wang, M.; Lang, R.; Chen, H.; Metzger, M.J.; Smajgl, A.; Beckschäfer, P.; Xu, J. Environmental stratification to model climate change impacts on biodiversity and rubber production in Xishuangbanna, Yunnan, China. Biol. Conserv. 2014, 170, 264–273. [Google Scholar] [CrossRef]
- Brodie, J.F. Synergistic effects of climate change and agricultural land use on mammals. Front. Ecol. Environ. 2016, 14, 20–26. [Google Scholar] [CrossRef]
- Anadón, J.D.; Sala, O.E.; Maestre, F.T. Climate change will increase savannas at the expense of forests and treeless vegetation in tropical and subtropical Americas. J. Ecol. 2014, 102, 1363–1373. [Google Scholar] [CrossRef]
- Rashid, I.; Romshoo, S.A.; Chaturvedi, R.K.; Ravindranath, N.H.; Sukumar, R.; Jayaraman, M.; Lakshmi, T.V.; Sharma, J. Projected climate change impacts on vegetation distribution over Kashmir Himalayas. Clim. Chang. 2015, 132, 601–613. [Google Scholar] [CrossRef]
- 30 Rehm, E.M.; Olivas, P.; Stroud, J.; Feeley, K.J. Losing your edge: Climate change and the conservation value of range-edge populations. Ecol. Evol. 2015, 5, 4315–4326. [Google Scholar] [CrossRef] [PubMed]
- Fadrique, B.; Báez, S.; Duque, Á.; Malizia, A.; Blundo, C.; Carilla, J.; Osinaga-Acosta, O.; Malizia, L.; Silman, M.; Farfán-Ríos, W.; et al. Widespread but heterogeneous responses of Andean forests to climate change. Nature 2018, 564, 207–212. [Google Scholar] [CrossRef] [PubMed]
- Pecl, G.T.; Araújo, M.B.; Bell, J.D.; Blanchard, J.; Bonebrake, T.C.; Chen, I.C.; Clark, T.D.; Colwell, R.K.; Danielsen, F.; Evengård, B.; et al. Biodiversity redistribution under climate change: Impacts on ecosystems and human well-being. Science 2017, 355, eaai9214. [Google Scholar] [CrossRef] [PubMed]
- Krupnick, G.A. Conservation of tropical plant biodiversity: What have we done, where are we going? Biotropica 2013, 45, 693–708. [Google Scholar] [CrossRef]
- Nicotra, A.B.; Atkin, O.K.; Bonser, S.P.; Davidson, A.M.; Finnegan, E.J.; Mathesius, U.; Poot, P.; Purugganan, M.D.; Richards, C.L.; Valladares, F.; et al. Plant phenotypic plasticity in a changing climate. Trends Plant Sci. 2010, 15, 684–692. [Google Scholar] [CrossRef] [PubMed]
- Trisurat, Y.; Shrestha, R.P.; Kjelgren, R. Plant species vulnerability to climate change in Peninsular Thailand. Appl. Geogr. 2011, 31, 1106–1114. [Google Scholar] [CrossRef]
- Normah, M.N.; Sulong, N.; Reed, B.M. Cryopreservation of shoot tips of recalcitrant and tropical species: Advances and strategies. Cryobiology 2019, 87, 1–14. [Google Scholar] [CrossRef]
- Fernández, A.; León-Lobos, P.; Contreras, S.; Ovalle, J.F.; van der Walt, K.; Ballesteros, D. The potential impacts of climate change on ex situ conservation options for recalcitrant-seeded species. Front. For. Glob. Chang. 2023, 6, 1110431. [Google Scholar] [CrossRef]
- Trisurat, Y.; Alkemade, J.R.M.; Arets, E.J.M.M. Projecting forest tree distributions and adaptation to climate change in northern Thailand. J. Ecol. Nat. Environ. 2009, 1, 55–63. [Google Scholar]
- Van Zonneveld, M.; Koskela, J.; Vinceti, B.; Jarvis, A. Impact of climate change on the distribution of tropical pines in Southeast Asia. Unasylva 2009, 60, 24–28. [Google Scholar]
- Wang, T.; Wang, G.; Innes, J.; Nitschke, C.; Kang, H. Climatic niche models and their consensus projections for future climates for four major forest tree species in the Asia–Pacific region. For. Ecol. Manag. 2016, 360, 357–366. [Google Scholar] [CrossRef]
- Hiura, T.; Go, S.; Iijima, H. Long-term forest dynamics in response to climate change in northern mixed forests in Japan: A 38-year individual-based approach. For. Ecol. Manag. 2019, 449, 117469. [Google Scholar] [CrossRef]
- Takhtadzhi︠a︡n, A.L.; Takhtadzhi︠a︡n, L.A.; Takhtajan, A.; Crovello, T.J. Floristic Regions of the World; University of California Press: Berkeley, CA, USA, 1986. [Google Scholar]
- Middleton, D.J. Progress on the Flora of Thailand. Telopea 2003, 10, 33–42. [Google Scholar] [CrossRef]
- Parnell, J.A.N.; Simpson, D.A.; Moat, J.; Kirkup, D.W.; Chantaranothai, P.; Boyce, P.C.; Bygrave, P.; Dransfield, S.; Jebb, M.H.P.; Macklin, J.; et al. Plant collecting spread and densities: Their potential impact on biogeographical studies in Thailand. J. Biogeogr. 2003, 30, 193–209. [Google Scholar] [CrossRef]
- Santisuk, T.; Smitinand, T.; Hoamuangkaew, W.; Ashton, P.; Sohmer, S.H.; Vincent, J.R. Plants for Our Future: Botanical Research and Conservation Needs in Thailand; Royal Forest Department: Bangkok, Thailand, 1991. [Google Scholar]
- Smitinand, T. The genus Dipterocarpus Gaertn. f. in Thailand. Thai For. Bull. 1980, 4, 1–26. [Google Scholar]
- Dinerstein, E.; Olson, D.; Joshi, A.; Vynne, C.; Burgess, N.D.; Wikramanayake, E.; Hahn, N.; Palminteri, S.; Hedao, P.; Noss, R.; et al. An ecoregion-based approach to protecting half the terrestrial realm. BioScience 2017, 67, 534–545. [Google Scholar] [CrossRef] [PubMed]
- ONEP. Master Plan for Integrated Biodiversity Management B.E. 2558–2564 (2015-2021); Office of Natural Resources and Environmental Policy and Planning, Ministry of Natural Resources and Environment: Bangkok, Thailand, 2016. [Google Scholar]
- Trisurat, Y.; Eiadthong, W.; Khunrattanasiri, W.; Saengnin, S.; Chitechote, A.; Maneerat, S. Systematic forest inventory plots and their contribution to plant distribution and climate change impact studies in Thailand. Ecol. Res. 2020, 35, 724–732. [Google Scholar] [CrossRef]
- Brown, J.L.; Bennett, J.R.; French, C.M. SDMtoolbox 2.0: The next generation Python-based GIS toolkit for landscape genetic, biogeographic and species distribution model analyses. PeerJ 2017, 5, e4095. [Google Scholar] [CrossRef]
- Boria, R.A.; Olson, L.E.; Goodman, S.M.; Anderson, R.P. Spatial filtering to reduce sampling bias can improve the performance of ecological niche models. Ecol. Model. 2014, 275, 73–77. [Google Scholar] [CrossRef]
- Moudrý, V.; Šímová, P. Influence of positional accuracy, sample size and scale on modelling species distributions: A review. Int. J. Geogr. Inf. Sci. 2012, 26, 2083–2095. [Google Scholar] [CrossRef]
- Santini, L.; Benítez-López, A.; Maiorano, L.; Čengić, M.; Huijbregts, M.A. Assessing the reliability of species distribution projections in climate change research. Div. Dist. 2021, 27, 1035–1050. [Google Scholar] [CrossRef]
- .Wisz, M.S.; Guisan, A. Do pseudo-absence selection strategies influence species distribution models and their predictions? An information-theoretic approach based on simulated data. BMC Ecol. 2009, 9, 8. [Google Scholar] [CrossRef] [PubMed]
- FAO. Harmonized World Soil Database, Version 1.2; FAO/IIASA/ISRIC/ISS-CAS/JRC; FAO: Rome, Italy, 2012. [Google Scholar]
- Swart, N.C.; Cole, J.N.S.; Kharin, V.V.; Lazare, M.; Scinocca, J.F.; Gillett, N.P.; Anstey, J.; Arora, V.; Christian, J.R.; Hanna, S.; et al. The Canadian earth system model version 5 (CanESM5.0.3). Geosci. Model Dev. 2019, 12, 4823–4873. [Google Scholar] [CrossRef]
- Yan, Y.; Zhu, C.; Liu, B.; Jiang, S. Annual cycle of East Asian precipitation simulated by CMIP6 Models. Atmosphere 2021, 12, 24. [Google Scholar] [CrossRef]
- Hosmer, D.W.; Lemeshow, S.; Sturdivant, R.X. Introduction to the logistic regression model. In Applied Logistic Regression; Hosmer, D.M., Lemesbhow, S., Eds.; John Wiley & Sons, Inc.: Hoboken, NJ, USA, 2000; pp. 1–30. [Google Scholar]
- Phillips, S.J.; Anderson, R.P.; Schapire, R.E. Maximum entropy modeling of species geographic distributions. Ecol. Model. 2006, 190, 231–259. [Google Scholar] [CrossRef]
- Elith, J.; Phillips, S.P.; Hastie, T.; Dudik, M.; Chee, Y.E.; Yates, C.J. A statistical explanation to MaxEnt for ecologists. Divers. Distrib. 2010, 17, 43–57. [Google Scholar] [CrossRef]
- Manel, S.; Dias, J.-M.; Ormerod, S.J. Comparing discriminant analysis, neural networks and logistic regression for predicting species distributions: A case study with a Himalayan River bird. Ecol. Model. 1999, 120, 337–347. [Google Scholar] [CrossRef]
- Liu, C.; Berry, P.M.; Dawson, T.P.; Pearson, R.G. Selecting thresholds of occurrence in the prediction of species distributions. Ecography 2005, 28, 385–393. [Google Scholar] [CrossRef]
- Hair, J.F.; Anderson, R.E.; Tatham, R.L.; Black, W.C. Multivariate Data Analysis With Eeadings, 3rd ed.; Macmillan Polishing Company: New York, NY, USA, 1992. [Google Scholar]
- Smitinand, T. Thai Plant Names. Bangkok Forest Herbarium, Department of National Parks; Wildlife and Plant Conservation: Bangkok, Thailand, 2014. [Google Scholar]
- Sterck, F.; Anten, N.P.; Schieving, F.; Zuidema, P.A. Trait acclimation mitigates mortality risks of tropical canopy trees under global warming. Front. Plant Sci. 2016, 7, 607. [Google Scholar] [CrossRef] [PubMed]
- Schleussner, C.F.; Rogelj, J.; Schaeffer, M.; Lissner, T.; Licker, R.; Fischer, E.M.; Knutti, R.; Levermann, A.; Frieler, K.; Hare, W. Science and policy characteristics of the Paris Agreement temperature goal. Nat. Clim. Chang. 2016, 6, 827–835. [Google Scholar] [CrossRef]
- Chong, K.Y.; Chong, R.; Tan, L.W.; Yee, A.T.; Chua, M.A.; Wong, K.M.; Tan, H.T. Seed production and survival of four dipterocarp species in degraded forests in Singapore. Plant Ecol. Divers. 2016, 9, 483–490. [Google Scholar] [CrossRef]
- O’Brien, M.J.; Reynolds, G.; Ong, R.; Hector, A. Resistance of tropical seedlings to drought is mediated by neighbourhood diversity. Nat. Ecol. Evol. 2017, 1, 1643–1648. [Google Scholar] [CrossRef] [PubMed]
- Pulla, S.; Ramaswami, G.; Mondal, N.; Chitra-Tarak, R.; Suresh, H.S.; Dattaraja, H.S.; Vivek, P.; Parthasarathy, N.; Ramesh, B.R.; Sukumar, R. Assessing the resilience of global seasonally dry tropical forests. Int. For. Rev. 2015, 17, 91–113. [Google Scholar] [CrossRef]
- Umarani, R.; Aadhavan, E.K.; Faisal, M.M. Understanding poor storage potential of recalcitrant seeds. Curr. Sci. 2015, 108, 2023–2034. [Google Scholar]
- Tsioumani, E. Convention on Biological Diversity: A Review of the Post-2020 Global Biodiversity Framework Working Group Negotiations. Environ. Policy Law 2020, 50, 55–59. [Google Scholar] [CrossRef]
- CBD Secretariat. The Kunming-Montreal Global Biodiversity Framework of the Conference of Parties to the UN Convention on Biological Diversity; CBD/COP/15/L25; Convention in Biological Diversity: Montreal, QC, Canada, 2022. [Google Scholar]
Figure 1.
Map of Thailand and occurrence points of target tree species.

Figure 2.
Percentage of relative contributions of the environmental variables to the Maxent model. Notes: bio1 = annual mean temperature, bio2 = mean diurnal range, bio9 = mean temperature of driest quarter, bio10 = mean temperature of warmest quarter, bio11 = mean temperature of coldest quarter, bio12 = annual precipitation, bio16 = precipitation of wettest quarter, bio17 = precipitation of driest quarter, bio18 = precipitation of warmest quarter, bio19 = precipitation of coldest quarter, bdt = soil depth (cm), bld = bulk density (kg m−3), crf = coarse fragments, ocs = soil organic carbon (g kg−1), pH = soil pH, snd = percentage of sand particle, slt = percentage of silt particle, cly = percentage of clay particle, dem = altitude, slop = percent slope, geo, usda = USDA soil taxonomy suborders.

Figure 3.
Species richness of target tree species at the present and under the projected climate scenarios in 2050. Notes: DYKY = Dong Phayayen-Khao Yai Complex, WEFCOM = West (Western Forest Complex, PKMC = Phu Kha-Mae Chaem Complex, PKNN = Phu Khieo-Nam Nao Complex.
Figure 3.
Species richness of target tree species at the present and under the projected climate scenarios in 2050. Notes: DYKY = Dong Phayayen-Khao Yai Complex, WEFCOM = West (Western Forest Complex, PKMC = Phu Kha-Mae Chaem Complex, PKNN = Phu Khieo-Nam Nao Complex.

Figure 4.
Geographical distributions of 12 floristic regions at the current and under the projected climate scenarios in 2050. Notes: DYKY = Dong Phayayen-Khao Yai Complex, WEFCOM = West (Western Forest Complex, PKMC = Phu Kha-Mae Chaem Complex, PKNN = Phu Khieo-Nam Nao Complex.
Figure 4.
Geographical distributions of 12 floristic regions at the current and under the projected climate scenarios in 2050. Notes: DYKY = Dong Phayayen-Khao Yai Complex, WEFCOM = West (Western Forest Complex, PKMC = Phu Kha-Mae Chaem Complex, PKNN = Phu Khieo-Nam Nao Complex.


Table 1.
Bioclimatic variables derived from the monthly temperature and rainfall values projected for 2050 (CanESM5 GMC).
Table 1.
Bioclimatic variables derived from the monthly temperature and rainfall values projected for 2050 (CanESM5 GMC).
| Code | Description | Baseline | Scenarios | Change from Baseline | ||||
|---|---|---|---|---|---|---|---|---|
| SSP2-4.5 | SSP3-7.0 | SSP5-8.5 | 2000—SSP2-4.5 | 2000—SSP3-7.0 | 2000—SSP5-8.5 | |||
| BIO1 | Annual mean temperature | 26.1 | 26.4 | 27.5 | 28.8 | 0.3 | 1.4 | 2.7 |
| BIO2 | Mean diurnal range | 10.6 | 10.1 | 9.97 | 10.2 | −0.5 | −0.63 | −0.4 |
| BIO3 | Isothermality | 56.7 | 55.8 | 56.6 | 55.2 | −0.9 | −0.1 | −1.5 |
| BIO4 | Temperature seasonality | 187.5 | 203.4 | 200.7 | 213.1 | 15.9 | 13.2 | 25.6 |
| BIO5 | Maximum temperature of warmest month | 34.9 | 37.3 | 36,1 | 38.3 | 2.4 | 1.2 | 3.4 |
| BIO6 | Minimum temperature of coldest month | 15.9 | 18.7 | 18.1 | 19.4 | 2.8 | 2.2 | 3.5 |
| BIO7 | Temperature annual range | 19.0 | 18.6 | 18.0 | 19.0 | −0.4 | −1 | 0 |
| BIO8 | Mean temperature of wettest quarter | 26.6 | 28.4 | 27.8 | 29.0 | 1.8 | 1.2 | 2.4 |
| BIO9 | Mean temperature of driest quarter | 23.8 | 25.8 | 25.4 | 26.4 | 2 | 1.6 | 2.6 |
| BIO10 | Mean temperature of warmest quarter | 28.2 | 30.5 | 29.8 | 31.4 | 2.3 | 1.6 | 3.2 |
| BIO11 | Mean temperature of coldest quarter | 23.4 | 25.5 | 24.9 | 26.1 | 2.1 | 1.5 | 2.7 |
| BIO12 | Annual precipitation | 1495.2 | 1618.8 | 1530.4 | 1615.9 | 123.6 | 35.2 | 120.7 |
| BIO13 | Precipitation of wettest month | 299.7 | 323.5 | 305.6 | 328.7 | 23.8 | 5.9 | 29 |
| BIO14 | Precipitation of driest month | 10.2 | 8.34 | 8.0 | 8.2 | −1.86 | −2.2 | −2 |
| BIO15 | Precipitation seasonality | 79.6 | 85.7 | 86.6 | 87.4 | 6.1 | 7 | 7.8 |
| BIO16 | Precipitation of wettest quarter | 756.8 | 841.9 | 802.2 | 857.4 | 85.1 | 45.4 | 100.6 |
| BIO17 | Precipitation of driest quarter | 48.8 | 48.9 | 41.5 | 41.9 | 0.1 | −7.3 | −6.9 |
| BIO18 | Precipitation of warmest quarter | 372.0 | 378.8 | 390.4 | 346.8 | 6.8 | 18.4 | −25.2 |
| BIO19 | Precipitation of coldest quarter | 120.7 | 126.1 | 130.3 | 124.2 | 5.4 | 9.6 | 3.5 |
Source: http://www.worldclim.org (accessed on 5 January 2022).
Table 2.
Extent and changes of floristic regions in the current and in the future (2050).
| Extent at Present | SSP2-4.5 in 2050 | SSP3-7.0 in 2050 | SSP5-8.5 in 2050 | % Found in Protected Areas | |||||||
|---|---|---|---|---|---|---|---|---|---|---|---|
| Cluster | Total (%) | Total (%) | Change (%) | Total (%) | Change (%) | Total (%) | Change (%) | 2000 | SSP2-45 | SSP3-70 | SSP5-85 |
| 0 1 | 67.61 | 67.61 | 0.00 | 67.61 | 0.00 | 67.61 | 0.00 | 4.41 | 4.41 | 4.41 | 4.41 |
| 1/3 2 | 10.42 | 10.15 | −2.63 | 10.13 | −2.82 | 10.08 | −3.26 | 49.84 | 49.16 | 50.97 | 47.47 |
| 2 | 4.50 | 4.61 | 2.57 | 4.55 | 1.30 | 4.16 | −7.51 | 72.15 | 71.90 | 68.72 | 72.38 |
| 4 | 6.98 | 6.45 | −7.69 | 6.82 | −2.39 | 6.83 | −2.27 | 55.07 | 57.03 | 54.30 | 57.98 |
| 5 | 1.15 | 1.37 | 19.05 | 1.44 | 25.40 | 1.33 | 16.03 | 77.01 | 79.86 | 75.43 | 96.67 |
| 6 | 1.85 | 2.08 | 12.18 | 1.67 | −9.70 | 1.81 | −2.07 | 42.31 | 40.01 | 41.97 | 36.92 |
| 7 | 0.88 | 0.79 | −11.20 | 0.51 | −42.40 | 0.78 | −11.81 | 96.96 | 95.40 | 92.87 | 92.09 |
| 8 | 0.89 | 0.79 | −11.60 | 0.99 | 11.01 | 1.08 | 21.74 | 99.22 | 102.34 | 95.56 | 101.62 |
| 9 | 0.54 | 0.43 | −21.40 | 0.62 | 14.19 | 0.54 | 0.37 | 90.26 | 94.03 | 89.96 | 92.42 |
| 10 | 1.32 | 1.42 | 7.24 | 1.56 | 18.64 | 1.69 | 28.15 | 96.23 | 92.79 | 91.66 | 88.83 |
| 11 | 1.98 | 2.25 | 13.59 | 1.96 | −1.14 | 1.94 | −2.06 | 75.94 | 71.34 | 74.53 | 72.69 |
| 12 | 1.87 | 2.07 | 10.95 | 2.14 | 14.28 | 2.14 | 14.37 | 87.21 | 87.23 | 90.64 | 87.60 |
| 100.00 | 100.00 | 100.00 | 100.00 | ||||||||
Note: 1 Non-nature areas. 2 Clusters 1 and 3 were merged.
Disclaimer/Publisher’s Note: The statements, opinions and data contained in all publications are solely those of the individual author(s) and contributor(s) and not of MDPI and/or the editor(s). MDPI and/or the editor(s) disclaim responsibility for any injury to people or property resulting from any ideas, methods, instructions or products referred to in the content. |
© 2023 by the authors. Licensee MDPI, Basel, Switzerland. This article is an open access article distributed under the terms and conditions of the Creative Commons Attribution (CC BY) license (https://creativecommons.org/licenses/by/4.0/).
Share and Cite
MDPI and ACS Style
Trisurat, Y.; Sutummawong, N.; Roehrdanz, P.R.; Chitechote, A. Climate Change Impacts on Species Composition and Floristic Regions in Thailand. Diversity 2023, 15, 1087. https://doi.org/10.3390/d15101087
AMA Style
Trisurat Y, Sutummawong N, Roehrdanz PR, Chitechote A. Climate Change Impacts on Species Composition and Floristic Regions in Thailand. Diversity. 2023; 15(10):1087. https://doi.org/10.3390/d15101087
Chicago/Turabian StyleTrisurat, Yongyut, Nantida Sutummawong, Patrick R. Roehrdanz, and Auschada Chitechote. 2023. "Climate Change Impacts on Species Composition and Floristic Regions in Thailand" Diversity 15, no. 10: 1087. https://doi.org/10.3390/d15101087
Note that from the first issue of 2016, this journal uses article numbers instead of page numbers. See further details here.