

A Systematic Review of Population Monitoring Studies of Sea Turtles and Its Application to Conservation
1
Royal (Dick) School of Veterinary Studies, The University of Edinburgh, Roslin EH25 9RG, UK
2
The Roslin Institute, The University of Edinburgh, Roslin EH25 9RG, UK
*
Author to whom correspondence should be addressed.
Diversity 2024, 16(3), 177; https://doi.org/10.3390/d16030177
Submission received: 4 January 2024
/
Revised: 28 February 2024
/
Accepted: 4 March 2024
/
Published: 12 March 2024
(This article belongs to the Special Issue Genetic Diversity, Ecology and Conservation of Endangered Species)
Abstract
:Sea turtles are keystone species in marine environments due to their essential role as seagrass grazers and population regulation of jellyfish and sponges in coral reefs. However, due to their predominant presence in coastal areas, sea turtle populations face significant threats due to the impact of human activities. In this systematic review, 655 peer-reviewed publications were analyzed to assess the extent of population monitoring for all seven sea turtle species. The analyses revealed that, although population monitoring studies have increased for sea turtles in the past four decades, these have been biased towards certain species and oceanic regions. Furthermore, sea turtle population monitoring has been undertaken primarily using field-based methods, with satellite tracking and nest surveys being the most commonly used methods; however, the implementation of genetic methods for population monitoring has increased since the 2000s. Direct conservation recommendations from this study include the urgent need to establish population monitoring studies in the Critically Endangered Kemp’s ridley and hawksbill and the Data Deficient flatback. Furthermore, population monitoring programs should be implemented in Southeast Asia and Northern and Central Africa, where knowledge on sea turtle populations is still limited. Finally, due to the long-distance movements of sea turtles, we also advocate for international cooperation and collaboration of local communities to protect these ecologically important and iconic marine species.
1. Introduction
Protecting marine biodiversity is crucial for ensuring the functioning of marine ecosystems and the sustainability of resources derived from them. Therefore, it is the primary focus of the UN Decade of Ocean Science for Sustainable Development [1,2]. Unfortunately, species diversity and abundance in the marine environment continue to decline due to anthropogenic activities [3], with sea turtles, in particular, being vulnerable to the impact of human activities in the ocean [4].
Sea turtles are keystone species in marine environments due to their vital role in regulating jellyfish and sponge populations through predation, and seagrass health through grazing [5]. There are seven species of sea turtles found throughout the world: green (Chelonia mydas), Kemp’s ridley (Lepidochelys kempii), leatherback (Dermochelys coriacea), olive ridley (Lepidochelys olivacea), hawksbill (Eretmochelys imbricata), loggerhead (Caretta caretta) and flatback (Natator depressus). Five of the seven sea turtle species disperse widely throughout the world; green, loggerhead, leatherback, hawksbill, and olive ridley turtles all forage and breed along the coasts of every continent except Antarctica [4]. The flatback is the only sea turtle species present across the eastern limits of the Indian Ocean and does not migrate to the extent that the other species do [6]. The Kemp’s ridley sea turtle is also regionally limited, typically ranging across the Gulf of Mexico and the western Atlantic, although some individuals have been observed in the Mediterranean Sea [7].
Sea turtles are predominantly present in coastal areas and, therefore, are impacted by different human activities that result in declines of sea turtle numbers for decades [8]. Sea turtles have a strong natal homing and return to the shores on which they hatched for breeding [9,10,11] and, hence, the increasing development of coastal shores has had a detrimental impact on their movement and migration [2,12]. Furthermore, sea turtles can disperse across entire oceans to find foraging grounds, traveling through multiple international economic zones with varying fishing and offshore development regulations [2,12]. Death from bycatch during fishing operations significantly threatens their populations [13]. Humans also hunt sea turtles for consumption, particularly in Central America and Asia [14]. Available reports assessing the impact of sea turtle hunting indicate that c. 42,000 deaths occur annually [15], although the actual number is likely much higher. Other threats to sea turtles are predation of clutches in unprotected grounds, including nesting beaches, by introduced predators [16]. Furthermore, changes in environmental temperatures affect the sex ratio of sea turtles, with rising temperatures of the sand offsetting the hatchling ratio towards the development of female offspring, ultimately reducing population viability due to fewer breeding partners [17].
The multiple threats that sea turtle species face have led to their recognition as threatened species and are listed on the IUCN Red List. The Kemp’s ridley turtle and the hawksbill are classified as Critically Endangered, and the green turtle as Endangered. The leatherback, the olive ridley, and the loggerhead are all classified as Vulnerable, and the flatback as Data Deficient [4]. All seven sea turtle species are listed under Appendix I of the Convention on International Trade in Endangered Species of Wild Fauna and Flora [18], and except for the flatback, they are also either classified as Threatened or Endangered on the Endangered Species Act, ESA [4]. The conservation status of sea turtle species is still a matter of concern due to the lack of available data to determine with confidence the significant population risks [5,18].
Population monitoring is an approach for obtaining critical information on sea turtle population trends needed to inform conservation and management actions [19,20,21]. However, assessing sea turtles’ long-term population viability is difficult due to the challenges of collecting accurate, consistent, and diverse data for monitoring purposes [21]. In addition to their wide-ranging migratory patterns, sea turtles mature late, approximately when they are 20 to 30 years old, and have a long lifespan ranging from 50 to 100 years [13,19,22]; therefore, requiring long-term monitoring projects to collect robust data about their populations.
Field-based methods for gathering data on the movements of marine species include counting individuals or nests and tagging and tracking individuals, commonly via satellite, capture-mark-recaptures, and nest surveys [23,24,25]. These approaches can provide information on foraging grounds, nesting locations, population abundance, and migratory patterns [21,25,26,27,28]. Some of these field-based methods can also benefit from citizen-based data collection, an effective way to gather large quantities of data and garner local education and cooperation [29]. However, obtaining robust estimates of population parameters such as survivability and migration requires data collection over years, and even decades [21]. Fishery data, such as bycatch records, are often used to estimate the abundance of sea turtle species in an area [30], but this approach may be prone to errors, as it is sensitive to human biases and dependent on the accuracy of the logs and cooperation and standardization of reporting across international fisheries [31].
Genetic monitoring methods can help overcome some of the challenges encountered when implementing field-based methods and provide estimates of population parameters such as genetic diversity, levels of inbreeding, gene flow, hybridization, or the geographical origin of individuals [32,33,34,35,36]. Genetic methods are often costly; therefore, substantial funding is needed to implement them in population monitoring projects [37]. Ultimately, genetic and field-based monitoring are necessary to understand wildlife populations [36].
Here, we present the results of a systematic review of peer-reviewed literature on sea turtle population monitoring to provide an overview of the conservation-relevant data on these iconic and keystone marine species. In particular, we assess the extent to which population monitoring (field-based and genetic) has been conducted for the seven species of sea turtles in the past four decades. The analyses highlight taxonomic, geographical, conservation status, and data acquisition gaps and biases that should be addressed to protect sea turtle populations. In this study, we refer to population monitoring in a broad sense, including studies representing population characterization to obtain baseline data as a first step in a monitoring program.
2. Materials and Methods
This systematic review gathered data from peer-reviewed publications for all seven recognized sea turtle species: green, hawksbill, leatherback, loggerhead, olive ridley, Kemp’s ridley, and flatback. Further information was obtained about each sea turtle species, including conservation statuses and species characteristics from the IUCN Red List website. Different sources were consulted to obtain details on legislation explicitly implemented to protect sea turtles and global funding for sea turtle conservation. Publications in peer-reviewed journals were gathered by searching several established literature databases, Web of Knowledge, PubMed, Mendeley, and DiscoverEd (the local library service of The University of Edinburgh). Search criteria were established to filter through publications and select those representing sea turtle population monitoring studies: 1. The publications needed to include short-term or long-term empirical research on one or more sea turtle species; 2. No literature reviews, systematic reviews, or meta-analyses were included; 3. The studies needed to present data on monitoring individuals or populations using any method; 4. Studies could cover any oceanic region, as sea turtles are found globally; 5. The publication date range was set from 1980 to 2020.
As a first step, following the criteria above, database searches were conducted with only the keywords “sea turtle” and “monitoring.” This first search resulted in over 30,000 results across all databases. To narrow down the number of publications to be evaluated a new set of keywords was established: “sea turtle”, “population”, “monitoring”, and “conservation”. These keywords were used in combination with each of the seven species’ names (both common and scientific names), which resulted in 14 unique searches in each database (e.g., “sea turtle” AND “population” AND “monitoring” AND “conservation” AND “Chelonia mydas”). Additional searches were conducted with the same keywords (as described above) plus the keywords “Satellite”, “Tagging”, “Telemetry”, “Capture-Mark-Recapture”, “Fishery”, “Citizen”, “Drone”, “Photo Identification”, “Nest Surveys”, “Historic Data” and “Genetics” to cover the different approaches/methods to conduct population monitoring (see Table 1). The total number of records retained from the databases for further analyses was 2017.
The 2017 records were automatically imported into Zotero v.5.0.92. The data extracted from the publications included titles, authors, publication sources, publication date, source type, and abstracts. Due to the overlap of records found by searches in different databases, duplicates were identified, and 956 records were deleted. The remaining records (1061) were inspected manually to ensure they met the established criteria. After this manual filtering, the number of publications was 655, and these were selected for further analysis.
The final 655 publications were read in detail, and relevant data were extracted and recorded in a spreadsheet using Excel v.15.0.5337. In addition to the publication details (see above), the data collected included the species studied, the population status, the study’s oceanic location, the population parameter(s) assessed or estimated in the publications, and data on the population monitoring methods (field-based and genetic), including population characterization used in the study. Furthermore, the IUCN Red List website was consulted to record data on each species’ conservation status, population trends, and threats (Table 1). Finally, each variable analyzed in this systematic review was standardized and further categorized for comparison (see below).
2.1. Variables Recorded
The variables recorded from each selected publication were taxonomic representation (sea turtle species name(s) included in the study), population parameters, oceanic regions, conservation status, population trends, field-based monitoring methods, genetic monitoring methods, and in the case of studies including genetic techniques, the type of genetic markers used for the estimation of population parameters was also recorded (see Table 1 for details).
In addition to the oceanic regions covered by each study, the number of sea turtle species present in each oceanic region (not necessarily included in the paper) was also recorded to assess research effort per species in each region. The number of sea turtle species in each region was collected from the IUCN Red List of Threatened Species website [4]. Information on the conservation status of each species included the current conservation status, previous conservation statuses (and dates of those), the most recent assessment dates, the species’ global range, and noted threats to the species (Table 1). The conservation status of the sea turtle species across all years included the categories of Data Deficient, Vulnerable, Endangered, and Critically Endangered.
The population trends for five of the seven sea turtle species at the time the study was conducted were determined as Decreasing on the IUCN Red List website, namely for the green, loggerhead, leatherback, olive ridley, and hawksbill [4]. In addition, the population trend for Kemp’s ridley was reported as Unknown, and for the flatback reported as Unspecified [4]. To further assess population trends, studies reporting statistically significant population trends, either decreasing or increasing/stable, were further evaluated and the direction of the trend recorded. Furthermore, population trends were assessed for each sea turtle species by recording if the study (reporting significant population trend changes) was published before or after the latest species IUCN species assessment. This comparison would help highlight the extent to which a species has been reported to increase or decline since its last IUCN assessment and whether the IUCN status reflected up-to-date population trends.
The type of population monitoring approach used in each study was recorded. Details on monitoring approaches included whether the method was field-based or genetic. Field-based population monitoring methods were categorized further (Table 1). For field-based monitoring studies, observation time was recorded, and the average duration and median of the monitoring across all studies calculated. Citizen participation in studies was also recorded. For those studies including genetic monitoring methods, the genetic marker(s) used in this study were also recorded (Table 1).
2.2. Data Analyses
Data analyses followed a similar approach to those adopted by [37]. Descriptive statistics were conducted for all the variables recorded, and the data were plotted using Excel v.15.0.5337. These descriptive statistics included the number of studies and percentages for each variable assessed in the systematic review. In addition, population monitoring (including population characterization) effort in terms of number of publications per coastal region was visualized with heat maps using Maptive (available at: https://www.maptive.com/ accessed on 21 March 2021).
Temporal patterns, in terms of the number of studies over time (1980–2020), were also analyzed for the following variables: 1. Sea turtle population monitoring studies; 2. Studies per oceanic region; 3. Studies according to IUCN species conservation statuses; 4. Studies assessing each category of population parameters; 5. Studies that implemented field-based monitoring methods; 6. Studies that implemented genetic monitoring; 7. Studies using a particular genetic marker. For those variables that included many categories, only the five most common categories were analyzed to examine patterns over time. This applied to the following variables: oceanic region, field-based methods, and population parameters. Patterns over time were examined by conducting time-series analyses of these variables using XLSTAT v.2021.1.1. These analyses were performed first using each data set with a moving average model to remove noise and determine any underlying patterns. Next, the patterns over time were determined using a Mann–Kendall test using the smoothed data for each variable (significance of patterns defined by p < 0.0001). Finally, significant shifts in the datasets over time were assessed using Pettitt’s test, which determined the year that the data shifted (based on the resulting t-value, and determined statistically significant when p < 0.001).
3. Results
3.1. Taxonomic Representation
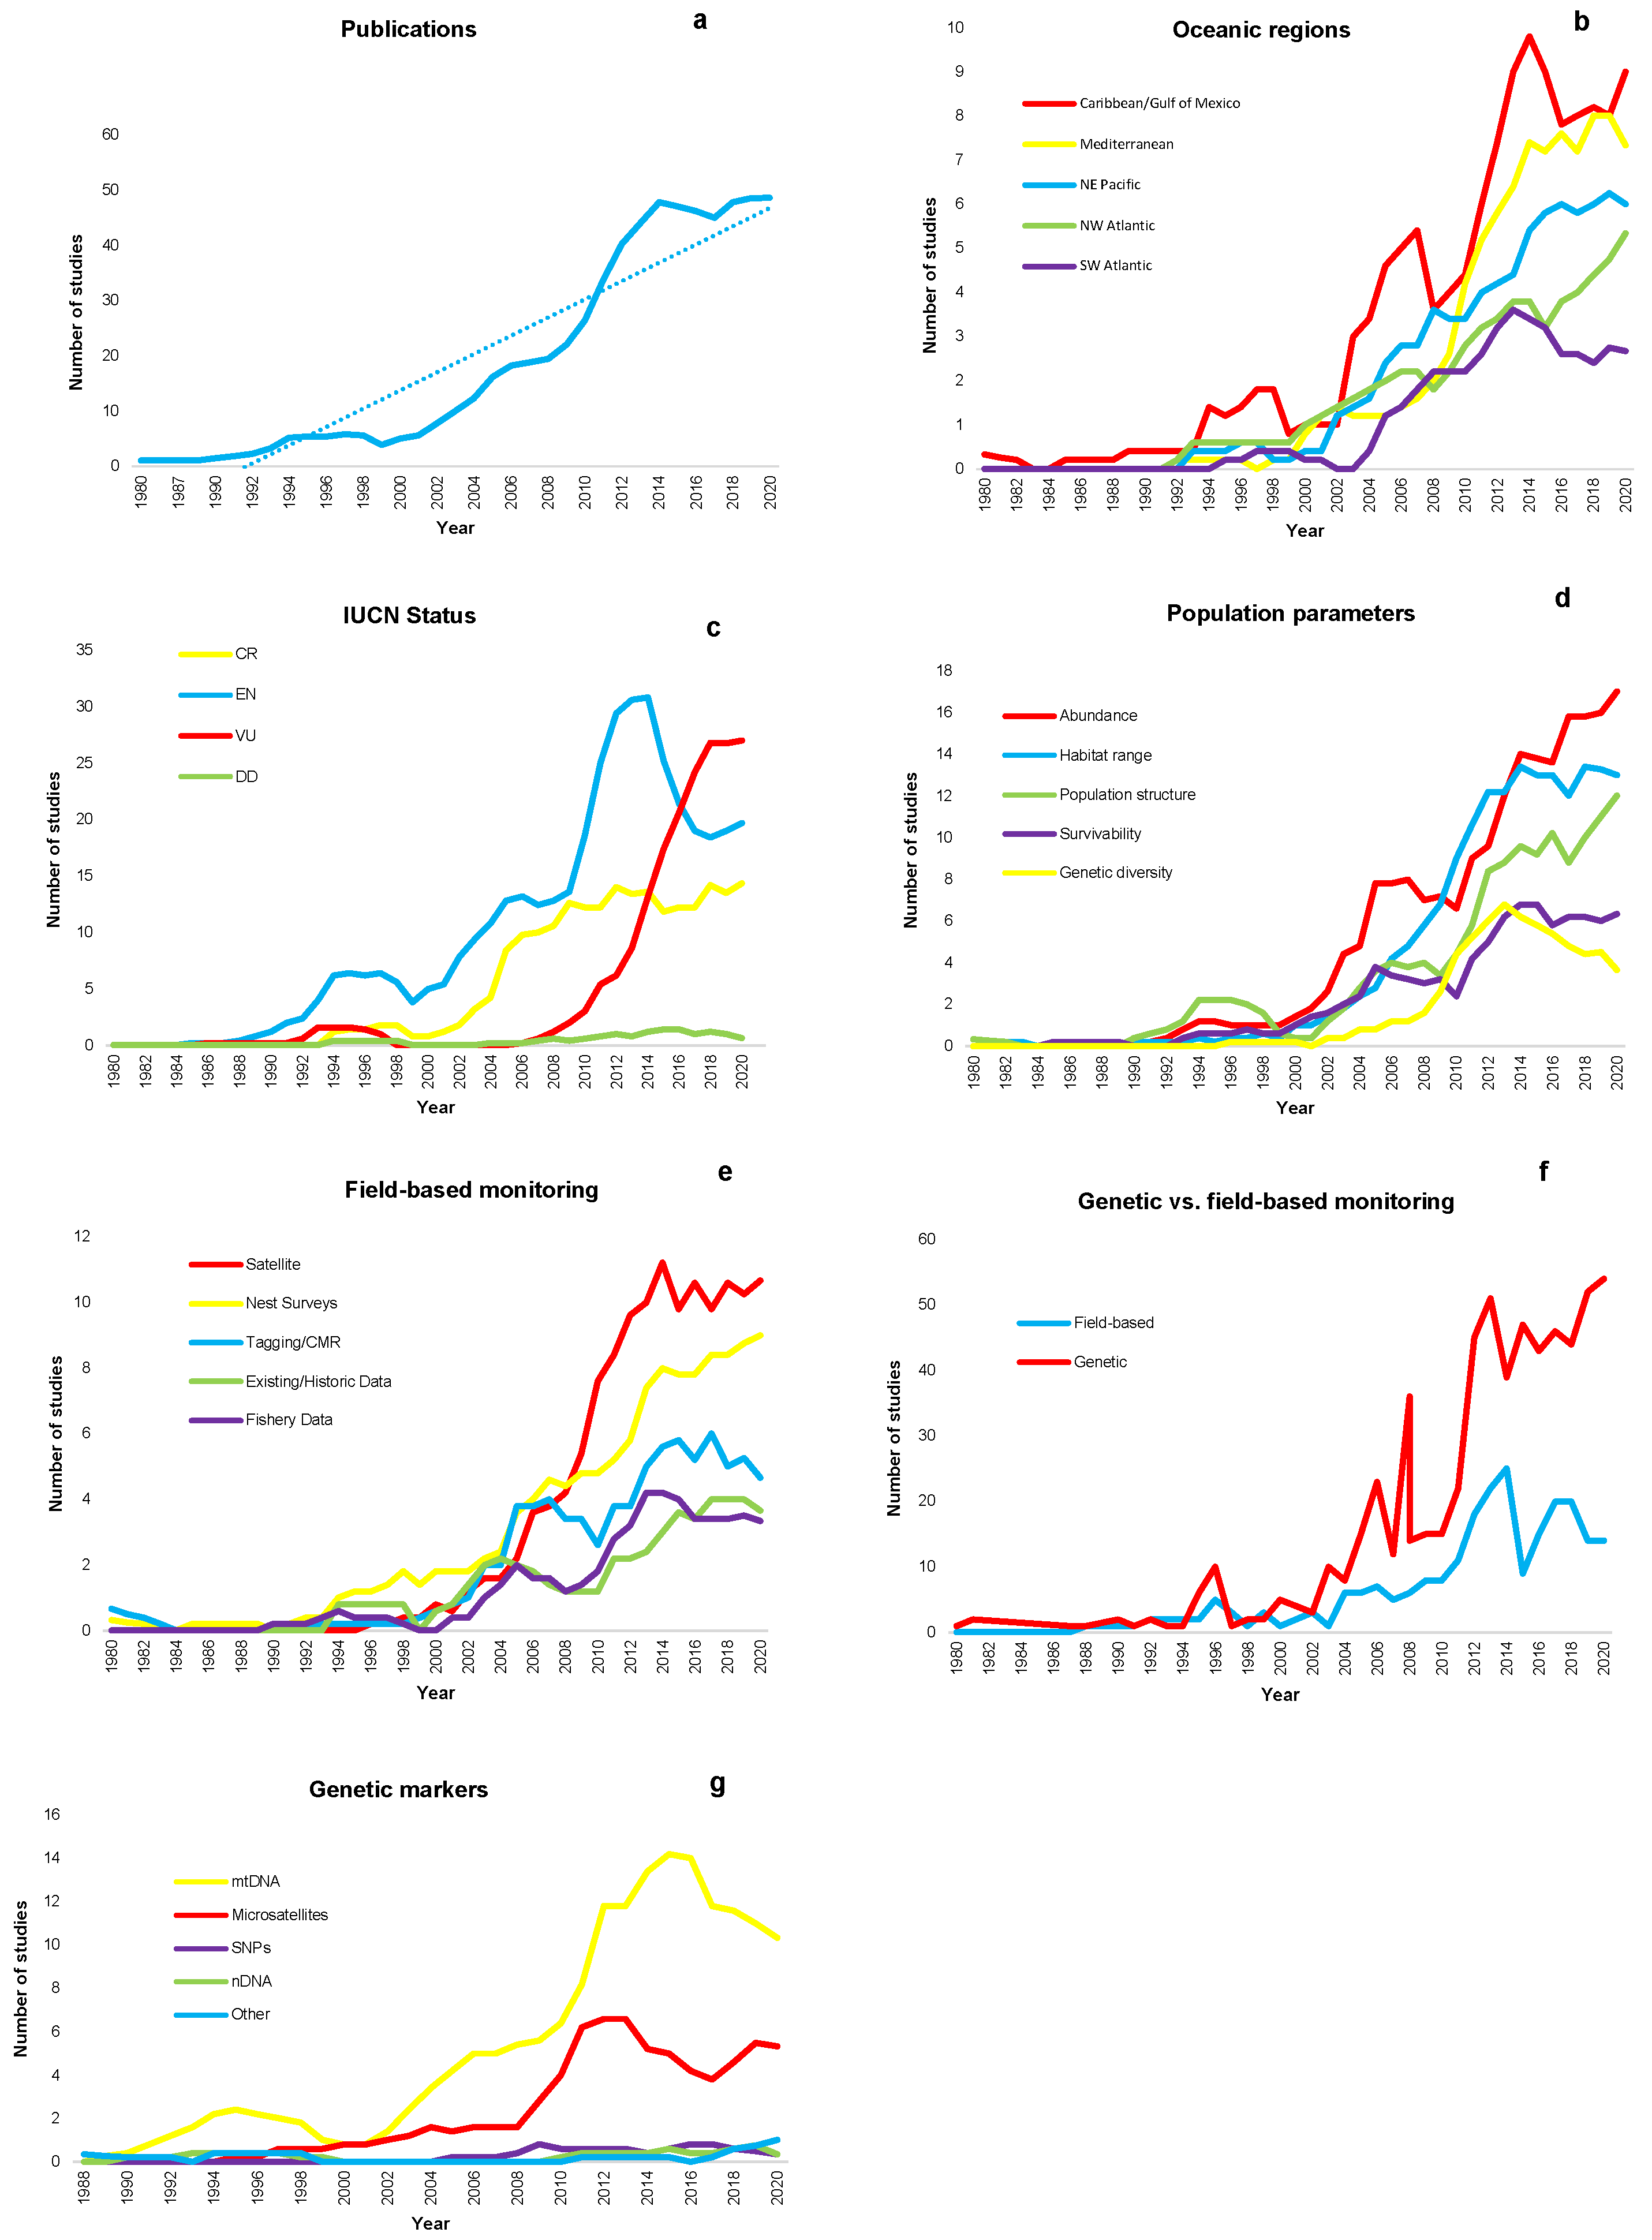
Overall, the number of population monitoring studies on sea turtles increased over time and for all species (Mann–Kendall test, p < 0.0001; Figure 1a, Table S1). However, the data were not homogeneous, with the Pettitt’s test indicating positive shifts in the number of studies on sea turtle population monitoring in 1996, 2002, 2007, and 2013 (Pettitt’s Test, p < 0.0001; Figure 1a). Furthermore, a taxonomic bias was found in population monitoring studies on sea turtles, with the largest percentage of studies focusing on green turtles (40.15% of the studies) and loggerhead turtles (32.31%). The remaining studies focused on hawksbill turtles (21.37%), leatherback turtles (16.03%), olive ridley turtles (9.31%), Kemp’s ridley turtles (5.65%), and flatback turtles (2.60%); see Table S1.
3.2. Oceanic Regions
The most significant effort of sea turtle population monitoring has been conducted in the Caribbean Sea/Gulf of Mexico (46.26% of the total studies reviewed), followed by Mediterranean Sea (30.23%), NE Pacific Ocean (25.04%), the NW Atlantic (21.37%), the SW Atlantic (15.42%); see Figure 1b, Figure 2 and Figure S1, and Table S2. The least studied oceanic regions were the Philippine Sea and the Tasman Sea, with only one study each (0.31% of the total studies). Considering the five most studied oceanic regions, population monitoring studies per species were as follows: in the Caribbean, most population monitoring has been conducted on hawksbill and green turtles; in the Mediterranean on loggerhead turtles, in the NE Pacific Ocean on green turtles; in the NW Atlantic on loggerhead, and the SW Atlantic on loggerhead and hawksbill. For details, see Figure S1 and Table S2.
When looking at population monitoring conducted per species and oceanic region, most population monitoring studies on green, hawksbill, leatherback, and Kemp’s ridley turtles were conducted in the Caribbean, for loggerhead turtles mainly in the Mediterranean, olive ridley turtles mainly in the NE Pacific Ocean, and flatback in the Indian Ocean; see details in Figure S1 and Table S2. Flatback turtles are limited to the shorelines around Australia [4], with most studies conducted on the coast of Western Australia. Kemp’s ridley turtles are primarily found in the Caribbean and the Atlantic Oceans, where most studies have been conducted. However, a few population monitoring studies have focused on individual Kemp’s ridleys that have been able to cross into the Mediterranean Sea [7].
Time-series analyses assessing the effort on sea turtle population monitoring in the five most studied oceanic regions (Caribbean, Mediterranean, NE Pacific, NW Atlantic, and SW Atlantic) indicated a positive trend over time (Mann–Kendall test, p < 0.0001; Figure 1b). However, the trends were not homogeneous across years (Pettitt’s test, p < 0.0001), with positive shifts in the number of studies conducted in the Mediterranean and the NW Atlantic in 1999, for studies on the NE Pacific in 2001, for studies on the Caribbean/Gulf of Mexico in 2002, and in for studies in the SW Atlantic 2003 (Figure 1b).
3.3. Conservation Status
Overall, the highest number of population monitoring studies in any given year was on sea turtle species categorized as Endangered. However, a marked decline in studies on Endangered species was observed after 2014, when more studies focused on sea turtle species categorized as Vulnerable (Figure 1c). Positive shifts in the number of population monitoring studies on Endangered and Critically Endangered sea turtle species were indicated in 2001, for Data Deficient in 2003 (although the number of studies remains significantly lower than for other conservation status categories), and for Vulnerable in 2006 (Pettitt’s test, p < 0.0001).
The percentage of population monitoring studies published per species after their last conservation status assessment in the IUCN Red List of Endangered Species were as follows: flatback (88.24% of the total number of studies in this species), green turtle (85.93%), hawksbill (82.86%), olive ridley (72.13%), leatherback (47.62%), and loggerhead (42.18%); see details in Table S3. Kemp’s ridley turtle’s species conservation status was assessed in 2019; 13.51% of studies on Kemp’s ridley population monitoring were published since this recent assessment (Table S3).
3.4. Population Parameters
The population parameters most assessed or estimated in sea turtle population monitoring studies were abundance (31.45% of all studies reviewed), habitat range (26.26%), population genetic structure (21.07%), origin (15.73%), survivability (14.20%), and genetic diversity (10.23%); see Figure 1d and Table S4. The number of studies estimating these parameters significantly increased over time (all Mann–Kendall tests with p < 0.0001). Pettitt’s tests indicated significant positive shifts in the number of studies (p < 0.0001) for abundance, habitat range, and survivability in 1999, for genetic diversity in 2001, and for population genetic structure in 2003 (Figure 1d).
3.5. Population Trends
Over a quarter (25.5%) of the population monitoring studies analyzed reported statistically significant trends of population increase, stabilization, or decline. The other studies either did not report population trends or, if reported, were not statistically significant. Significant increasing or stable population trends before and after the last IUCN species assessment were reported for all sea turtle species but the percentage of studies reporting this differed among species (Figure 3). The percentage of studies reporting a significant increasing or stable population trend before the last IUCN species assessment was notably higher for Kemp’s ridley and leatherback. In contrast, for green, hawksbill, and olive, the percentage of studies reporting a significant increasing or stable population trends were much higher after the last IUCN species assessment. For flatback, the same percentage of studies reported a significant increasing or stable population trend before and after the last IUCN assessment. Significant decreasing population trends before the last IUCN species assessment were reported in studies in leatherback, olive, loggerhead, hawksbill, and green (Figure 3). The percentage of studies reporting significant decreasing population trends before their respective last IUCN species assessment was higher for leatherback, olive, and loggerhead. No studies on Kemps’ ridley or flatback reported a significant decreasing population trend before their IUCN species assessments. Significant decreasing population trends after the last IUCN species assessment were reported in studies for all species, with the highest percentage of studies reporting this found in flatback, followed by green, hawksbill, leather, and olive (Figure 3). When comparing the percentage of studies reporting significant decreasing population trends before and after the last IUCN species assessment, it was notable that there was a substantial increase of studies reporting population decreases for green and hawksbill. In contrast, for leatherback and loggerhead the percentage of studies reporting population decrease after the last IUCN species assessment was much lower than before their last assessment. For olive, the percentage of studies reporting population decrease before and after the IUCN species assessment did not differ. The dates of the IUCN species assessment for sea turtles ranged from 1996 (flatback) to 2019 (Kemp’s ridley), see Table S3 for details.
3.6. Field-Based Monitoring Approaches
Field-based monitoring methods were used in 424 studies (i.e., 64.73% of the total studies reviewed). The most used methods were satellite tracking (31.60% of the studies using field-based methods), followed by nest surveys (29.48%), and tagging/capture-mark-recapture (19.10%). Use of existing/historic data and fishery data to estimate population numbers, each represented 12.26% of the field-based studies. An element of citizen science was included in 3.77% of the studies using field-based methods; see Table S5 for details. Analyses of trends for the use of these five most common field-based monitoring methods indicated a positive increase in the use of these over time (Mann–Kendall test, p < 0.0001; Figure 1e). However, the trends were not homogeneous (Pettitt’s test, p < 0.0001), with positive shifts indicated for tagging/CMR in 1999, nest surveys and existing/historical data in 2001, fishery data in 2002, and satellite tracking in 2003.
The average duration of field-based population monitoring studies was 6.4 years (SD ± 8.7 years), with the most common duration being 1 to 3 years, and a median of 1.5 years (Figure 4).
3.7. Genetic Monitoring Approaches
This systematic review revealed that 242 studies included genetic monitoring approaches (36.95% of the total studies reviewed) and that they increased over time (Mann–Kendall test, p < 0.0001; Figure 1f). Of all the studies using genetic markers for sea turtle population monitoring, 127 (52.48% of the studies using genetic markers) used mtDNA (Figure 1g and Figure S2), with a significant positive shift in the use of mtDNA markers for sea turtle genetic monitoring occurring in 2003 (Pettitt’s Test, p < 0.0001; Figure 1g). The percentage of genetic monitoring studies using mtDNA markers per sea turtle species was 73.58% of the genetic monitoring studies on hawksbill, 71.29% on green, 65.15% on loggerhead, 58.33% on Kemp’s ridley, 57.14% on flatback, 52.38% on olive ridley, and 45.83% on leatherback (Figure S2).
Seventy-three studies (30.17% of all studies including genetic monitoring) used microsatellite markers to monitor sea turtle populations (Figure 1g and Figure S2). There was a positive trend in the use of microsatellite markers in studies over time, with a significant positive increase detected in 2003 (Pettitt’s Test p < 0.0001; Figure 1g). The percentage of studies using microsatellite markers for genetic monitoring per sea turtle species was 45.83% of the genetic monitoring studies on leatherback, 42.86% olive ridley, 33.33% on Kemp’s ridley, 28.79% on loggerhead, 28.57% on flatback, 18.87% on hawksbill, and 17.82% on green (see Figure S2). Studies using SNPs were limited, all published between 2009 and 2020; six studies using SNPs were conducted on green turtles (5.94% of the genetic monitoring studies), one on leatherbacks (4.17%), one on hawksbill turtles (1.89%), and one on loggerhead turtles (1.52%) (see Figure S2).
4. Discussion
Sea turtle population monitoring is crucial to provide stakeholders with accurate data on the current status of individual populations and inform the necessary conservation actions needed to protect them [3,5,8]. In addition, data providing accurate estimates of population size and migration patterns are crucial for assessing whether populations are currently increasing or declining, and projecting future estimates of these demographic parameters. Population monitoring of sea turtles can be conducted through field-based methods such as capture-mark-recapture, satellite tracking, and nest counts [16,17,19,36]. In addition, genetic methods can also be used for population monitoring (genetic monitoring) by using genetic markers to make inferences of population demography, such as population size and gene flow [32,33,36].
This systematic review assessed the application of population monitoring (field-based and genetic) in sea turtles to identify gaps, biases, and patterns in data derived from monitoring programs and provide recommendations for future sea turtle conservation research. The following sections highlight and discuss the main results found in this systematic review.
4.1. Taxonomic Representation
This study revealed taxonomic bias in sea turtle population monitoring studies. Of particular concern is the lower number of population monitoring studies on the flatback and Kemp’s ridley, as these species have been classified as Data Deficient and Critically Endangered under the IUCN Red List since 1996 [4]. Although the distribution range of flatbacks and Kemp’s ridley are limited to Australia and the North Atlantic/Gulf of Mexico, respectively, a significant number of studies have been published on other turtle species present in these oceanic regions, e.g., [38,39]. There is no available data on the threats specific to the flatback. Still, their populations are likely subjected to similar threats faced by other sea turtle species in the same oceanic regions, such as the effect of commercial activities, coastal urbanization, and climate change [4]. Therefore, research on flatback and Kemp’s ridley populations is urgently needed.
4.2. Oceanic Regions
A geographical bias in sea turtle population monitoring studies was also found in this study. This bias cannot be explained by the number of sea turtle species present in the most studied oceanic regions in comparison to lesser studied other regions. Although the top five most studied oceanic regions have five or six of the seven sea turtle species present [4], the Philippine Sea and the Tasman Sea are also inhabited by five or six species of sea turtles [4] and were the least studied oceanic regions. The fact that a large number of sea turtle population monitoring (and characterization) studies have been conducted in the Caribbean/Gulf of Mexico could be justifiable by the rich overall marine biodiversity in this area, the number of sea turtles present (6 out of 7 species), the harboring of essential rookeries, the connectivity to more significant rookeries in the Atlantic, and the facilitation of large-scale movement via the Gulf Stream [40,41,42]. However, sea turtle population monitoring is also necessary for other biodiversity-rich regions. The Philippines, for instance, was the focus of only one sea turtle population monitoring study, despite the rich biodiversity along its coasts and its proximity to nesting beaches in Southeast Asia [43].
4.3. Conservation Status
This systematic review indicated that the number of sea turtle population monitoring studies has increased over time for species categorized as Endangered, Critically Endangered, and more recently on species categorized as Vulnerable. Furthermore, the publishing of conservation status in the IUCN Red List of Threatened Species had a positive effect on all sea turtle species in terms of the number of population monitoring studies on sea turtles. This study, therefore, provides further support for the positive impact of the publication of conservation status in the IUCN Red List for Endangered Species [44].
In terms of temporal patterns of publication of sea turtle monitoring studies within each conservation status category, a marked decrease in publications was found for Critically Endangered species from 2014. Further research is needed to determine the causes of this marked decrease in publications; however, a potential cause could be related to funding cycles and priorities in major funding calls [45]. Regarding population monitoring studies, the temporal analyses also highlighted the long-term neglect of flatback, a species still categorized as Data Deficient. Therefore, this further supports the urgent need for coordinated efforts to protect critically endangered species (Kemp’s ridley and hawkbill) and to acquire data on flatback to assess its conservation status [46].
4.4. Population Parameters
Population abundance and habitat range were the most studied population parameters in sea turtle population monitoring (mainly through telemetry), followed by population genetic structure, survivability, and genetic diversity. These population parameters are important to understand population demography and interactions between populations [47] and help conservationists make projections about future population trajectories [32,48]. Hence, population parameter estimates obtained using field-based and/or genetic methods must be considered when devising sea turtle conservation and management actions as well as current conservation policy.
4.5. Population Trends
The population trends examined as part of this systematic review indicated that further conservation and research efforts are required to halt or slow the decline of sea turtle populations. The dates of the IUCN species assessments for sea turtles range from 1996 (flatback) to 2019 (Kemp’s ridley). Of conservation concern is the reporting of significant population decrease trend in studies on all the seven sea turtle species after their last IUCN species assessment, in particular for flatback, a species for which its IUCN species assessment has not been updated since 1996, green turtle, with reports of declining populations increasing since the last IUCN species report in 2004, and hawksbill for which the last IUCN species assessment dates back to 2008 [4]. Therefore, it is essential to highlight that despite population monitoring data (including population characterization) on sea turtles is available, there is a critical gap in the conservation policy of these species. These results further support the need to urgently conduct and update species assessments to effectively conserve and manage sea turtle populations [44].
4.6. Field-Based Monitoring
Field-based monitoring approaches were more common than genetic monitoring across the publications analyzed in this systematic review, with satellite tracking and nest surveys as the most adopted methods for population monitoring in sea turtles. Satellite tracking is a powerful monitoring method as it allows tracking individuals when they are at sea [41]. In addition, it can be a cost-effective monitoring method (considering the type, quantity and quality of data obtained in comparison to other field-based methods), and data can be acquired until trackers are lost, or the signal is interrupted [49,50]. Data obtained with satellite tracking has been used to successfully determine population boundaries, changes in demographic parameters, migratory pathways, foraging hotspots, and natal homing of sea turtles, as well as to predict and mitigate the impacts of climate change on sea turtle populations [23,51,52,53,54,55]. Furthermore, satellite devices for the tracking of animals have become more sophisticated and more durable over time, with transmission available for more extended amounts of time, and the size of the tags small enough to fit individuals as small as 11 cm [54].
The second most commonly field-based monitoring approach, nest surveying, is a cost-effective method that can benefit from the involvement of local communities and volunteers to collect large amounts of data on sea turtles [56,57]. As part of nest surveying, clutch, and egg counts can provide data on the current breeding population when analyzed alongside data such as counts of multiple clutches per female, estimates of multiple paternity, and survival rates [42,56]. This information can help determine how individuals can find mates and reproduce, essential factors in declining populations. However, these methods must be more encompassing to account for all nesting areas [25,58].
The average duration of field-based population monitoring (6.4 years ± 8.7 years) contrasts with the sea turtles’ life, which spans from 50 to 100 years, and the breeding age of 20 to 30 years [19,20]. Understanding the migration routes, natal homing, and survival rates of sea turtles requires several decades of monitoring [59]. Therefore, further effort in establishing longer-term monitoring programs is still needed for these long-lived organisms [28]. However, the difficulties associated with studies in marine environments and tracking individuals for an extended period to estimate population parameters is one of the main challenges to devise effective conservation strategies for sea turtle populations [8,54].
4.7. Genetic Monitoring
Although genetic monitoring methods were less commonly used than field-based monitoring approaches in sea turtles, there has been a marked increase in the implementation of genetics for sea turtle population monitoring since the 2000s; in particular, studies using mtDNA and, to a lesser extent, microsatellites as genetic markers. The general use of mtDNA for genetic monitoring of sea turtle populations can be explained by the relatively easy implementation and cost-effectiveness in obtaining mtDNA sequence data in different species [35]. Microsatellite markers, although requiring more time and expertise for the genotyping of samples, provide more resolution for estimating contemporary population parameters due to their faster mutation rates, higher polymorphism, and biparentally inheritance, as opposed to the slower mutation rate of maternally inherited mtDNA [60]. Microsatellites have been successfully implemented in sea turtle population monitoring such as to provide detailed data on sex ratio [61], geographic origin [62], population genetic structure [63] and paternity analyses [64]; however, it is evident that further research using higher resolution genetic markers such as microsatellites or SNPs is still required to obtain current estimates of population parameters in threatened populations of sea turtles [65]. Despite the higher resolution power of SNPs to infer population-level parameters in highly migratory species [66,67], the implementation of SNPs in sea turtle population monitoring has been limited. The slower implementation of SNP data in sea turtle population monitoring can be explained due to the more costly procedures to identify informative SNPs for the genotyping of individuals [68]. However, with the increasing affordability of next-generation sequencing techniques and the availability of user-friendly software for the analysis of SNP data, it is foreseeable that the implementation of SNP-based population monitoring projects on sea turtles will become more popular [69].
5. Conclusions
Population monitoring (including characterization) of sea turtles is crucial if we are to devise effective management strategies to halt or minimize population decline in these iconic and keystone marine species. This systematic review provided a detailed overview of population monitoring studies on sea turtles in the last four decades. It also identified several research gaps that must be addressed to ensure their populations’ protection and long-term survival.
Sea turtle population monitoring has increased substantially over the past decades, likely due to legislation and funding targeted to our understanding and the protection of these iconic animals. Population monitoring has been primarily conducted using field-based methods, but the use of genetic monitoring has significantly increased since the 2000s. The results from this systematic review have highlighted the importance of conducting further species assessments. The findings presented in this paper indicate an urgency for conservation actions for sea turtle species for which population characterization and monitoring data is scarce, and the need to study sea turtle populations across their distribution range, particularly the hawksbill, the Kemp’s ridley, and the flatback. For the successful conservation of sea turtles, the establishment of further population characterization and monitoring programs must secure greater international cooperation and collaboration of different stakeholders, including local communities.
Supplementary Materials
The following supporting information can be downloaded at: https://www.mdpi.com/article/10.3390/d16030177/s1, Figure S1: Heat maps illustrating population monitoring effort (in terms of published studies) for each sea turtle species. Figure S2: Number and percentage of sea turtle genetic monitoring studies that used a particular genetic marker type per species; Table S1: Number and percentage of publications on sea turtle population monitoring per species across years, from 1980 to 2020; Table S2: Oceanic regions covered by population monitoring studies on each of the sea turtle species and overall percentage of studies per oceanic region; Table S3: IUCN Red List classification of all seven sea turtle species between 1980 and 2020; Table S4: Number and percentage of studies estimating each population monitoring category; Table S5: Number and percentage of publications reporting results from field-based methods for sea turtle population monitoring.
Author Contributions
Conceptualization, S.P.-E.; methodology, S.P.-E.; validation, H.H. and S.P.-E.; formal analysis, H.H.; investigation and data curation, H.H.; writing—original draft preparation, H.H.; writing—review and editing, S.P.-E. and H.H.; visualization, H.H. and S.P.-E.; supervision, S.P-E. All authors have read and agreed to the published version of the manuscript.
Funding
This research received no external funding.
Institutional Review Board Statement
Not applicable.
Data Availability Statement
Data are available from the authors upon request.
Conflicts of Interest
The authors declare no conflicts of interest.
References
- Kocak, D.M.; Hotaling, L. Introduction to the United Nations Decade of Ocean Science for Sustainable Development (2021–2030) and the Seabed 2030 Initiative. Mar. Technol. Soc. J. 2021, 55, 1–147. [Google Scholar] [CrossRef]
- Thomson, A.I.; Archer, F.I.; Coleman, M.A.; Gajardo, G.; Goodall-Copestake, W.P.; Hoban, S.; Laikre, L.; Miller, A.D.; O’Brien, D.; Pérez-Espona, S.; et al. Charting a course for genetic diversity in the UN Decade of Ocean Science. Evol. Appl. 2021, 14, 1497–1518. [Google Scholar] [CrossRef] [PubMed]
- Halpern, B.S. A global map of human impact on marine ecosystems. Science 2008, 319, 948–952. [Google Scholar] [CrossRef] [PubMed]
- IUCN. The IUCN Red List of Threatened Species. Version 2021-3. 2023. Available online: https://www.iucnredlist.org (accessed on 8 February 2023).
- Liu, T.M. Unexpected threat from conservation to endangered species: Reflections from the front-line staff on sea turtle conservation. J. Environ. Plan. Manag. 2017, 60, 2255–2271. [Google Scholar] [CrossRef]
- Wildermann, N.; Critchell, K.; Fuentes, M.M.P.B.; Limpus, C.J.; Wolanski, E.; Hamann, M. Does behaviour affect the dispersal of flatback post-hatchlings in the Great Barrier Reef? R. Soc. Open. Sci. 2017, 4, 170164. [Google Scholar] [CrossRef]
- Tomás, J.; Formia, Á.; Fernández, M. Occurrence and genetic analysis of a Kemp’s Ridley sea turtle (Lepidochelys kempii) in the Mediterranean Sea. Scientia 2003, 67, 367–369. [Google Scholar] [CrossRef]
- Wallace, B.P.; DiMatteo, A.D.; Bolten, A.B.; Chaloupka, M.Y.; Hutchinson, B.J.; Abreu-Grobois, F.A.; Mortimer, J.A.; Seminoff, J.A.; Amorocho, D.; Bjorndal, K.A.; et al. Global conservation priorities for marine turtles. PLoS ONE 2011, 6, e24510. [Google Scholar] [CrossRef]
- Allard, M.W.; Miyamoto, M.M.; Bjorndal, K.A.; Bolten, A.B.; Bowen, B.W. Support for natal homing in Green turtles from mitochondrial DNA sequences. Copeia 1994, 1994, 34–41. [Google Scholar] [CrossRef]
- Bass, A.L.; Good, D.A.; Bjorndal, K.A.; Richardson, J.I.; Hillis, Z.-M.; Horrocks, J.A.; Bowen, B.W. Testing models of female reproductive migratory behavior and population structure in the Caribbean hawksbill turtle, Eretmochelys imbricata, with mtDNA sequences. Mol. Ecol. 1996, 5, 321–328. [Google Scholar] [CrossRef]
- Pendoley, K.L.; Bell, C.D.; McCracken, R.; Ball, K.R.; Sherborne, J.; Oates, J.E.; Becker, P.; Vitenbergs, A.; Whittock, P.A. Reproductive biology of the flatback turtle Natator depressus in Western Australia. Endanger. Species Res. 2014, 23, 115–123. [Google Scholar] [CrossRef]
- Briscoe, D.K.; Parker, D.M.; Balazs, G.H.; Kurita, M.; Saito, T.; Okamoto, H.; Rice, M.; Polovina, J.J.; Crowder, L.B. Active dispersal in loggerhead sea turtles (Caretta caretta) during the “lost years”. Proc. R. Soc. B Biol. Sci. 2016, 283, 20160690. [Google Scholar] [CrossRef]
- Wallace, B.P.; Lewison, R.L.; McDonald, S.L.; McDonald, R.K.; Kot, C.Y.; Kelez, S.; Bjorkland, R.K.; Finkbeiner, E.M.; Helmbrecht, S.; Crowder, L.B. Global patterns of marine turtle bycatch. Conserv. Lett. 2010, 3, 131–142. [Google Scholar] [CrossRef]
- Nahill, B. Sea Turtle Research and Conservation: Lessons From Working in the Field, 3rd ed.; Elsevier Academic Press: London, UK, 2021. [Google Scholar]
- Humber, F.; Godley, B.J.; Broderick, A.C. So excellent a fishe: A global overview of legal marine turtle fisheries. Divers. Distrib. 2014, 20, 579–590. [Google Scholar] [CrossRef]
- Brost, B.; Witherington, B.; Meylan, A.; Leone, E.; Ehrhart, L.; Bagley, D. Sea turtle hatchling production from Florida (USA) beaches, 2002–2012, with recommendations for analyzing hatching success. Endanger. Species Res. 2015, 27, 53–68. [Google Scholar] [CrossRef]
- Laloë, J.O.; Cozens, J.; Renom, B.; Taxonera, A.; Hays, G.C. Climate change and temperature-linked hatchling mortality at a globally important sea turtle nesting site. Glob. Chang. Biol. 2017, 23, 4922–4931. [Google Scholar] [CrossRef] [PubMed]
- Environment Canada. CITES Identification Guide—Turtles and Tortoises: Guide to the Identification of Turtles and Tortoises Species Controlled Under the Convention on International Trade in Endangered Species of Wild Fauna and Flora; Environment Canada and PROFEPA (SEMARNAP); Environment Canada and PROFEPA (SEMARNAP): Ottawa, ON, Canada, 1999.
- Bowen, B.W.; Meylan, A.B.; Ross, J.P.; Limpus, C.J.; Balazs, G.H.; Avise, J.C. Global population structure and natural history of the Green turtle (Chelonia mydas) in terms of matriarchal phylogeny. Evolution 1992, 46, 865–881. [Google Scholar] [CrossRef] [PubMed]
- Witt, M.J.; Broderick, A.C.; Coyne, M.S.; Formia, A.; Ngouessono, S.; Parnell, R.J.; Sounguet, G.-P.; Godley, B.J. Satellite tracking highlights difficulties in the design of effective protected areas for Critically Endangered leatherback turtles Dermochelys coriacea during the inter-nesting period. Oryx 2008, 42, 296–300. [Google Scholar] [CrossRef]
- Shamblin, B.M.; Bolten, A.B.; Abreu-Grobois, F.A.; Bjorndal, K.A.; Cardona, L.; Carreras, C.; Clusa, M.; Monzón-Argüello, C.; Nairn, C.J.; Nielsen, J.T.; et al. Geographic Patterns of genetic variation in a broadly distributed marine vertebrate: New insights into Loggerhead turtle stock structure from expanded mitochondrial DNA sequences. PLoS ONE 2014, 9, e85956. [Google Scholar] [CrossRef] [PubMed]
- Godley, B.J.; Richardson, S.; Broderick, A.C.; Coyne, M.S.; Glen, F.; Hays, G.C. Long-term satellite telemetry of the movements and habitat utilization by green turtles in the Mediterranean. Ecography 2002, 25, 352–362. [Google Scholar] [CrossRef]
- Jeffers, V.F.; Godley, B.J. Satellite tracking in sea turtles: How do we find our way to the conservation dividends? Biol. Conserv. 2016, 199, 172–184. [Google Scholar] [CrossRef]
- Calmanovici, B.; Waayers, D.; Reisser, J.; Clifton, J.; Proietti, M. I3S Pattern as a mark-recapture tool to identify captured and free-swimming sea turtles: An assessment. Mar. Ecol. Prog. Ser. 2018, 589, 263–268. [Google Scholar] [CrossRef]
- Broderick, A.C.; Glen, F.; Godley, B.J.; Hays, G.C. Estimating the number of green and loggerhead turtles nesting annually in the Mediterranean. Oryx 2002, 36, 227–235. [Google Scholar] [CrossRef]
- Bourjea, J.; Dalleau, M.; Derville, S.; Beudard, F. Seasonality, abundance, and fifteen-year trend in green turtle nesting activity at Itsamia, Moheli, Comoros. Endanger. Species Res. 2015, 27, 265–276. [Google Scholar] [CrossRef]
- Schultz, E.A. Genetic Analysis, Movement, and Nesting Patterns of the Green Sea Turtle (Chelonia mydas) in St. Croix, Virgin Islands (USA): A Regional Analysis for the Caribbean. Master’s Thesis, Savannah State University, Savannah, GA, USA, 2016. [Google Scholar]
- Barbanti, A.; Martin, C.; Blumenthal, J.M.; Boyle, J.; Broderick, A.C.; Collyer, L.; Ebanks-Petrie, G.; Godley, B.J.; Mustin, W.; Ordóñez, V.; et al. How many came home? Evaluating ex situ conservation of green turtles in the Cayman Islands. Mol. Ecol. 2019, 28, 1637–1651. [Google Scholar] [CrossRef]
- Hof, C.A.M.; Smallwood, E.; Meager, J.; Bell, I.P. First citizen-science population abundance and growth rate estimates for green sea turtles Chelonia mydas foraging in the northern Great Barrier Reef, Australia. Mar. Ecol. Prog. Ser. 2017, 574, 181–191. [Google Scholar] [CrossRef]
- Silva, B.M.G.; Bugoni, L.; Almeida, B.A.D.L.; Giffoni, B.B.; Alvarenga, F.S.; Brondizio, L.S.; Becker, J.H. Long-term trends in abundance of green sea turtles (Chelonia mydas) assessed by non-lethal capture rates in a coastal fishery. Ecol. Indic. 2017, 79, 254–264. [Google Scholar] [CrossRef]
- Moore, J.E.; Cox, T.M.; Lewison, R.L.; Read, A.J.; Bjorkland, R.; McDonald, S.L.; Crowder, L.B.; Aruna, E.; Ayissi, I.; Espeut, P.; et al. An interview-based approach to assess marine mammal and sea turtle captures in artisanal fisheries. Biol. Conserv. 2010, 143, 795–805. [Google Scholar] [CrossRef]
- Schwartz, M.K.; Luikart, G.; Waples, R.S. Genetic characterization as a promising tool for conservation and management. TREE 2007, 22, 25–33. [Google Scholar] [CrossRef]
- Dutton, P.H.; Roden, S.E.; Stewart, K.R.; LaCasella, E.; Tiwari, M.; Formia, A.; Thomé, J.C.; Livingstone, S.R.; Eckert, S.; Chacon-Chaverri, D.; et al. Population stock structure of leatherback turtles (Dermochelys coriacea) in the Atlantic revealed using mtDNA and microsatellite markers. Conserv. Genet. 2013, 14, 625–636. [Google Scholar] [CrossRef]
- Kelez, S.; Velez-Zuazo, X.; Pacheco, A.S. First record of hybridization between green Chelonia mydas and hawksbill Eretmochelys imbricata sea turtles in the Southeast Pacific. PeerJ 2016, 4, e1712. [Google Scholar] [CrossRef] [PubMed]
- Frandsen, H.R.; Figueroa, D.F.; George, J.A. Mitochondrial genomes and genetic structure of the Kemp’s ridley sea turtle (Lepidochelys kempii). Ecol. Evol. 2020, 10, 249–262. [Google Scholar] [CrossRef] [PubMed]
- Dutton, P.H.; LeRoux, R.A.; LaCasella, E.L.; Seminoff, J.A.; Eguchi, T.; Dutton, D.L. Genetic analysis and satellite tracking reveal origin of the green turtles in San Diego Bay. Mar. Biol. 2019, 166, 3. [Google Scholar] [CrossRef]
- Pérez-Espona, S.; ConGRESS Consortium. Conservation genetics in the European Union—Biases, gaps and future directions. Biol. Conserv. 2017, 209, 130–136. [Google Scholar] [CrossRef]
- Tedeschi, J.N.; Mitchell, N.J.; Berry, O.; Whiting, S.; Meekan, M.; Kennington, W.J. Reconstructed paternal genotypes reveal variable rates of multiple paternity at three rookeries of loggerhead sea turtles (Caretta caretta) in Western Australia. Aust. J. Zool. 2015, 62, 454–462. [Google Scholar] [CrossRef]
- Bell, I.P.; Meager, J.J.; Eguchi, T.; Dobbs, K.A.; Miller, J.D.; Madden Hof, C.A. Twenty-eight years of decline: Nesting population demographics and trajectory of the north-east Queensland endangered hawksbill turtle (Eretmochelys imbricata). Biol. Conserv. 2020, 241, 108376. [Google Scholar] [CrossRef]
- Miloslavich, P.; Díaz, J.M.; Klein, E.; Alvarado, J.J.; Díaz, C.; Gobin, J.; Escobar-Briones, E.; Cruz-Motta, J.J.; Weil, E.; Cortés, J.; et al. Marine biodiversity in the Caribbean: Regional estimates and distribution patterns. PLoS ONE 2010, 5, e11916. [Google Scholar] [CrossRef]
- Mansfield, K.L.; Mendilaharsu, M.L.; Putman, N.F.; dei Marcovaldi, M.A.; Sacco, A.E.; Lopez, G.; Pires, T.; Swimmer, Y. First satellite tracks of South Atlantic sea turtle “lost years”: Seasonal variation in trans-equatorial movement. Proc. R. Soc. B Biol. Sci. 2017, 284, 20171730. [Google Scholar] [CrossRef]
- Ceriani, S.A.; Casale, P.; Brost, M.; Leone, E.H.; Witherington, B.E. Conservation implications of sea turtle nesting trends: Elusive recovery of a globally important loggerhead population. Ecosphere 2019, 10, e02936. [Google Scholar] [CrossRef]
- Pilcher, N. Population structure and growth of immature Green turtles at Mantanani, Sabah, Malaysia. J. Herpetol. 2010, 44, 168–171. [Google Scholar] [CrossRef]
- Betts, J.; Young, R.P.; Hilton-Taylor, C.; Hoffmann, M.; Rodríguez, J.P.; Stuart, S.N.; Milner-Gulland, E.J. A framework for evaluating the impact of IUCN Red List of threatened species. Conserv. Biol. 2020, 24, 632–643. [Google Scholar] [CrossRef]
- Adamo, M.; Sousa, R.; Wipf, S.; Correia, R.A.; Lumia, A.; Mucciarelli, M.; Mammola, S. Dimension and impact of biases in funding for species and habitat conservation. Biol. Conserv. 2022, 272, 109636. [Google Scholar] [CrossRef]
- The Laúd OPO Network. Enhanced, coordinated conservation efforts required to avoid extinction of critically endangered Eastern Pacific leatherback turtles. Sci. Rep. 2020, 10, 4772. [Google Scholar] [CrossRef]
- Witmer, G.W. Wildlife population characterization: Some practical considerations. Wildl. Res. 2005, 32, 259–263. [Google Scholar] [CrossRef]
- Plot, V.; de Thoisy, B.; Blanc, S.; Kelle, L.; Lavergne, A.; Roger-Bérubet, H.; Tremblay, Y.; Fossette, S.; Georges, J.-Y. Reproductive synchrony in a recovering bottlenecked sea turtle population. J. Anim. Ecol. 2012, 82, 341–351. [Google Scholar] [CrossRef] [PubMed]
- Mestre, F.; Bragança, M.P.; Nunes, A.; dos Santos, M.E. Satellite tracking of sea turtles released after prolonged captivity periods. Mar. Biol. Res. 2014, 10, 996–1006. [Google Scholar] [CrossRef]
- Abalo-Morla, S.; Marco, A.; Tomás, J.; Revuelta, O.; Abella, E.; Marco, V.; Crespo-Picazo, J.L.; Fernández, C.; Valdés, F.; Arroyo, M.C.; et al. Survival and dispersal routes of head-started loggerhead sea turtle (Caretta caretta) post-hatchlings in the Mediterranean Sea. Mar. Biol. 2018, 165, 51. [Google Scholar] [CrossRef]
- Dethmers, K.E.M.; Broderick, D.; Moritz, C.; Fitzsimmons, N.N.; Limpus, C.L.; Lavery, S.; Whiting, S.; Guinea, M.; Prince, R.I.T.; Kennett, R. The genetic structure of Australasian green turtles (Chelonia mydas): Exploring the geographical scale of genetic exchange. Mol. Ecol. 2006, 15, 3931–3946. [Google Scholar] [CrossRef]
- Velez-Zuazo, X.; Ramos, W.D.; van Dam, R.P.; Diez, C.E.; Abreu-Grobois, A.; McMillan, W.O. Dispersal, recruitment and migratory behaviour in a hawskbill sea turtle aggregation. Mol. Ecol. 2008, 17, 839–853. [Google Scholar] [CrossRef]
- Yang, W.; Wang, Y.; Chen, M. Genetic structure and diversity of green sea turtle (Chelonia mydas) from South China Sea inferred by mtDNA control region sequence. Biochem. Syst. Ecol. 2015, 60, 95–98. [Google Scholar] [CrossRef]
- Hays, G.C.; Hawkes, L.A. Satellite tracking sea turtles: Opportunities and challenges to address key questions. Front. Mar. Sci. 2018, 5, 432. [Google Scholar] [CrossRef]
- Chambault, P.; de Thoisy, B.; Huguin, M.; Martin, J.; Bonola, M.; Etienne, D.; Gresser, J.; Hiélard, G.; Mailles, J.; Védie, F.; et al. Connecting paths between juvenile and adult habitats in the Atlantic green turtle using genetics and satellite tracking. Ecol. Evol. 2018, 8, 12790–12802. [Google Scholar] [CrossRef] [PubMed]
- Warden, M.L.; Haas, H.L.; Richards, P.M.; Rose, K.A.; Hatch, J.M. Characterization trends in sea turtle populations: Walk or fly? Endanger. Species Res. 2017, 34, 323–337. [Google Scholar] [CrossRef]
- Kapurusinghe, T. Sustainable Use of Sea Turtles Benefiting the Local Community in Rekawa Sanctuary, Sri Lanka. In Sea Turtle Research and Conservation, 1st ed.; Nahill, B., Ed.; Elsevier Academic Press: London, UK, 2021; pp. 3–13. [Google Scholar] [CrossRef]
- Blechschmidt, J.; Wittmann, M.J.; Blüml, C. Climate change and Green sea turtle sex ratio—Preventing possible extinction. Genes 2020, 11, 588. [Google Scholar] [CrossRef] [PubMed]
- Chevallier, D.; Girondot, M.; Berzins, R.; Chevalier, J.; de Thoisy, B.; Fretey, J.; Kelle, L.; Lebreton, J.D. Survival and breeding interval of an endangered marine vertebrate, the leatherback turtle Dermochelys coriacea, in French Guiana. Endanger. Species Res. 2020, 41, 153–165. [Google Scholar] [CrossRef]
- Jarne, P.; Lagoda, P.J.L. Microsatellites, from molecules to populations and back. TREE 1996, 11, 424–429. [Google Scholar] [CrossRef] [PubMed]
- Stewart, K.R.; Dutton, P.H. Breeding sex ratios in adult leatherback turtles (Dermochelys coriacea) may compensate for female-biased hatchling sex ratios. PLoS ONE 2014, 9, e88138. [Google Scholar] [CrossRef]
- Loisier, A.; Savelli, M.-P.; Arnal, V.; Claro, F.; Gambaiani, D.; Sénégas, J.B.; Cesarini, C.; Sacchi, J.; Miaud, C.; Montgelard, C. Genetic composition, origin and conservation of loggerhead sea turtles (Caretta caretta) frequenting the French Mediterranean coasts. Mar. Biol. 2021, 168, 52. [Google Scholar] [CrossRef]
- Naro-Maciel, E.; Gaughran, S.J.; Putman, N.F.; Amato, G.; Arengo, F.; Dutton, P.H.; McFadden, K.W.; Vintinner, E.C.; Sterling, E.J. Predicting connectivity of green turtles at Palmyra Atoll, central Pacific: A focus on mtDNA and dispersal modelling. J. R. Soc. Interface 2014, 11, 20130888. [Google Scholar] [CrossRef]
- Lee, P.L.; Schofield, G.; Haughey, R.I.; Mazaris, A.D.; Hays, G.C. A review of patterns of multiple paternity across sea turtle rookeries. Adv. Mar. Biol. 2018, 79, 1–31. [Google Scholar]
- Rees, A.; Alfaro-Shigueto, J.; Barata, P.; Bjorndal, K.A.; Bolten, A.B.; Bourjea, J.; Broderick, A.C.; Campbell, L.; Cardona, L.; Carreras, C.; et al. Are we working towards global research priorities for management and conservation of sea turtles? Endanger. Species Res. 2016, 31, 337–382. [Google Scholar] [CrossRef]
- Roden, S.E.; Morin, P.A.; Frey, A.; Balazs, G.H.; Zarate, P.; Cheng, I.J.; Dutton, P.H. Green turtle population structure in the Pacific: New insights from single nucleotide polymorphisms and microsatellites. Endanger. Species Res. 2013, 20, 227–234. [Google Scholar] [CrossRef]
- Banerjee, S.M.; Komoroske, L.M.; Frey, A.; Hancock-Hanser, B.; Morin, P.A.; Archer, F.I.; Roden, S.; Gaos, A.; Liles, M.J.; Dutton, P.H. Single nucleotide polymorphism markers for genotyping hawksbill turtles (Eretmochelys imbricata). Conserv. Genet. Resour. 2020, 12, 353–356. [Google Scholar] [CrossRef]
- Puckett, E.E. Variability in total project and per sample genotyping costs under varying study designs including with microsatellites or SNPs to answer conservation genetic questions. Conserv. Genet. Resour. 2017, 9, 289–304. [Google Scholar] [CrossRef]
- Natesh, M.; Taylor, R.W.; Truelove, N.K.; Hadly, E.A.; Palumbi, S.R.; Petrov, D.A.; Ramakrishnan, U. Empowering conservation practice with efficient and economical genotyping from poor quality samples. Methods Ecol. Evol. 2019, 10, 853–859. [Google Scholar] [CrossRef] [PubMed]
Figure 1.
Annual trends of the variables assessed from sea turtle population monitoring studies (including population characterization): the total number of publications/studies (a), oceanic regions (b), studies per IUCN conservation status (c), population parameters (d), top five most used field-based methods (e), use of genetic vs. field-based monitoring (f), top five most used genetic markers (g). Statistical significance for all the time series was confirmed by Mann–Kendall tests (p < 0.0001).

Figure 2.
Heat map illustrating the sea turtle population monitoring (including population characterization) effort per coastal region. Colors range from green (low number of studies) to yellow to red (high number of studies). This heat map does not include far-reaching studies (i.e., migratory path studies), as these studies covered entire oceanic regions and cannot be pinpointed to one location. Map prepared with Maptive.

Figure 3.
Percentage of population monitoring studies (including population characterization) that indicated significant positive or stable population trends per species (top graph) or decreasing population trends (bottom graph). Grey bars indicate reporting of those trends before each species’ most recent IUCN Red List species assessment; black bars indicate reporting of significant population trends after the most recent IUCN Red List species assessment.

Figure 4.
Duration (in years) of sea turtle population monitoring studies employing field-based methods. The Y-axis represents the total number of studies per study duration time category.
Figure 4.
Duration (in years) of sea turtle population monitoring studies employing field-based methods. The Y-axis represents the total number of studies per study duration time category.


Table 1.
Variables recorded from the sea turtle population monitoring studies (including population characterization).
Table 1.
Variables recorded from the sea turtle population monitoring studies (including population characterization).
| Variable | Details |
|---|---|
| Species Name | Common and scientific name of all the sea turtle species included in the study |
| Population status | Population trend is increasing, decreasing, or stable |
Publication year | Year of publication of the study |
Publication Details | Title and authors of the study |
| Locations | 257 unique locations categorized by country and oceanic region. These locations varied between studies, as some studies focused on large oceanic areas, and others on smaller gulfs/seas, or specific coastlines. The oceanic regions were defined as northwest, northeast, southwest, and southeast sections of the Atlantic, Pacific, and Indian oceans. Because of the long-distance migration of sea turtles, several studies represented monitoring of sea turtles across entire oceans, and this was recorded as “entire ocean”. When the study was on a particular sea turtle population, the country (or countries) referred to as part of the sampling area was recorded. |
| Population parameters | Divided into 12 categories: abundance (current/historic), gene flow, genetic diversity, habitat range, hybridization, migration, multiple paternity, origin, phylogeny, population structure, sex ratio, and survivability. |
| Type of monitoring | Field-based monitoring methods versus genetic monitoring methods. |
IUCN information | Conservation status; current status, previous status, dates of all assessments, range of the species, and list of threats to the species. Data extracted from the IUCN Red List of Threatened Species website. |
Field-based monitoring | Field-based methods for population monitoring were categorized into 24 unique methods. The top five most commonly used approaches used for time-series analyses were: satellite (satellite tracking of individuals), nest surveys (clutch and egg counts), tagging (capture-mark-recaptures of tagged individuals), existing/historic data (reanalysis of previously published data to establish current population trends), and fishery data (reports from sightings and accidental bycatch). The duration of the field-based monitoring studies was also recorded (i.e., the total observation time used for analysis in these studies). |
Genetic markers | Genetic markers used in genetic monitoring studies. These included: microsatellites, mitochondrial DNA (control region, cytochrome b, cox1, minisatellite, and mitogenome), single nucleotide polymorphisms (SNPs), nuclear sequences (nDNA), and other genetic markers (major histocompatibility complex, transfer RNA, and banded krait minor satellite). |
Disclaimer/Publisher’s Note: The statements, opinions and data contained in all publications are solely those of the individual author(s) and contributor(s) and not of MDPI and/or the editor(s). MDPI and/or the editor(s) disclaim responsibility for any injury to people or property resulting from any ideas, methods, instructions or products referred to in the content. |
© 2024 by the authors. Licensee MDPI, Basel, Switzerland. This article is an open access article distributed under the terms and conditions of the Creative Commons Attribution (CC BY) license (https://creativecommons.org/licenses/by/4.0/).
Share and Cite
MDPI and ACS Style
Hendrix, H.; Pérez-Espona, S. A Systematic Review of Population Monitoring Studies of Sea Turtles and Its Application to Conservation. Diversity 2024, 16, 177. https://doi.org/10.3390/d16030177
AMA Style
Hendrix H, Pérez-Espona S. A Systematic Review of Population Monitoring Studies of Sea Turtles and Its Application to Conservation. Diversity. 2024; 16(3):177. https://doi.org/10.3390/d16030177
Chicago/Turabian StyleHendrix, Haley, and Sílvia Pérez-Espona. 2024. "A Systematic Review of Population Monitoring Studies of Sea Turtles and Its Application to Conservation" Diversity 16, no. 3: 177. https://doi.org/10.3390/d16030177
Note that from the first issue of 2016, this journal uses article numbers instead of page numbers. See further details here.