Article

Assessing the Diversity and Composition of Bacterial Communities across a Wetland, Transition, Upland Gradient in Macon County Alabama

1
Carver Integrative Sustainability Center, Tuskegee, AL 36088, USA
2
Department of Agricultural and Environmental Sciences, Tuskegee University, Tuskegee, AL 36088, USA
3
Department of Food Science Health and Nutrition, Iowa State University, Ames, IA 50011, USA
4
United States Department of Agriculture-Agricultural Research Service-United States Salinity Lab, Riverside, CA 92507, USA
5
Molecular Research LP, Shallowater, TX 79363, USA
*
Author to whom correspondence should be addressed.
Diversity 2013, 5(3), 461-478; https://doi.org/10.3390/d5030461
Submission received: 15 April 2013 / Revised: 29 May 2013 / Accepted: 21 June 2013 / Published: 3 July 2013
(This article belongs to the Special Issue Microbial Ecology and Diversity)

Abstract

:
Wetlands provide essential functions to the ecosphere that range from water filtration to flood control. Current methods of evaluating the quality of wetlands include assessing vegetation, soil type, and period of inundation. With recent advances in molecular and bioinformatic techniques, measurement of the structure and composition of soil bacterial communities have become an alternative to traditional methods of ecological assessment. The objective of the current study was to determine whether soil bacterial community composition and structure changed along a single transect in Macon County, AL. Proteobacteria were the most abundant phyla throughout the soils in the study (ranging from 42.1% to 49.9% of total sequences). Phyla Acidobacteria (37.4%) and Verrucomicrobia (7.0%) were highest in wetland soils, Actinobacteria (14.6%) was highest in the transition area, and Chloroflexi (1.6%) was highest in upland soils. Principle Components Analysis (relative abundance) and Principle Coordinates Analysis (PCoA) (Unifrac weighted metric) plots were generated, showing distinction amongst the ecosystem types through clustering by taxonomic abundance and Unifrac scores at 3% dissimilarity, respectively. Selected soil properties (soil organic carbon and phosphatase enzyme activity) also differed significantly in transition soil ecosystem types, while showing predominance in the wetland area. This study suggests that with further study the structure and composition of soil bacterial communities may eventually be an important indicator of ecological impact in wetland ecosystems.

1. Introduction

Wetlands are considered to be critically essential parts of the biome, as wetland ecosystems provide many ecosystem services, including disturbance regulation, waste treatment, water quality support, habitat enhancement, and food production [1]. Despite these ecosystem services provided, there seems to be a growing issue of wetland loss in the United States. The United States Fish and Wildlife Service (USFWS) estimates that, over a period of 200 years, the lower 48 states have lost about 53 percent of their original wetlands [2]. Although the rate of wetland loss has decreased, the estimated acreage of wetlands in the contiguous United States stands at about 107 million [3], compared to the original approximate estimate of 221.1 million acres [4].
To stymie the loss of wetlands, various mitigation measures have been proposed. Among these, construction of wetlands has become a widely accepted method. Wetlands are currently evaluated based on three distinctive characteristics that they are associated with, namely soils type, vegetation, and hydrology. Based on such wetland characteristics, a variety of assessment methods have been developed to evaluate the effectiveness of wetland mitigation. Although these assessment methods have gained broad support from the regulatory agencies, some have challenged the validity of these evaluation methods [5] and suggested other assessment characteristics [6], while many others have questioned their efficacy in measuring the functional ability of constructed and mitigated wetlands [7,8,9]. The need for a more sensitive measure of the biological and functional status of wetlands has made itself evident.
Microbial processes drive many wetland functions, and thus any change in their communities in response to environmental and anthropogenic perturbation can affect the ability of the wetlands to perform their ecosystem services. For example, the effect of land use changes can be assessed using microbial community metrics such as bacterial community structure and composition [10,11], enzymatic activity [12,13,14], and soil organic carbon [15,16,17,18]. Researchers have tied the status of Soil Organic Carbon (SOC) to the activity of soil enzymes [19,20], including phosphatases [14]. It has even been suggested that these properties be used as indicators of change in wetland systems [20]. Erosion, incomplete mineralization of organic matter, and anoxia are all characteristics of wetlands that have the potential to impact the structure and function of microbial communities. In view of the challenges to existing methods in assessing the ecological characteristics of mitigated wetlands, researchers have suggested developing assessment methods that rely not only on external characteristics but also on function. Thus, it is hypothesized that measurements based on these microbial characteristics may be more appropriate to determine the status of wetlands.
Although bacteria and the extracellular enzymes that accompany their communities have been found to be useful as environmental bioindicators because of sensitivity to changes in land status [10,11,21], as well as their role in soil biogeochemical processes [22] such as phosphorous enrichment [23], there has not been such a study that demonstrates the utility of microbial and functional status of soil communities as indicators of wetland and non-wetland land status. Therefore, it is the objective of this observational study to characterize the soil bacterial communities along a gradient in a forested wetland ecosystem to quantify changes in soil biochemical and microbial properties. It was hypothesized that the wetland soils bacterial communities would be ecologically distinct in their biotic and abiotic properties.

2. Experimental Section

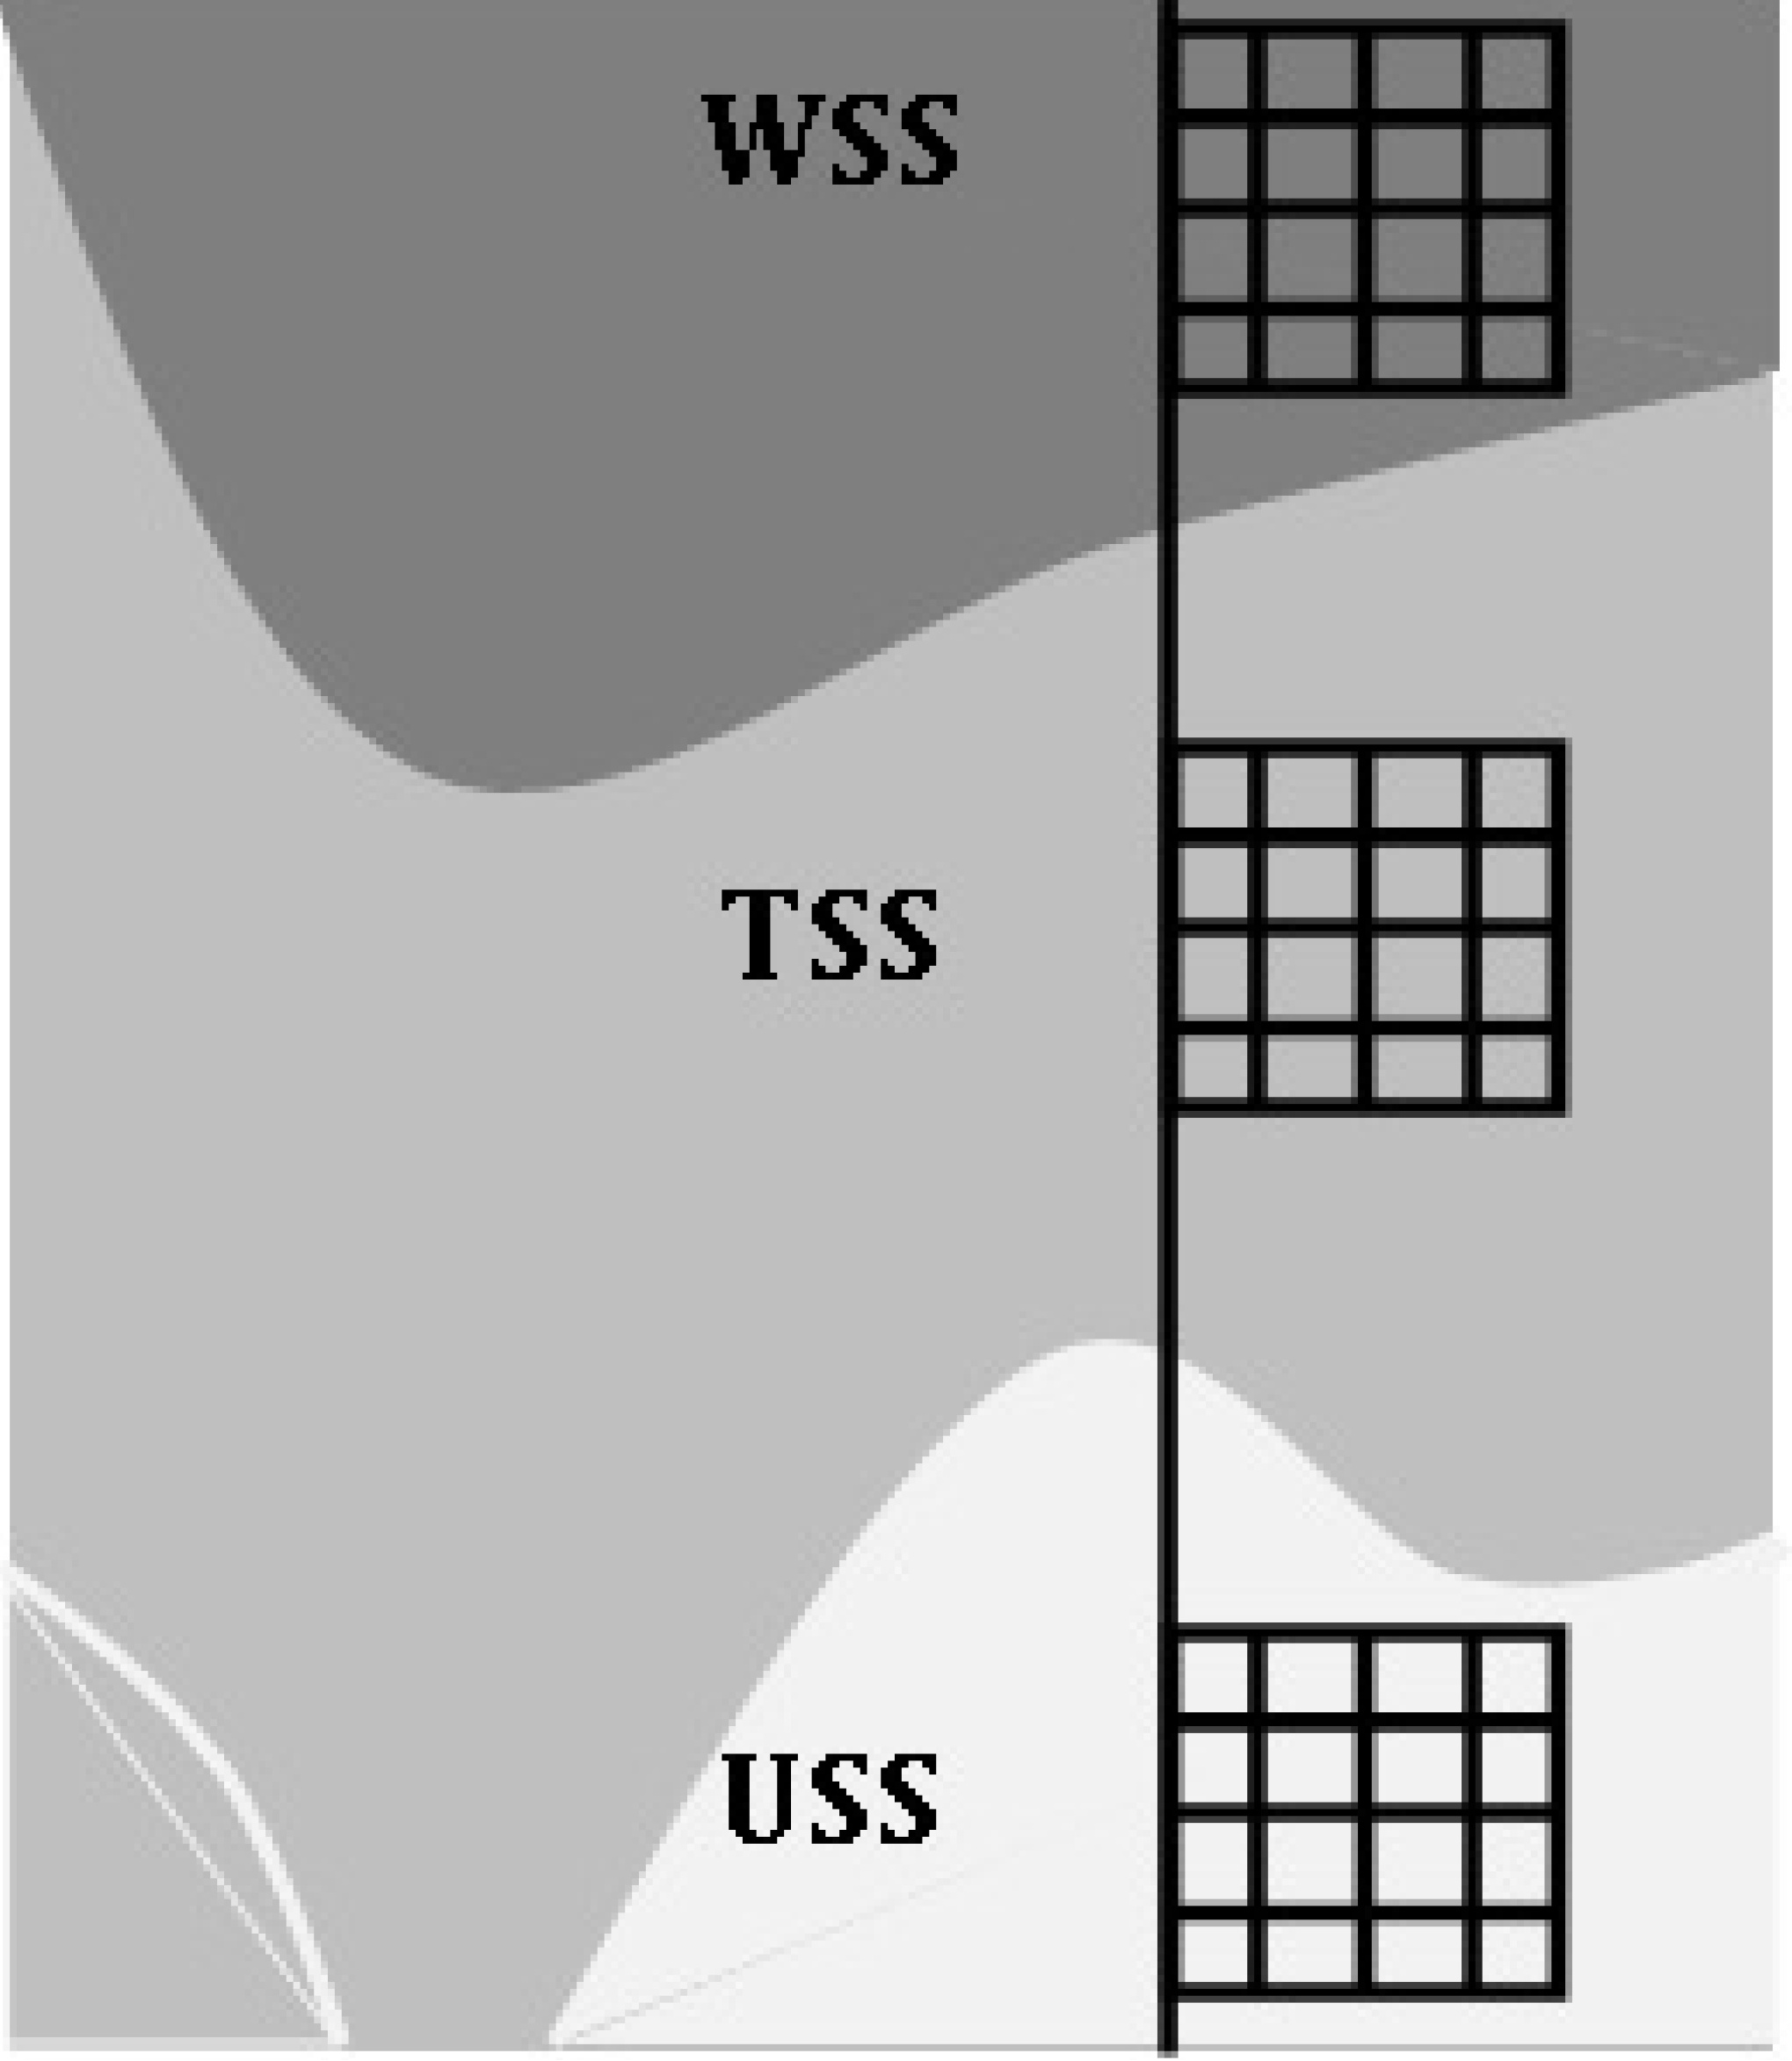
2.1. Sites and Sampling

The study site is a naturally occurring forested wetland located in Russell Plantation, with about 1,690 acres of forested land in Warriorstand, Macon County, AL (N32°21'13'' and W87°32'16''). Russell Plantation was once used for cotton farming and cattle grazing but has been relatively undisturbed since 1935. The main vegetation in the forested wetland area is loblolly pine, spruce pine, southern red oak, willow oak, ironwood, and hickory. The understory vegetation consisted of sweet gum, wateroak, and green ash. The soil type in the wetland sampling site is predominately Urbo-Una-Mooreville complex (UvA) [24], comprised of Urbo and Una soils (fine, mixed, active, acid, thermic Typic Epiaquepts), Mooreville soils (fine-loamy, siliceous, active, thermic Fluvaquentic Dystrudepts), and the minor soil Lynchburg (LyA) (fine-loamy, siliceous, semiactive, thermic Aeric Paleaquults). According to the NRCS Macon County Soil Survey [24], flooding occurs for brief periods from December through April, with varying depths (45.72 to 91.44 cm). The transition soils are eroded Oktibbeha clay loam with one to five percent slopes (OkC2) and 5–15 percent slope (OkE2), respectively [24]. The soil types of the upland area are predominately Oktibbeha (very-fine, smectitic, thermic Chromic Dystruderts), a clay loam with 5–15 percent slope (OkE2).
Three grids were constructed with 25 sampling points in each (Figure 1), resulting in three sampling areas connected by a transect, running North to South, and differing in vegetation and hydrology characteristics. The resulting sampling areas were regarded as three distinct land systems and were identified as the wetland soil system (WSS), transition soil system (TSS), and upland soil system (USS). For the purpose of obtaining uniform samples across each of the selected sites, a sampling grid (5 ft × 5 ft, with 75 ft spacing between potential sampling units in vertical and horizontal directions) was constructed for each of the three identified zones (Figure 1). Soil samples were collected (120 g), and chemical/biochemical analyses were carried out on each of the 25 sampling points in each area. For the purpose of microbial analysis, nine sampling units were randomly selected and collected using a soil auger to a depth of 0–15cm from each of the grids. Samples were placed in polyethylene bags and put on ice during transport back to the laboratory for analysis. Soils were kept at 4 °C until DNA extraction.
Figure 1. A layout of the study site in Macon County Alabama.
Diversity 05 00461 g001
Legend: Upland (USS), Transition (TSS), and Wetland (WSS) soil systems are set along a north-running transect. (5 ft × 5 ft, with 75 ft spacing between potential sampling units in vertical and horizontal directions) was constructed for each of the three identified zones (Figure 1). Soil samples were collected (120 g), and chemical/biochemical analyses were carried out on each of the 25 sampling points in each area. For the purpose of microbial analysis, nine sampling units were randomly selected and collected using a soil auger to a depth of 0–15 cm from each of the grids. Samples were placed in polyethylene bags and put on ice during transport back to the laboratory for analysis. Soils were kept at 4 °C until DNA extraction.

2.2. Soil pH and SOC

Samples were analyzed for pH (1:2, soil/water) with a Fisher pH meter (Fisher Scientific, Pittsburgh, PA, USA). For soil organic carbon (SOC), air-dried soils were analyzed using the dry combustion method in a Vario EL III CHNS Elemental Analyzer (Elementar Americas, Inc., Mt. Laurel, NJ, USA).

2.3. Soil Enzyme Activity

Enzyme analysis was performed according to the methods of Tabatabai [25], with slight modification. The artificial substrate, p-nitrophenyl (1 mL, 0.05 M), and a pH buffer (pH values were 11 for Acid Phosphatase [APA] and 6.5 for Acid Phosphatase [ACP]) were incubated in 25 mL glass flasks and capped at 37 °C for 1 h with 1 g of soil. At the end of incubation, enzyme activity was stopped by addition of 4 mL of 0.5 M NaOH for phosphomonoesterases followed by extraction with 1 mL of 0.5 M CaCl2. The mixture was then filtered (Whatman No. 2) and the extract analyzed using a Genesys 10 VIS spectrophotometer at (Thermo Fisher Scientific Inc., Waltham, MA, USA) at 420 nm. Enzyme activity in filtrates was determined from a standard curve developed using p-nitrophenol standards. To account for non-enzymatic hydrolysis, values for controls were subtracted from sample readings. Toluene was not used in accordance with Bandick and Dick [26] and Elsgaard et al. [27], who showed that with incubation periods fewer than two hours, the absence of toluene was inconsequential to measured enzyme activity. All enzyme activities reported were expressed on a moisture-free basis.

2.4. DNA Extraction, Amplification, and Sequencing

For molecular analysis of community DNA, nine soil samples were randomly selected from the soil samples within each of the three strata. DNA was extracted from these soil samples for each of the three strata and composited following extraction and validation (providing three representative samples per land use system). DNA was extracted from approximately 0.25 g of soil (oven dry basis of field-moist soil) using the Power Soil Extraction Kit (MO BIO Laboratories, Soloana Beach, CA, USA) according to the included protocol. Extracted DNA (2 µL) was quantified using Nanodrop ND-1000 spectrophotometer (Nanodrop Technologies, Wilmington, DE, USA), and run on 0.8% agarose gel with 0.5 M TBE buffer. The samples were then submitted to Research and Testing Laboratories (Lubbock, TX, USA) for PCR optimization and pyrosequencing analysis. Bacterial tag-encoded FLX amplicon pyrosequencing PCR, massively parallel pyrosequencing and tag design were carried out according to procedure described previously by Dowd et al. [28,29].
Samples were evaluated using Tag-encoded FLX amplicon pyrosequencing (bTEFAP), which has had prior description and utilization by Dowd et al. [28,29] in characterizing bacterial populations in a variety of studies [10,26,27]. All DNA samples were diluted to 20 ng/µL. A 20 ng (1 µL) aliquot of each sample DNA was used for a 25 µL PCR reaction with 5 min denature at 95 °C, 30 cycles of 94 °C 30 s; –52 °C 40 s; –70 °C 40 s; with a final extension of 70 °C for 5 min. The 16 S universal Eubacterial primers 28 F (5′- GGC GVA CGG GTG AGT AA) and 530 R (5′-CCG CNG CNG CTG GCA CS) Amplicons were mixed in equal volumes and purified using Agencourt Ampure beads (Agencourt Bioscience Corporation, MA, USA). In preparation for FLX sequencing (Roche, Nutley, NJ, USA), the DNA fragments size and concentration were measured by using DNA chips under a Bio-Rad Experion Automated Electrophoresis Station (Bio-Rad Laboratories, Hercules, CA, USA) and a TBS-380 Fluorometer (Promega Corporation, Madison, WI, USA). A 9.6 × 10⁶ sample of double-stranded DNA molecules/µL with an average size of 625 bp were combined with 9.6 million DNA capture beads, and then amplified by emulsion PCR. After bead recovery and bead enrichment, the bead-attached DNAs were denatured with NaOH, and sequencing primers were annealed. The 454 Titanium sequencing run was performed on a 70 × 75 GS PicoTiterPlate by using a Genome Sequencer FLX System (Roche, Nutley, NJ, USA).

2.5. Bioinformatics and Statistical Analysis

Quality trimmed sequences and hierarchal taxonomic data were provided with the sequencing services following the process described earlier [10]. As described in the previously mentioned studies, each sequence was trimmed to utilize only high quality sequence information; tags were extracted from the FLX generated multi-FASTA file, while being parsed into individual sample specific files based upon the tag sequence. Tags which did not have 100% homology to the original sample tag designation were not considered. Sequences which were less than 250 bp after quality trimming were not considered. The B2C2 software [30], which is described and freely available from Research and Testing Laboratory (Lubbock, TX, USA), was used to deplete samples of definite chimeras. Further processing and OTU based analyses were then carried out using the MOTHUR v.1.19.4 [31] suite of algorithms for sequence processing and diversity analysis. The resulting clusters were assessed at 3% and 5% dissimilarity to provide the data needed for diversity analysis. Based upon the literature, we can expect that 0% dissimilarity in sequences will provide dramatic overestimation of the species present in a sample [32]. The sequences contained within the curated 16S database were those considered of high quality based upon RDP-II [33] standards and which had complete taxonomic information within their annotations. Clusters at 3% and 5% were then utilized to generate rarefaction curves and the (diversity) indices Ace and Chao1 [34,35] as well as weighted UniFrac for Principle Coordinate Analysis (PCoA) plots.
All means testing was performed using the SPSS package (SPSS Inc, v 17.0, Chicago, IL, USA). The generalized linear model (GLM) was used to assess the means of soil physical, chemical and microbial properties among the systems followed by a Tukey’s HSD test for pairwise comparisons. Relative abundance data was presented as percentages/proportions, but prior to subjection to GLM, they were transformed using the arcsine function for normal distribution prior to analysis. Principal Components Analysis (PCA) and factor analysis (XLStat 7.5, Addinsoft) were used to determine the interaction of soil properties across the field site. Factor analysis was used to group the retained variables into statistical factors based on their correlation structure. To eliminate the effect of different units of variables, factor analysis was done using the correlation matrix on the standardized values of the measured soil properties. Using the correlation matrix, principal components (factors) with eigenvalues > 1 were retained and subjected to varimax rotation with Kaiser to estimate the proportion of the variance of each attribute explained by each selected factor loadings.

3. Results

3.1. Soil Properties

3.1.1. Physio- and Biochemical Properties

The differences detected in soil pH among the three land types showed significance between TSS and the USS soils (p < 0.01), while WSS soil pH, unlike the others, showed no difference (Table 1). Significant differences were also observed in SOC content in the three areas (Table 1). Not only did the TSS show the lowest pH, but it also showed the lowest percentage of SOC as well. This value was significant only in its comparison to WSS and TSS, as they expressed the highest and lowest percent SOC. The SOC value of the USS area was seemingly close to that of the WSS area; however, it was significantly lower. In general, the WSS soils had the highest activity, and the TSS soils had the lowest activity for both enzymes.

3.1.2. Bacterial Richness

The maximum operational taxonomic units (OTUs) detected across the study site according to the observed clusters (sobs) at 3% dissimilarity was 1286 (Table 1) from WSS sample 1, although the highest mean for sobs was found in the USS at approximately 1105 OTUs. The maximum amount of OTUs observed is also reflected in the other richness estimators predicted for the samples with the exception of the Shannon-Wiener diversity index that was greatest for USS sample 2. Though the highest values for richness and diversity were observed and predicted for these particular samples, the richness values were quite variable. The means of all of the selected indices followed a distinct trend of marginal difference between USS and WSS, with TSS values noticeably lower than both. That trend demonstrated a soil ecosystem in which the lowest number of OTUs was found in soils sampled in transitional areas of topography, vegetation, and hydrology. The indices reflected the same trend when calculated at 5% dissimilarity; however, no significant differences were found between the soil systems for any of the diversity estimators.
Table 1. Soil chemical, biochemical, and microbial properties.
USSTSSWSS
Soil Chemical Properties
pH5.21a4.915.03a
SOC1.57a0.731.67a
Soil Enzymatic Properties
ACP1.10a0.501.41a
APA0.090.040.24a
Soil Bacterial Diversity/Richness*
Shannon5.384.805.20
Sobs11058631040
Chao1353023853545
ACE712644496960
Legend: Measurements and estimates of soil chemical, biochemical, and microbial properties are presented for each of the designated land systems. *The four indices were used to assess species diversity and richness. The Shannon index has no units, while the other three indices measure operational taxonomic units.

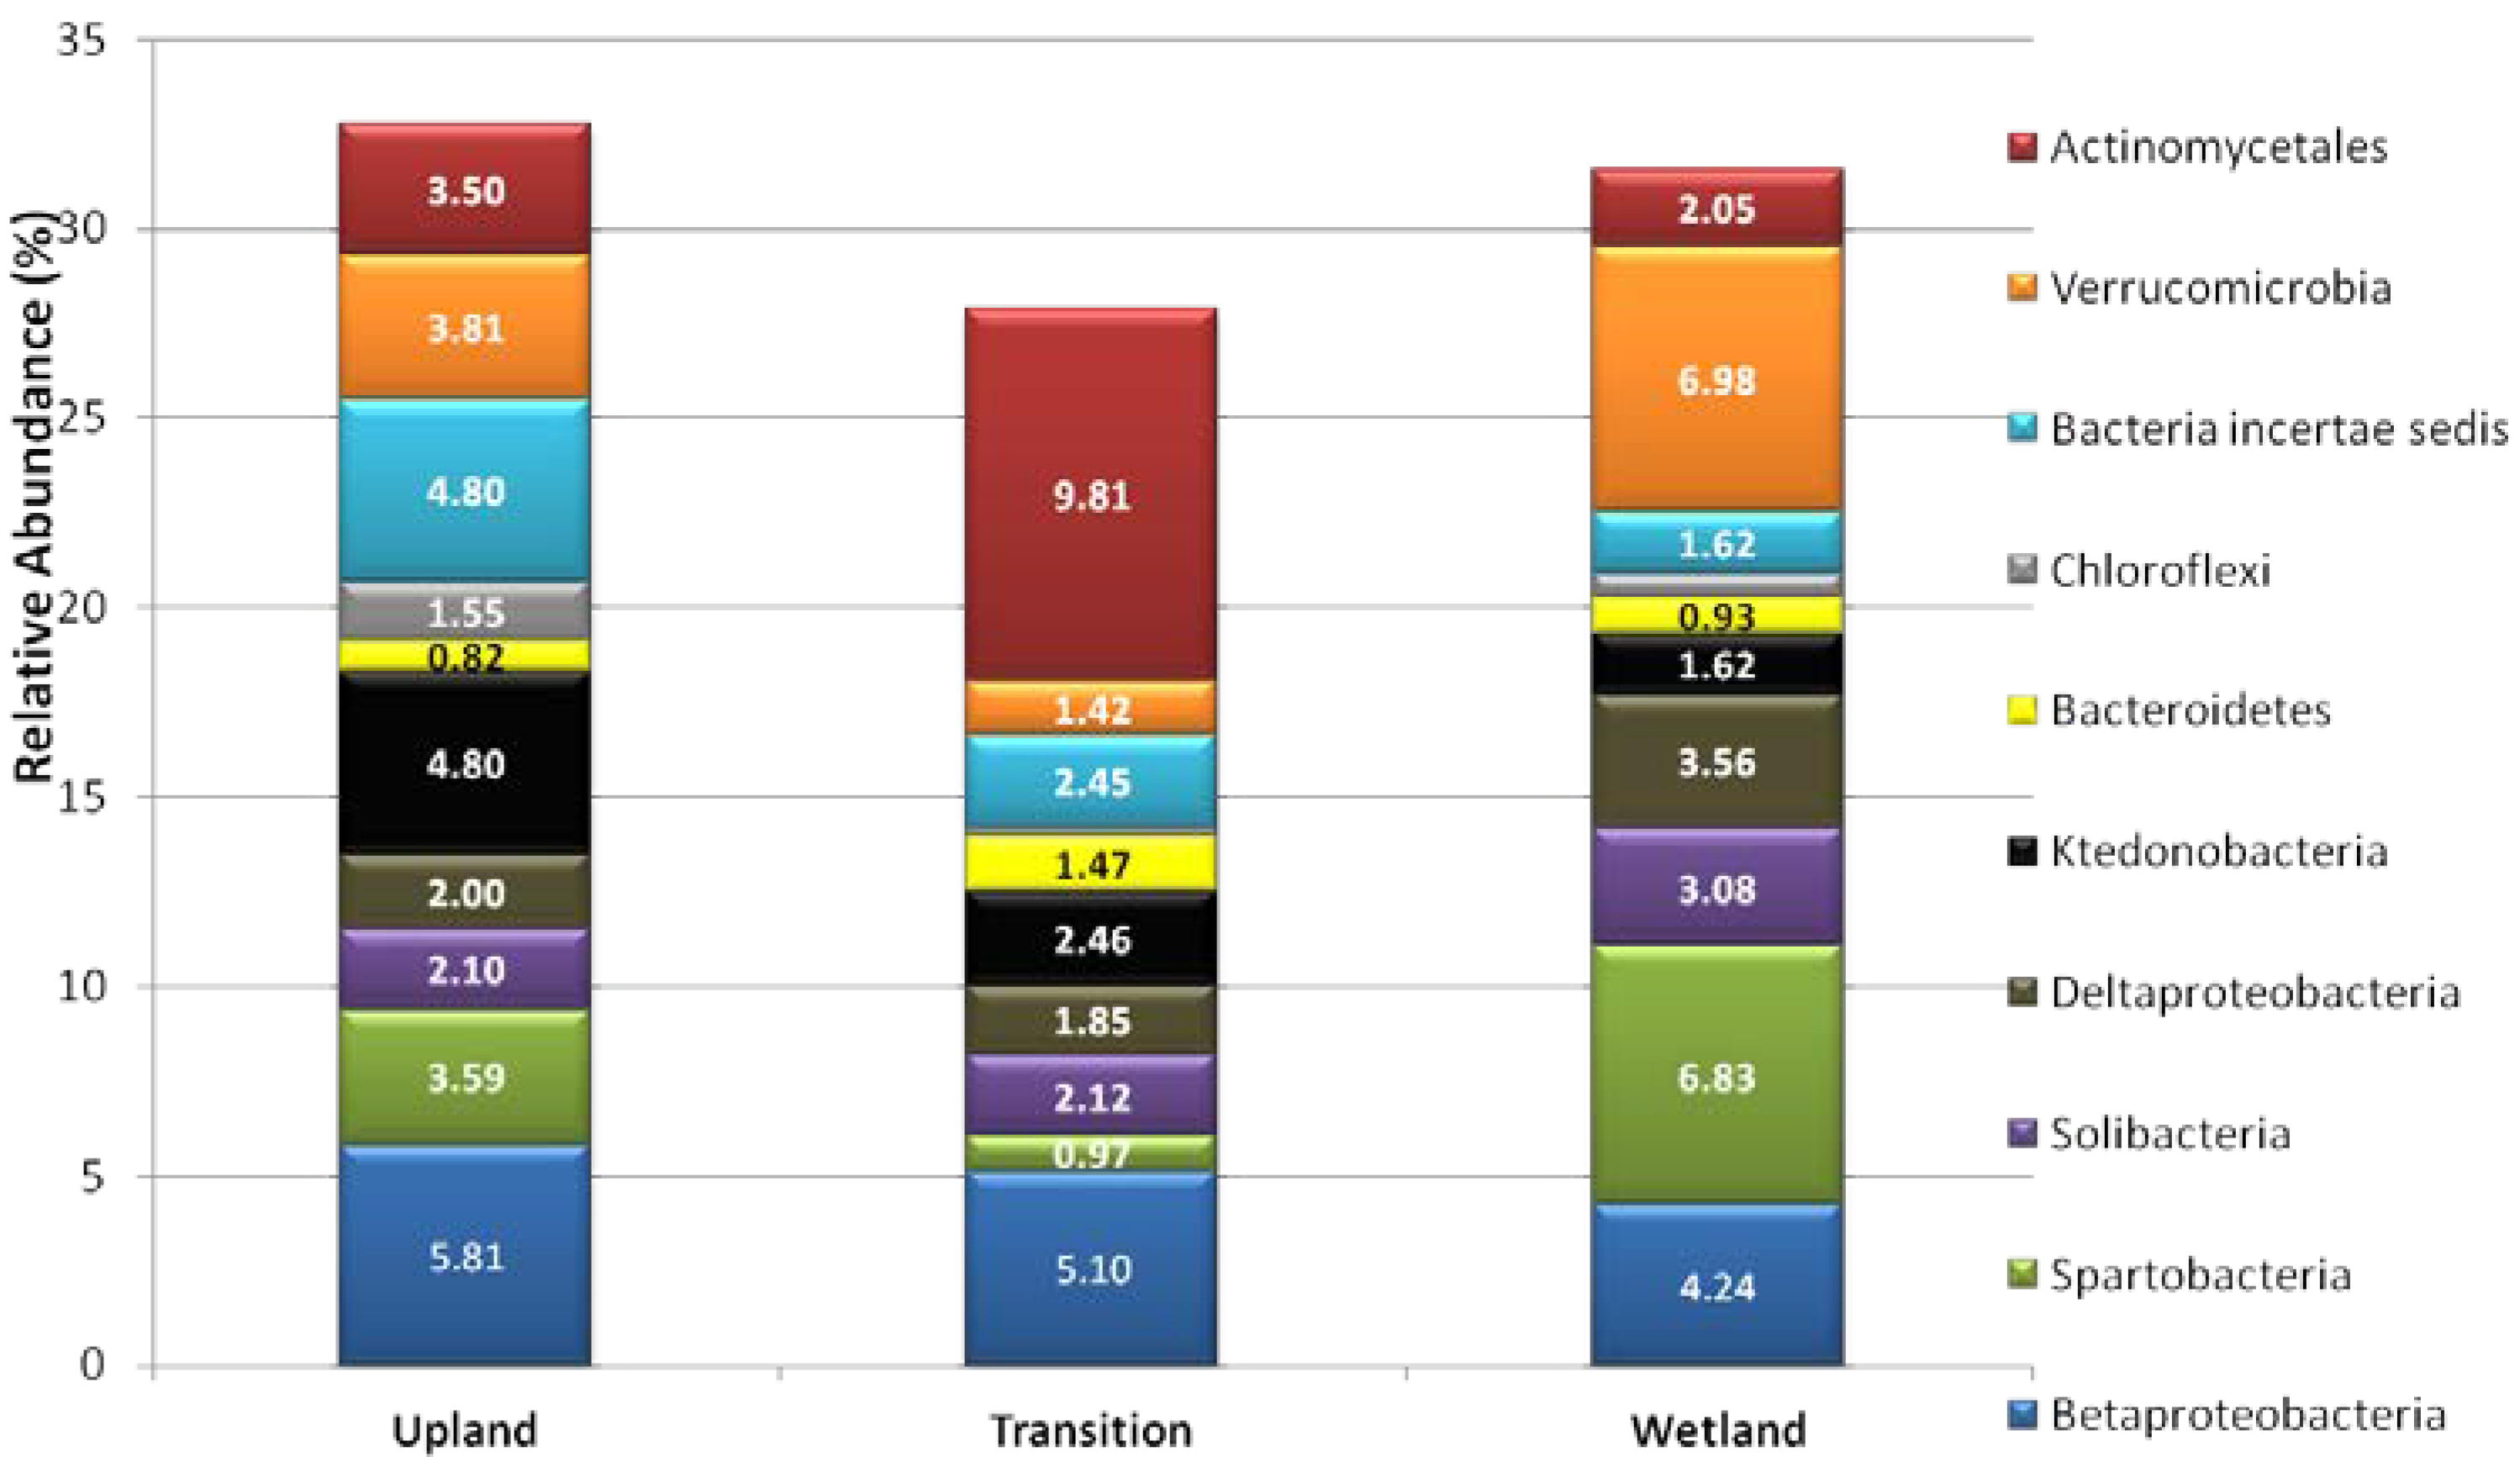
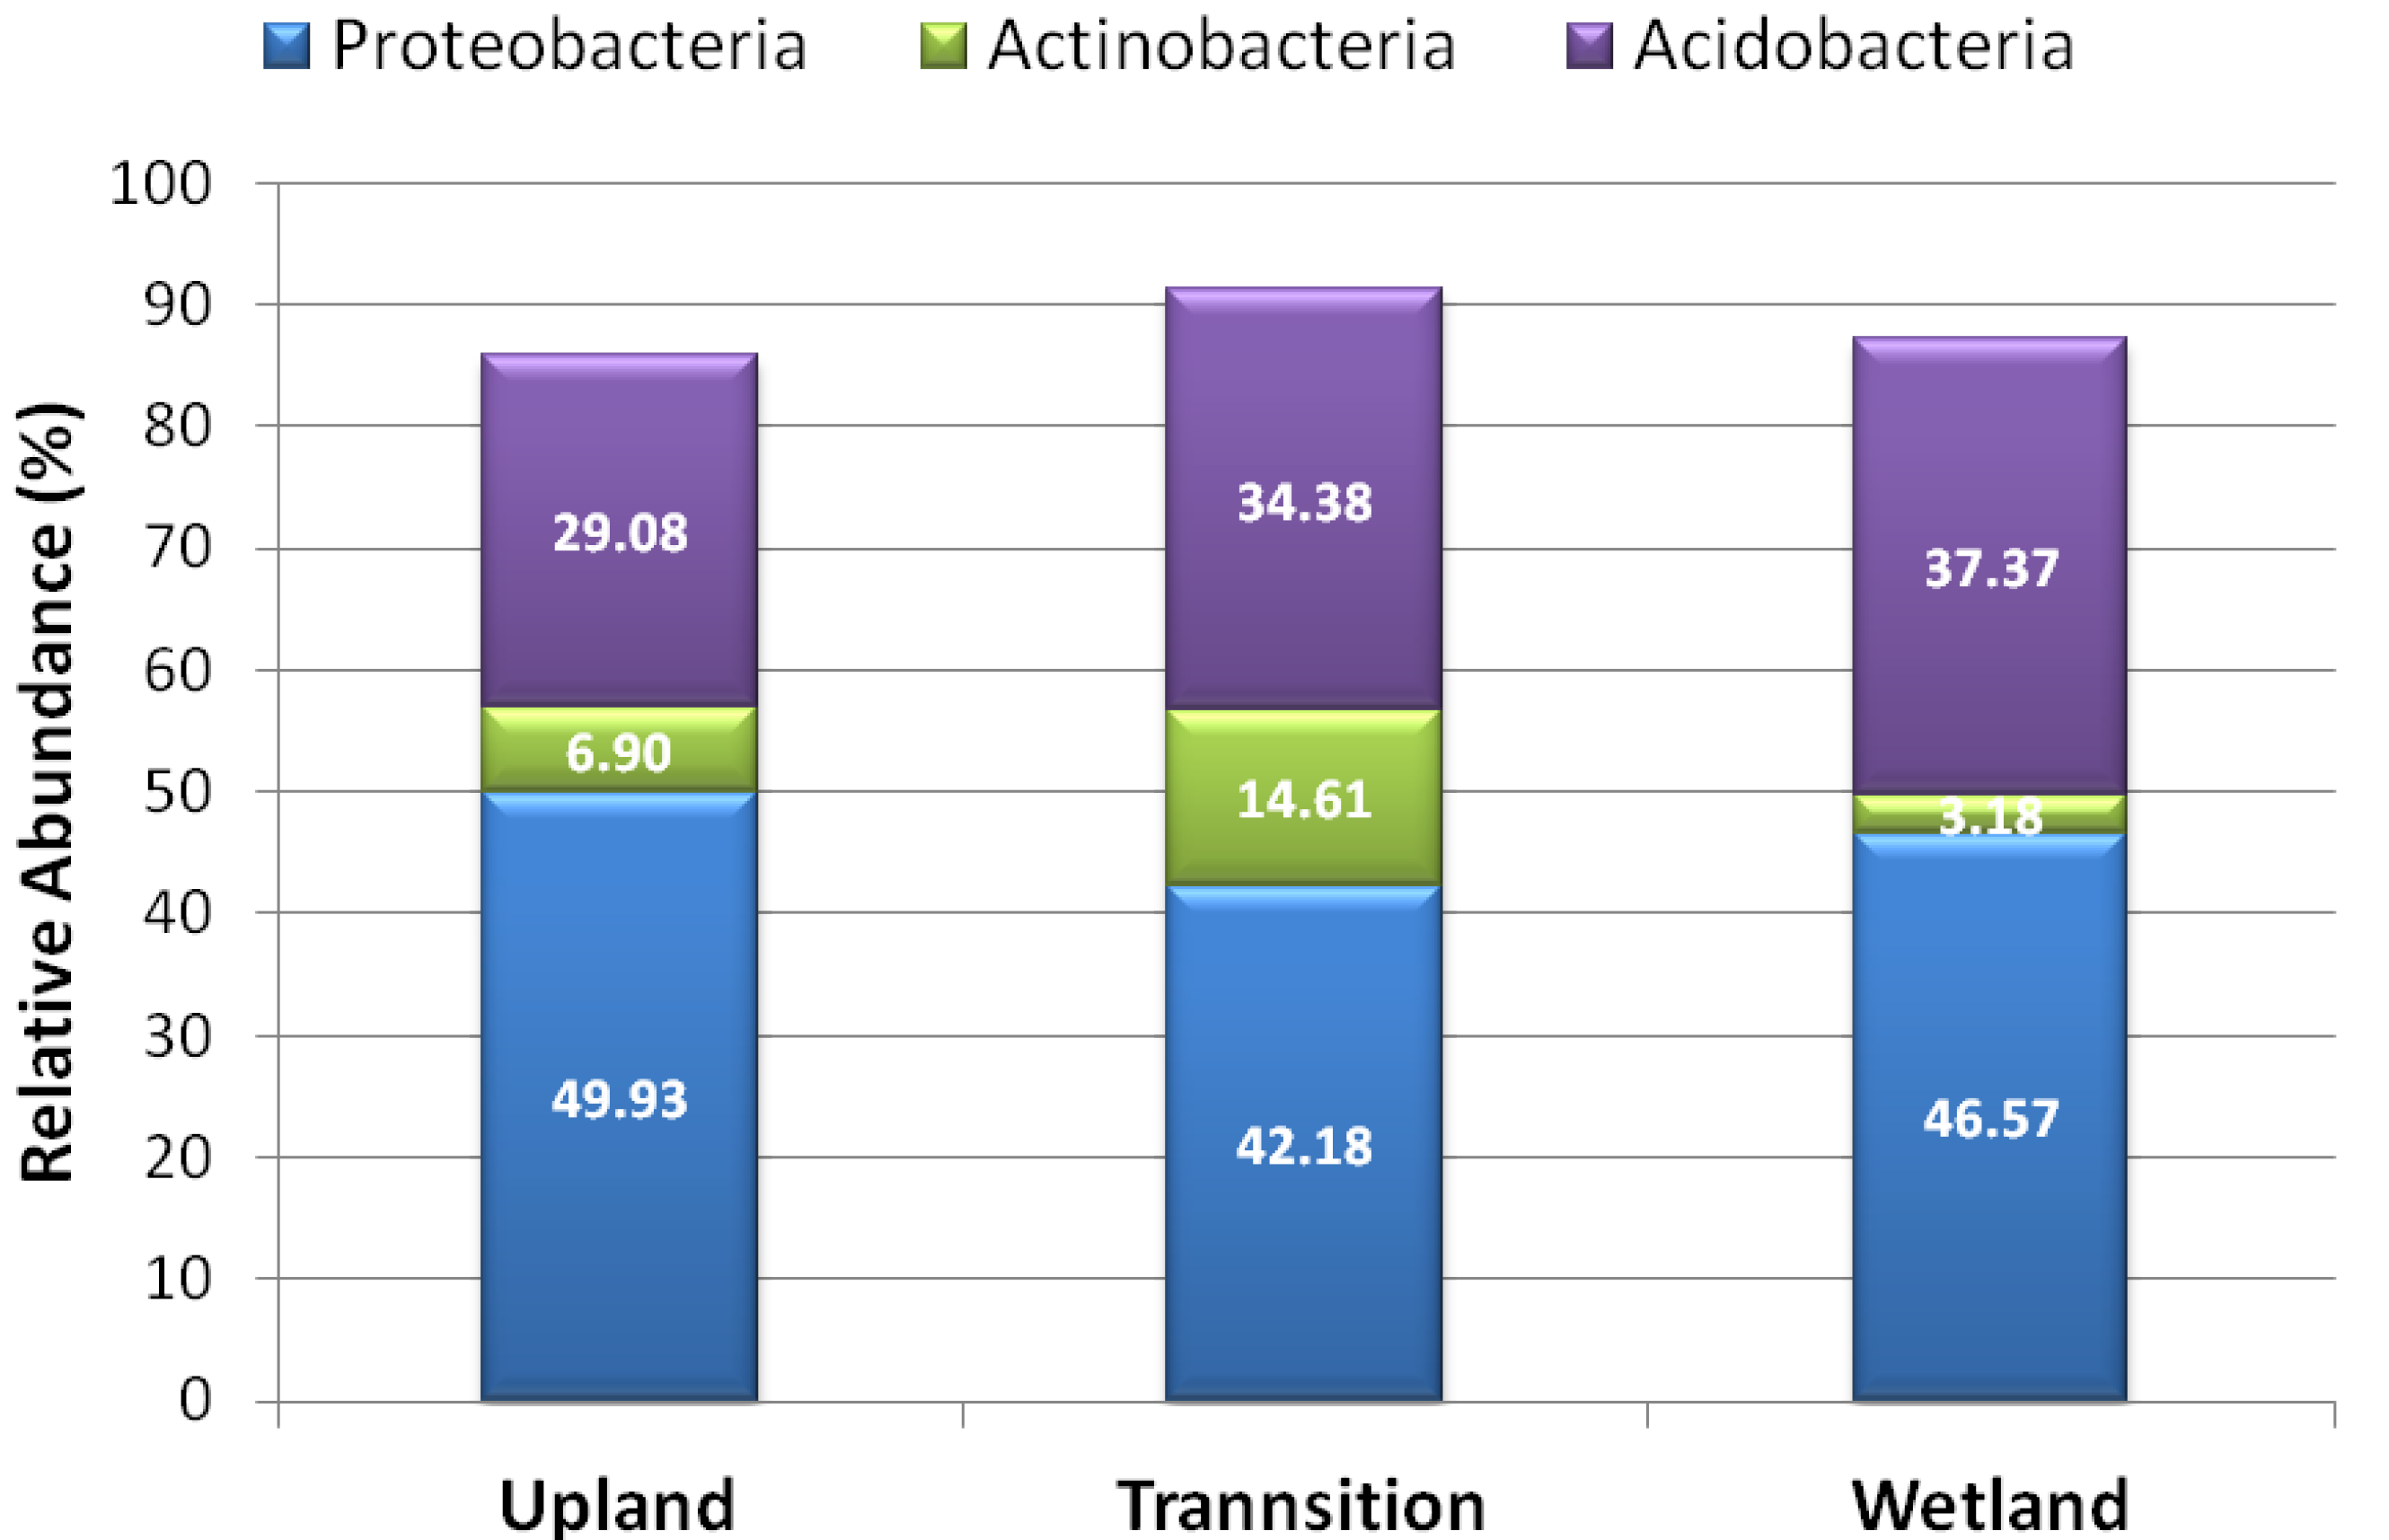
3.2. Relative Abundance of Selected Taxa

Relative abundance of bacterial taxa were examined for those taxa at the level of phyla, class, and order to determine if there were any significant shifts in the composition of the bacterial communities according to the land types presented. The relative abundance of the three major phyla associated with soil bacterial communities are presented in Figure 2, with the 10 most abundant taxa between these phyla, class, and order levels of taxonomy presented in Figure 3. The major phyla distribution showed that Proteobacteria was the most dominant phyla in the soil communities, with the other two dominant phyla being Actinobacteria and Acidobacteria. Acidobacteria exhibited their lowest relative abundance in the USS (p < 0.05), while Actinobacteria showed significant distinction with its greatest relative abundance (p ≤ 0.05) under the TSS.
Figure 2. The relative abundance of the top three phyla.
Diversity 05 00461 g002
Legend: Actinobacteria, Proteobacteria, and Acidobacteria are presented as the most dominant soil bacterial phyla in the study.
Figure 3. A representation of significant taxa at lower relative abundance values.
Diversity 05 00461 g003
Legend: The classes of Proteobacteria, some of the most abundant Orders, and less abundant phyla are presented to contrast their relative abundance across the study site.
The remaining taxa accounted for fewer than 10% of the relative abundance observed and were designated as minor (reference to relative abundance only) in Figure 3. Of these groups, δ-proteobacteria showed significantly lower relative abundance in the WSS (P ≤ 0.05), while Chloroflexi (P < 0.05) showed significantly its highest relative abundance in the USS. Other significant differences (P < 0.05) observed in taxa were Spartobacteria between the USS and TSS, and for Solibacteria between the USS and WSS.
The species-level of relative abundance was also examined for the top 12 species that were present at the study site. Rhodoplanes roseus in the USS was the species found in the highest relative abundance, with its value in the TSS at a close second (Table 2). Rhodoplanes roseus and Syntrophus aciditrophicus were the only two species that were significantly distinguishable in the WSS (p < 0.05) in which Rhodoplanes roseus was at its least, and Syntrophus aciditrophicus at its greatest. Species that were found to have their highest relative abundance in TSS were Cryptosporangium minutisporogium, Mycobacterium holsaticum, and Nonomuraea kusteri.
Table 2. A presentation of relative abundance of identified species observed across the study.
SpeciesUplandTransitionWetland
Acidiphilium cryptum0.67a1.62b1.37ab
Acidisphaera rubrifaciens0.34a1.61b0.57ab
Acidothermus cellulolyticus0.34a0.97b0.32ab
Caldilinea sp1.06a0.090.31
Candidatus Reyranella sp1.820.920.40
Conexibacter woesei0.34ab1.45a0.02b
Cryptosporangium minutisporangium0.190.93a0.04
Marinobacter excellens1.51ab0.61a2.17b
Mycobacterium holsaticum0.051.47a0.00
Nonomuraea kuesteri0.241.04a0.09
Rhodoplanes roseus3.883.751.46a
Syntrophus aciditrophicus0.410.131.30a
Legend: The top 12 species found across the study site are presented. Significant differences are designated by different lower case letters (p < 0.05).

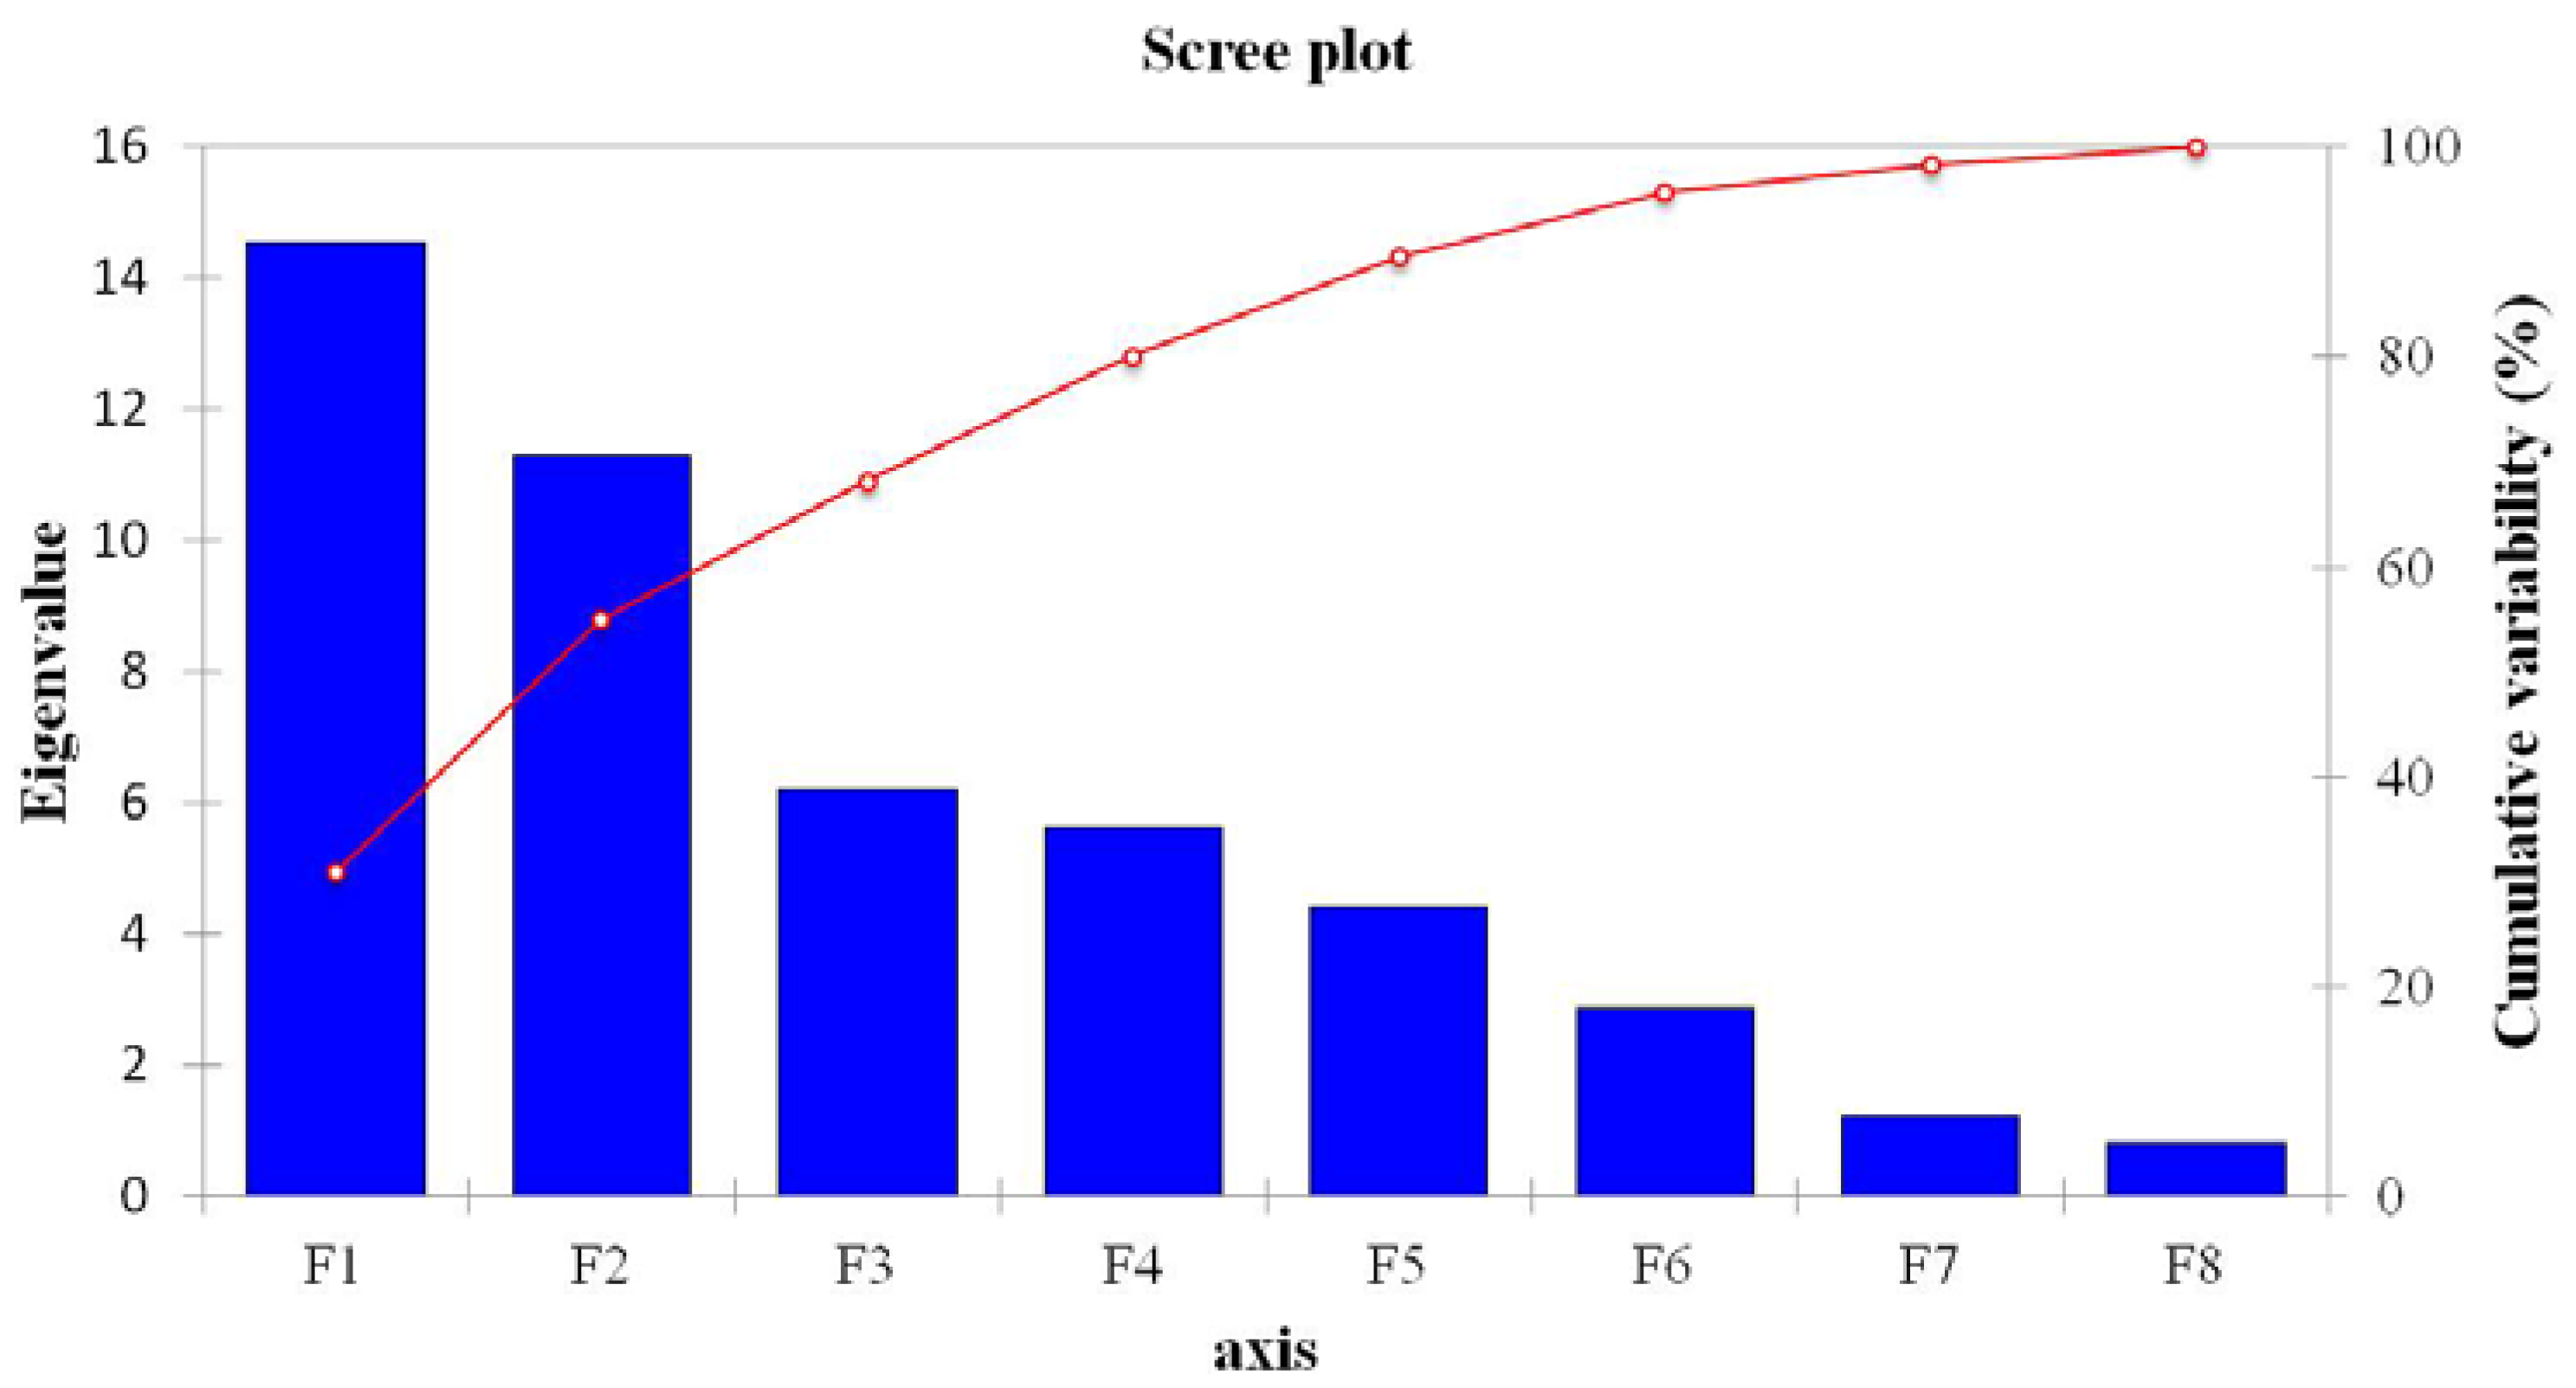
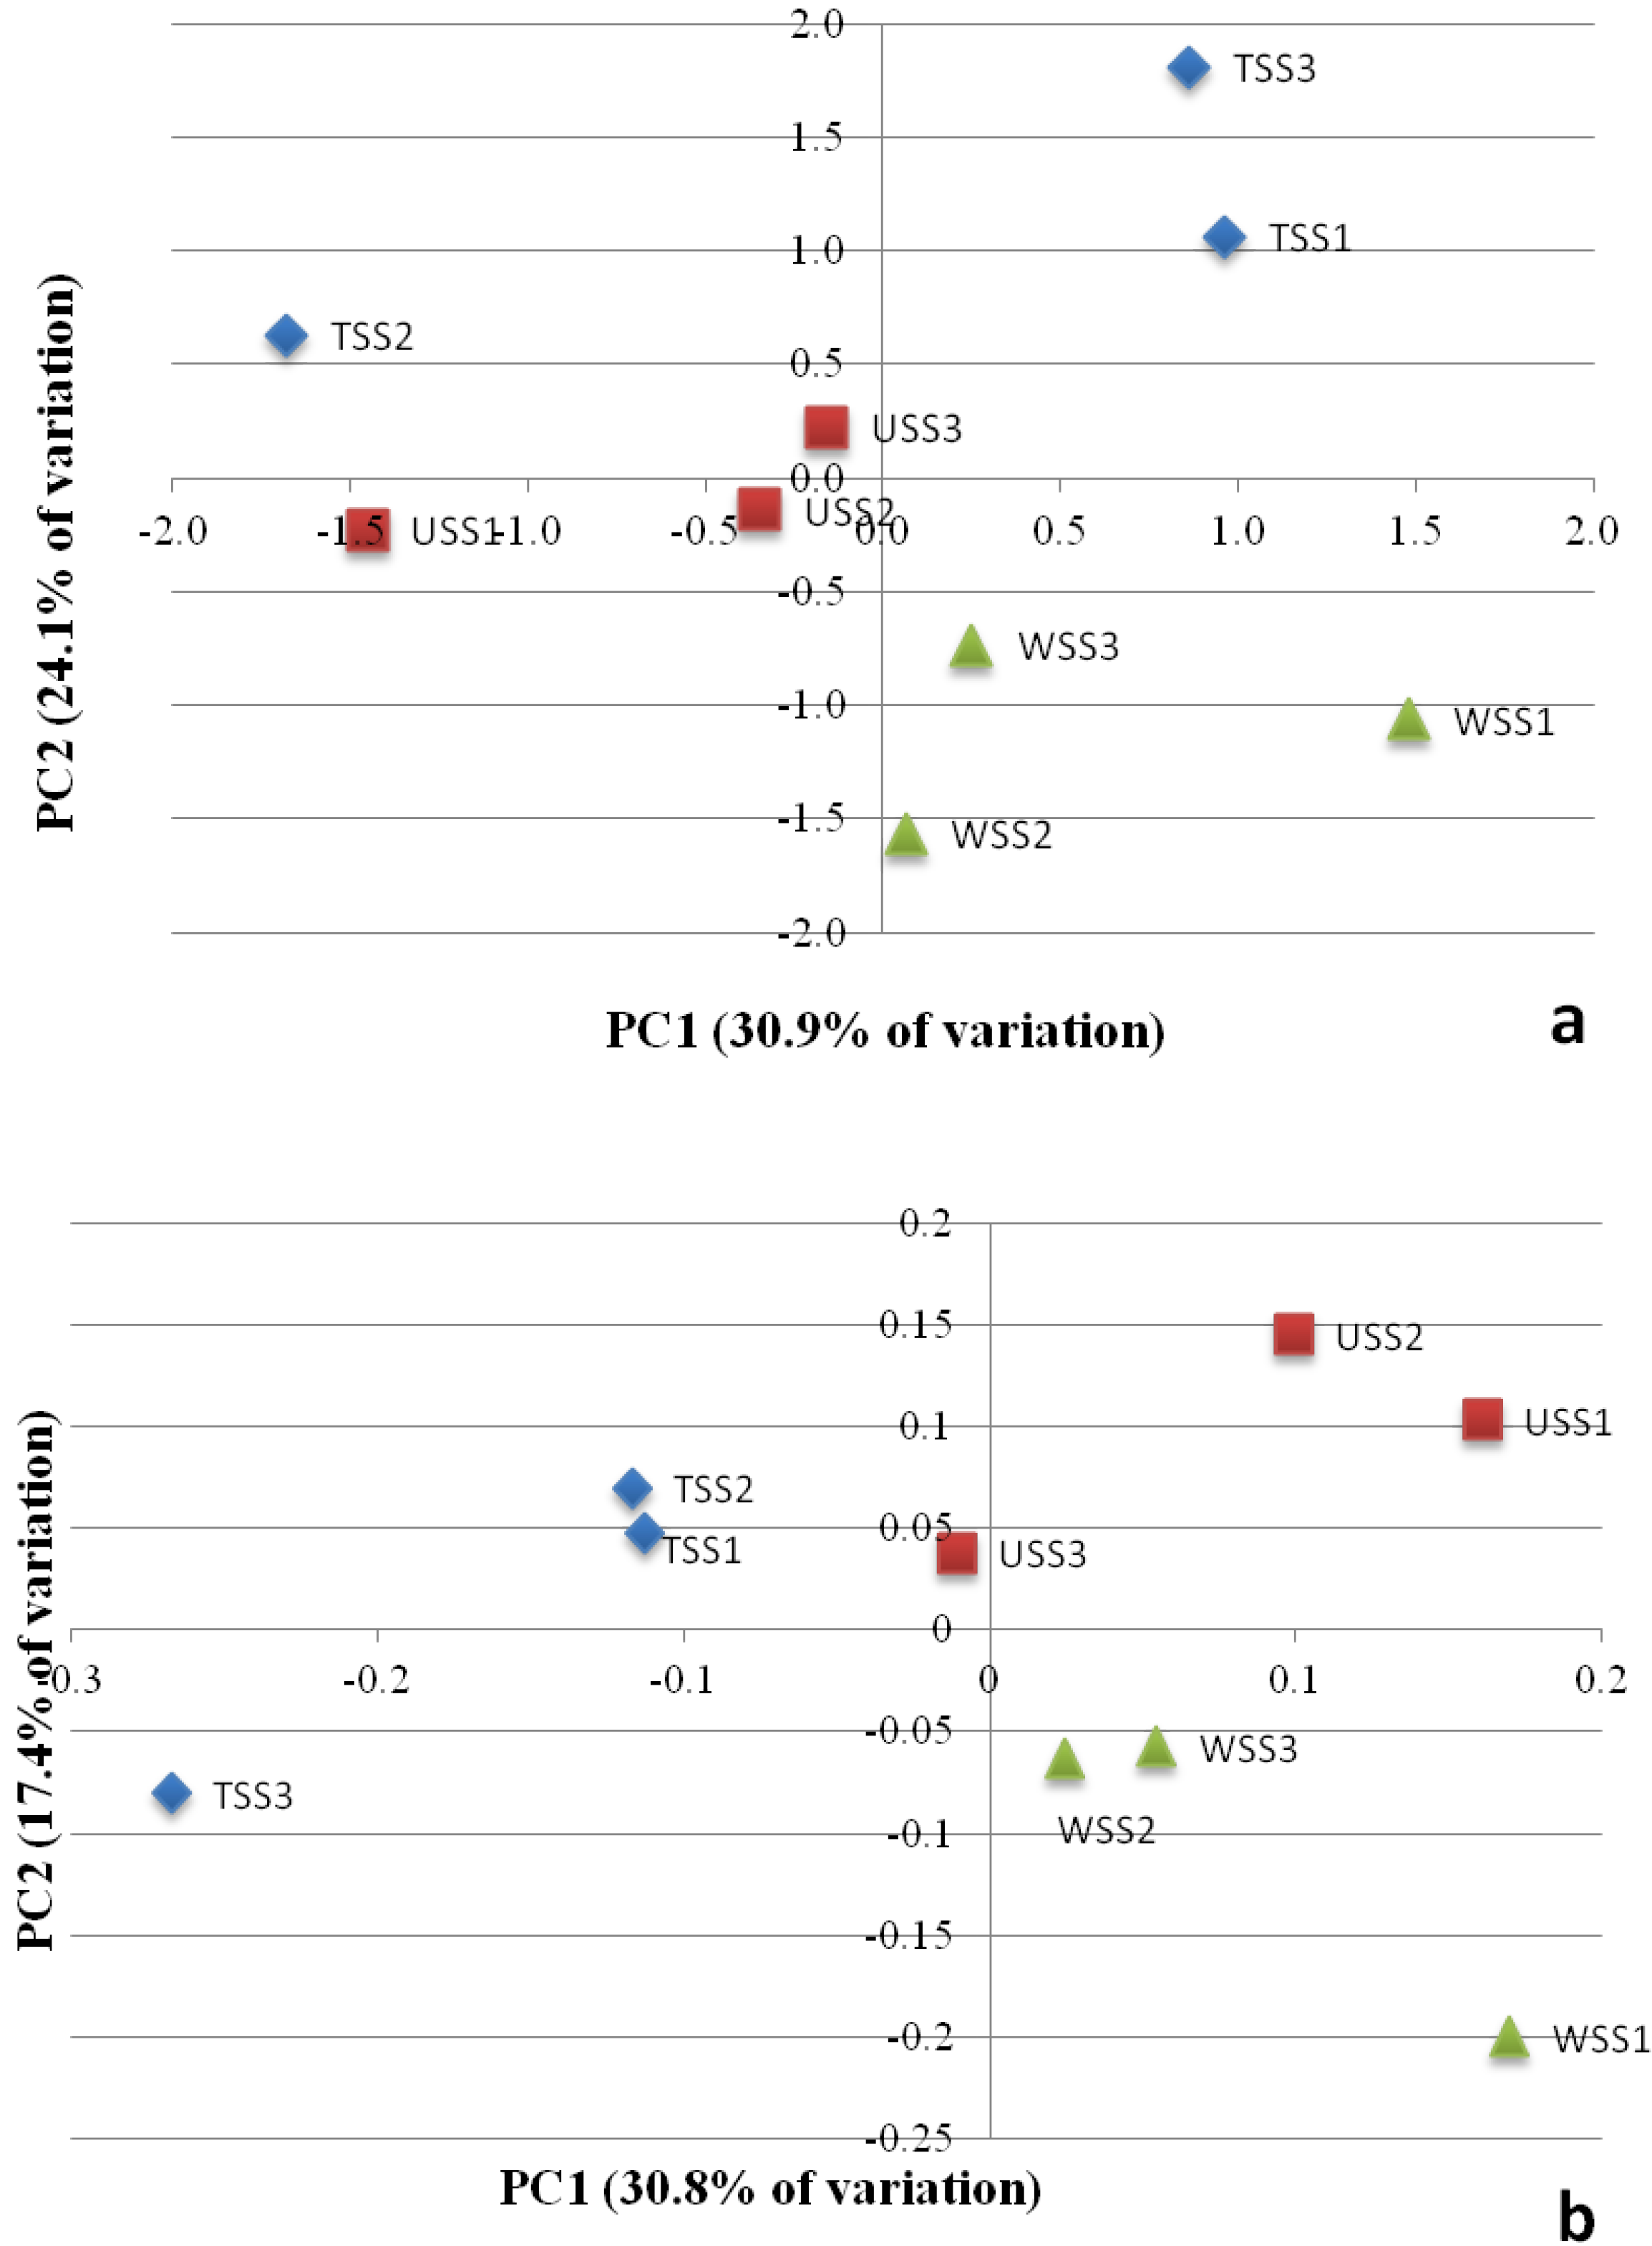
3.3. Contributions of Bacterial Taxa to Principal Components

When Factor analysis was done, only taxa with a relative abundance consistently over 1.00% in all of the samples were chosen for inclusion. Of the factors generated, the first two factors were selected (Table 3) since their eigenvalues were both greater than 10. These two factors accounted for ~55% of the total variation. The remaining six components contributed to the residual ~45% of variation as shown in the scree plot (Figure 4 and Table 3). Utilizing the loading component theory, we only considered factor loadings (correlation values) greater than 0.50. The positive loadings on the first component (explaining ~31% of total variation) were large and positive for Proteobacteria, Acidobacteria, α-proteobacteria, Solibacterales, Acidobacterales, Acidbacteraceae, Solibacteraceae, and Solibacter usitatus, indicating the influence of these taxonomic groups on the observed variation. The second factor contributing to variation among the observed taxonomic groups represented ~24% of the variation. Large and positive loadings for this factor are represented by the taxa: Actinobacteria, Actinomycetales Micromonospraceae, Mycobacteriaceae, and Streptosporangiaceae.
Table 3. Eigenvalues and corresponding values of percentage of variance for each component.
F1F2F3F4F5F6F7F8
Eigenvalue14.55511.2866.2205.6174.4142.8811.2360.791
Variability (%)30.96924.01313.23311.9519.3926.1292.6301.683
Cumulative (%)30.96954.98268.21580.16689.55895.68898.317100.000
Legend: The table shows the contribution of each factor to the percentage of variability detected in the observations. The factors kept for further analysis are presented in bold.
Figure 4. A scree plot showing the relative eigenvalues for the principle components generated for the measured variables.
Diversity 05 00461 g004
Legend: The figure demonstrates the higher contributions of the first two factors to variability in the observations.
When plotted on a two-dimensional axis, PCA of the given samples situated the samples in such a way that a majority of the samples, with the exception of TSS samples 2 and 3, clustered in the same general area. Though there was this large cluster, there was distinction in that separate non-overlapping groups could be identified for each of the soil systems (Figure 5a). Unifrac metrics were also used to assess community similarity between two or more samples according to their structure (weighted/quantitative) and visualized in a two-dimensional principle coordinates plot from the Unifrac weighted distance matrix (3% dissimilarity) (Figure 5b). Similar to the PCA, there seemed to be a general cluster towards the center of the plot that contained five of the nine samples, but also contained outliers of each group that served to separate all of the samples into three distinguishable clusters with no overlap. The samples of each system distinctively responded to the majority of the variation detected in the samples across two axes.
Figure 5. (a) A two-dimensional plot of principal component factor scores of rotated relative abundance values. (b) A two-dimensional ordination of weighted Unifrac scores.
Diversity 05 00461 g005
Legend: (a) After initial principle components analysis, scores were rotated via varimax to further reduce the amount of factors to two. Transformed relative abundance values were utilized for analysis. (b) PCoA plots are presented of the first two axes based on the weighted Unifrac distance matrix showing the quantitative clustering of samples. The upland system is represented by the red; the transition by the blue; and the wetland by the green.

4. Discussion

With respect to observational studies, researchers attempt to explain natural phenomena with established scientific principles and corroborated evidence though the explanation can only be speculation. The following discussion is presented in the same manner to discuss the results of the current study.

4.1. Soil Chemical, Biochemical, and Biological Properties

Low pH has often been a measured characteristic of soil under long standing forests due to organic acids released by decomposing plant and animal residues. Decomposition of organic matter is generally slow and incomplete mineralization in wetlands is due to low aeration [36], which may account for the high percent carbon observed in WSS compared to TSS and USS [37]. Because extracellular enzymatic activity is associated with organic matter decomposition, correlations between the two have been observed in soils [14]. A similar observation was made in this study in which a drop in enzymatic activity for ACP and APA was seen in the TSS compared to the wetland soil. Wright and Reddy [23] also demonstrated in a study of P loading effects on extracellular enzyme activities in a wetland soil that phosphomonoesterases could be the most useful indicator for assessing impacts of P enrichment in wetland soils. The phenomenon that was observed for much of the measured attributes in Table 1, in which the TSS was consistently and considerably lower than that of USS and WSS, may be attributed to the loss of soil surface particles due to disturbance events such as rainfall and runoff. Several researchers have demonstrated that soil loss increases with increased slopes in forested soil systems [38,39].

4.2. Bacterial Community Membership

As with bacterial richness, interpretation of bacterial composition should consider the impact of long-term runoff and soil loss on the study site. The association of bacterial taxa with particular eroded sediments of soil systems has implication for the current study. In a study by Gardner et al. [40], certain taxa were found to be associated with certain sized sediments (Proteobacteria with coarse sediments, Bacteroidetes and Chloroflexi with fine sediments, and Actinobacteria with the source soil fraction). The soil sediments and the accompanying bacterial taxa are expected to be eroded in the presence of physical disturbance of the soil surface, which is the case in the TSS of the current study for Proteobacteria, Chloroflexi; in addition, Verrucomicrobia and its class of Spartobacteria trended in the same manner.
Other researchers have also described Proteobacteria as the most abundant bacteria in soil ecosystems [41], and have also associated this group with C and N cycling in soils [10,42,43]. Because of their high functional and species diversity, Proteobacteria are assumed to occupy many different niches in soils environments, giving reason to the persistence of the phyla in oligotrophic environments. Though not described explicitly as an oligotroph [44], α-Proteobacteria have, in fact, been found to respond in a similar manner as Acidobacteria to oligotrophic environments in a number of studies [11,45,46], as well as the current study. Concerning Bacteroidetes, the phyla did not seem to be negatively impacted in the TSS, although it has been associated with soil sediments. What may be more significant is the association of increased Bacteroidetes presence with the sudden availability of simple substrates [40,47,48], which could be a reasonable event following physical disturbance events (i.e., rain, wind, tillage). Verrucomicrobia have been described as a ubiquitous, but understudied phyla in soil ecosystems [49]. Spartobacteria are their most prominent class found in soils and showed the same trends as Verrucomicrobia in the current study. Bergmann et al. [49] also described these taxa as a subsurface oligotroph that normally exist in higher abundance in deeper horizons of soil, dominating the resource poor environment. As this may be the case in subsurface ecology, in this study at the soil surface, VerrucomicrobiaSpartobacteria seem to be impacted in the TSS, which is subject to sediment loss from the soil surface. As Verrucomicrobia’s abundance in various soils around the world shows great variance, to truly understand its relation to soil sediments and erosion activity, studies utilizing soils of varying geographic origin are needed.
At the Phyla and class levels, it has been shown that Actinobacteria are copiotrophic or respond positively to carbon-rich environments [11,44,50], and Acidobacteria can be classified as oligotrophic, or respond positively to the lack of carbon in the soil environment. Our results agree with these prior observations, as Acidobacteria showed prominence in all of the land areas (as they all have acidic pH), but were most prominent in the WSS. Acidobacteria have been described as a dominant group in wetland soil systems, given the oligotrophic conditions (depressed pH, nutrients, temperature, and water saturation) and a reduction in competition from other dominant phyla such as Actinobacteria [51].
Actinobacteria have often been cited as a major phylum composing soil bacterial communities [48,52,53,54], as they have been primarily linked to C cycling and the breakdown of organic matter [43,46]. The nutrients provided in relation to this process are evident in the WSS, though Actinobacteria abundance is at its lowest in this area. Actinobacteria are also subject to the dominance of Acidobacteria and Proteobacteria groups in oligotrophic environments, as the responsibility for carbon cycling will shift to these groups. The same trend of copiotrophic decline in the WSS applies to Order Actinomycetales (p < 0.05). Increased relative abundance of Actinomycetes has often been associated with soil systems that are introduced to mechanical/physical disturbance [11,55,56,57], and in the current study that system is the TSS. As has been established, Actinobacteria are normally residents of source soil where more stable organic carbon pools reside as well. In response to water erosion events experienced by the TSS, it is posited that Actinobacteria—Actinomycetes survive and utilize stable carbon sources in the absence of those bacteria associated with soil sediments loss to erosion, thus explaining their increase in relative abundance.

4.3. Clustering of Samples According to Community Structure

The utility in PCA is being able to take data resulting from large amounts of observations and reducing it to a smaller amount of factors that contribute to variation. In the case of community ecology, PCA allows us to determine which taxonomic groups vary with one another, thus allowing suppositions to be made about the relationships of particular populations. We then have the opportunity to see which of the original observations contribute to those factors and possibly begin the assemblage of functional guilds. Considering the composition of the first component, the taxa present seem to be fairly representative of acidophilic/oligotrophic groups in the phyla Acidobacteria, (e.g., Solibacter, Acidobacterales) that have been shown to thrive in oligotrophic soils [11,44,58]. Acidobacteria have repeatedly shown their dominance in environments that are low in resources. Activity and growth in the presence of less oxygen favor Acidobacteria in wetland soils, since oxygen is exhausted in the soil environment, as soil moisture increases. In the case of this study, the populations of Acidobacteria, Solibacteria, Acidobacterales, etc. are adapted to elastic environments, as their habitat cycles between copiotrophic and oligotrophic states between the wet and dry season. What we are possibly observing is the impact of this long-term cycle between the two as observed during a dry cycle.
In addition, those in the second component seem to be copiotrophic groups, as Actinobacteria, Actinomycetales, and Streptomyces can all be classified under Actinomycetes, which are spore-forming bacteria with mycelia. Another characteristic of Actinomycetes that lead to such an impact on variation in composition is the ability of a good deal of them to produce antimicrobial compounds, thus allowing them to impact the community around them [59,60,61,62]. Actinomycetes have also been described as increasing in abundance in subsurface [63], which gives validity to the observation of the constantly eroded soil surface of the TSS, possibly allowing subsurface microbiota to become predominant in such an environment.
In the weighted PCoA plot (Figure 5b) the communities are once again distinguishable from one another. There does appear to be some similarity within the samples from the USS, as sample USS 3, differs more in its location on the x-axis with the TSS than in its location on the y-axis with the WSS. The proximity between the USSS and WSS suggests a more approximate similarity in structure than both systems with the TSS. This same phenomenon was evident when calculating the richness of the systems in Table 1 (as richness is considered a component of community structure).

5. Conclusions

Wetlands provide valuable ecosystem functions, and their losses due to agriculture and urbanization, have lead to legislation to preserve and conserve them, as well as motivations to restore and/or create wetlands. With all of this activity designed around wetland conservation, there is currently no consensus on methods for evaluating the functionality of wetlands. Furthermore, the ecology of the very organisms (bacteria) that drive the chief biochemical functions of these wetlands is poorly understood. Initiating a study in an area that has had little human disturbance for over 75 years may therefore serve as a good indicator of the ecology of microbial communities in a natural wetland compared to its adjacent upland areas. Furthermore, this study was able to find significant differences in soil properties, as well as the structure and composition of soil bacterial communities across the upland, transition, and wetland areas of a forested ecosystem with distinct topography. The researchers were able to identify similarities in the microbial ecology at the tops and bottoms of a slope, thus identifying a unique “slope ecology” for soil bacteria. Though these findings have been encouraging there should be more study considered in controlled systems to further elucidate the ideas of wetland microbial ecology.

Acknowledgments

The authors would like to acknowledge T. Ankumah for her help in providing expertise for editing purposes.

Conflict of Interest

The authors declare no conflict of interest.

References

  1. Costanza, R.; d’Arge, R.; de Groot, R.; Farber, S.; Grasso, M.; Hannon, B.; Limburg, K.; Naeem, S.; O’Neill, R.V.; Paruelo, J.; et al. The value of the world’s ecosystem services and natural capital. Nature 1997, 387, 253–260. [Google Scholar] [CrossRef]
  2. Dahl, T.E. Wetlands Losses in the United States 1780’S to 1980’s; Fish and Wildlife Service: Washington, DC, USA, 1990; p. 13. [Google Scholar]
  3. Dahl, T.E. Status and Trends of Wetlands in the Conterminous United States 1998 to 2004; Fish and Wildlife Service: Washington, DC, USA, 2006; p. 112. [Google Scholar]
  4. Lilly, J.P. Soil Facts Wetland Issues. Available online: http://www.soil.ncsu.edu/publications/Soilfacts/AG-439-26/AG-439-26.pdf (accessed on 15 April 2013).
  5. Whittecar, G.R.; Daniels, W.L. Use of hydrogeomorphic concepts to design created wetlands in southeaster Virginia. Geomorphology 1999, 31, 355–371. [Google Scholar] [CrossRef]
  6. Faulkner, S.P.; Patrick, W.H., Jr.; Gambrell, R.P. Field techniques for measuring wetland soil parameters. Soil Sci. Soc. Am. J. 1989, 53, 883–890. [Google Scholar] [CrossRef]
  7. Stolt, M.H.; Genthner, M.H.; Daniels, W.L.; Groover, V.A.; Nagle, S.; Haering, K.C. Comparison of soil and other environmental conditions in constructed and adjacent palustrine reference wetlands. Wetlands 2000, 20, 671–683. [Google Scholar]
  8. Campbell, D.A.; Cole, C.A.; Brooks, R.P. A comparison of created and natural wetlands in Pennsylvania, USA. Wetl. Ecol. Manag. 2002, 10, 41–49. [Google Scholar]
  9. Bruland, G.L.; Richardson, C.J. Comparison of soil organic matter in created, restored and paired natural wetlands in North Carolina. Wetl. Ecol. Manag. 2006, 14, 245–251. [Google Scholar] [CrossRef]
  10. Acosta-Martinez, V.; Dowd, S.; Yung, S.; Allen, V. Tag encoded pyrosequencing analysis of bacterial diversity in a single soil type as affected by management and land use. Soil Biol. Biochem. 2008, 40, 2762–2770. [Google Scholar]
  11. Shange, R.S.; Ankumah, R.O.; Ibekwe, A.M.; Zabawa, R.; Dowd, S.E. Distinct soil bacterial communities revealed under a diversely managed agroecosystem. PLoS One 2012, 7, e40338. [Google Scholar]
  12. Dick, W.A.; Ali Tabatabai, M. Significance and Potential Uses of Soil Enzymes. In Soil Microbial Ecology: Applications in Agricultural and Environmental Management; Metting, F.B., Ed.; Marcel Dekker, Inc.: New York, NY, USA, 1992; pp. 95–127. [Google Scholar]
  13. Acosta-Martínez, V.; Cruz, L.; Sotomayor-Ramirez, D.; Pérez-Alegría, L. Enzyme activities as affected by soil properties and land use in a tropical watershed. Appl. Soil Ecol. 2007, 35, 35–45. [Google Scholar] [CrossRef]
  14. Shange, R.S.; Ankumah, R.O.; Githinji, L.; Zabawa, R. Spatial assessment of selected soil properties within an industrial poultry production site. Air Soil Water Res. 2012, 5, 59–68. [Google Scholar]
  15. Davidson, E.A.; Ackerman, I.L. Changes in soil carbon inventories following cultivation of previously untilled soils. Biogeochemistry 1993, 20, 161–193. [Google Scholar]
  16. Mann, L.K. Changes in soil carbon after cultivation. Soil Sci. 1986, 142, 279–288. [Google Scholar] [CrossRef]
  17. Schlesinger, W.H. Changes in Soil Carbon Storage and Associated Properties with Disturbance and Recovery. In The Changing Carbon Cycle: A Global Analysis; Trabalka, J.R., Reichle, D.E., Eds.; Springer-Verlag: Berlin, Germany, 1985; pp. 194–220. [Google Scholar]
  18. Post, W.M.; Mann, L.K. Changes in Soil Organic Carbon and Nitrogen as a Result of Cultivation. In Soils and the Greenhouse Effect; Bouwman, A.F., Ed.; John Wiley & Sons: New York, NY, USA, 1990; pp. 401–406. [Google Scholar]
  19. Mankolo, R.; Reddy, C.; Senwo, Z.; Nyakatawa, E.; Sajjala, S. Soil biochemical changes induced by poultry litter application and conservation tillage under cotton production systems. Agronomy 2012, 2, 187–198. [Google Scholar] [CrossRef]
  20. Song, Y.; Song, C.; Yang, G.; Miao, Y.; Wang, J.; Guo, Y. Changes in labile organic carbon fractions and soil enzyme activities after marshland reclamation and restoration in the Sanjiang Plain in Northeast China. Environ. Manag. 2012, 50, 418–426. [Google Scholar] [CrossRef]
  21. McArthur, J.V. Bacteria as Biomonitors. In Bioassessment and Management of North American Fresh Water Wetlands; Rader, R.B., Batzer, D.P., Wissinger, S.A., Eds.; John Wiley & Sons: New York, NY, USA, 2001; pp. 249–261. [Google Scholar]
  22. Van der Heijden, M.G.; Bardgett, R.D.; van Straalen, N.M. The unseen majority: Soil microbes as drivers of plant diversity and productivity in terrestrial ecosystems. Ecol. Lett. 2008, 3, 296–310. [Google Scholar] [CrossRef]
  23. Wright, A.L.; Reddy, K.R. Phosphorus lading effects on extracellular enzyme activity in Everglades wetland soils. Soil Sci. Soc. Am. J. 2001, 65, 588–595. [Google Scholar] [CrossRef]
  24. Soil Survey of Macon County Alabama. Available online: http://soildatamart.nrcs.usda.gov/Manuscripts/AL087/0/Macon.pdf (accessed on 15 April 2013).
  25. Tabatabai, M.A. Enzymes. In Methods of Soil Analysis, Part 2: Microbiological and Biochemical properties; Weaver, R.W., Augle, S., Bottomly, P.J., Bezdicek, D., Smith, S., Tabatabai, M.A., Wollum, A., Eds.; Soil Science Society of America: Madison, WI, USA, 1994; pp. 775–833. [Google Scholar]
  26. Bandick, A.K.; Dick, R.P. Field management effects on soil enzyme activities. Soil Biol. Biochem. 1999, 31, 1471–1479. [Google Scholar] [CrossRef]
  27. Elsgaard, L.; Anderson, G.H.; Eriksen, J. Measurement of arylsulphatase activity in agricultural soils using a simplified assay. Soil Biol. Biochem. 2002, 34, 79–82. [Google Scholar] [CrossRef]
  28. Dowd, S.E.; Sun, Y.; Secor, P.R.; Rhoads, D.D.; Wolcott, B.M.; James, G.A.; Wolcott, R.D. Survey of bacterial diversity in chronic wounds using pyrosequencing, DGGE, and full ribosome shotgun sequencing. BMC Microbiol. 2008, 8, 43. [Google Scholar] [CrossRef]
  29. Dowd, S.E.; Sun, Y.; Wolcott, R.D.; Carroll, J.A. Bacterial tag-encoded FLX amplicon pyrosequencing (bTEFAP) for microbiome studies: Bacterial diversity in the ileum of newly weaned Salmonella-infected pigs. Foodborne Pathog. Dis. 2008, 5, 459–472. [Google Scholar] [CrossRef]
  30. Gontcharova, V.; Youn, E.; Wolcott, R.D.; Hollister, E.B.; Gentry, T.J.; Dowd, S.E. Black Box Chimera Check (B2C2): A windows-based software for batch depletion of chimeras from bacterial 16S rRNA gene datasets. Open Microbiol. J. 2010, 4, 47–52. [Google Scholar] [CrossRef]
  31. Schloss, P.D.; Westcott, S.L.; Ryabin, T.; Hall, J.R.; Hartmann, M.; Hollister, E.B.; Lesniewski, R.A.; Oakley, B.B.; Parks, D.H.; Robinson, C.J.; et al. Introducing mothur: open source, platform-independent, community-supported software for describing and comparing microbial communities. Appl. Environ. Microbiol. 2009, 75, 7537–7541. [Google Scholar] [CrossRef]
  32. Roesch, L.F.; Fulthrope, R.R.; Riva, A.; Casella, G.; Hadwin, A.K.M.; Kent, A.D.; Ddaroub, S.H.; Camargo, F.A.; Farmerie, W.G.; Triplett, E.W. Pyrosequencing enumerates and contrasts soil microbial diversity. ISME J. 2007, 1, 283–290. [Google Scholar]
  33. Cole, J.R.; Chai, B.; Farris, R.J.; Wang, Q.; Kulam-Syed-Mohideen, A.S.; McGarrell, D.M.; Bandela, A.M.; Cardenas, E.; Garrity, G.M.; Tiedje, J.M. The ribosomal database project (RDP-II): introducing myRDP space and quality controlled public data. Nucleic Acids Res. 2007, 35, D169–D172. [Google Scholar] [CrossRef]
  34. Chao, A.; Ma, M.C.; Yang, M.C.K. Stopping rules and estimation for recapture debugging with unequal failure rates. Biometrika 1993, 80, 193–201. [Google Scholar] [CrossRef]
  35. Chao, A. Nonparametric estimation of the number of classes in a population. Scand. J. Stat. 1984, 11, 265–270. [Google Scholar]
  36. Clymo, R.S.; Reddaway, E.J.F. Productivity of Sphagnum (bog-moss) and peat accumulation. Hydrobiologia 1971, 12, 181–192. [Google Scholar]
  37. Mausbach, M.J.; Richardson, J.L. Biogeochemical processes in hydric soil formation. Curr. T. Wetl. Biogeochem. 1994, 1, 68–127. [Google Scholar]
  38. Pimentel, D.; Harvey, C.; Resosudarmo, P.; Sinclair, K.; Kunz, D.; McNair, M.; Crist, S.; Shpritz, L.; Fitton, L.; Sa.ouri, R.; et al. Environmental and economic costs soil erosion and conservation benefts. Science 1995, 267, 1117–1123. [Google Scholar] [CrossRef]
  39. Hartanto, H.; Prabhu, R.; Widayat, A.S.E.; Asdak, C. Factors affecting runoff and soil erosion: Plot-Level soil loss monitoring for assessing sustainability of forest management. For. Ecol. Manage 2003, 180, 361–374. [Google Scholar] [CrossRef]
  40. Gardner, T.; Acosta-Martinez, V.; Calderón, F.; Zobeck, T.; Baddock, M.; Van Pelt, R.; Senwo, Z.; Dowd, S.; Cox, S. Pyrosequencing reveals bacteria carried in different wind-eroded sediments. J. Environ. Qual 2011, 41, 744–53. [Google Scholar]
  41. Spain, A.M.; Krumholz, L.R.; Elshahed, M.S. Abundance, composition, diversity and novelty of soil Proteobacteria. ISME J. 2009, 3, 992–1000. [Google Scholar] [CrossRef]
  42. Kersters, K.; de Vos, P.; Gillis, M.; Swings, J.; Vandamme, P.; Stackebrandt, E. Introduction to the Proteobacteria. In The Prokaryotes: A Handbook on the Biology of Bacteria; Dwarkin, M., Falkow, S., Rosenberg, E., Schleifer, K.H., Stackebrandt, E., Eds.; Springer: New York, NY, USA, 2006; pp. 3–37. [Google Scholar]
  43. Gardner, T.G.; Acosta-Martínez, V.; Senwo, Z.; Dowd, S.E. Soil rhizosphere microbial communities and enzyme activities under organic farming in Alabama. Diversity 2011, 3, 308–328. [Google Scholar]
  44. Fierer, N.; Bradford, M.A.; Jackson, R.B. Toward an ecological classification of soil bacteria. Ecology 2007, 88, 1354–1364. [Google Scholar] [CrossRef]
  45. Jangid, K.; Williams, M.A.; Franzluebbers, A.J.; Sanderlin, J.S.; Reeves, J.H.; Jenkins, M.B.; Endale, D.M.; Coleman, D.C.; Whitman, W.B. Relative impacts of land-use, management intensity and fertilization upon soil microbial community structure in agricultural systems. Soil Biol. Biochem. 2008, 40, 2843–2853. [Google Scholar] [CrossRef]
  46. Nacke, H.; Thurmer, A.; Wollherr, A.; Will, C.; Hodac, L.; Herold, N.; Schöning, I.; Schrumpf, M.; Daniel, R. Pyrosequencing-based assessment of bacterial community structure along different management types in German forest and grassland soils. PLoS One 2011, 6, e17000. [Google Scholar] [CrossRef]
  47. Acosta-Martínez, V.; Dowd, S.E.; Sun, Y.; Webster, D.; Allen, V.G. Pyrosequencing analysis for characterization of soil bacterial populations as affected by an integrated livestock-cotton production system. Appl. Soil Ecol. 2010, 45, 13–25. [Google Scholar] [CrossRef]
  48. Empadinhas, N.; da Costa, M.S. Diversity, biological roles and biosynthetic pathways for sugar-glycerate containing compatible solutes in bacteria and Archaea. Environ. Microbiol. 2011, 13, 2056–2077. [Google Scholar] [CrossRef]
  49. Bergmann, G.; Bates, S.; Eilers, K.; Lauber, C.; Caporaso, J.; Walters, W.; Knight, R.; Fierer, N. The under-recognized dominance of Verrucomicrobia in soil bacterial communities. Soil Biol. Biochem. 2011, 43, 1450–1455. [Google Scholar] [CrossRef]
  50. Singh, B.K.; Bardgett, R.D.; Smith, P.; Reay, D.S. Microorganisms and climate change: Terrestrial feedbacks and mitigation options. Nat. Rev. Microbiol. 2010, 8, 779–790. [Google Scholar] [CrossRef]
  51. Dedysh, S.N. Cultivating uncultured bacteria from northern wetlands: Knowledge gained and remaining gaps. Front. Microbiol. 2011, 2, 184. [Google Scholar] [CrossRef]
  52. Janssen, P.H. Identifying the dominant soil bacteria taxa in libraries of 16S rRNA and 16S rRNA genes. Appl. Environ. Microbiol. 2006, 72, 1719–1728. [Google Scholar] [CrossRef]
  53. Mendes, R.; Kruijt, M.; de Bruijn, I.; Dekkers, E.; van der Voort, M.; Schneider, J.M.; Piceno, Y.M.; DeSantis, F.Z.; Andersen, G.L.; Bakker, P.; et al. Deciphering the rhizosphere microbiome for disease-suppressive bacteria. Science 2011, 332, 1097–1100. [Google Scholar] [CrossRef]
  54. Bardhan, S.; Jose, S.; Jenkins, M.A.; Webster, C.R.; Udawatta, R.P.; Stehn, S.E. Microbial community diversity and composition across a gradient of soil acidity in spruce–fir forests of the southern Appalachian Mountains. Appl. Soil Ecol. 2012, 61, 60–68. [Google Scholar] [CrossRef]
  55. Burke, R.A.; Molina, M.; Cox, J.E.; Osher, L.J.; Piccolo, M.C. Stable carbon isotope ratio and composition of microbial fatty acids in tropical soils. J. Environ. Qual. 2003, 32, 198–206. [Google Scholar]
  56. Waldrop, M.P.; Balser, T.C.; Firestone, M.K. Linking microbial community composition to function in a tropical soil. Soil Biol. Biochem. 2000, 32, 1837–1846. [Google Scholar] [CrossRef]
  57. Hill, P.; Kristufek, V.; Dijfkhuizen, L.; Boddy, C.; Kroetsch, D.; van Elsas, J.D. Land use intensity controls actinobacterial community structure. Microb. Ecol. 2011, 61, 286–302. [Google Scholar] [CrossRef]
  58. Hartman, W.H.; Richardson, C.J.; Vilgalys, R.; Bruland, G.L. Environmental and anthropogenic controls of bacterial communities in wetland soils. Proc. Natl. Acad. Sci. USA 2008, 105, 17842–17847. [Google Scholar] [CrossRef]
  59. Lazzarini, A.; Cavaletti, L.; Toppo, G.; Marinelli, F. Rare genera of actinomycetes as potential producers of new antibiotics. Antonie van Leeuwenhoek 2000, 78, 399–405. [Google Scholar] [CrossRef]
  60. Lee, J.P.; Hwang, B.Y. Diversity of antifungal actinomycetes in various vegetative soils of Korea. Can. J. Microbiol. 2002, 48, 407–417. [Google Scholar] [CrossRef]
  61. Bouizgarne, B.; El Hadrami, I.; Ouhdouch, Y. Novel production of isochainin by a strain of Streptomyces sp. isolated from rhizosphere soil of the indigenous Moroccan plant Argania. spinosa L. World J. Microbiol. Biotechnol. 2006, 22, 423–429. [Google Scholar] [CrossRef]
  62. Nurjasmi, R.; Widada, J. Diversity of actinomycetes at several forest types in Wanagama I Yogyakarta and their potency as a producer of antifungal compound. Indo J. Biotech. 2009, 14, 1196–1205. [Google Scholar]
  63. Fierer, N.; Schimel, J.; Holden, P. Variations in microbial community composition through two soil depth profiles. Soil Biol. Biochem. 2003, 35, 167–176. [Google Scholar] [CrossRef]

