Article

Determination of Genetic Variations of Toll-Like Receptor (TLR) 2, 4, and 6 with Next-Generation Sequencing in Native Cattle Breeds of Anatolia and Holstein Friesian †

1
Department of Animal Genetics, Faculty of Veterinary Medicine, University of Ankara, Ankara 06610, Turkey
2
Department of Pathology and Infectious Diseases, Royal Veterinary College, University of London, London AL9 7TA, UK
*
Author to whom correspondence should be addressed.
Work was carried out in fulfillment of the requirements for a Doctoral thesis, The Graduate School of Health Sciences of Ankara University, Ankara 06110, Turkey.
Diversity 2016, 8(4), 23; https://doi.org/10.3390/d8040023
Submission received: 27 May 2016 / Revised: 27 October 2016 / Accepted: 31 October 2016 / Published: 3 November 2016

Abstract

:
In recent years, the focus of disease resistance and susceptibility studies in cattle have been on determining patterns in the innate immune response of key proteins, such as Toll-like receptors (TLR). In the bovine genome, there are 10 TLR family members and, of these, TLR2, TLR4, and TLR6 are specialized in the recognition of bacterial ligands. Indigenous cattle breeds of Anatolia have been reported to show fewer signs of clinical bacterial infections, such as bovine tuberculosis and mastitis, and it is hypothesized that this might be due to a less stringent genetic selection during breeding. In contrast, Holstein-Friesian cattle have been under strong selection for milk production, which may have resulted in greater susceptibility to diseases. To test this hypothesis, we have compared the TLR2, TLR4, and TLR6 genes of Anatolian Black (AB), East Anatolian Red (EAR), South Anatolian Red (SAR), Turkish Grey (TG), and Holstein (HOL) cattle using next-generation sequencing. The SAR breed had the most variations overall, followed by EAR, AB, TG, and HOL. TG had the most variations for TLR2, whereas SAR had the most variations in TLR4 and TLR6. We compared these variants with those associated with disease and susceptibility traits. We used exon variants to construct haplotypes, investigated shared haplotypes within breeds, and proposed candidate haplotypes for a disease resistance phenotype in Anatolian cattle breeds.

1. Introduction

Toll-like receptors (TLRs) recognize conserved patterns in diverse microbial molecules called microbial-associated molecular patterns (MAMPs). These include lipopolysaccharide recognized by TLR4 and lipopeptides recognized by the heterodimer formed by TLR2 with either TLR1 or TLR6 [1]. In addition, TLRs also react to damage-associated molecular patterns (DAMPs) [2,3] released after cellular damage and, thus, play a crucial role in initiating the innate immune response [4]. Genetic variations found in the genes encoding TLRs have been associated with disease susceptibility and resistance in a variety of animal species [1,5,6]. In the bovine genome, 10 members of the TLR family (TLR1–10) have been identified and mapped to specific chromosomes [7]. Bovine TLR2, TLR4, and TLR6 genes are located on BTA17, BTA8, and BTA6, respectively, and have defined amino acid (aa) lengths [8,9]. Independent of their aa length, all TLRs identified so far contain three domains: an extra-cellular ligand binding domain (ECD) consisting of various numbers of leucine-rich repeats (LRR), a trans-membrane domain (TMD), and an intra-cellular domain, which is also known as the Toll/Interleukin-1 Receptor (TIR) domain [10], of which the TMD and TIR domain seem to be highly conserved between species [11].
Several studies have suggested that disease resistance, susceptibility, and severity of clinical signs in individuals or breeds may be attributed to altered ligand binding caused by single nucleotide polymorphisms (SNPs) specifically within the ECD of TLR genes [11,12]. Given the increased use of antibiotics in food-producing animals, native cattle breeds could provide an important genetic resource to breeders. Many of these indigenous breeds show an enhanced disease resistance due to a co-evolution with specific pathogens over decades, potentially resulting in the development of genetic resistance. Indeed, due to low selective pressure, local breeds are generally not as productive as high-yielding breeds selected for specific QTLs and, thus, may have preserved their genetic makeup over the years.
Anatolia has five native cattle breeds; Anatolian Black (AB), South Anatolian Red (SAR), East Anatolian Red (EAR), Turkish Grey (TG), and Native Southern Yellow. In general, these breeds grow slowly, are adapted to extensive breeding conditions, and present the morphologically look of semi-wild cattle [13]. Milk production in these breeds is between 700–1000 kg per lactation period per cow. The breeds are adapted to challenging environmental conditions and are known to be resistant to specific diseases. For example, SAR and EAR breeds are known to be resistant to blood parasite infections [14], whereas cows from the AB breed showed an extremely low bovine tuberculosis incidence rate when kept with Mycobacterium bovis-infected cattle [15], as well as a low mastitis-incidence rate [15]. As the corresponding disease-causing bacteria have been described to bind to TLR2, TLR4, and TLR6, the aim of the study was to determine the presence of SNP in these genes in the AB, EAR, SAR, and TG indigenous breeds compared to those present in the corresponding genes of HOL cattle.

2. Materials and Methods

2.1.DNA Isolation and Amplicon Sequencing

To determine variations in the genomic sequences for TLR2, TLR4, and TLR6, blood samples from AB (n = 20), EAR (n = 20), SAR (n = 20), TG (n = 10), and HOL (n = 10) were used. Blood samples were collected from each breed across Turkey (Figure 1).
Genomic DNA (gDNA) extraction was performed using a commercially available gDNA extraction kit (Qiagen Blood and Tissue, Hilden, Germany). Extracted DNA was measured by spectrophotometry (Nanodrop 2000, Thermo, Wilmington, DE, USA) and integrity was visualized by agarose gel electrophoresis. To obtain reliable variant information, paired end sequencing was performed at 50× coverage to analyze TLR2, TLR4, and TLR6, which spanned 13, 11, and 19 kb regions, respectively. Different primer pair combinations were used for each gene (for details see: Table S1). Primers were designed using the Primer 3 software package [16] and were spaced out over 2500–3500 bp intervals. Hot start taq DNA polymerase (Phire Hot Start II, Thermo Fisher, Bremen, Germany) was used in PCR applications. PCR conditions were as followed; 95 °C 60 s, for 45 cycles; 95 °C 10 s, 60 °C 120 s, 72 °C 20 s, and final elongation at 72 °C 60 s. For GC-rich regions 5% DMSO was added to the reaction to enhance PCR results (for details see: Table S2). PCR amplicons were visualized using SybrSafe (Invitrogen, Paisley, Scotland, UK) stained agarose gels. NGS library preparation was performed following the manufacturer’s instructions (Nextera Library Preparation Kit, Illumina Inc., San Diego, CA, USA). Amplicons were sequenced using paired end sequencing on the MiSeq platform (Illumina in Intergen Lab Inc., Ankara, Turkey), and reads were aligned to the present bovine genome version available Btau 4.6.1 (Btau7) using the MiSeq software (Illumina, San Diego, CA, USA). The resulting alignment was used to construct binary-aligned map (bam) files.

2.2. Sequence Analysis, Variant Verification, and Protein Modelling

TLR2, TLR4, and TLR6 sequence datasets from individuals were analyzed using Picard [17], BAM tools, SAM tools [18], and GATK [19] to generate variation call files (VCF) for each individual [20]. SnpSift [21] and SnpEff analysis tools [22] were used to annotate variants with the SNP138 variant collection. Thereafter, VCFs were aggregated at the breed level to determine novel SNP and InDel variants, and the results were stored in distinct .vcf files. Positions of both SNPs and InDels were lifted over to a newer assembly version (Btau8) in UCSC [8] and new positions were uploaded to the Ensembl Variant Effect Predictor (VEP) [23] database. The accuracy and the annotation of the identified genetic variations were assessed using VEP [23] and SnpSift [21], respectively.
Although VEP [23] and SnpSift [21] are useful tools to assess accuracy and to annotate novel candidate SNPs, we also screened variants using their coverage and frequency to eliminate false variant calls. Potentially important non-synonymous and novel SNP variants located in exons were validated subsequently by using Sanger sequencing. New sets of primers covering the regions including variants were designed by using Primer3 [16] (Table S1). The PCR products were sequenced using a BigDye Terminator v3.1 cycle sequencing kit and ABI310 automatic sequencer (Applied Biosystems, Foster City, CA, USA). Amplification primers were used for bidirectional sequencing. Obtained data was analyzed using BioEdit software [24].
After analyzing the variants at the amino acid level, a protein model was constructed for the most important variant identified in TLR2. Models were constructed using the Modeller [25] software package, and validated using ProCheck [26], Verify 3D [27], ERRAT [28], and ProQ [29].

3. Results

Obtained .bam files were visualized using Integrative Genomics Viewer (IGV) [30]. The average read length was determined to be 125 bp. Some .bam files contained ambiguous alignments due to the presence of nonspecific amplicons produced during the amplification of gene regions. Thus, all ambiguous alignments and reads with less than 125 bp were removed and filtered according to their mapping quality before calling variants using MQ > 50. Across all analyzed sequences from all breeds, five intronic regions in 13 individuals could not be amplified and, therefore, NGS results are missing for these individuals. Furthermore, one individual from the HOL breed appeared to have variations found only in Anatolian breeds and was subsequently excluded from the analysis.
Within the three TLR genes analyzed, a total of 360, 463, 520, 423, and 274 SNP variants were determined at the breed level in AB, EAR, SAR, TG, and HOL individuals used in this study, including 26, 23, 68, 22, and four novel SNPs (Table 1). According to average data on determined SNPs and genes, the highest SNP variation was found in the TLR6 gene, whereas the lowest one was found in TLR4 (Figure 2).
The SNP variants spread in the whole genes; however, InDel variants were identified only in intronic regions, suggesting no effect on the gene function (Table 2). Novel variants and variants potentially impacting on molecule structures identified by NGS results were subsequently confirmed using bidirectional Sanger sequencing (Figure 3).
By just analyzing SNPs occurring in the exons of TLR2, TLR4, and TLR6, a total of 33, 24, and 46 SNP variants covering the privates and the shared among breeds, respectively, were determined and according to these SNPs 36, 25, and 98 different haplotypes per corresponding TLR were constructed using ShapeIT software [31]. Obtained phased haplotypes (Table S3) were visualized in a median joining (MJ) tree using the Network program [32] (Figure 4 and Figure 5), except TLR6, due to a high number of haplotypes. Within all haplotypes, two main haplotypes were identified for TLR2 and TLR6, whereas three major haplotypes were identified for TLR4. Analyzing haplotypes by breed, we identified 36 haplotypes in TLR2 for Anatolian breeds, but only four within HOL. Interestingly however, we were unable to identify any breed specific haplotypes for TLR4 and TLR6, but we were able to identify eight and 12 haplotypes, respectively, that were shared between Anatolian breeds and HOL (Table S3).
Missense and synonymous variations were analyzed according to reference proteins for all genes and several changes were found in the analyzed genes affecting the amino acids characteristics (Table 3, Table 4 and Table 5).

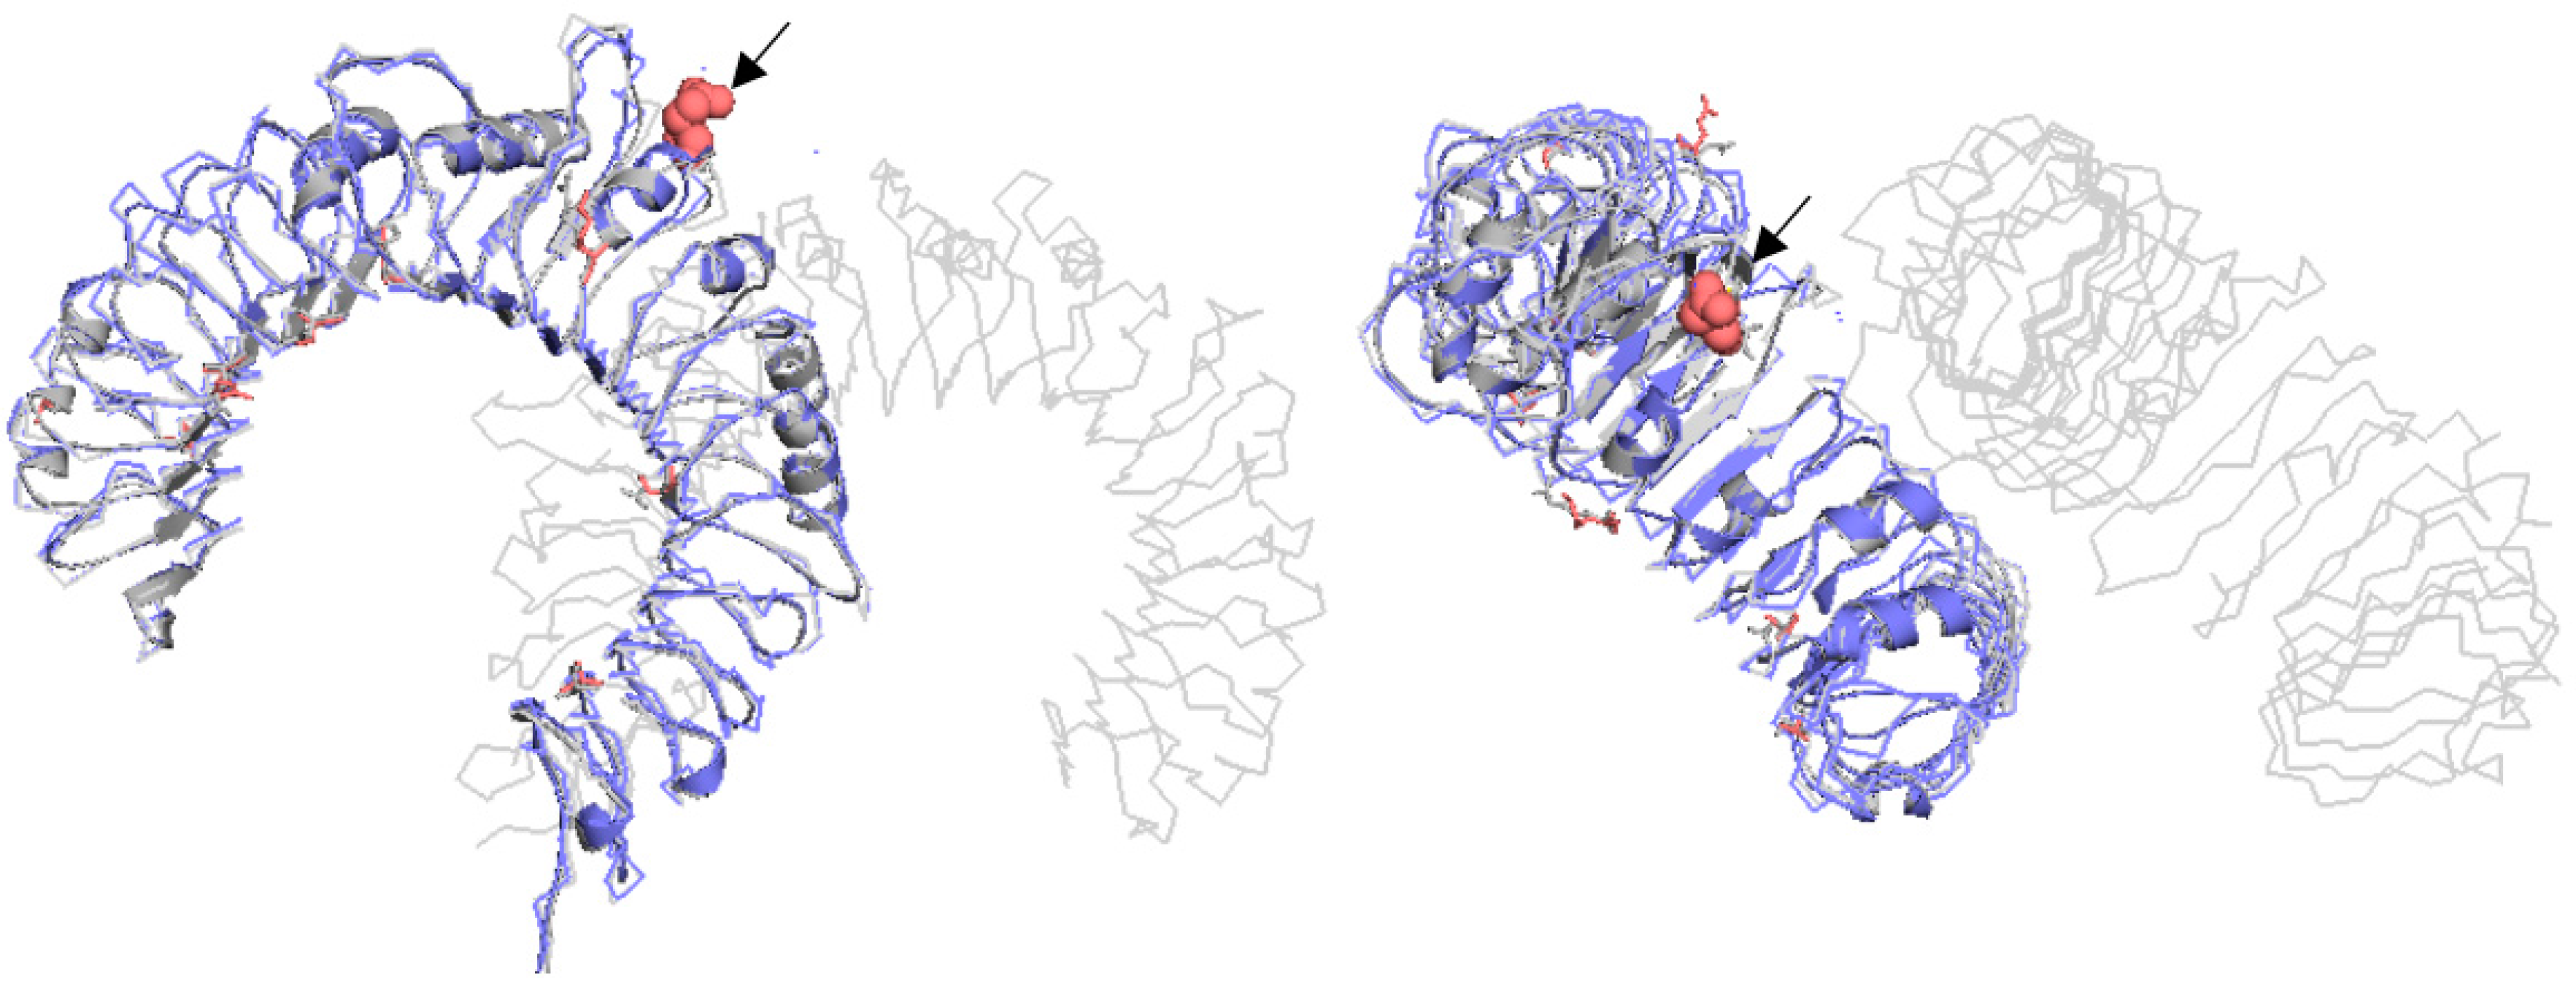
Impact of Identified SNPs on Protein Model

Within the identified SNPs, we identified in LRR11 of TLR2 an amino acid change, which resulted in the change from a charged residue into an uncharged residue. This area is part of the TLR2 ligand binding domain, spanning LRRS 9–12. We visualized the importance of this change by constructing a hybrid protein model for one AB individual, carrying the H326Q change, and other variants with one HOL individual. The resulting model was visualized in PyMol [33] (Figure 6).

4. Discussion

The goal of the present study was to assess whether genetic variations in the sequences of innate immune receptors of indigenous cattle breeds compared to those sequences seen for these genes in HF cattle may potentially explain some of the observed genetic resistance to specific bacterial pathogens.
Several association studies have been conducted to find susceptibility related alleles on TLR2, TLR4, and TLR6 genes [34,35,36,37]. None of the previously identified susceptibility associated alleles or haplotypes were found in the present study in indigenous cattle breeds, however, all of them were identified in HOL.
Anatolian breeds seem to be more genetically resistant to infection with bacteria, such as Mycobacterium bovis and mastitis-causing bacteria and, when analyzing TLRs involved in the recognition of these bacterial pathogens, we indeed identified breed specific SNPs within the genes for the receptors investigated which differ significantly from those present in HOL cows.
Interestingly, when grouping the identified SNPs into haplotypes, Anatolian breeds grouped into different haplotypes for TLR2, but not for the other TLRs. This is an important observation, as those bacterial diseases, to which Anatolian breeds have been described to be more resistant, are mainly caused by bacteria binding to TLR2 [38]. Analyzing the identified SNPs in TLR2 in more detail, one aa change was identified in LRR1–10, four between LRR11–LRR20, one in the TM, and four in the TIR domains, respectively, in native cattle breeds, whereas only one was determined in LRR5 in HOL. Considering that the ligand-binding region of TLR2 encompasses LRR9–12, the most important change causing amino acid characteristic changes (H326Q) was found in LRR11. In addition, the aa changes identified in the TIR domain (H665Q and E738Q) need to be further investigated, as these might impact on subsequent intracellular signaling events, similar as described recently for bovine TLR5 [39].
In previous studies, aa changes L227P, H305P, and H326Q in the bovine TLR2 gene have been described to be under positive selection [10]. In our study, the aa at position 227 was L, whereas the aa at position 326 was Q, and no change was determined for the aa at position 305. Furthermore, aa changes L227P, H326Q, N417S, and H665Q have been identified as being specific to Bos indicus cattle breeds [10], similar to T405M [10], which we also identified in our study. It is currently assumed that these variations may represent geographical differences, being driven by a different microbiological environment. It has also been suggested that the Bos indicus-specific aa changes H326Q and R563H might also be found in cattle breeds that originated in a similar geographical and microbial environment [10].
Indeed, blood parasites have been described to cause substantial economic losses in terms of production [40]. Genetic variations in TLR2 of Bos indicus cattle breeds are assumed to impact on blood parasite infections [41]. When the EAR hybrid cattle population breed in Diyarbakir were screened for Theileria blood parasite, only 24 out of 100 samples taken from clinically healthy cows tested positive for Theileria [42]. Similarly, while clinically healthy 24 EAR hybrid cattle (n = 111) and 21 Brown Swiss cows (n = 177) from Erzurum tested positive for the presence of Babesia spp. [43]. Taken further into account that previous phylogenetic studies concluded that Anatolian cattle breeds were Bos indicus and Bos taurus hybrids [44,45], we believe that either similar selective pressure may exists in Anatolian cattle breeds due to the similar geographic/microbial environment compared to pure Bos indicus breeds, or that Bos indicus breeds may have been crossed in at an earlier time due to an increase in the resistance of the local breeds to various infectious diseases.
In comparison with previous studies [34,46,47], the highest number of genetic variation in the analyzed genes were found in Anatolian breeds, except for TLR4, for which we identified more variations in the HOL breed, compared to AB and TG breeds. In these studies, researchers sampled a minimum one individual of each breed that went under artificial selection and analyzed innate immunity-related genes, partially. It is a known fact that the selection pressure for the quantitative traits associated with productions has a negative effect on immunity traits [48,49]. The cited studies showed that cattle breeds were under strong selection pressure, which might lead to a decrease in the variation on the gene regions. Nevertheless, with natural selection animals which cannot resist diseases and environmental conditions cannot find a chance for reproduction; thus, they are eliminated from the population [50] leading to accumulation of resistance-related variations. In the present study Anatolian cattle breeds were indigenous breeds that evolved under natural selection over the years. It can be assumed that the determined polymorphism and haplotype have a potential positive effect on immunity traits. In this context, when taking into account Figure 4 and Figure 5, EAR and SAR, which were raised closer to the center of domestication, were seen as most divergent from the other breeds, suggesting more potential for disease resistance. Determination of the lowest haplotype number in the HOL breed might be due to a low sampling size and/or inbreeding for years. However the TG breed has the same sample size with the HOL breed, and 12 haplotypes were determined for TLR2 (Figure 4).
In addition to TLR2, we also assessed the occurrence of SNPs in TLR4 and TLR6, known to form heterodimers with TLR2. In the TLR6 gene, synonymous SNPs were positively associated with the susceptibility for bovine tuberculosis [51]. In the analyzed individuals of the presented study there were no breed-specific differences for the four synonymous variations. In addition to this, an SNP array study associated protein tyrosine phosphatase receptor T (PTPRT) and myosin IIIB (MYO3B) with bovine tuberculosis resistance [51]. The highest variation was identified in TLR6, but non-synonymous variations were seen in the LRR1–LRR14 in native cattle, whereas only one variation was observed in HOL cattle. One variation found in LRR14 may impact resistance and subsequently might be under positive selection as it was only detected in native cattle breeds [47].
With regards to TLR4, we identified two non-synonymous SNPs in LRR7 (N238K and A347E), which does not contribute to the MD2 binding region. The remaining variants identified all represented synonymous variations. The TLR4 region was analyzed for somatic cell score (SCS) and three SNPs were associated with high and low SCS values (intron1 rs8193046 A/G, exon3 rs8193060 C/T, and 5′UTR rs29017188 C/G) [52]. The ACC haplotype was associated with low SCS, whereas the GTG haplotype was associated with high SCS. High allele frequencies were found for the ACC haplotype in the TG cattle breed. TLR4 is also located in one of the QTL loci for milk production and mastitis [5]. Within the analyzed breeds, the AB breed has the lowest milk production and variation for TLR4, whereas highest variation number was determined in the high milk yield breeds, SAR, EAR and HOL as shown in Figure 5.

5. Conclusions

It is worth mentioning that the number of identified novel InDel variants is significantly higher compared to the identified number of SNPs. We believe that this can be attributed to the fact that InDels were mainly identified in intronic regions, whereas exonic regions in TLRs are more conserved, as well as the fact that the genetic composition Anatolian breeds, representing a hybrid of Bos taurus and Bos indicus breeds, has not been studied before. Given global warming due to climate change and increased anti-microbial resistance due to the overuse of antibiotics, new approaches are needed to manage infectious diseases in farm animals. A key step towards these is the identification of genotypes conferring resistance to both disease and adverse environmental conditions. Our identification of non-synonymous SNPs and novel variants of TLR2, TLR4, and TLR6 genes can provide one such set of variants for future association studies and the validation of the candidate haplotypes at a cellular level.

Supplementary Materials

The following are available online at www.mdpi.com/1424-2818/8/4/23/s1, Table S1: Oligonucleotide sequences were used in amplification; Table S2: PCR conditions and chemicals; Table S3: Determined haplotypes in TLR2, TLR4 and TLR6 gene regions.

Acknowledgments

This research has been supported by Ankara University Scientific Research Projects Coordination Unit. Project Number: 13B3338011, 2013; 14H0239004, 2014 and The Scientific and Technological Research Council of Turkey (TUBITAK): 1059B141400991, 2015. Authors would like to thank Martin Krzywinski for assistance in preparation of Figure 1, Figure 2, Figure 3, Figure 4 and Figure 5.

Author Contributions

N.B.; B.C.K. and O.E. conceived and designed the experiments; N.B. and B.C.K. performed the experiments; N.B.; V.O.; and D.W. analyzed and interpret the data; N.B. and D.W. wrote the paper.

Conflicts of Interest

The authors declare no conflict of interest.

References

  1. Kumar, H.; Kawai, T.; Akira, S. Pathogen recognition by the innate immune system. Int. Rev. Immunol. 2011, 30, 16–34. [Google Scholar] [CrossRef] [PubMed]
  2. Medzhitov, R.; Janeway, C.A. Innate immunity: The virtues of a nonclonal system of recognition. Cell 1997, 91, 295–298. [Google Scholar] [CrossRef]
  3. Tizard, I.R. Veterinary Immunology, 3rd ed.; Saunders Elsevier: Saint Louis, MO, USA, 2009; pp. 13–28. [Google Scholar]
  4. Takeda, K.; Akira, S. TLR signaling pathways. Semin. Immunol. 2004, 16, 3–9. [Google Scholar] [CrossRef] [PubMed]
  5. Ogorevc, J.; Kunej, T.; Razpet, A.; Dovc, P. Database of cattle candidate genes and genetic markers for milk production and mastitis. Anim. Genet. 2009, 40, 832–851. [Google Scholar] [CrossRef] [PubMed]
  6. Huang, T.H.; Uthe, J.J.; Bearson, S.M.; Demirkale, C.Y.; Nettleton, D.; Knetter, S.; Tuggle, C.K. Distinct peripheral blood RNA responses to Salmonella in pigs differing in Salmonella shedding levels: İntersection of IFNG, TLR and miRNA pathways. PLoS ONE. 2011, 6, e28768. [Google Scholar] [CrossRef] [PubMed]
  7. McGuire, K.; Jones, M.; Werling, D.; Williams, J.L.; Glass, E.J.; Jann, O. Radiation hybrid mapping of all 10 characterized bovine Toll-like receptors. Anim. Genet. 2006, 37, 47–50. [Google Scholar] [CrossRef] [PubMed]
  8. Kent, W.J.; Sugnet, C.W.; Furey, T.S.; Roskin, K.M.; Pringle, T.H.; Zahler, A.M.; Haussler, D. The human genome browser at UCSC. Genome Res. 2002, 12, 996–1006. [Google Scholar] [CrossRef] [PubMed]
  9. Cunningham, F.; Amode, M.R.; Barrell, D.; Beal, K.; Billis, K.; Brent, S.; Gil, L. Ensembl 2015. Nucleic Acids Res. 2015, 43, D662–D669. [Google Scholar] [CrossRef] [PubMed]
  10. Jann, O.C.; Werling, D.; Chang, J.S.; Haig, D.; Glass, E.J. Molecular evolution of bovine Toll-like receptor 2 suggests substitutions of functional relevance. BMC Evol. Biol. 2008, 8, 288. [Google Scholar] [CrossRef] [PubMed]
  11. Werling, D.; Jann, O.C.; Offord, V.; Glass, E.J.; Coffey, T.J. Variation matters: TLR structure and species-specific pathogen recognition. Trends Immunol. 2009, 30, 124–130. [Google Scholar] [CrossRef] [PubMed]
  12. Schröder, N.W.; Schumann, R.R. Single nucleotide polymorphisms of Toll-like receptors and susceptibility to infectious disease. Lancet Infect. Dis. 2005, 5, 156–164. [Google Scholar] [CrossRef]
  13. Alpan, O.; Arpacik, R. Sigir Yetiştiriciliği, 2nd ed.; Sahin Matbaası: Ankara, Turkey, 1996; pp. 39–46. [Google Scholar]
  14. Yilmaz, O.; Akin, O.; Yener, S.M.; Ertugrul, M.; Wilson, R.T. The domestic livestock resources of Turkey: Cattle local breeds and types and their conservation status. Anim. Genet. Resour. 2012, 50, 65–73. [Google Scholar] [CrossRef]
  15. Özbeyaz, C. Sigir Yetiştiriciliği Ders Notlari; Ankara University, Faculty of Veterinary Medicine: Ankara, Turkey, 2015; pp. 10–26. [Google Scholar]
  16. Rozen, S.; Skaletsky, H. Primer3 on the WWW for general users and for biologist programmers. Methods Mol. Biol. 1999, 132, 365–386. [Google Scholar]
  17. Institue B. Picard. Available online: http://broadinstitute.github.io/picard (accessed on 11 May 2015).
  18. Li, H.; Handsaker, B.; Wysoker, A.; Fennell, T.; Ruan, J.; Homer, N.; Durbin, R. The sequence alignment/map format and SAM tools. Bioinformatics 2009, 25, 2078–2079. [Google Scholar] [CrossRef] [PubMed]
  19. McKenna, A.; Hanna, M.; Banks, E.; Sivachenko, A.; Cibulskis, K.; Kernytsky, A.; DePristo, M.A. The Genome Analysis Toolkit: A MapReduce framework for analyzing next-generation DNA sequencing data. Genome Res. 2010, 20, 1297–1303. [Google Scholar] [CrossRef] [PubMed]
  20. Danecek, P.; Auton, A.; Abecasis, G.; Albers, C.A.; Banks, E.; DePristo, M.A.; McVean, G. The variant call format and VCFtools. Bioinformatics 2011, 27, 2156–2158. [Google Scholar] [CrossRef] [PubMed]
  21. Cingolani, P.; Patel, V.M.; Coon, M.; Nguyen, T.; Land, S.J.; Ruden, D.M.; Lu, X. Using Drosophila Melanogaster as a Model for Genotoxic Chemical Mutational Studies with a New Program, SnpSift. In Toxicogenomics in Non-Mammalian Species; Frontiers E-books: Lausanne, Switzerland, 2012; p. 35. [Google Scholar]
  22. Cingolani, P.; Platts, A.; Wang, L.L.; Coon, M.; Nguyen, T.; Wang, L.; Ruden, D.M. A program for annotating and predicting the effects of single nucleotide polymorphisms, SnpEff: SNPs in the genome of Drosophila melanogaster strain w1118; iso-2; iso-3. Fly 2012, 6, 80–92. [Google Scholar] [CrossRef] [PubMed]
  23. McLaren, W.; Pritchard, B.; Rios, D.; Chen, Y.; Flicek, P.; Cunningham, F. Deriving the consequences of genomic variants with the Ensembl API and SNP Effect Predictor. Bioinformatics 2010, 26, 2069–2070. [Google Scholar] [CrossRef] [PubMed]
  24. Hall, T.A. BioEdit: A User-Friendly Biological Sequence Alignment Editor and Analysis Program for Windows 95/98/NT. Nucleic Acids Symp. Ser. 1999, 41, 95–98. [Google Scholar]
  25. Webb, B.; Sali, A. Comparative Protein Structure Modeling Using Modeller. Curr. Protoc. Bioinform. 2014, 47, 1–32. [Google Scholar]
  26. Laskowski, R.A.; MacArthur, M.W.; Moss, D.S.; Thornton, J.M. PROCHECK: A program to check the stereochemical quality of protein structures. J. Appl. Crystallogr. 1993, 26, 283–291. [Google Scholar] [CrossRef]
  27. Eisenberg, D.; Lüthy, R.; Bowie, J.U. VERIFY3D: Assessment of protein models with three-dimensional profiles. Methods Enzymol. 1997, 277, 396–404. [Google Scholar] [PubMed]
  28. Colovos, C.; Yeates, T.O. ERRAT: An empirical atom-based method for validating protein structures. Protein Sci. 1993, 2, 1511–1519. [Google Scholar] [CrossRef] [PubMed]
  29. Wallner, B.; Elofsson, A. Can correct protein models be identified? Protein Sci. 2003, 12, 1073–1086. [Google Scholar] [CrossRef] [PubMed]
  30. Thorvaldsdottir, H.; Robinson, J.T.; Mesirov, J.P. Integrative Genomics Viewer (IGV): High-performance genomics data visualization and exploration. Brief. Bioinform. 2013, 14, 178–192. [Google Scholar] [CrossRef] [PubMed]
  31. Delaneau, O.; Howie, B.; Cox, A.; Zagury, J.F.; Marchini, J. Haplotype estimation using sequence reads. Am. J. Hum. Biol. 2013, 93, 787–696. [Google Scholar]
  32. Bandelt, H.; Forster, P.; Rohl, A. Median joining networks for inferring intraspecific phylogenies. Mol. Biol. Evol. 1999, 16, 37–48. [Google Scholar] [CrossRef] [PubMed]
  33. DeLano, W.L. PyMOL; DeLano Scientific: San Carlos, CA, USA, 2002; p. 700. [Google Scholar]
  34. Mariotti, M.; Williams, J.L.; Dunner, S.; Valentini, A.; Pariset, L. Polymorphisms within the toll-like receptor (TLR)-2, -4, and-6 genes in cattle. Diversity 2009, 1, 7–18. [Google Scholar] [CrossRef]
  35. Garza-Gonzalez, E.; Bosques-Padilla, F.J.; Mendoza-Ibarra, S.I.; Flores-Gutierrez, J.P.; Maldonado-Garza, H.J.; Perez-Perez, G.I. Assessment of the toll-like receptor 4 Asp299Gly, Thr399Ile and interleukin-8-251 polymorphisms in the risk for the development of distal gastric cancer. BMC Cancer 2007, 7, 70. [Google Scholar] [CrossRef] [PubMed]
  36. Mucha, R.; Bhide, M.R.; Chakurkar, E.B.; Novak, M.; Mikula, I. Toll-like receptors TLR1, TLR2 and TLR4 gene mutations and natural resistance to Mycobacterium avium subsp paratuberculosis infection in cattle. Vet. Immunol. Immunopathol. 2009, 128, 381–388. [Google Scholar] [CrossRef] [PubMed]
  37. Ruiz-Larrañaga, O.; Manzano, C.; Iriondo, M.; Garrido, J.M.; Molina, E.; Vazquez, P.; Estonba, A. Genetic variation of toll-like receptor genes and infection by Mycobacterium avium ssp. paratuberculosis in Holstein-Friesian cattle. J. Dairy Sci. 2011, 94, 3635–3641. [Google Scholar] [CrossRef] [PubMed]
  38. Jungi, T.W.; Farhat, K.; Burgener, I.A.; Werling, D. Toll-like receptors in domestic animals. Cell Tissue Res. 2011, 343, 107–120. [Google Scholar] [CrossRef] [PubMed]
  39. Osvaldova, A.; Woodman, S.; Patterson, N.; Offord, V.; Mwangi, D.; Gibson, A.J.; Matiasovic, J.; Werling, D. Replacement of two aminoacids in the bovine Toll-like receptor 5 TIR domain with their human counterparts partially restores functional response to flagellin. Dev. Comp. Immunol. 2014, 47, 90–94. [Google Scholar] [CrossRef] [PubMed]
  40. Kaiser, P. The Immune System. In Breeding for Disease Resistance in Farm Animals, 3rd ed.; Bishop, S.C., Axford, R.F.E., Nicholas, F.W., Owen, J.B., Eds.; Cabi Publishing: Cambridge, MA, USA, 2010; pp. 15–38. [Google Scholar]
  41. Ropert, C.; Gazzinelli, R.T. Regulatory role of Toll-like receptor 2 during infection with Trypanosoma cruzi. J. Endotoxin Res. 2004, 10, 425–430. [Google Scholar] [CrossRef] [PubMed]
  42. Deniz, A.; Oncel, T.; Icen, H.; Simsek, A. Detection of Theileria annulata and T. buffeli in Cattle by Multiplex PCR in Diyarbakir Area. Kafkas Univ. Vet. Fak. Derg. 2012, 18, A111–A114. [Google Scholar] [CrossRef]
  43. Duzlu, O.; Yıldırım, A.; Inci, A.; Avcioglu, H.; Balkaya, I. Investigation of Babesia bovis and Babesia bigemina in cattle by Real Time PCR and molecular characterization of the isolates. Ankara Univ. Vet. Fak. Derg. 2015, 62, 27–35. [Google Scholar]
  44. Loftus, R.T.; Ertuğrul, O.; Harba, A.H.; El-Barody, M.A.; Machugh, D.E.; Park, S.D.; Bradley, D.G. A microsatellite survey of cattle from a center of origin: The Near East. Mol. Ecol. 1999, 8, 2015–2022. [Google Scholar] [CrossRef] [PubMed]
  45. Decker, J.E.; McKay, S.D.; Rolf, M.M.; Kim, J.; Alcalá, A.M.; Sonstegard, T.S.; Hanotte, O.; Götherström, A.; Seabury, C.M.; Praharani, L.; et al. Worldwide patterns of ancestry, divergence, and admixture in domesticated cattle. PLoS Genet. 2014, 10, e1004254. [Google Scholar] [CrossRef] [PubMed]
  46. Seabury, C.M.; Seabury, P.M.; Decker, J.E.; Schnabel, R.D.; Taylor, J.F.; Womack, J.E. Diversity and evolution of 11 innate immune genes in Bos taurus taurus and Bos taurus indicus cattle. Proc. Natl. Acad. Sci. USA 2010, 107, 151–156. [Google Scholar] [CrossRef] [PubMed]
  47. Fisher, C.A.; Bhattarai, E.K.; Osterstock, J.B.; Dowd, S.E.; Seabury, P.M.; Vikram, M.; Womack, J.E. Evolution of the bovine TLR gene family and member associations with Mycobacterium avium subspecies paratuberculosis infection. PLoS ONE 2011, 6, e27744. [Google Scholar] [CrossRef] [PubMed]
  48. Ingvartsen, K.L.; Dewhurst, R.J.; Friggens, N.C. On the relationship between lactational performance and health: Is it yield or metabolic imbalance that cause production diseases in dairy cattle? A position paper. Livest. Prod. Sci. 2003, 83, 277–308. [Google Scholar] [CrossRef]
  49. Oltenacu, P.A.; Broom, D.M. The impact of genetic selection for increased milk yield on the welfare of dairy cows. Anim. Welf. 2010, 19, 39–49. [Google Scholar]
  50. Haldane, J.B.S. Disease and evolution. Curr. Sci. 1992, 63, 599–604. [Google Scholar]
  51. Bermingham, M.L.; Bishop, S.C.; Woolliams, J.A.; Pong-Wong, R.; Allen, A.R.; McBride, S.H.; Glass, E.J. Genome-wide association study identifies novel loci associated with resistance to bovine tuberculosis. Heredity 2014, 112, 543–551. [Google Scholar] [CrossRef] [PubMed]
  52. De Mesquita, A.Q.; Rezende, C.S.M.; de Mesquita, A.J.; Jardim, E.A.G.; Kipnis, A.P.J. Association of TLR4 polymorphisms with subclinical mastitis in Brazilian holsteins. Braz. J. Microbiol. 2012, 43, 692–697. [Google Scholar] [CrossRef] [PubMed]
Figure 1. Geographical regions of the sampled breeds: Anatolian Black (AB), East Anatolian Red (EAR), South Anatolian Red (SAR), Turkish Grey (TG), and Holstein (HOL). Sizes of circles denote relative population sizes.
Diversity 08 00023 g001
Figure 2. The location of SNPs in TLR6, TLR4 and TLR2 in five breeds of cattle: AB, EAR, SAR, TG, and HOL. SNPs are shown by circles formatted to emphasize their potential interest. In decreasing order of interest: SNPs unique to a breed (black), SNPs found in all breeds except one (colored by breed), SNPs found in 2–3 breeds and not in HOL (hollow), SNPs found in 2–3 breeds including HOL (small grey circle). Only the first two exons and first intron for TLR6 are shown.
Diversity 08 00023 g002
Figure 3. An example of the electropherogram, arrows showing R337Q and H326Q, respectively, in the AB breed.
Diversity 08 00023 g003
Figure 4. Median joining network constructed on the basis of 36 haplotype of TLR2. Filled circles represent haplotypes, and areas within circles are proportional to the number of individuals. The length of the lines connecting haplotypes and branching points correlates approximately with the number of base substitutions.
Diversity 08 00023 g004
Figure 5. Median joining network constructed on the basis 25 haplotype of TLR4. Filled circles represent haplotypes, and areas within circles are proportional to the number of individuals. The length of the lines connecting haplotypes and branching points correlates approximately with the number of base substitutions.
Diversity 08 00023 g005
Figure 6. Predicted three-dimensional structures of homodimer of TLR2 representing the H326Q (arrows) variant. Blue: AB breed H326Q carrying individual, dark grey: one individual of HOL breed.
Diversity 08 00023 g006
Table 1. SNP variants identified in TLR2, TLR4, and TLR6 genes. In each cell of the table, the total/novel number of SNPs is shown, or only the total if no novel SNPs were found.
GeneBreed
ABEARSARTGHOL
TLR2133/11153/17155/13187/1645/3
Exon232728266
missense131617/115/14
synonymous1011/111/1112
Intron93/10111/15110/10146/1534/3
3′UTR15/113/115/1144
5′UTR22211
TLR6209/14230/5285/52179/5155
Exon262326249
missense10/29/19/18/13
synonymous16/11417/216/16
Intron177/8203/4252/46153/2103
3′UTR213/221
5′UTR4/345/11/12
TLR418/180/180/357/174/1
Exon216131015
missense1623/15
synonymous11011710
Intron1459/162/34555/1
3′UTR12211
5′UTR13515
Table 2. InDel variants identified in TLR2, TLR4, and TLR6 genes. In each cell of the table, the total/novel number of variants is shown.
GeneBreed
ABEARSARTGHOL
TLR212/1216/1315/1216/136/6
TLR623/928/1438/2421/1317/3
TLR43/15/38/36/45/1
Table 3. Missense and synonymous variations on protein domain level of TLR2 (according to reference sequence NP_776622.1).
DomainTLR2 (aa)ABEARSARTGHOLSNP ID
LRR154..7762 N/N62 N/N62 N/N62 N/N rs68268249
63 E/D63 E/D63 E/D63 E/D63 E/Drs55617172
68 G/S68 G/S68 G/S68 G/S rs68268250
LRR3102..125 119 W/L119 W/L119 W/L rs211243949
LRR5151..175 152 R/Q152 R/Q 152 R/Qrs43706434
LRR7200..223 201 S/N 201 S/Nrs110491977
211 I/V211 I/V211 I/V211 I/V211 I/Vrs43706433
LRR8224..250227 F/L227 F/L227 F/L227 F/L rs68268251
LRR9-10251..308
LRR11309..337 315 R/R rs68268253
326 H/Q326 H/Q326 H/Q326 H/Q rs68343167
LRR12338..361337 R/Q337 R/Q337 R/Q337 R/Q rs68343168
LRR13362..388
LRR14389..414405 T/M405 T/M405 T/M405 T/M rs68268255
LRR15415..437417 N/S417 N/S417 N/S417 N/S rs68268256
436 G/G436 G/G436 G/G436 G/G rs68268257
LRR16-18438..500
LRR19501..524502 S/A502 S/A502 S/A502 S/A rs68268258
530 A/A novel
531 G/S novel
LRR20533..586544 F/F545 F/F546 F/F547 F/F544 F/Frs68268259
563 R/H563 R/H563 R/H563 R/H rs68268260
569 H/H569 H/H569 H/H569 H/H569 H/Hrs41830058
Trans Membrane588..608 574 R/W novel
593 A/A593 A/A593 A/A593 A/A rs68268261
594 A/A594 A/A594 A/A594 A/A rs68343169
605 T/M605 T/M605 T/M605 T/M rs68343170
634 A/V novel
TIR640..784 644 F/F novel
655 V/A
665 H/Q665 H/Q665 H/Q665 H/Q rs68268263
675 H/H675 H/H675 H/H675 H/H rs68343171
685 I/I685 I/I685 I/I685 I/I rs68268264
738 E/Q738 E/Q738 E/Q rs207552166
738 E/E738 E/E738 E/E738 E/E rs68268266
ATG16Lmotif761..778765 P/P765 P/P765 P/P765 P/P rs68268267
Table 4. Missense and synonymous variations on protein domain level of TLR4 (according to reference sequence NP_776623.5).
DomainTLR4 (aa)ABEARSARTGHOLSNP ID
LRR155..76
LRR279..100
LRR3103..124
LRR4127..148
LRR5151..172 151 N/T 151 N/Trs8193049
LRR6176..197
LRR7205..225
238 N/K rs8193050
276 F/F rs8193051
347 A/E 347 A/Ers8193053
LRR8352..373
LRR9374..394 374 P/P374 P/P374 P/P374 P/Prs8193054
381 K/R rs8193055
385 L/L rs8193056
389 G/G389 G/G rs8193057
LRR10400..422
LRR11423..444
LRR12448..469
LRR13472..495 482 S/Y novel
LRR14497..518 507 Q/Q507 Q/Q507 Q/Q507 Q/Qrs8193059
LRR15521..542
LRR16545..568552 S/S552 S/S552 S/S552 S/S552 S/Srs8193060
LRR17-
LRR18-
LRR19-
LRRCT579..626 589 S/S rs8193061
609 C/C 609 C/Crs8193062
622 S/S rs8193063
625 N/N 625 N/Nrs8193064
649 G/G 649 G/G649 G/Grs8193065
640 V/I 640 V/Irs8193066
Trans membrane633..653
664 G/G 664 G/Grs8193067
674 T/I674 T/I674 T/I674 T/I674 T/Irs8193069
676 D/D rs8193070
TIR677..815
Table 5. Missense and synonymous variations on protein domain level of TLR6 (according to reference sequence NP_001001159.1).
DomainTLR6 (aa)ABEARSARTGHOLSNP ID
LRR_RI<43..16437 D/N 37 D/N37 D/N
LRR154..7761 Q/Q61 Q/Q61 Q/Q61 Q/Q rs68268271
LRR278..10187 R/G87 R/G87 R/G87 R/G rs68268272
LRR3102..122116 S/P116 S/P
LRR4123..147135 D/H135 D/H135 D/H135 D/H rs520121582
LRR5-LRR6148..196
LRR7197..219214 D/N214 D/N214 D/N214 D/N214 D/Nrs43702941
217 A/A217 A/A217 A/A217 A/A rs68268273
LRR8-LRR12220.354
LRR13355..378374 D/D 374 D/D374 D/Drs68268274
LRR14379..404395 T/A395 T/A395 T/A395 T/A rs68268275
400 K/K400 K/K400 K/K400 K/K rs211657505
LRR15405..428425 S/S425 S/S425 S/S425 S/S rs68268276
LRR16429..449
LRR17450..473 458 H/H458 H/H rs68268277
LRR18474..495
LRR19496..519505 N/N505 N/N505 N/N505 N/N rs55617146
526 V/A526 V/A526 V/A526 V/A526 V/Ars68343174, rs133754378
526 V526 V526 V526 V526 Vrs68343175, rs136574510
LRRCT529..582539 D/D539 D/D539 D/D rs68343176
544 V/I544 V/I rs55617465, rs68268279
573 K/K573 K/K573 K/K573 K/K rs55617193
Trans membrane585..605589 V/I589 V/I589 V/I589 V/I589 V/Irs55617317, rs207882984
605 L/L605 L/L605 L/L605 L/L605 L/Lrs68268280, rs378853146
TIR641..784642 F/F642 F/F642 F/F642 F/F rs438448894
669 I/V669 I/V669 I/V669 I/V rs210580164
674 H/H674 H/H674 H/H674 H/H674 H/Hrs209572763
676 R/R676 R/R676 R/R676 R/R rs68343178
680 A/A 680 A/A680 A/A novel
684 I/I684 I/I684 I/I684 I/I rs68343179
700 F/F700 F/F700 F/F700 F/F rs55617339, rs211454671
701 V/V701 V/V701 V/V701 V/V701 V/Vrs207586910
709 S/S709 S/S rs55617335
E/E 710 rs68268282

