

Effects of Age and Biological Age-Determining Factors on Telomere Length in Type 2 Diabetes Mellitus Patients
 ,
,  , , , and
Abstract
:1. Introduction
2. Materials and Methods
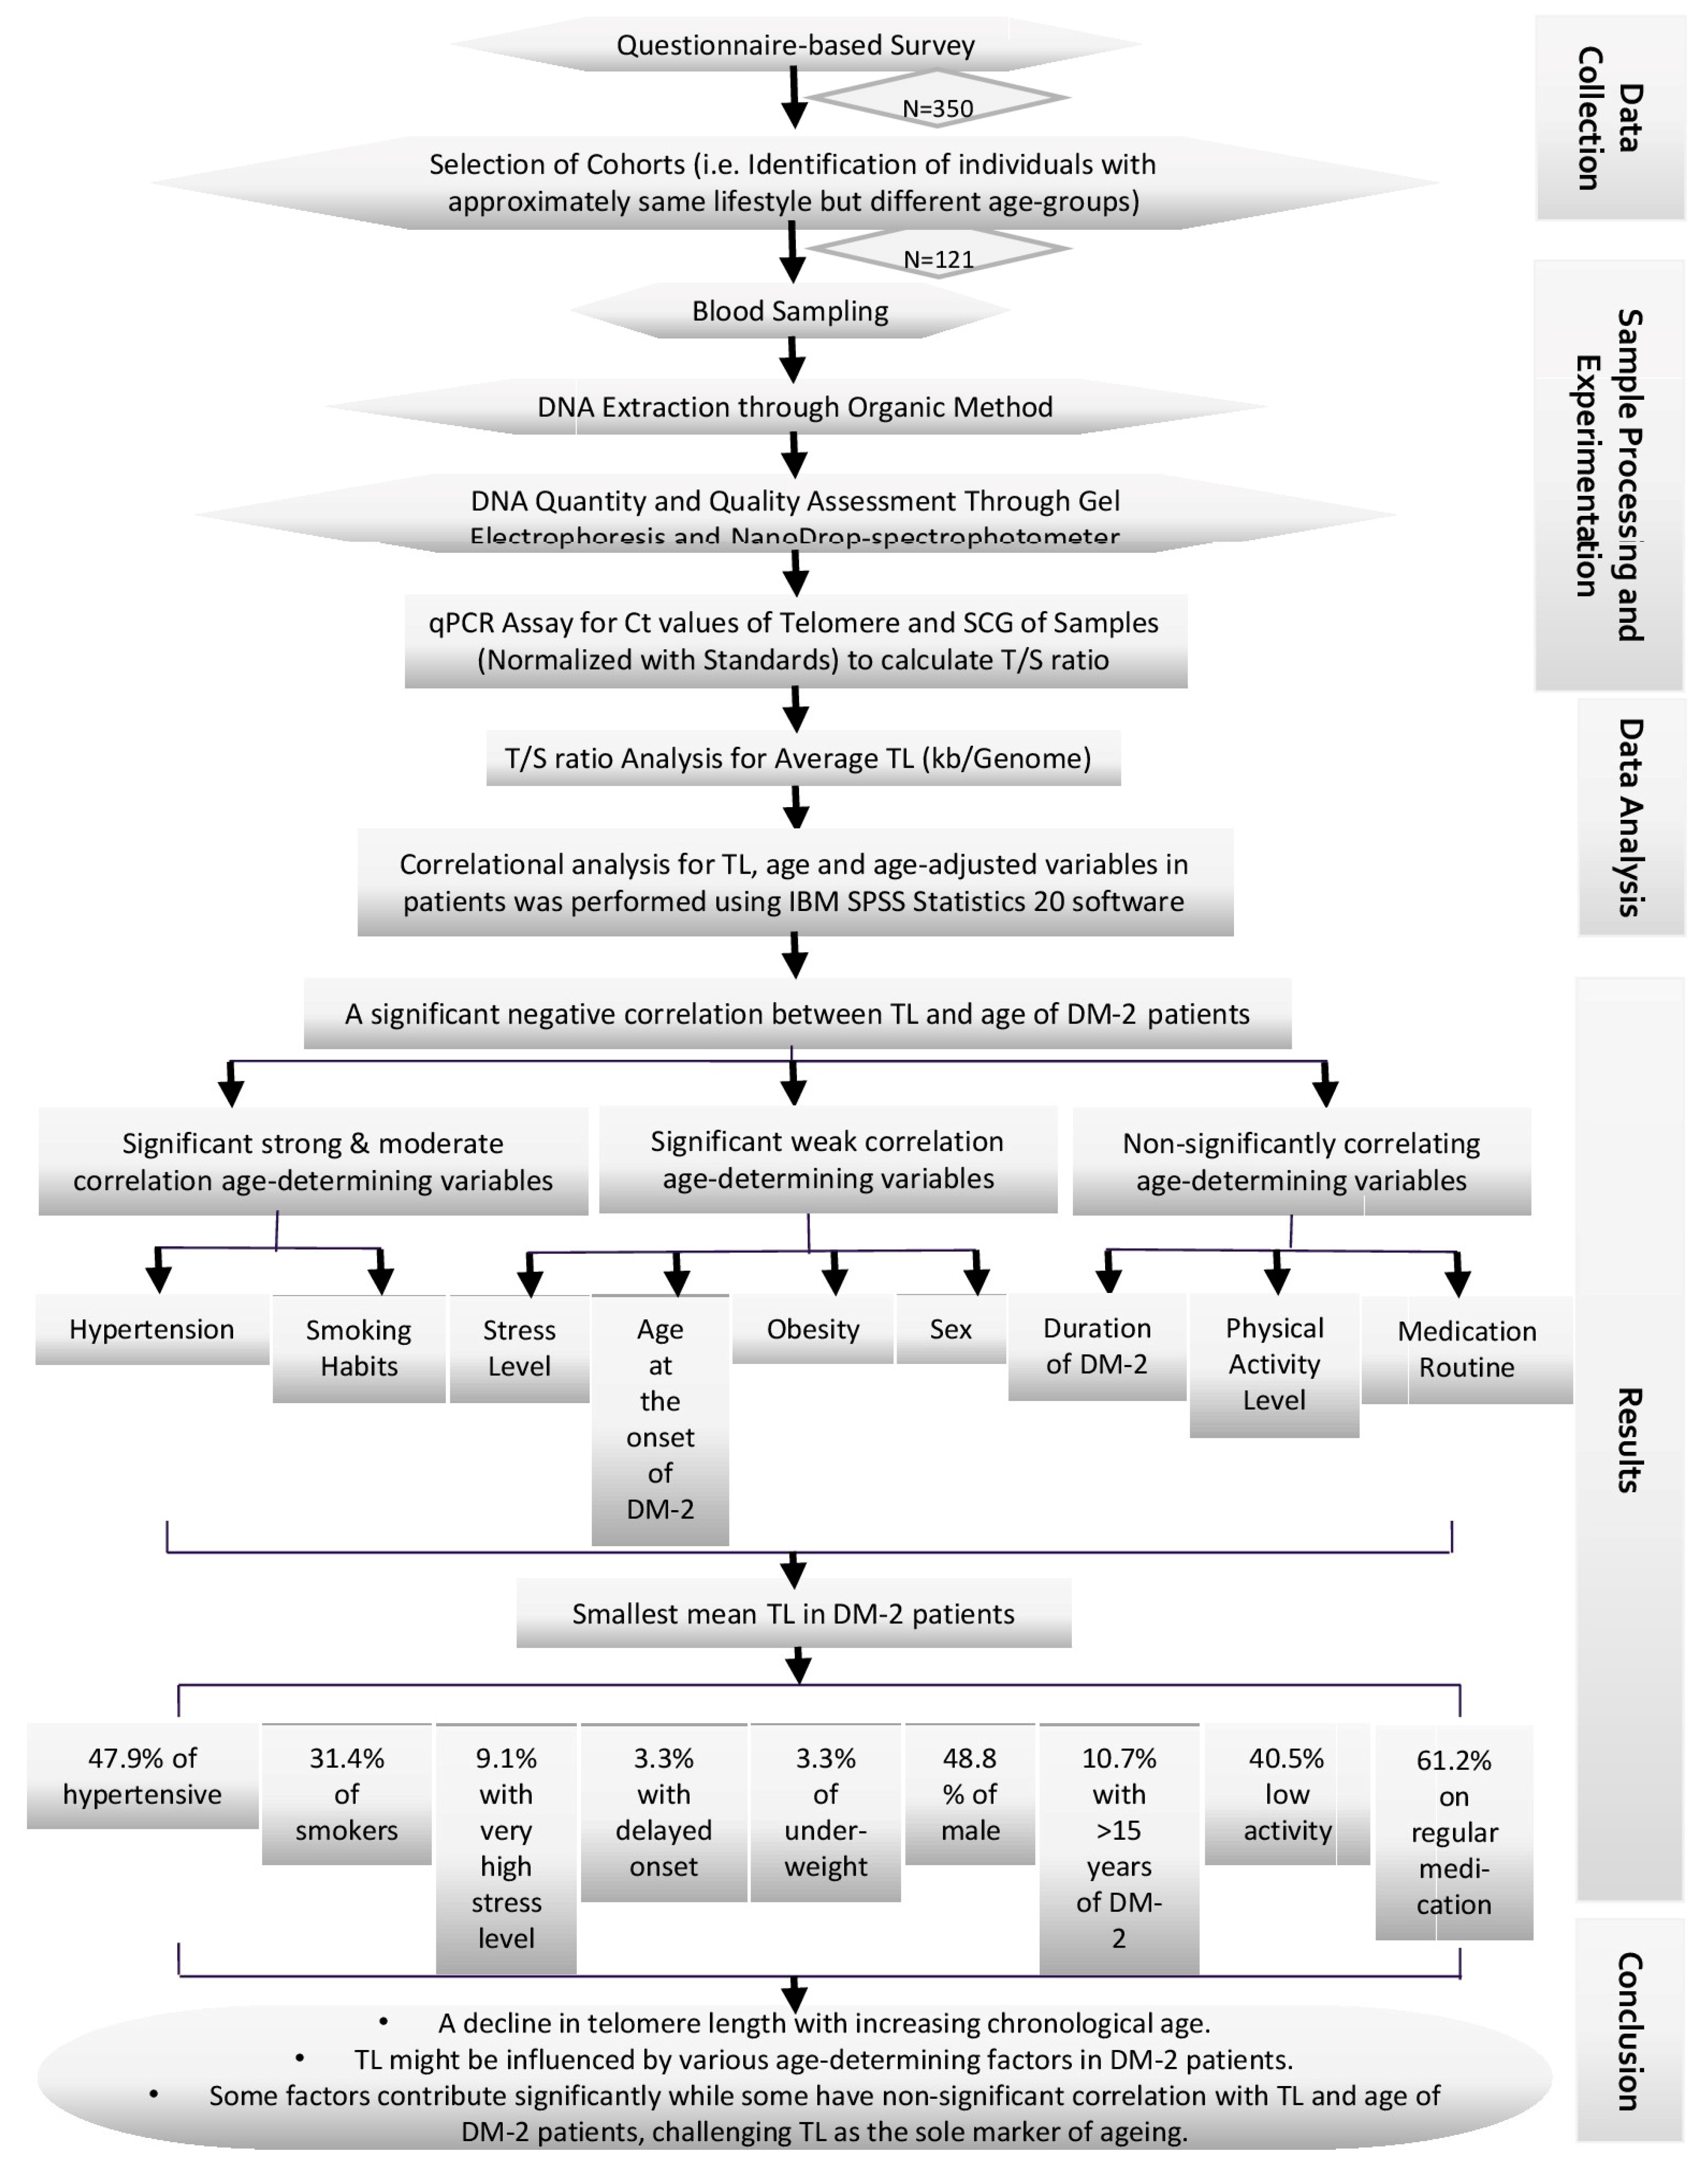
2.1. Experimental Design
2.2. Inclusion Criteria
- Geographical characteristics (i.e., samples from areas/societies of city away from industrial pollution, and samples from developed residential areas free from a congested population and heavy traffic, also samples from migrants or new residents were avoided);
- The patient’s medical history (patients having a medical history of a cardiac or any metabolic disorder, any physical disability, genetic disorder, cancer, or any other chronic disease were skipped);
- The use of supplements (no samples were collected from the patients taking vitamins or supplements through pills or injections);
- Sleep time (samples were collected only from patients with 7–8 h of sleep per day);
- Extra physical activity (patients performing excessive exercise and gym workouts were not considered in this study);
- Tobacco consumption other than smoking (patients taking smokeless or chewable forms of tobacco were not considered suitable candidates for sampling);
- Lifestyle variations (individuals with exhaustive working hours of >6 h/day at the job, individuals below the poverty line, individuals with luxurious lifestyles, individuals with high consumption of fats in diet were also not considered; moreover, patients taking medicines other than metformin were also excluded from this study);
- Marital status (only married individuals were considered for further analysis);
- Fertility (infertile, menopausal, and post-menopausal patients were not analyzed further).
2.3. Sample Collection
2.4. DNA Extraction
2.5. Oligomers
2.6. Serial Dilutions
2.7. Normalization
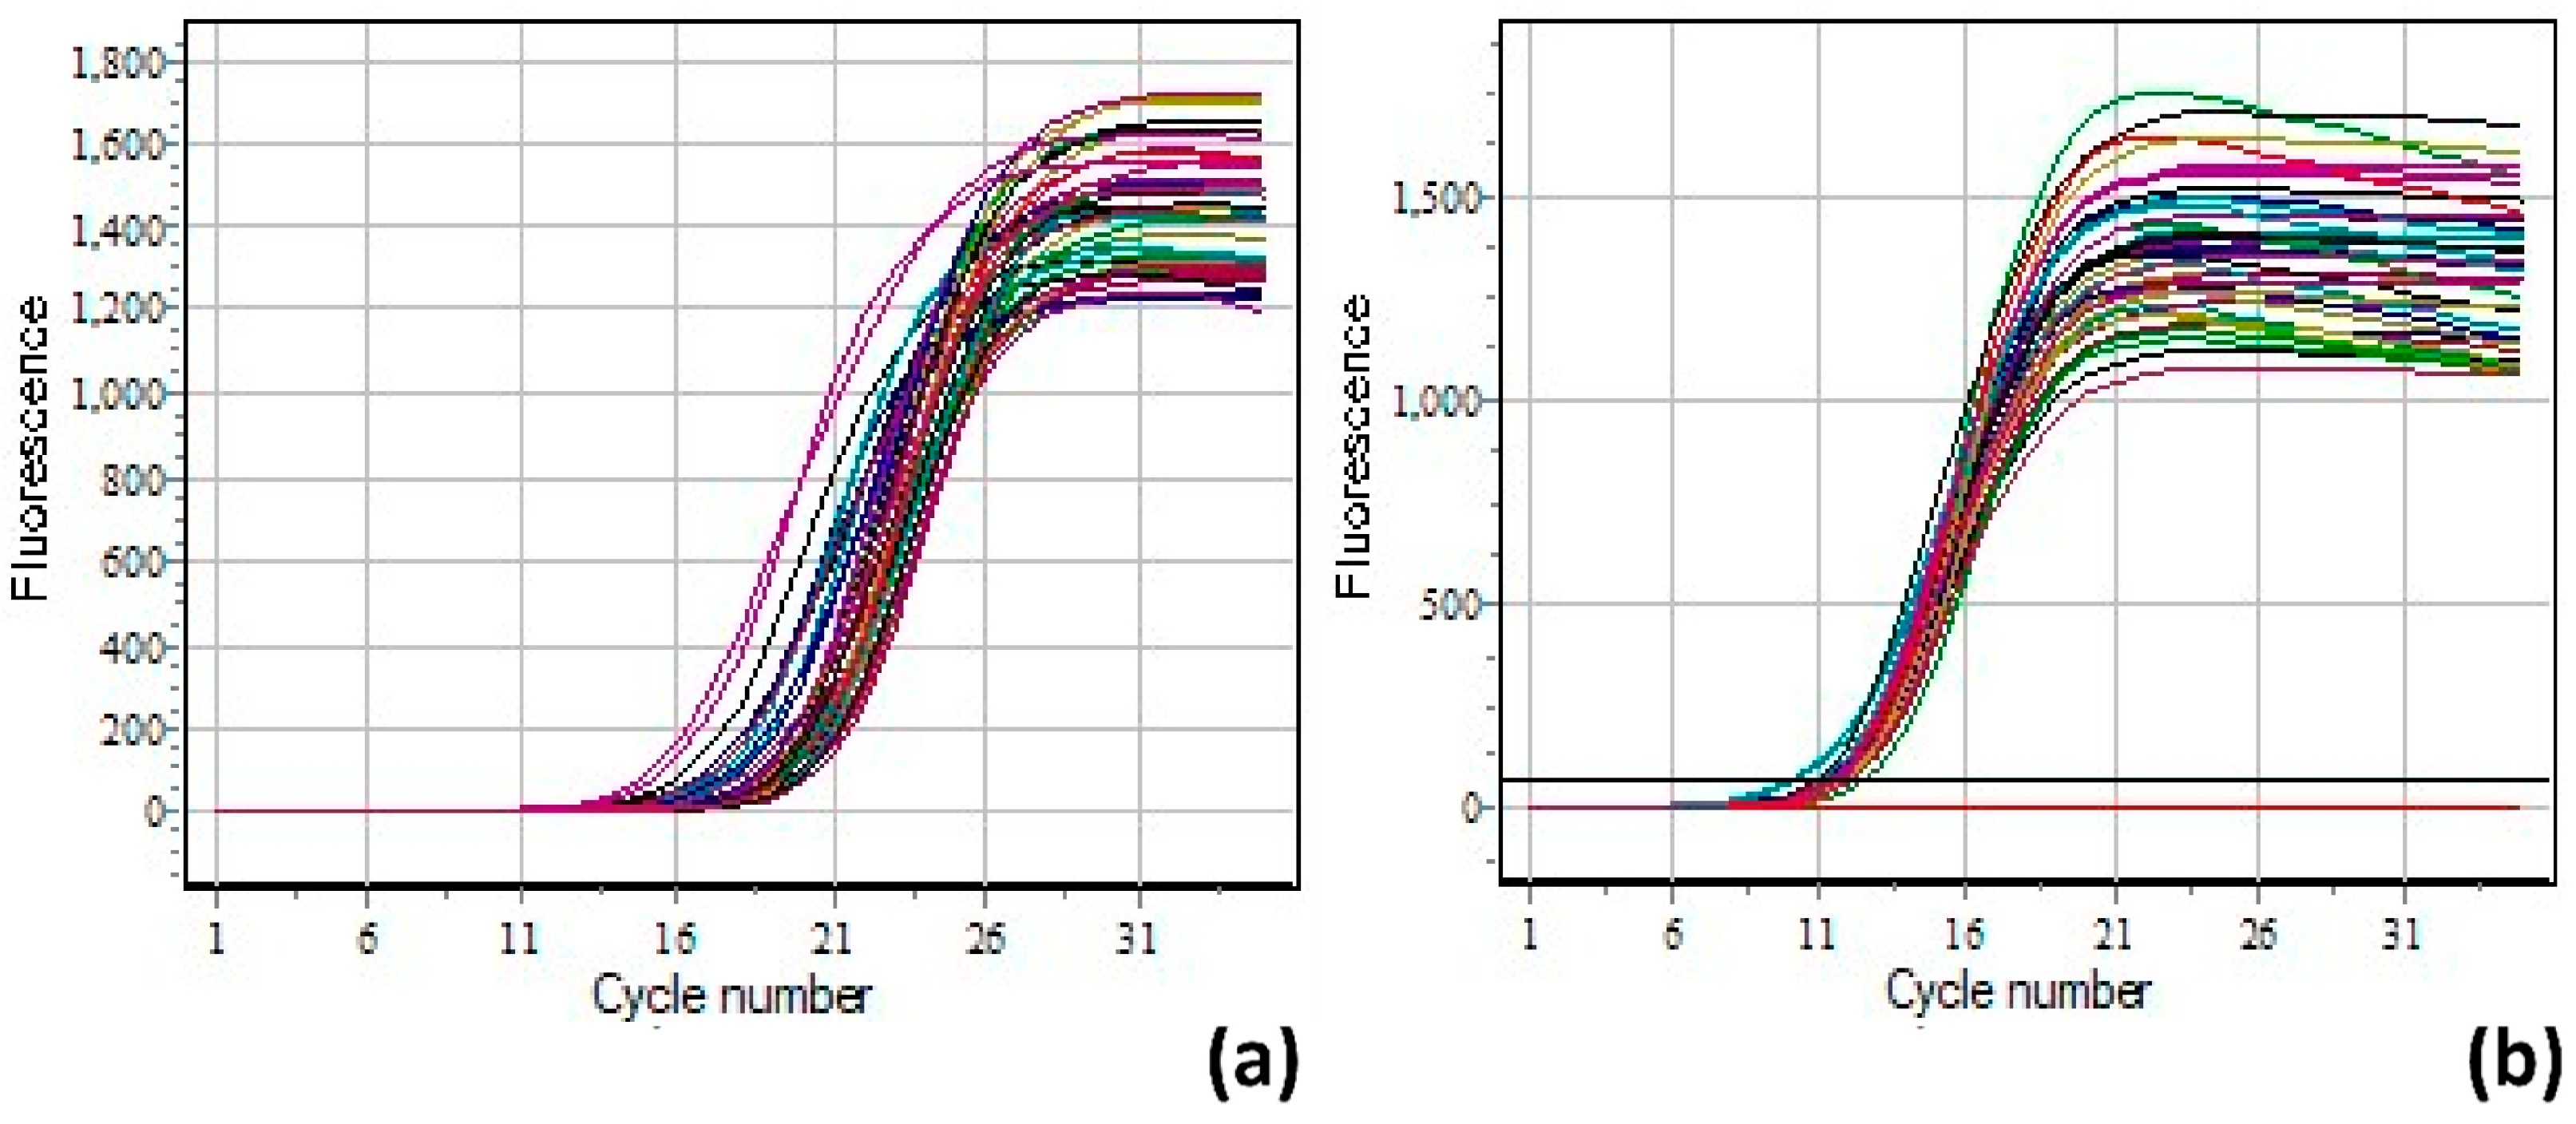
2.8. qPCR Protocol
2.9. Data Analysis
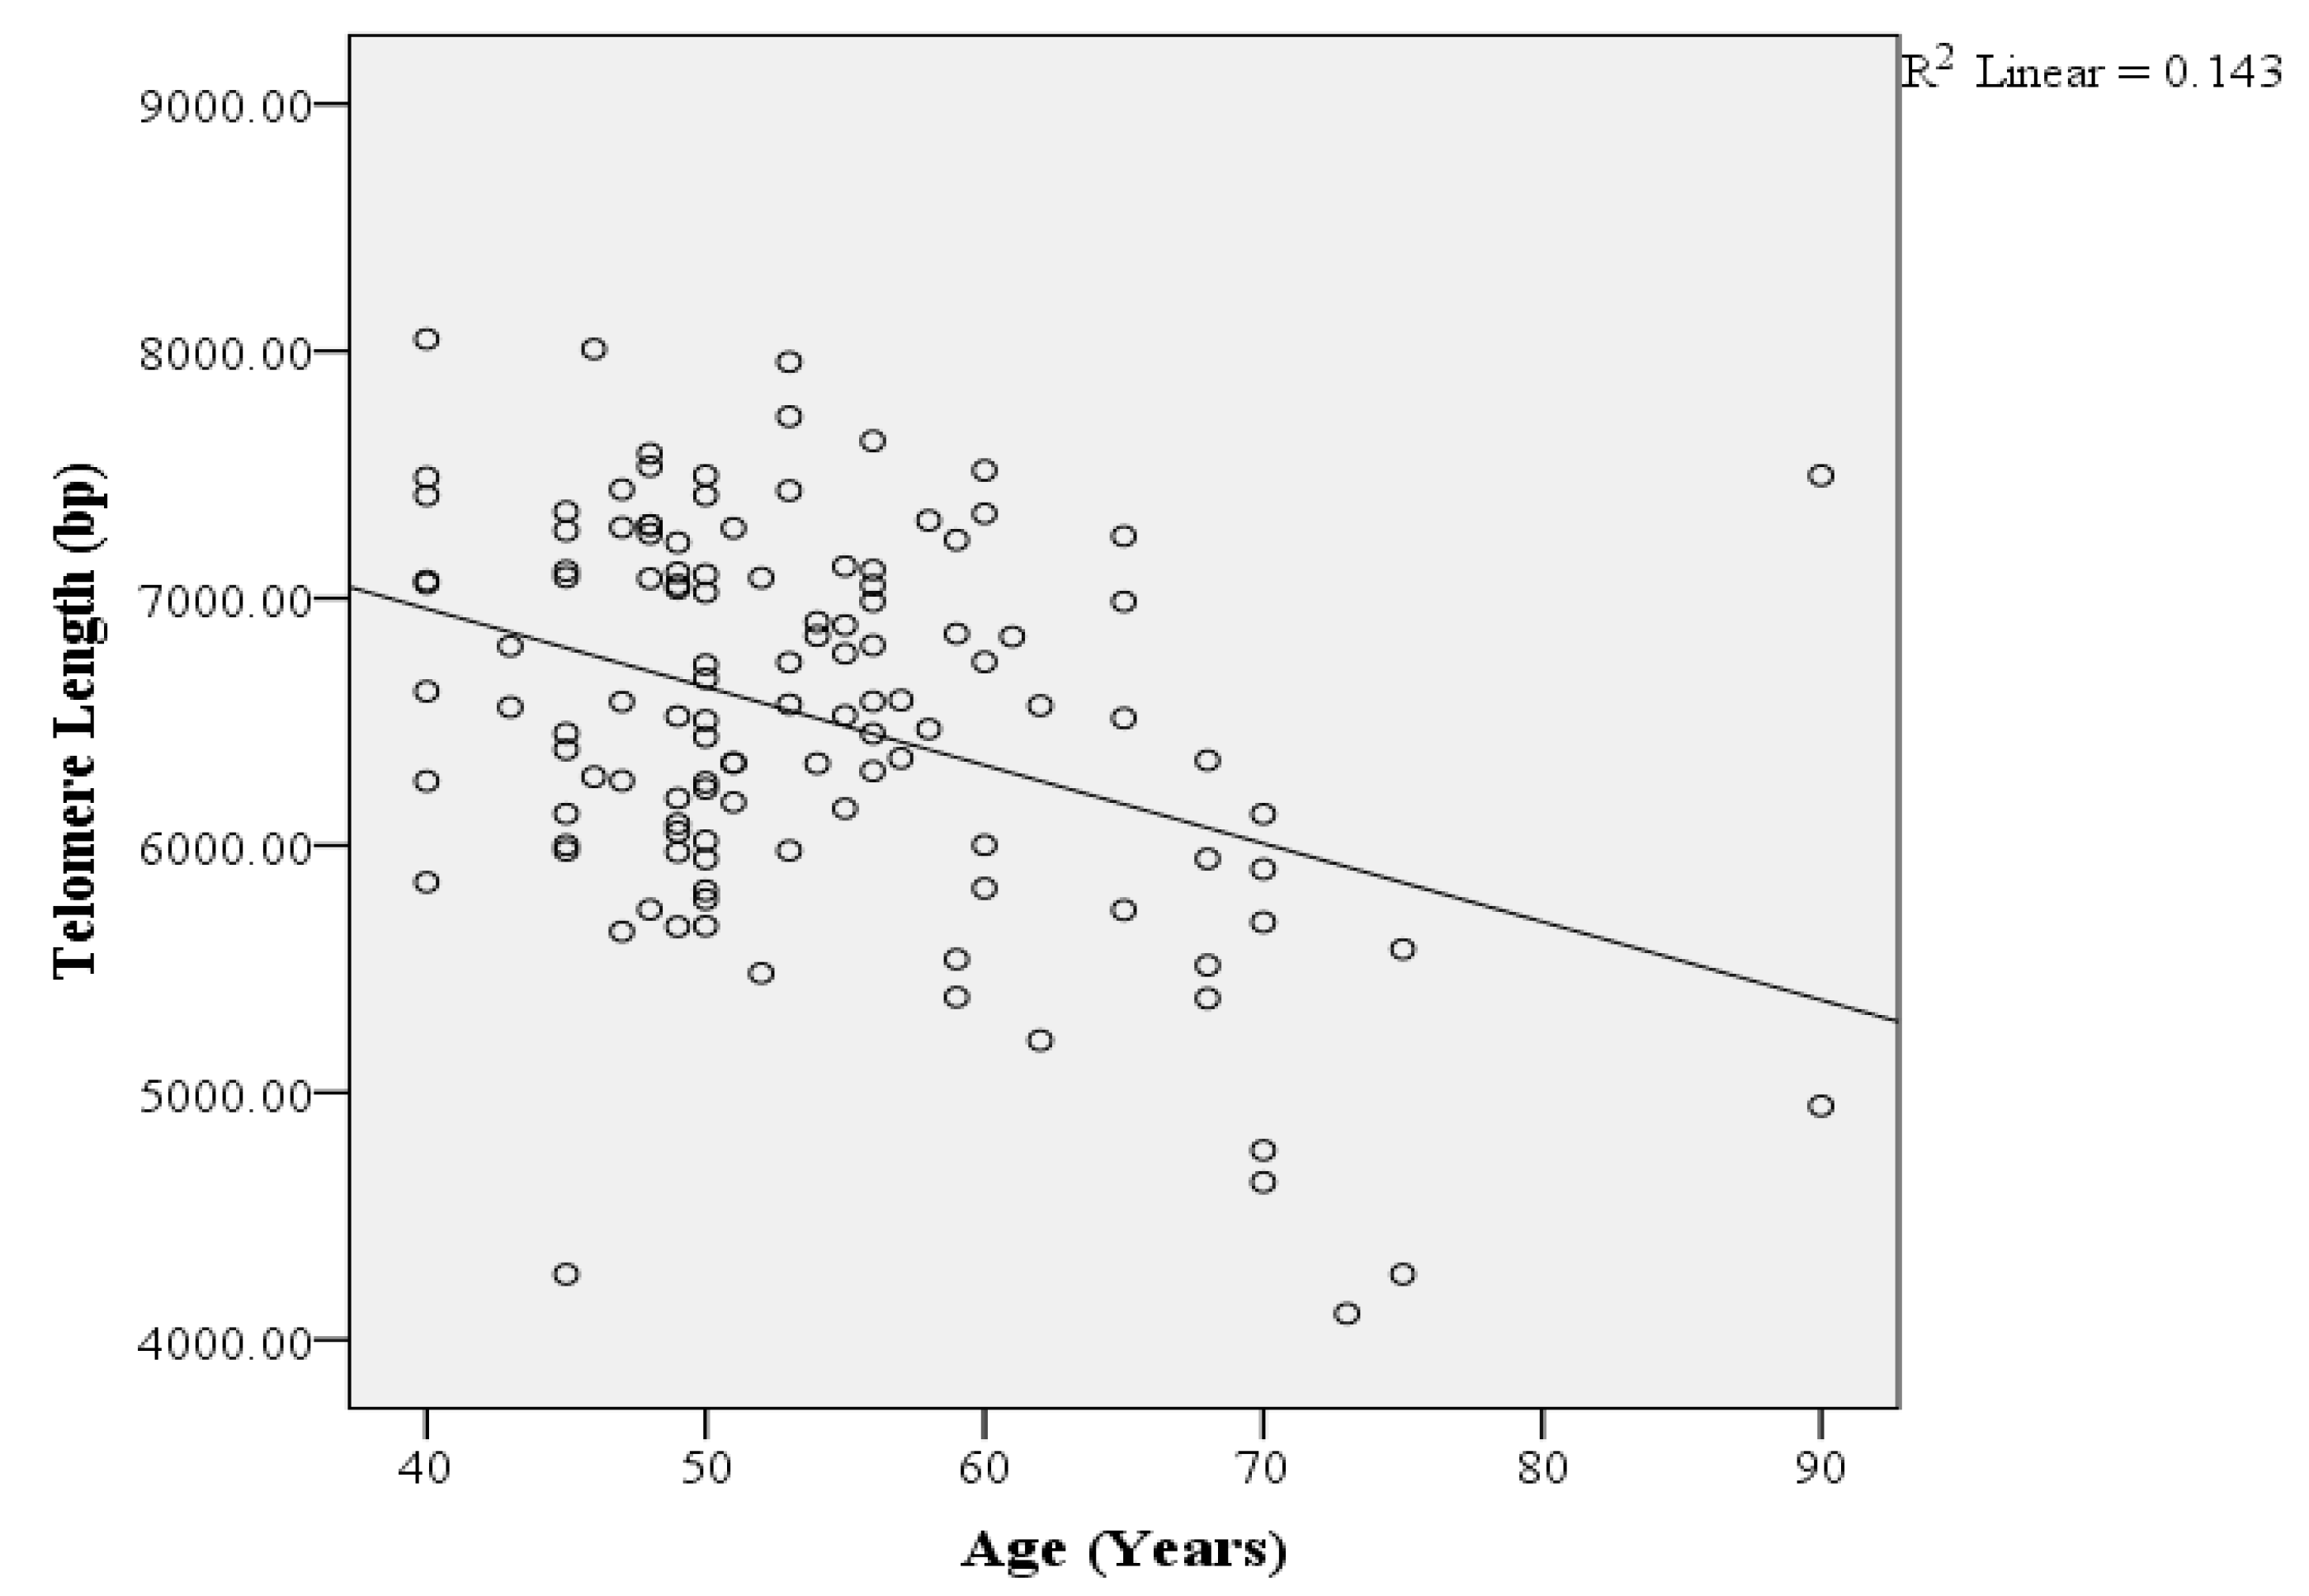
3. Results
4. Discussion
5. Conclusions
6. Recommendations
Supplementary Materials
Author Contributions
Funding
Institutional Review Board Statement
Informed Consent Statement
Data Availability Statement
Acknowledgments
Conflicts of Interest
Abbreviations
References
- American Diabetes Association, A. Diagnosis and classification of diabetes mellitus. Diabetes Care 2014, 37 (Suppl. S1), S81–S90. [Google Scholar] [CrossRef] [PubMed]
- Banday, M.Z.; Sameer, A.S.; Nissar, S. Pathophysiology of diabetes: An overview. Avicenna J. Med. 2020, 10, 174–188. [Google Scholar] [CrossRef] [PubMed]
- Fazeli Farsani, S.; Van Der Aa, M.; Van Der Vorst, M.; Knibbe, C.; De Boer, A. Global trends in the incidence and prevalence of type 2 diabetes in children and adolescents: A systematic review and evaluation of methodological approaches. Diabetologia 2013, 56, 1471–1488. [Google Scholar] [CrossRef]
- Tremblay, J.; Hamet, P. Environmental and genetic contributions to diabetes. Metab.-Clin. Exp. 2019, 100, 153952. [Google Scholar] [CrossRef] [PubMed]
- Basit, A.; Fawwad, A.; Qureshi, H.; Shera, A. Prevalence of diabetes, pre-diabetes and associated risk factors: Second National Diabetes Survey of Pakistan (NDSP), 2016–2017. BMJ Open 2018, 8, e020961. [Google Scholar] [CrossRef] [PubMed]
- Aamir, A.H.; Ul-Haq, Z.; Mahar, S.A.; Qureshi, F.M.; Ahmad, I.; Jawa, A.; Sheikh, A.; Raza, A.; Fazid, S.; Jadoon, Z. Diabetes Prevalence Survey of Pakistan (DPS-PAK): Prevalence of type 2 diabetes mellitus and prediabetes using HbA1c: A population-based survey from Pakistan. BMJ Open 2019, 9, e025300. [Google Scholar] [CrossRef] [PubMed]
- Blackburn, E.H.; Epel, E.S.; Lin, J. Human telomere biology: A contributory and interactive factor in aging, disease risks, and protection. Science 2015, 350, 1193–1198. [Google Scholar] [CrossRef]
- López-Otín, C.; Blasco, M.A.; Partridge, L.; Serrano, M.; Kroemer, G. The hallmarks of aging. Cell 2013, 153, 1194–1217. [Google Scholar] [CrossRef] [PubMed]
- Willeit, P.; Raschenberger, J.; Heydon, E.E.; Tsimikas, S.; Haun, M.; Mayr, A.; Weger, S.; Witztum, J.L.; Butterworth, A.S.; Willeit, J. Leucocyte telomere length and risk of type 2 diabetes mellitus: New prospective cohort study and literature-based meta-analysis. PLoS ONE 2014, 9, e112483. [Google Scholar] [CrossRef]
- Haycock, P.C.; Heydon, E.E.; Kaptoge, S.; Butterworth, A.S.; Thompson, A.; Willeit, P. Leucocyte telomere length and risk of cardiovascular disease: Systematic review and meta-analysis. BMJ 2014, 349, g4227. [Google Scholar] [CrossRef]
- Arbeev, K.G.; Verhulst, S.; Steenstrup, T.; Kark, J.D.; Bagley, O.; Kooperberg, C.; Reiner, A.P.; Hwang, S.-J.; Levy, D.; Fitzpatrick, A.L. Association of leukocyte telomere length with mortality among adult participants in 3 longitudinal studies. JAMA Netw. Open 2020, 3, e200023. [Google Scholar] [CrossRef] [PubMed]
- Rehkopf, D.H.; Needham, B.L.; Lin, J.; Blackburn, E.H.; Zota, A.R.; Wojcicki, J.M.; Epel, E.S. Leukocyte telomere length in relation to 17 biomarkers of cardiovascular disease risk: A cross-sectional study of US adults. PLoS Med. 2016, 13, e1002188. [Google Scholar] [CrossRef] [PubMed]
- Patel, C.J.; Manrai, A.K.; Corona, E.; Kohane, I.S. Systematic correlation of environmental exposure and physiological and self-reported behaviour factors with leukocyte telomere length. Int. J. Epidemiol. 2017, 46, 44–56. [Google Scholar] [CrossRef] [PubMed]
- Aviv, A.; Hunt, S.C.; Lin, J.; Cao, X.; Kimura, M.; Blackburn, E. Impartial comparative analysis of measurement of leukocyte telomere length/DNA content by Southern blots and qPCR. Nucleic Acids Res. 2011, 39, e134. [Google Scholar] [CrossRef] [PubMed]
- Adaikalakoteswari, A.; Vatish, M.; Lawson, A.; Wood, C.; Sivakumar, K.; McTernan, P.G.; Webster, C.; Anderson, N.; Yajnik, C.S.; Tripathi, G. Low maternal vitamin B12 status is associated with lower cord blood HDL cholesterol in white Caucasians living in the UK. Nutrients 2015, 7, 2401–2414. [Google Scholar] [CrossRef] [PubMed]
- Cheng, F.; Carroll, L.; Joglekar, M.V.; Januszewski, A.S.; Wong, K.K.; Hardikar, A.A.; Jenkins, A.J.; Ma, R.C.W. Diabetes, metabolic disease, and telomere length. Lancet Diabetes Endocrinol. 2021, 9, 117–126. [Google Scholar] [CrossRef] [PubMed]
- Piplani, S.; Alemao, N.N.; Prabhu, M.; Ambar, S.; Chugh, Y.; Chugh, S.K. Correlation of the telomere length with type 2 diabetes mellitus in patients with ischemic heart disease. Indian Heart J. 2018, 70 (Suppl. S3), S173–S176. [Google Scholar] [CrossRef] [PubMed]
- Cawthon, R. Telomere measurement by quantitative PCR. Nucleic Acids Res. 2002, 30, e47. [Google Scholar] [CrossRef] [PubMed]
- Axelrad, M.D.; Budagov, T.; Atzmon, G. Telomere length and telomerase activity; a Yin and Yang of cell senescence. JoVE (J. Vis. Exp.) 2013, 22, e50246. [Google Scholar]
- Shen, C.-H. Diagnostic Molecular Biology, 2nd ed.; Elsevier: Amsterdam, The Netherlands, 2023. [Google Scholar]
- O’Callaghan, N.J.; Fenech, M. A quantitative PCR method for measuring absolute telomere length. Biol. Proced. Online 2011, 13, 3. [Google Scholar] [CrossRef]
- Atzmon, G.; Cho, M.; Cawthon, R.M.; Budagov, T.; Katz, M.; Yang, X.; Siegel, G.; Bergman, A.; Huffman, D.M.; Schechter, C.B. Genetic variation in human telomerase is associated with telomere length in Ashkenazi centenarians. Proc. Natl. Acad. Sci. USA 2010, 107 (Suppl. S3), 1710–1717. [Google Scholar] [CrossRef]
- Weischer, M.; Bojesen, S.E.; Cawthon, R.M.; Freiberg, J.J.; Tybjærg-Hansen, A.; Nordestgaard, B.G. Short telomere length, myocardial infarction, ischemic heart disease, and early death. Arterioscler. Thromb. Vasc. Biol. 2012, 32, 822–829. [Google Scholar] [CrossRef] [PubMed]
- Shen, M.; Cawthon, R.; Rothman, N.; Weinstein, S.J.; Virtamo, J.; Hosgood III, H.D.; Hu, W.; Lim, U.; Albanes, D.; Lan, Q. A prospective study of telomere length measured by monochrome multiplex quantitative PCR and risk of lung cancer. Lung Cancer 2011, 73, 133–137. [Google Scholar] [CrossRef]
- Hochstrasser, T.; Marksteiner, J.; Humpel, C. Telomere length is age-dependent and reduced in monocytes of Alzheimer patients. Exp. Gerontol. 2012, 47, 160–163. [Google Scholar] [CrossRef] [PubMed]
- Insel, K.C.; Merkle, C.J.; Hsiao, C.-P.; Vidrine, A.N.; Montgomery, D.W. Biomarkers for cognitive aging part I: Telomere length, blood pressure and cognition among individuals with hypertension. Biol. Res. Nurs. 2012, 14, 124–132. [Google Scholar] [CrossRef]
- Monickaraj, F.; Aravind, S.; Gokulakrishnan, K.; Sathishkumar, C.; Prabu, P.; Prabu, D.; Mohan, V.; Balasubramanyam, M. Accelerated aging as evidenced by increased telomere shortening and mitochondrial DNA depletion in patients with type 2 diabetes. Mol. Cell. Biochem. 2012, 365, 343–350. [Google Scholar] [CrossRef] [PubMed]
- Shammas, M.A. Telomeres, lifestyle, cancer, and aging. Curr. Opin. Clin. Nutr. Metab. Care 2011, 14, 28–34. [Google Scholar] [CrossRef]
- Yaffe, K.; Lindquist, K.; Kluse, M.; Cawthon, R.; Harris, T.; Hsueh, W.-C.; Simonsick, E.M.; Kuller, L.; Li, R.; Ayonayon, H.N. Telomere length and cognitive function in community-dwelling elders: Findings from the Health ABC Study. Neurobiol. Aging 2011, 32, 2055–2060. [Google Scholar] [CrossRef] [PubMed]
- Pauleck, S.; Sinnott, J.A.; Zheng, Y.-L.; Gadalla, S.M.; Viskochil, R.; Haaland, B.; Cawthon, R.M.; Hoffmeister, A.; Hardikar, S. Association of Telomere Length with Colorectal Cancer Risk and Prognosis: A Systematic Review and Meta-Analysis. Cancers 2023, 15, 1159. [Google Scholar] [CrossRef]
- IDF. IDF diabetes atlas. In Diabetes; International Diabetes Federation: Brussels, Belgium, 2017; Volume 20, p. 79. [Google Scholar]
- Saeedi, P.; Petersohn, I.; Salpea, P.; Malanda, B.; Karuranga, S.; Unwin, N.; Colagiuri, S.; Guariguata, L.; Motala, A.A.; Ogurtsova, K. Global and regional diabetes prevalence estimates for 2019 and projections for 2030 and 2045: Results from the International Diabetes Federation Diabetes Atlas. Diabetes Res. Clin. Pract. 2019, 157, 107843. [Google Scholar] [CrossRef]
- Fyhrquist, F.; Tiitu, A.; Saijonmaa, O.; Forsblom, C.; Groop, P.H.; Group, F.S. Telomere length and progression of diabetic nephropathy in patients with type 1 diabetes. J. Intern. Med. 2010, 267, 278–286. [Google Scholar] [CrossRef]
- Januszewski, A.S.; Sutanto, S.S.; McLennan, S.; O’Neal, D.N.; Keech, A.C.; Twigg, S.M.; Jenkins, A.J. Shorter telomeres in adults with Type 1 diabetes correlate with diabetes duration, but only weakly with vascular function and risk factors. Diabetes Res. Clin. Pract. 2016, 117, 4–11. [Google Scholar] [CrossRef]
- Sharma, R.; Gupta, A.; Thungapathra, M.; Bansal, R. Telomere mean length in patients with diabetic retinopathy. Sci. Rep. 2015, 5, 18368. [Google Scholar] [CrossRef] [PubMed]
- Chaithanya, V.; Kumar, J.; Leela, K.V.; Murugesan, R.; Angelin, M.; Satheesan, A. Impact of telomere attrition on diabetes mellitus and its complications. Diabetes Epidemiol. Manag. 2023, 12, 100174. [Google Scholar] [CrossRef]
- Palmer, A.K.; Gustafson, B.; Kirkland, J.L.; Smith, U. Cellular senescence: At the nexus between ageing and diabetes. Diabetologia 2019, 62, 1835–1841. [Google Scholar] [CrossRef] [PubMed]
- Mundstock, E.; Sarria, E.E.; Zatti, H.; Mattos Louzada, F.; Kich Grun, L.; Herbert Jones, M.; Guma, F.T.; Mazzola, J.; Epifanio, M.; Stein, R.T. Effect of obesity on telomere length: Systematic review and meta-analysis. Obesity 2015, 23, 2165–2174. [Google Scholar] [CrossRef]
- Njajou, O.T.; Cawthon, R.M.; Blackburn, E.H.; Harris, T.B.; Li, R.; Sanders, J.L.; Newman, A.B.; Nalls, M.; Cummings, S.R.; Hsueh, W.-C. Shorter telomeres are associated with obesity and weight gain in the elderly. Int. J. Obes. 2012, 36, 1176–1179. [Google Scholar] [CrossRef]
- Edwards, M.K.; Loprinzi, P.D. Sedentary behavior, physical activity and cardiorespiratory fitness on leukocyte telomere length. Health Promot. Perspect. 2017, 7, 22–27. [Google Scholar] [CrossRef]
- Stenbäck, V.; Mutt, S.J.; Leppäluoto, J.; Gagnon, D.D.; Mäkelä, K.A.; Jokelainen, J.; Keinänen-Kiukaanniemi, S.; Herzig, K.-H. Association of Physical Activity With Telomere Length Among Elderly Adults—The Oulu Cohort 1945. Front. Physiol. 2019, 10, 444. [Google Scholar] [CrossRef]
- Bhupatiraju, C.; Saini, D.; Patkar, S.; Deepak, P.; Das, B.; Padma, T. Association of shorter telomere length with essential hypertension in Indian population. Am. J. Hum. Biol. 2012, 24, 573–578. [Google Scholar] [CrossRef]
- Yeh, J.-K.; Wang, C.-Y. Telomeres and telomerase in cardiovascular diseases. Genes 2016, 7, 58. [Google Scholar] [CrossRef]
- Tellechea, M.L.; Pirola, C.J. The impact of hypertension on leukocyte telomere length: A systematic review and meta-analysis of human studies. J. Hum. Hypertens. 2017, 31, 99–105. [Google Scholar] [CrossRef]
- Parks, C.G.; DeRoo, L.; Miller, D.; McCanlies, E.; Cawthon, R.; Sandler, D. Employment and work schedule are related to telomere length in women. Occup. Environ. Med. 2011, 68, 582–589. [Google Scholar] [CrossRef]
- Xu, Q.; Parks, C.G.; DeRoo, L.A.; Cawthon, R.M.; Sandler, D.P.; Chen, H. Multivitamin use and telomere length in women. Am. J. Clin. Nutr. 2009, 89, 1857–1863. [Google Scholar] [CrossRef]
- Artandi, S.E.; DePinho, R.A. Telomeres and telomerase in cancer. Carcinogenesis 2010, 31, 9–18. [Google Scholar] [CrossRef]
- Zhang, C.; Doherty, J.A.; Burgess, S.; Hung, R.J.; Lindström, S.; Kraft, P.; Gong, J.; Amos, C.I.; Sellers, T.A.; Monteiro, A.N.; et al. Genetic determinants of telomere length and risk of common cancers: A Mendelian randomization study. Hum. Mol. Genet. 2015, 24, 5356–5366. [Google Scholar] [CrossRef]
- Hurvitz, N.; Elkhateeb, N.; Sigawi, T.; Rinsky-Halivni, L.; Ilan, Y. Improving the effectiveness of anti-aging modalities by using the constrained disorder principle-based management algorithms. Front. Aging 2022, 3, 1044038. [Google Scholar] [CrossRef]


| Telomere Standard (ng/µL) | SCG Standard (ng/µL) |
|---|---|
| 6.10 | 1.8 |
| 3.63 | 1.07 |
| 2.16 | 0.64 |
| 1.29 | 0.38 |
| 0.77 | 0.23 |
| Age Determinants | Variables | Mean Telomere Length (kb) | Minimum and Maximum Lengths (kb) | No. of Patients (N) | %N | p Value | R | R2 |
|---|---|---|---|---|---|---|---|---|
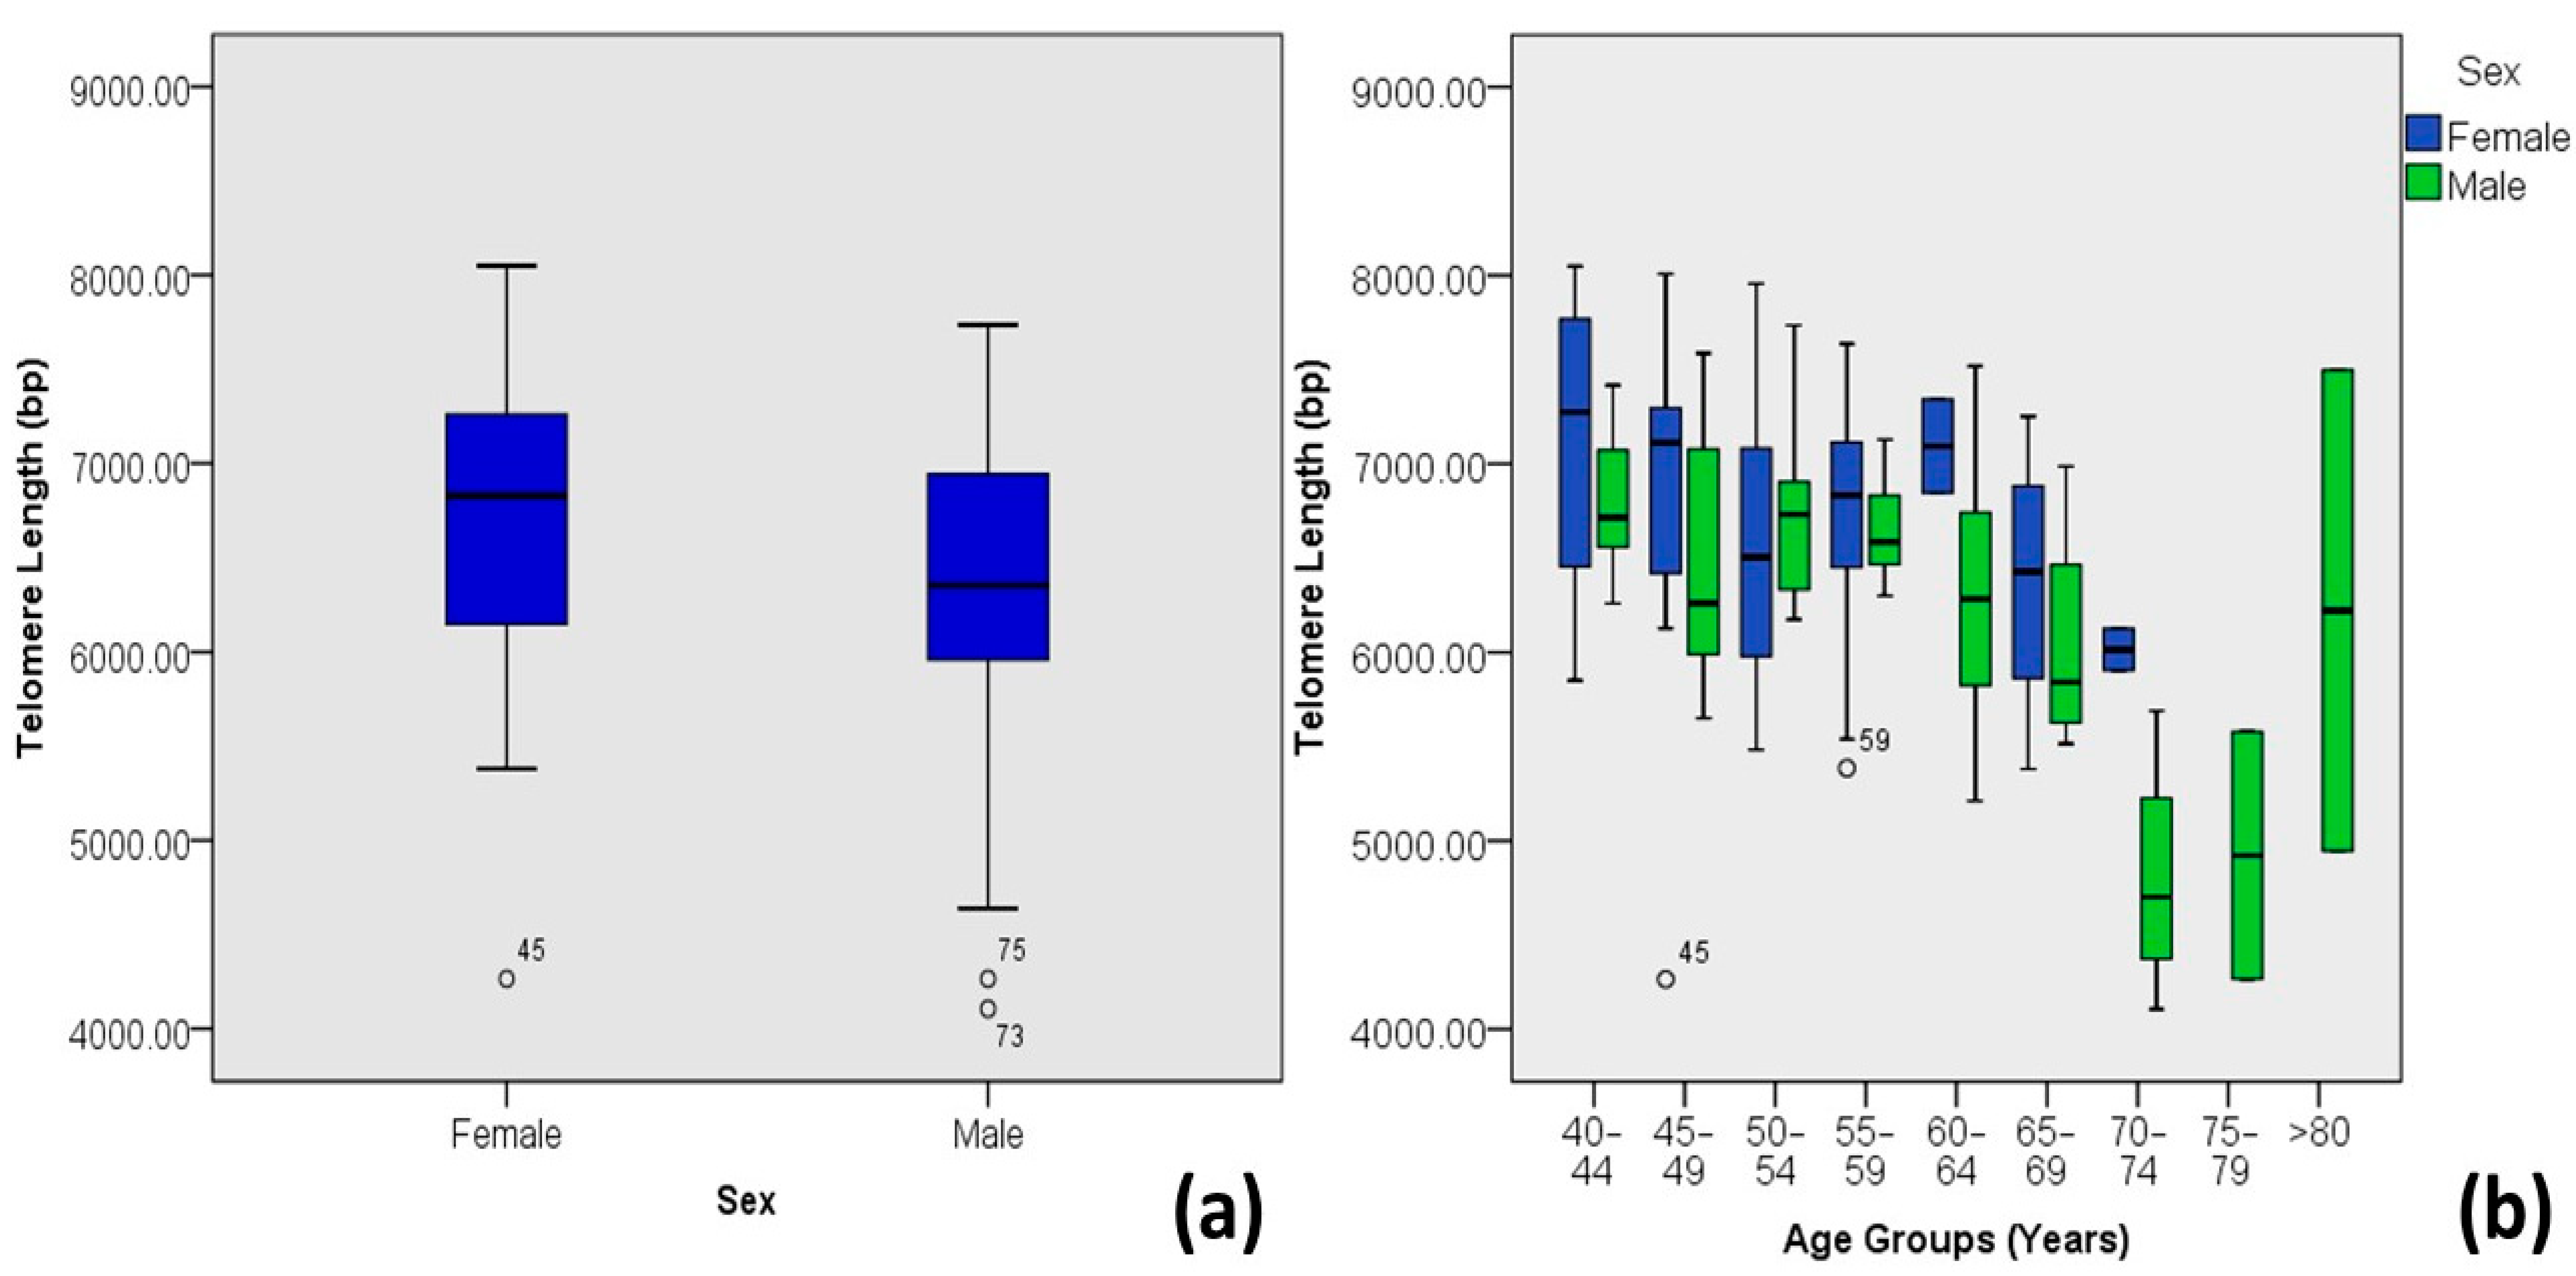
| Sex | Male | 6.35 ± 0.82 | 4.11–7.73 | 59 | 48.8 | 0.02 | −0.207 * | 0.043 |
| Female | 6.68 ± 0.74 | 4.26–8.05 | 62 | 51.2 | ||||
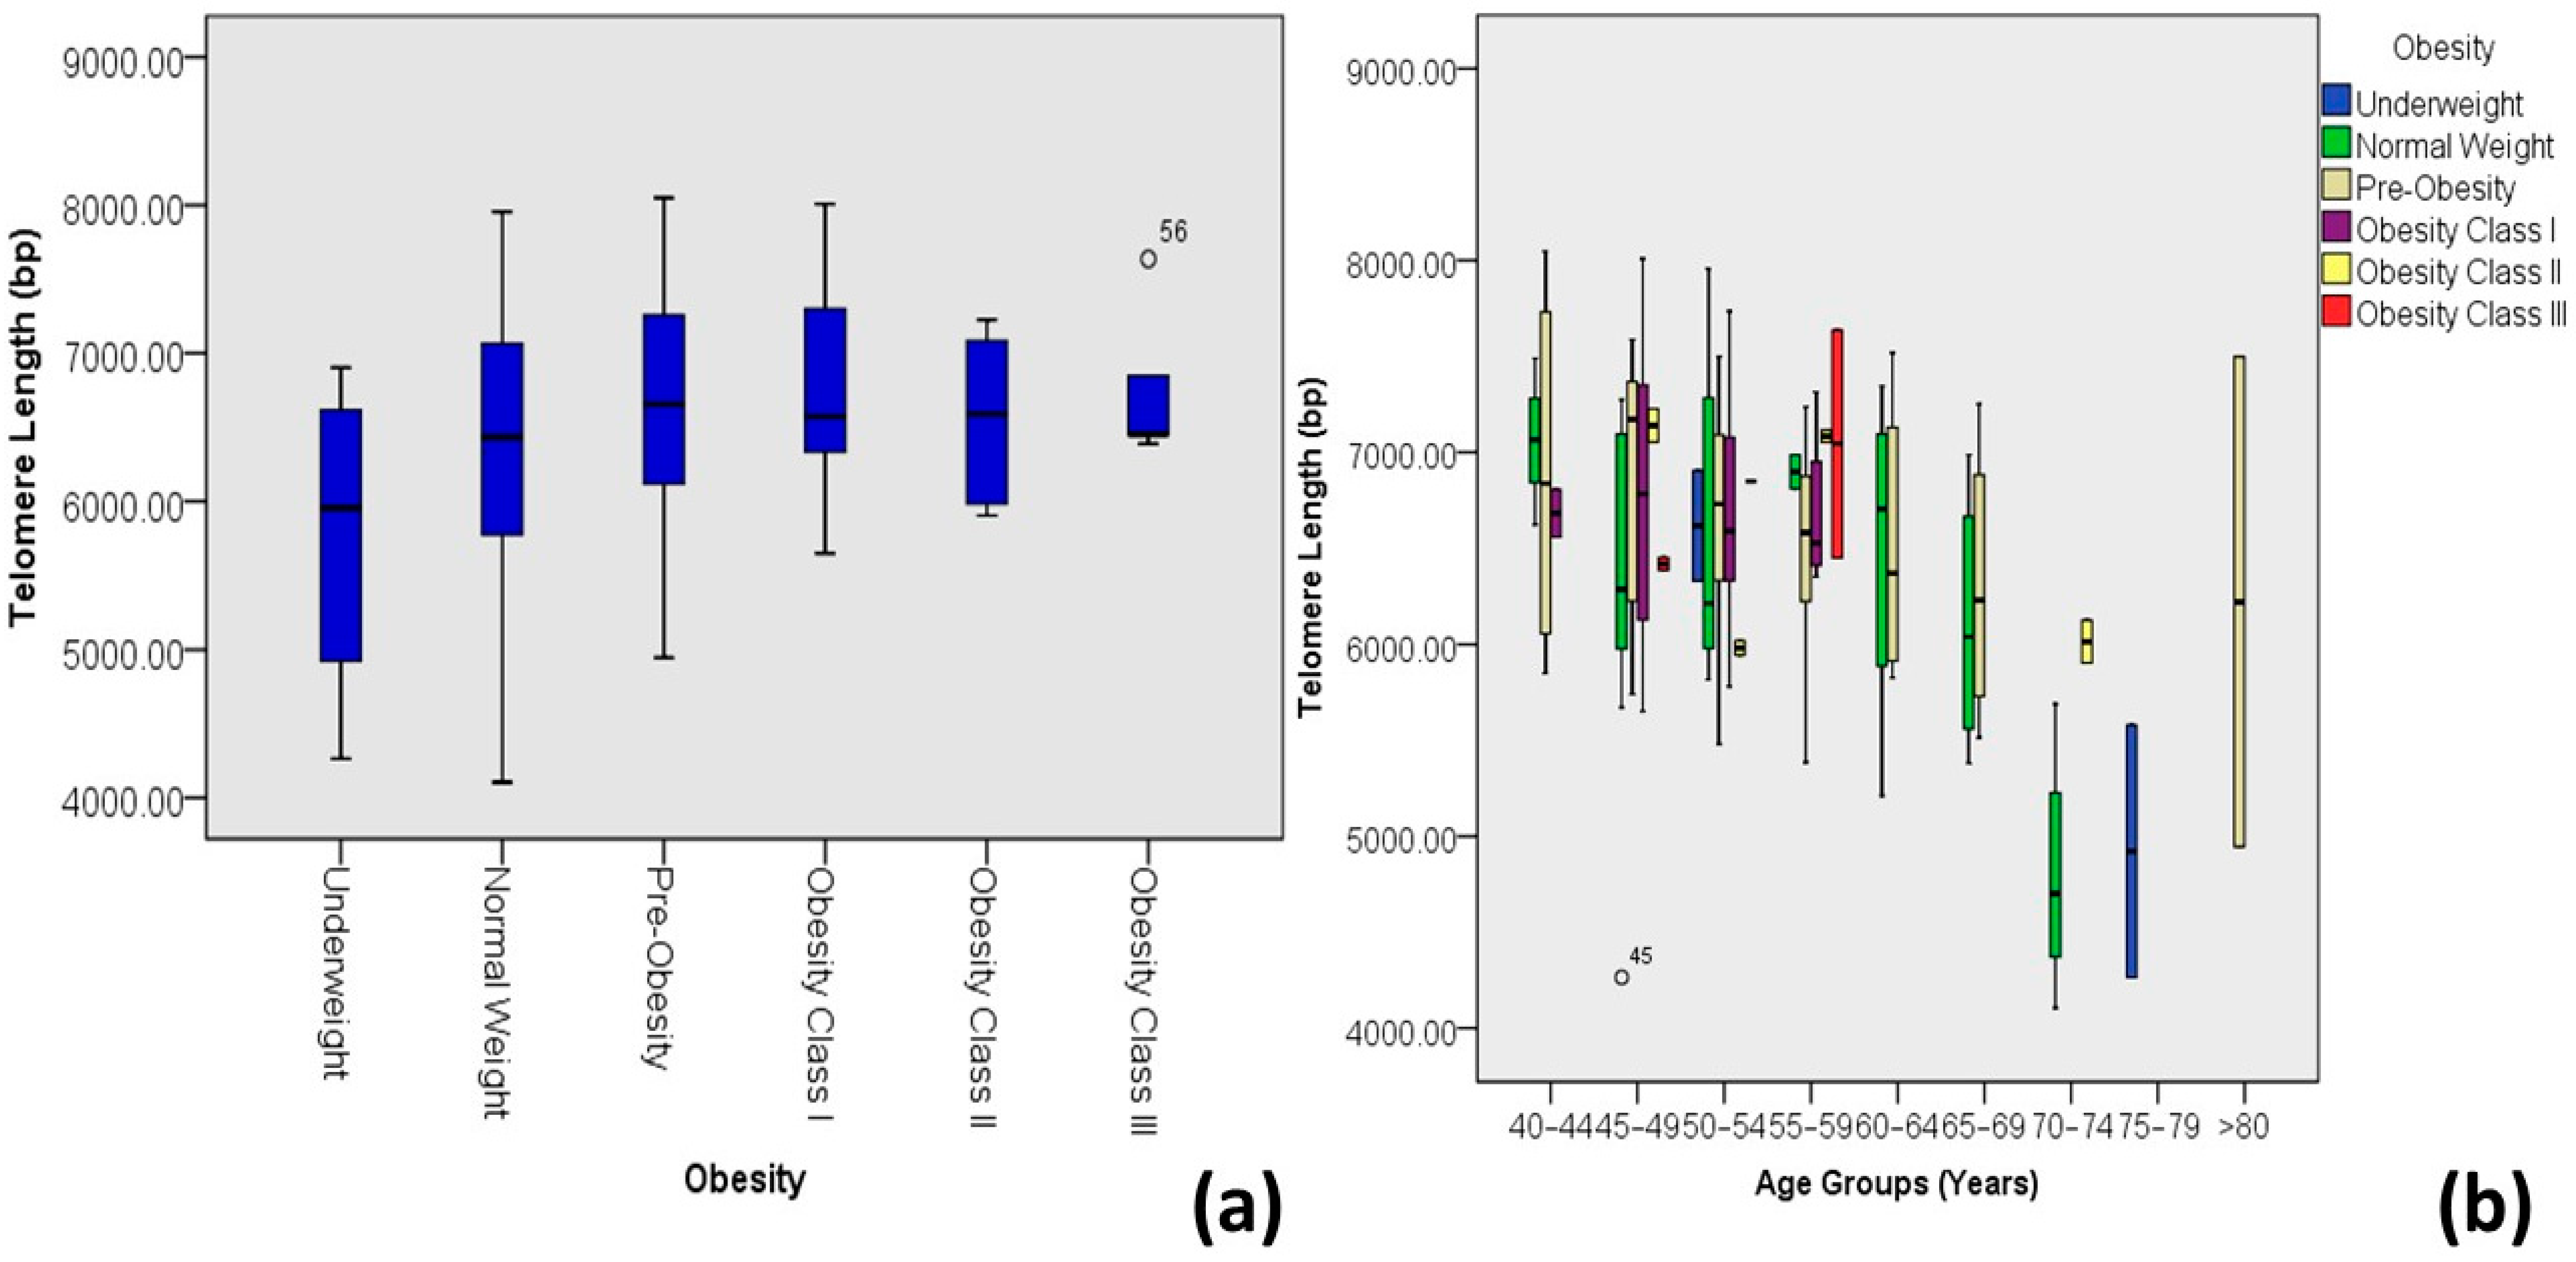
| Obesity *** | Underweight | 5.77 ± 1.14 | 4.26–6.90 | 4 | 3.3 | 0.025 | 0.203 * | 0.041 |
| Normal weight | 6.31 ± 0.93 | 4.11–7.96 | 36 | 29.8 | ||||
| Pre-obesity | 6.63 ± 0.72 | 4.95–8.05 | 48 | 39.7 | ||||
| Obesity class I | 6.72 ± 0.62 | 5.65–8.01 | 20 | 16.5 | ||||
| Obesity class II | 6.55 ± 0.60 | 5.90–7.23 | 8 | 6.6 | ||||
| Obesity class III | 6.76 ± 0.53 | 6.39–7.64 | 5 | 4.1 | ||||
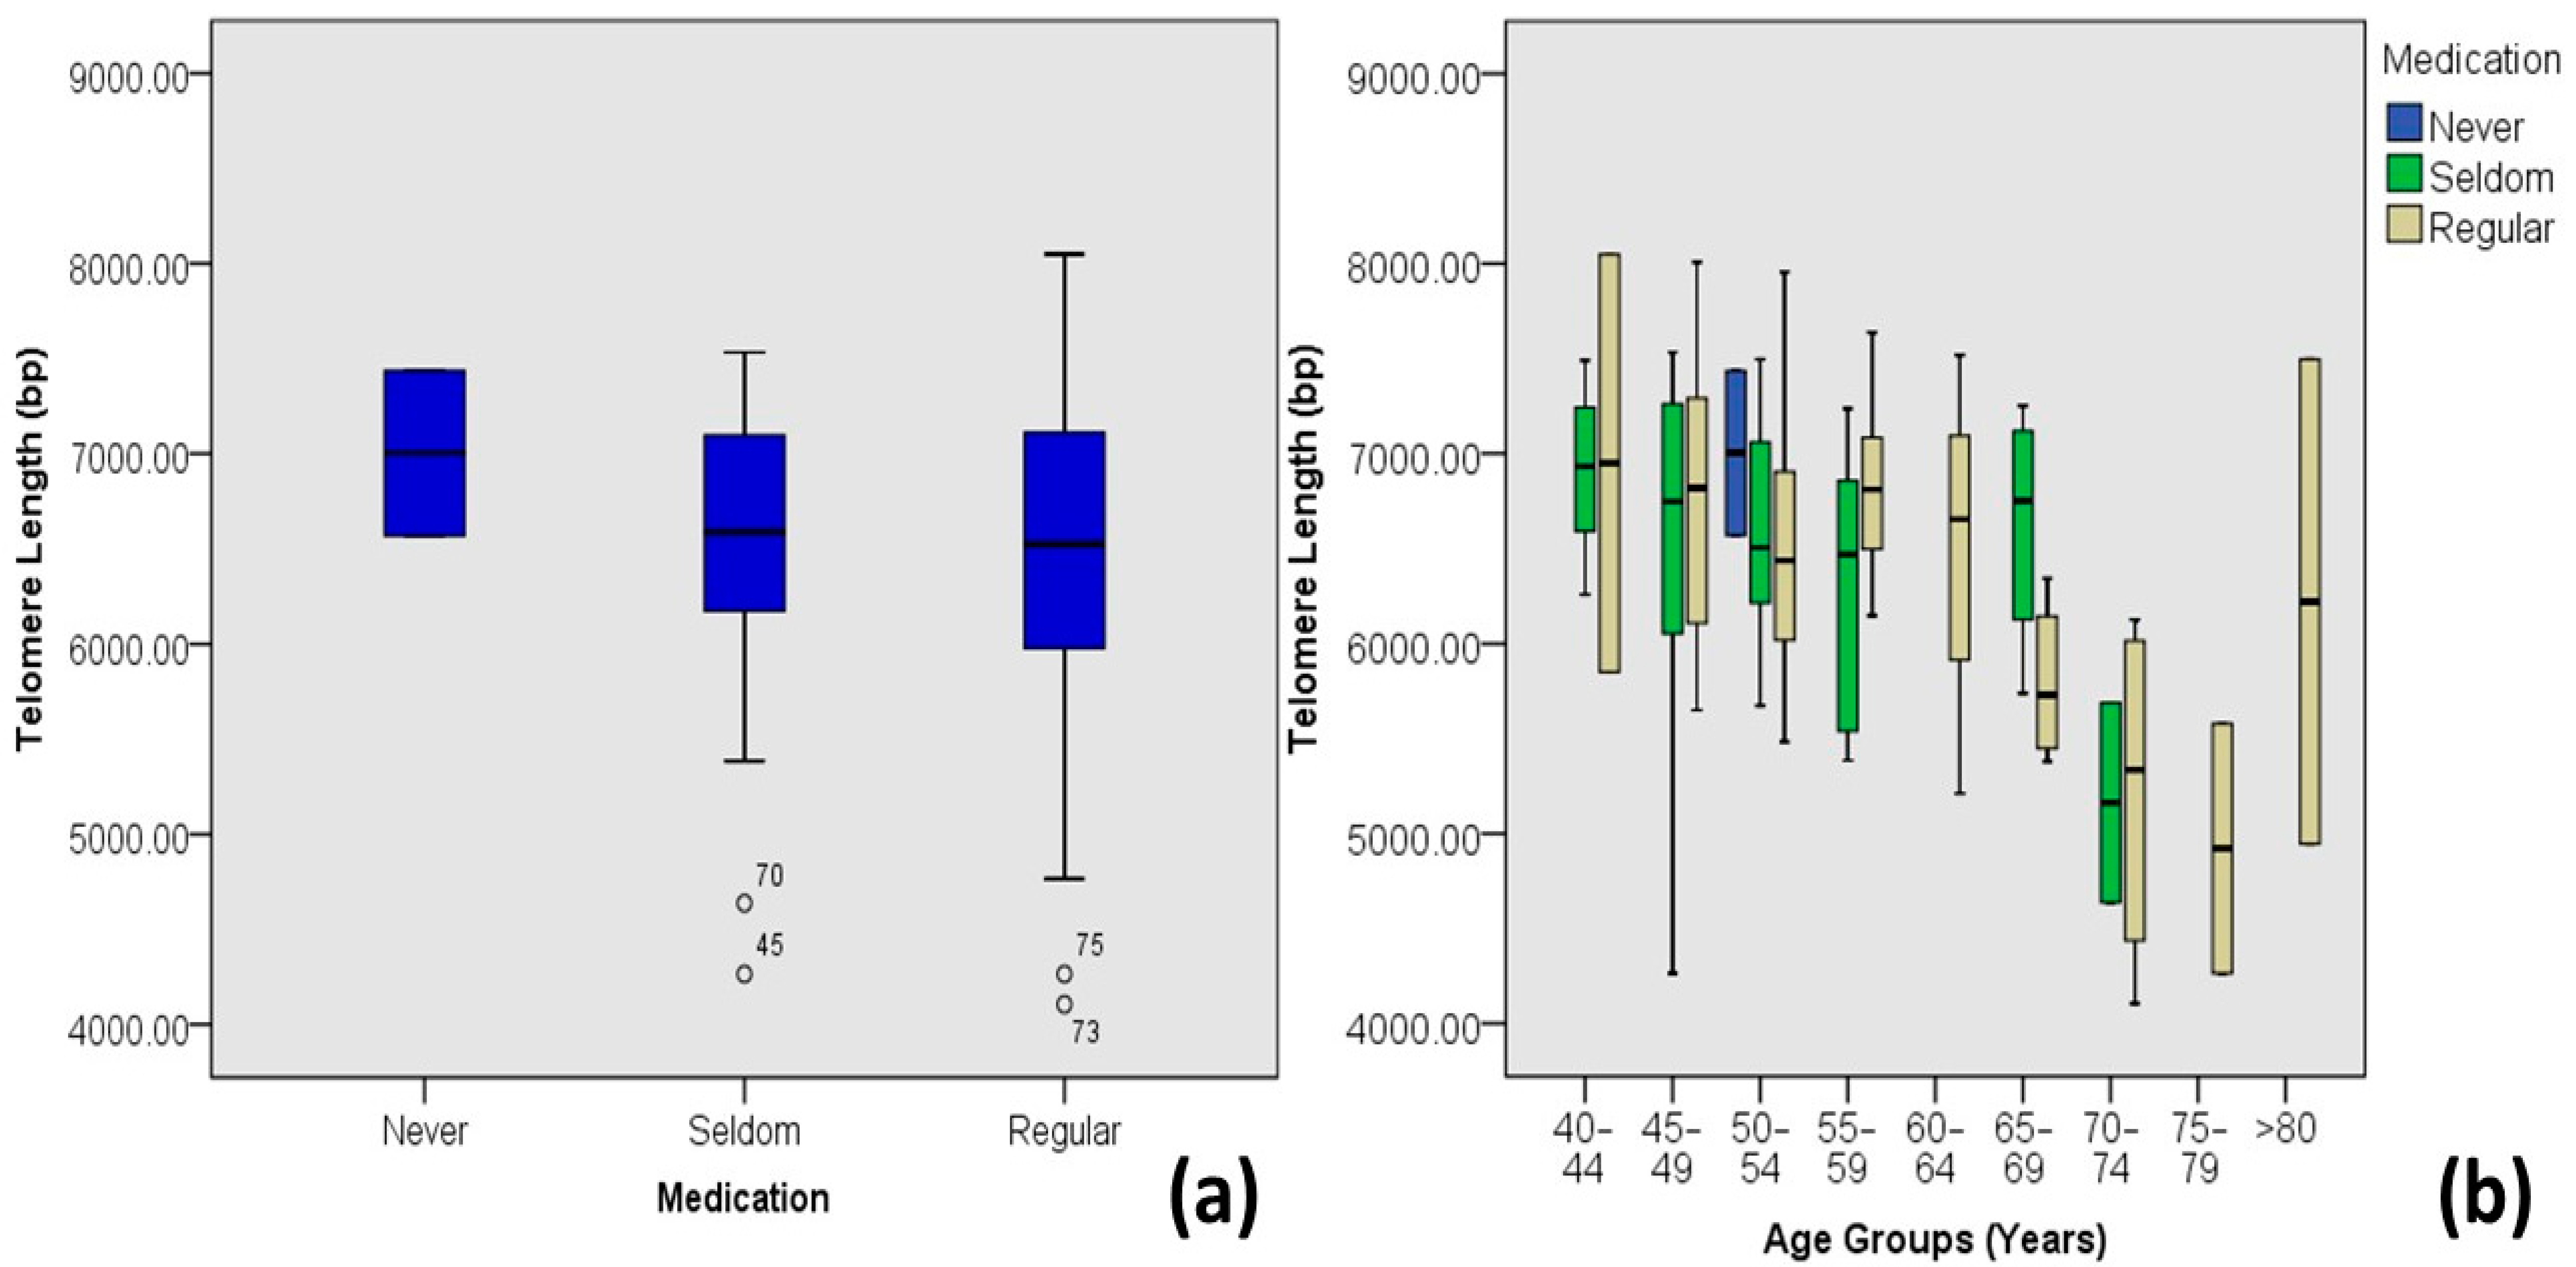
| Medication | Never | 7.00 ± 0.61 | 6.57–7.44 | 2 | 1.7 | 0.576 | −0.051 | 0.003 |
| Seldom | 6.54 ± 0.75 | 4.26–7.53 | 45 | 37.2 | ||||
| Regular | 6.50 ± 0.79 | 4.11–8.05 | 74 | 61.2 | ||||
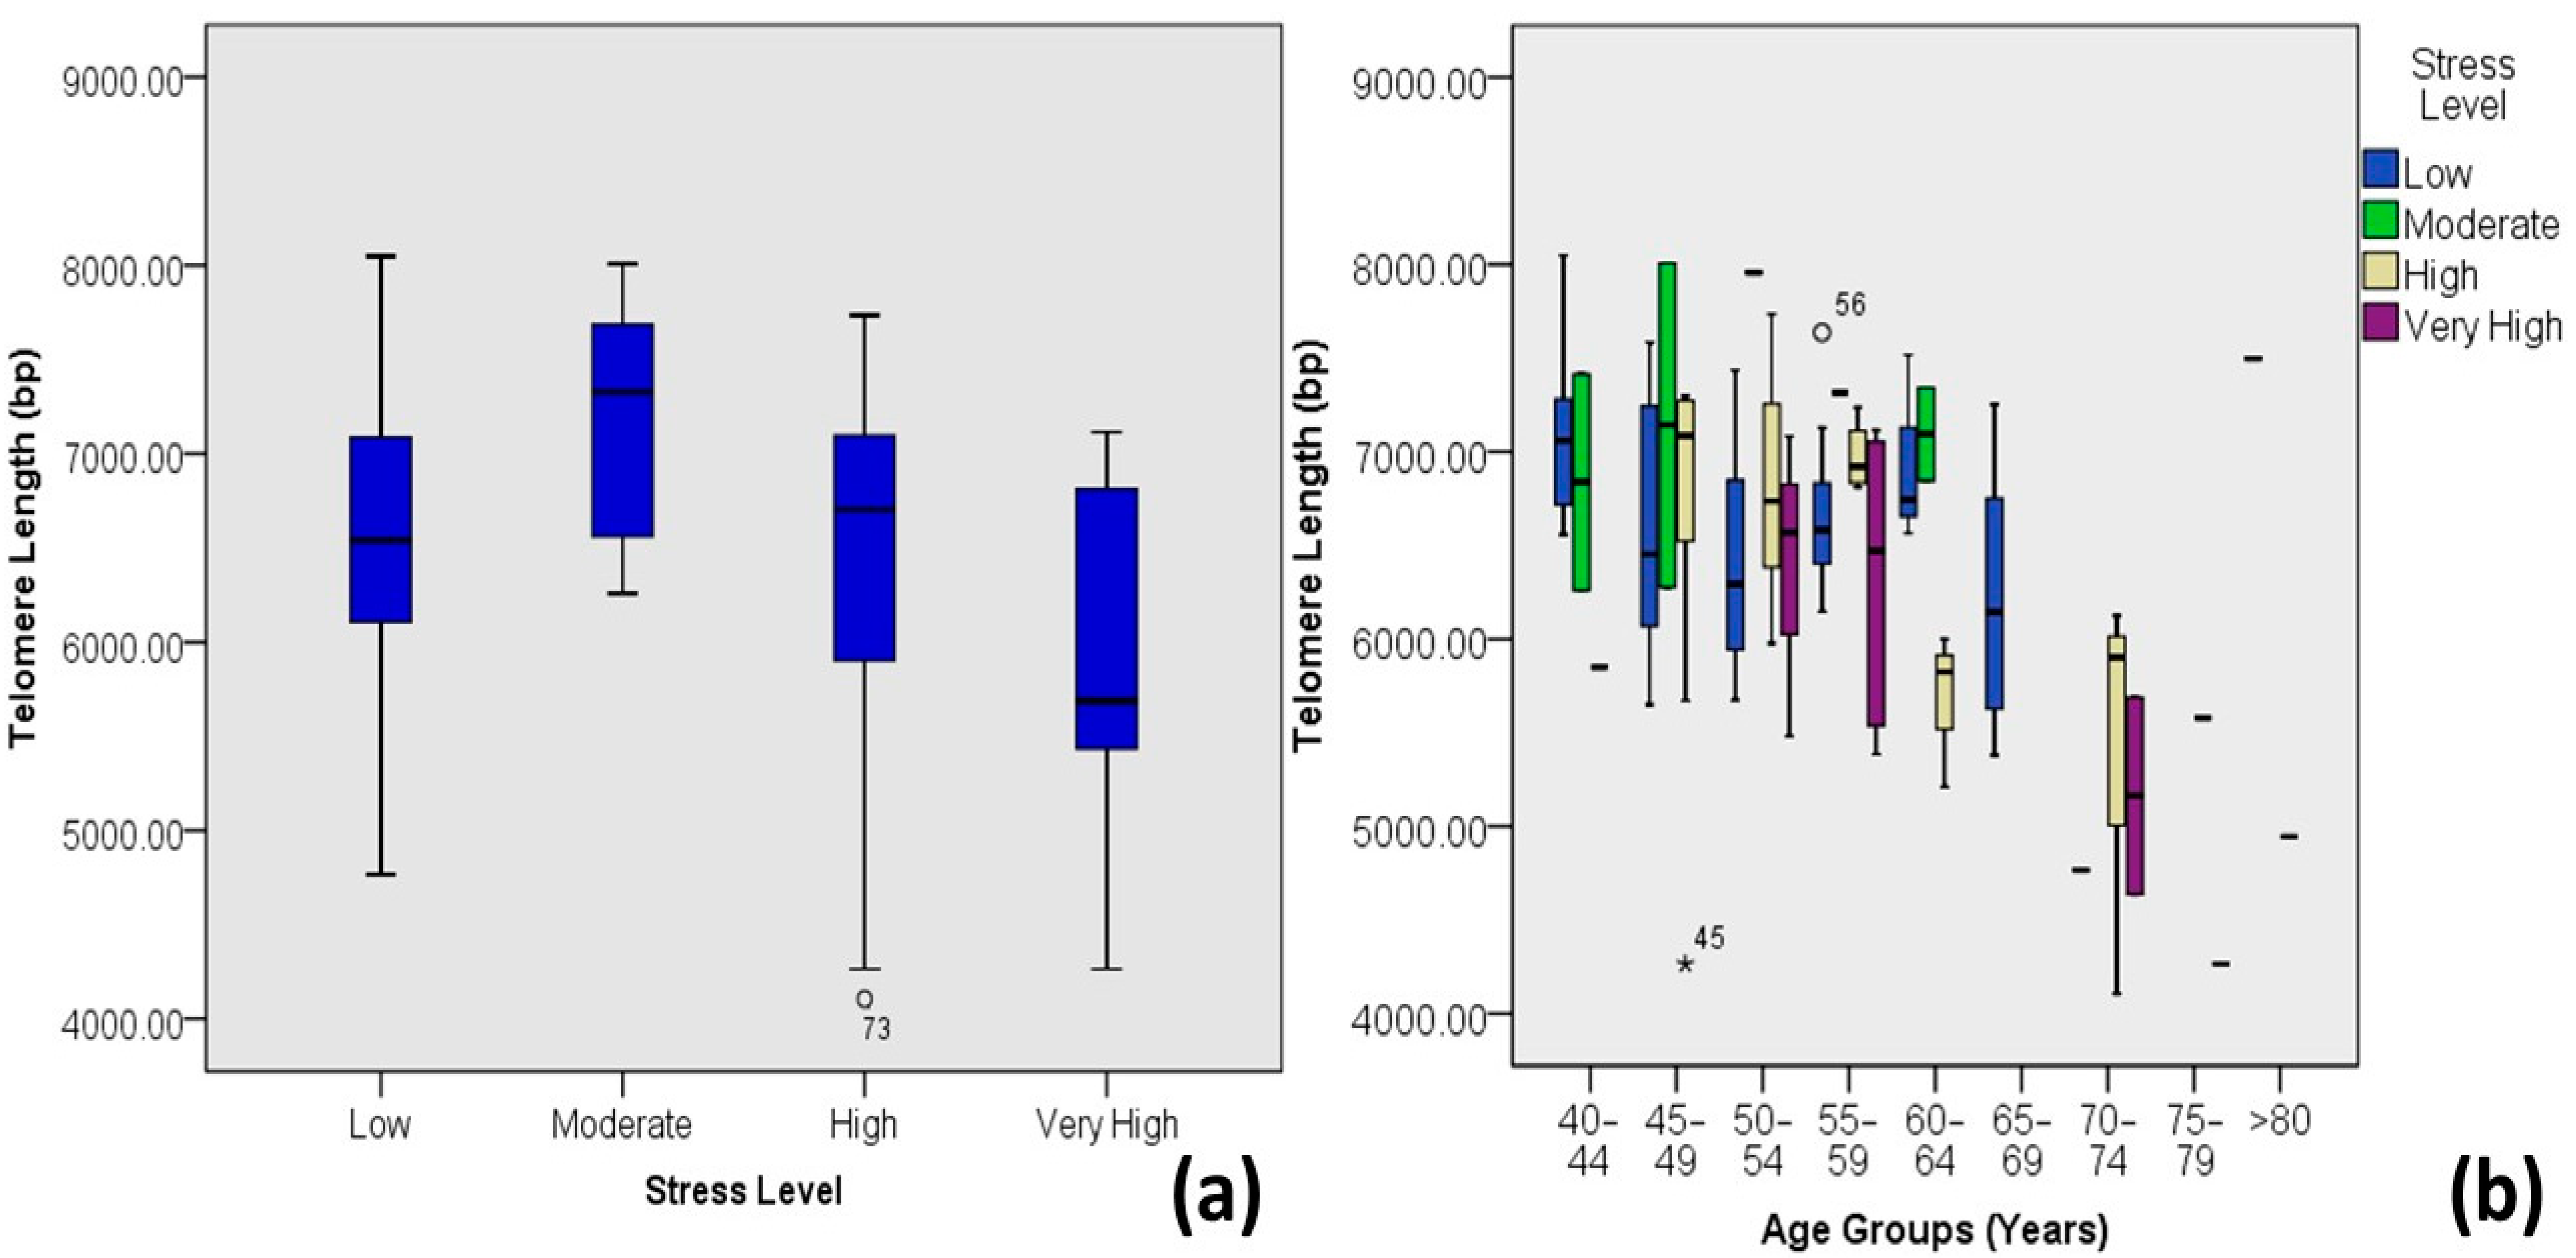
| Stress Level | Low | 6.58 ± 0.65 | 4.77–8.05 | 68 | 56.2 | 0.036 | −0.191 * | 0.037 |
| Moderate | 7.18 ± 0.67 | 6.26–8.01 | 8 | 6.6 | ||||
| High | 6.44 ± 0.89 | 4.11–7.73 | 34 | 28.1 | ||||
| Very High | 5.94 ± 0.99 | 4.26–7.11 | 11 | 9.1 | ||||
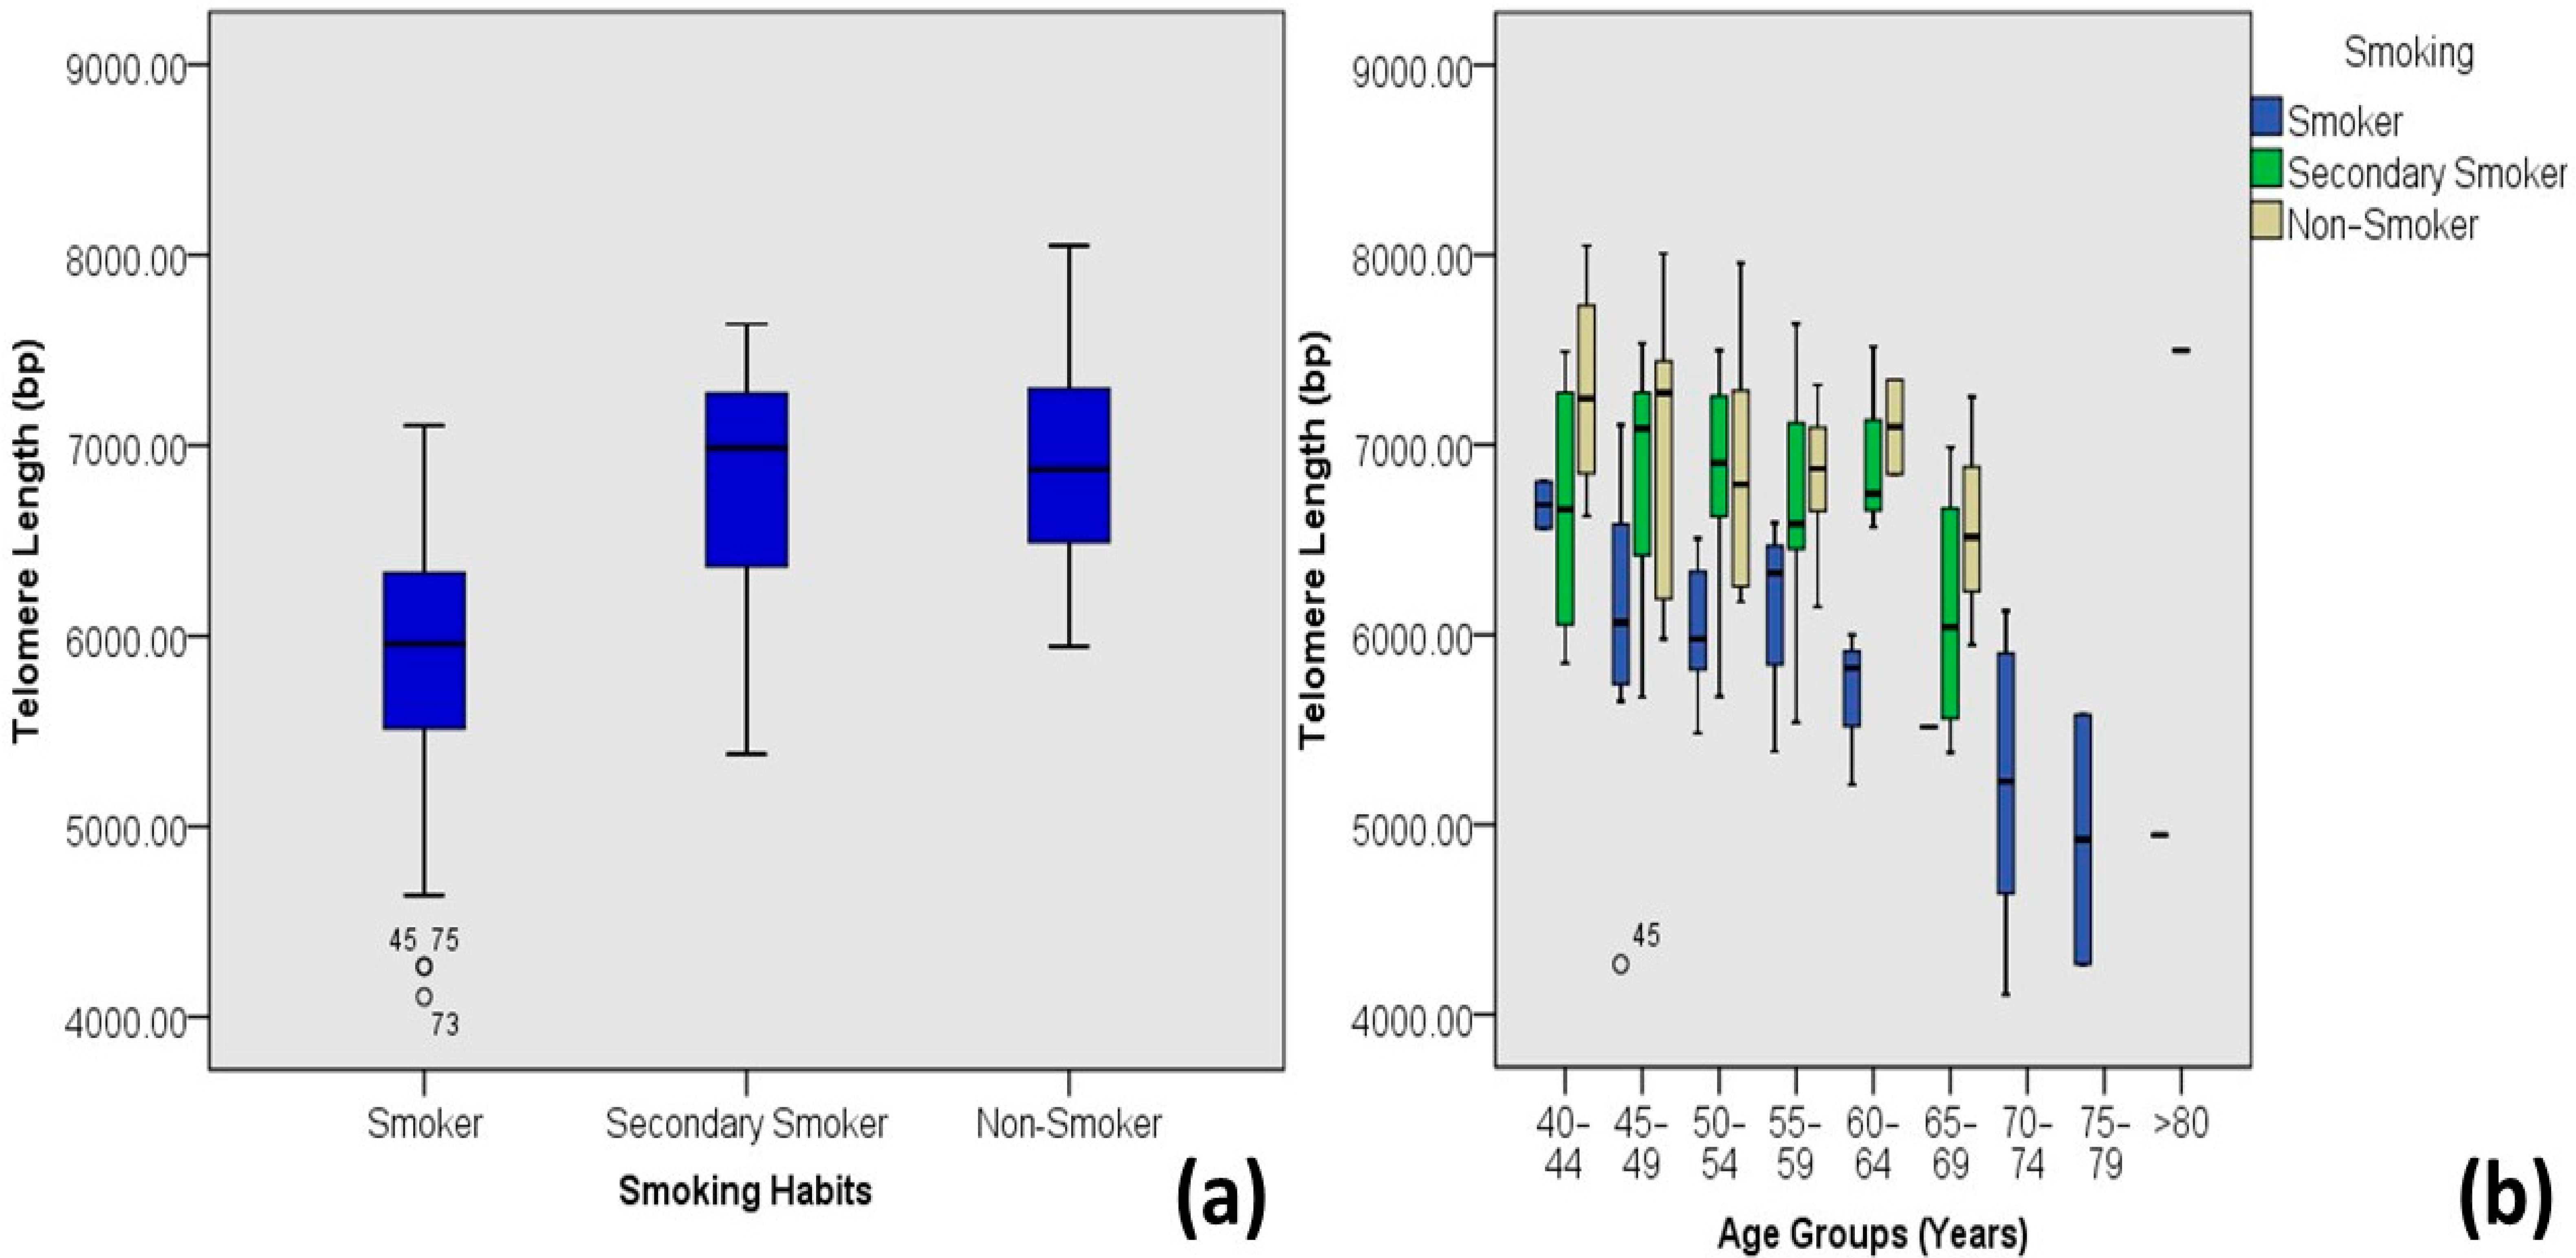
| Smoking Habits | Primary Smokers | 5.83 ± 0.73 | 4.11–7.10 | 38 | 31.4 | 0.000 | 0.547 ** | 0.299 |
| Secondary Smokers | 6.77 ± 0.62 | 5.38–7.64 | 43 | 35.5 | ||||
| Non-Smokers | 6.91 ± 0.57 | 5.95–8.05 | 40 | 33.1 | ||||
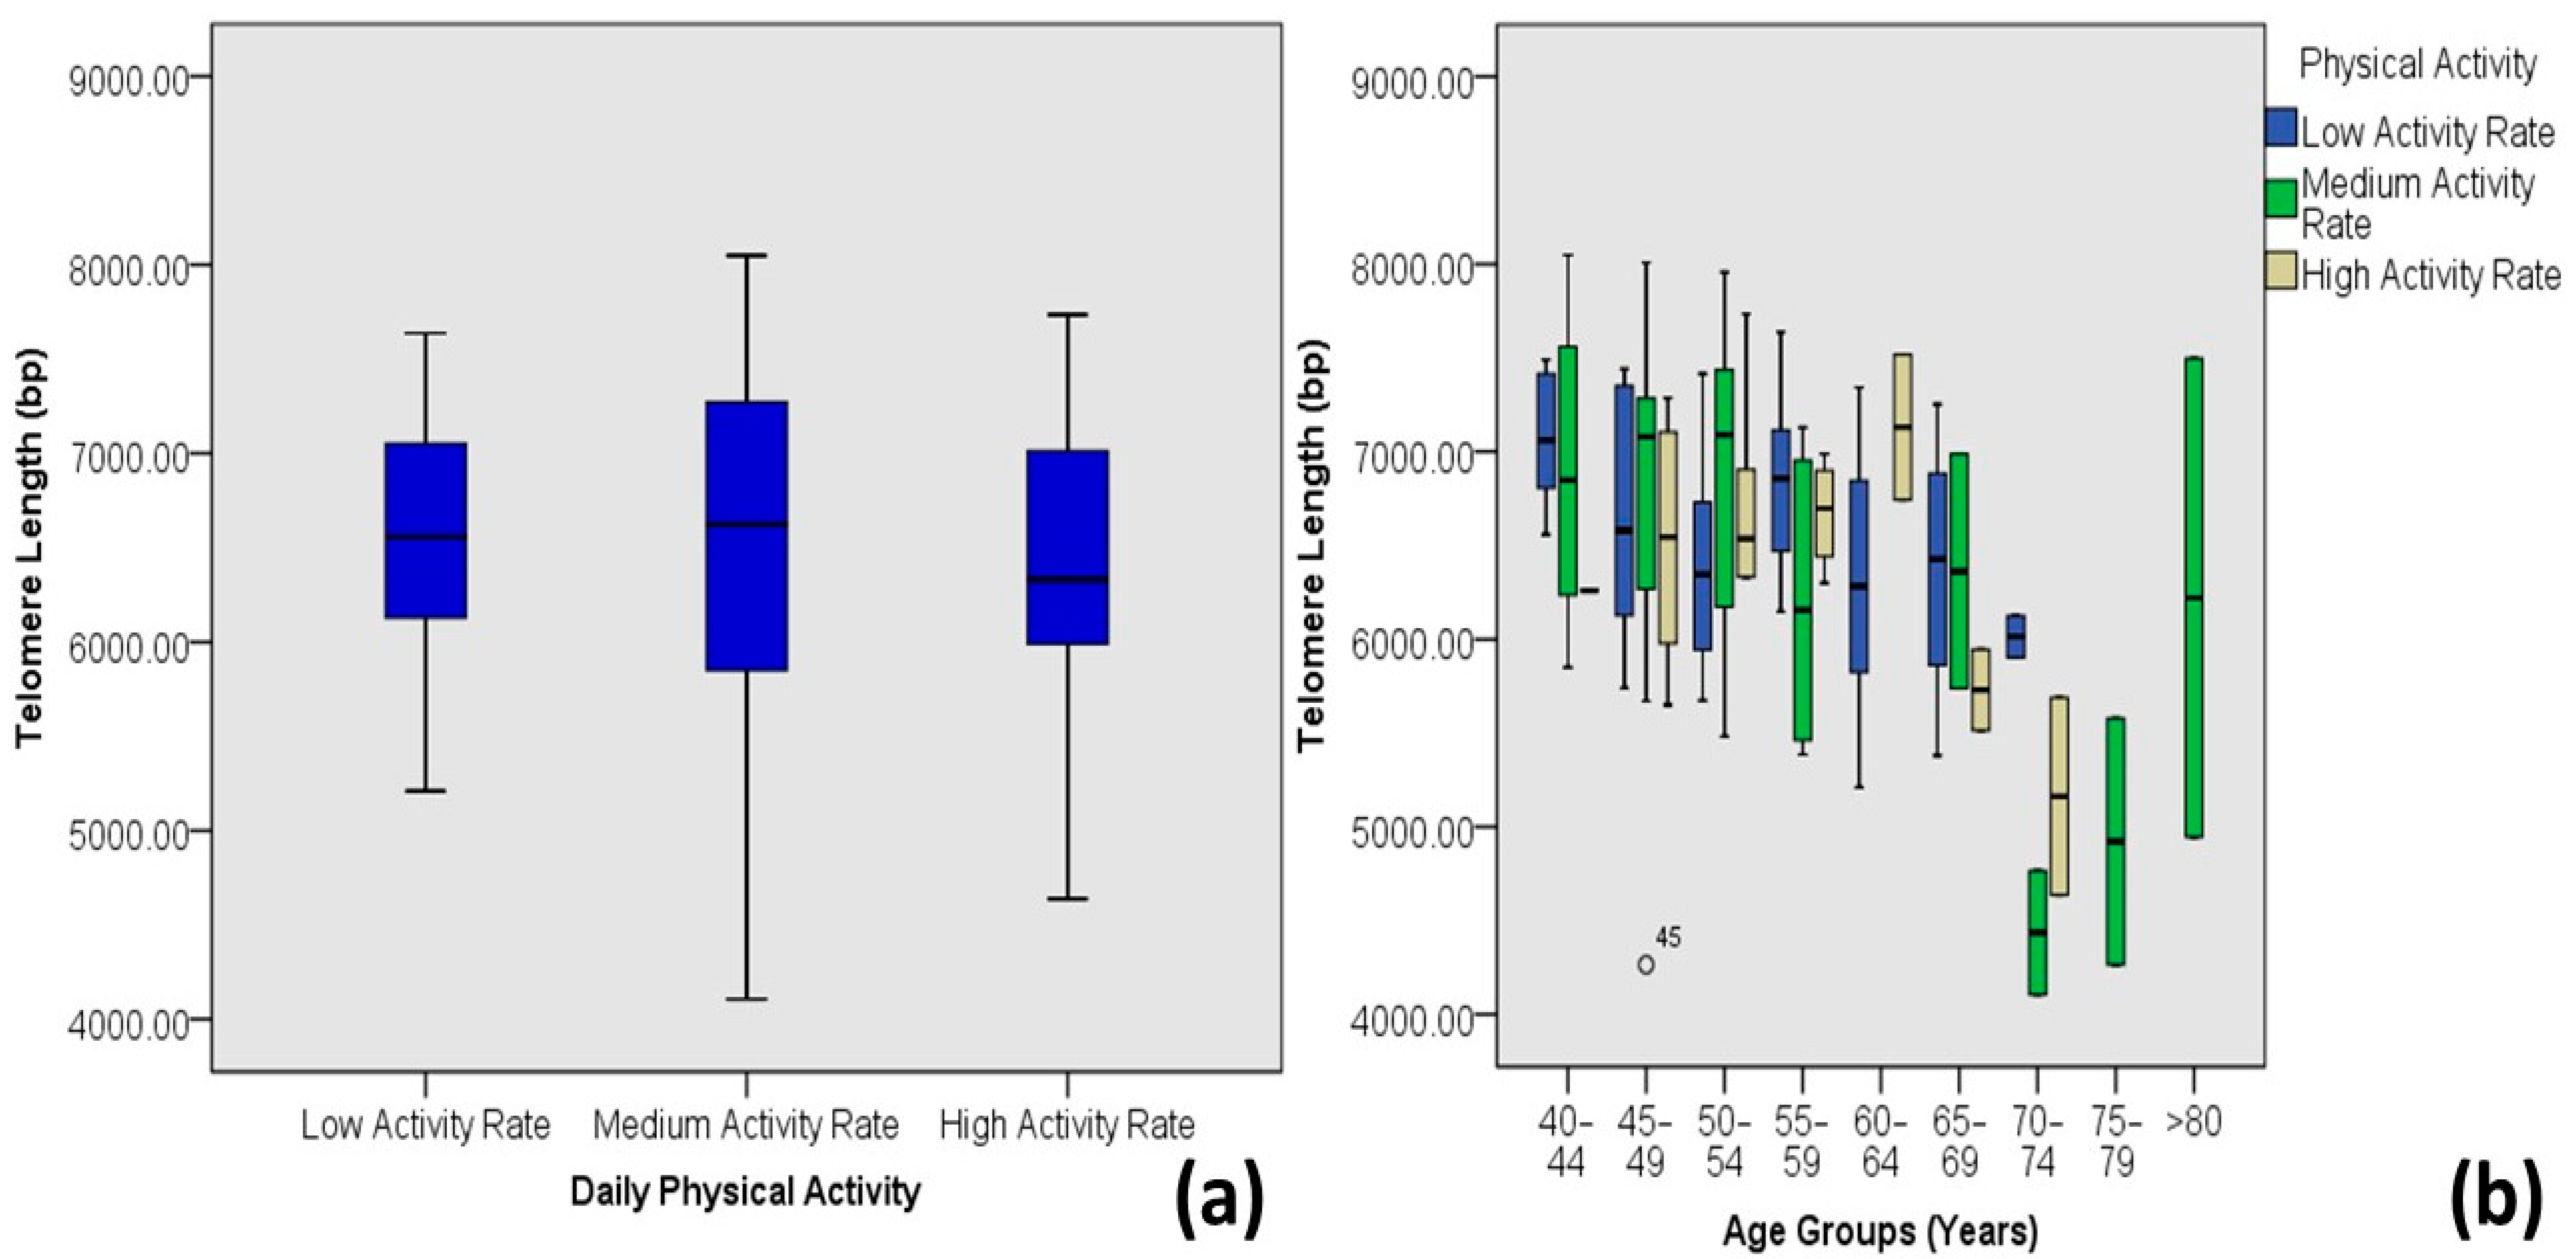
| Physical Activity | Low Activity | 6.47 ± 0.69 | 5.21–7.64 | 49 | 40.5 | 0.587 | −0.050 | 0.002 |
| Medium Activity | 6.59 ± 0.88 | 4.11–8.05 | 45 | 37.2 | ||||
| High Activity | 6.53 ± 0.74 | 4.64–7.73 | 27 | 22.3 | ||||
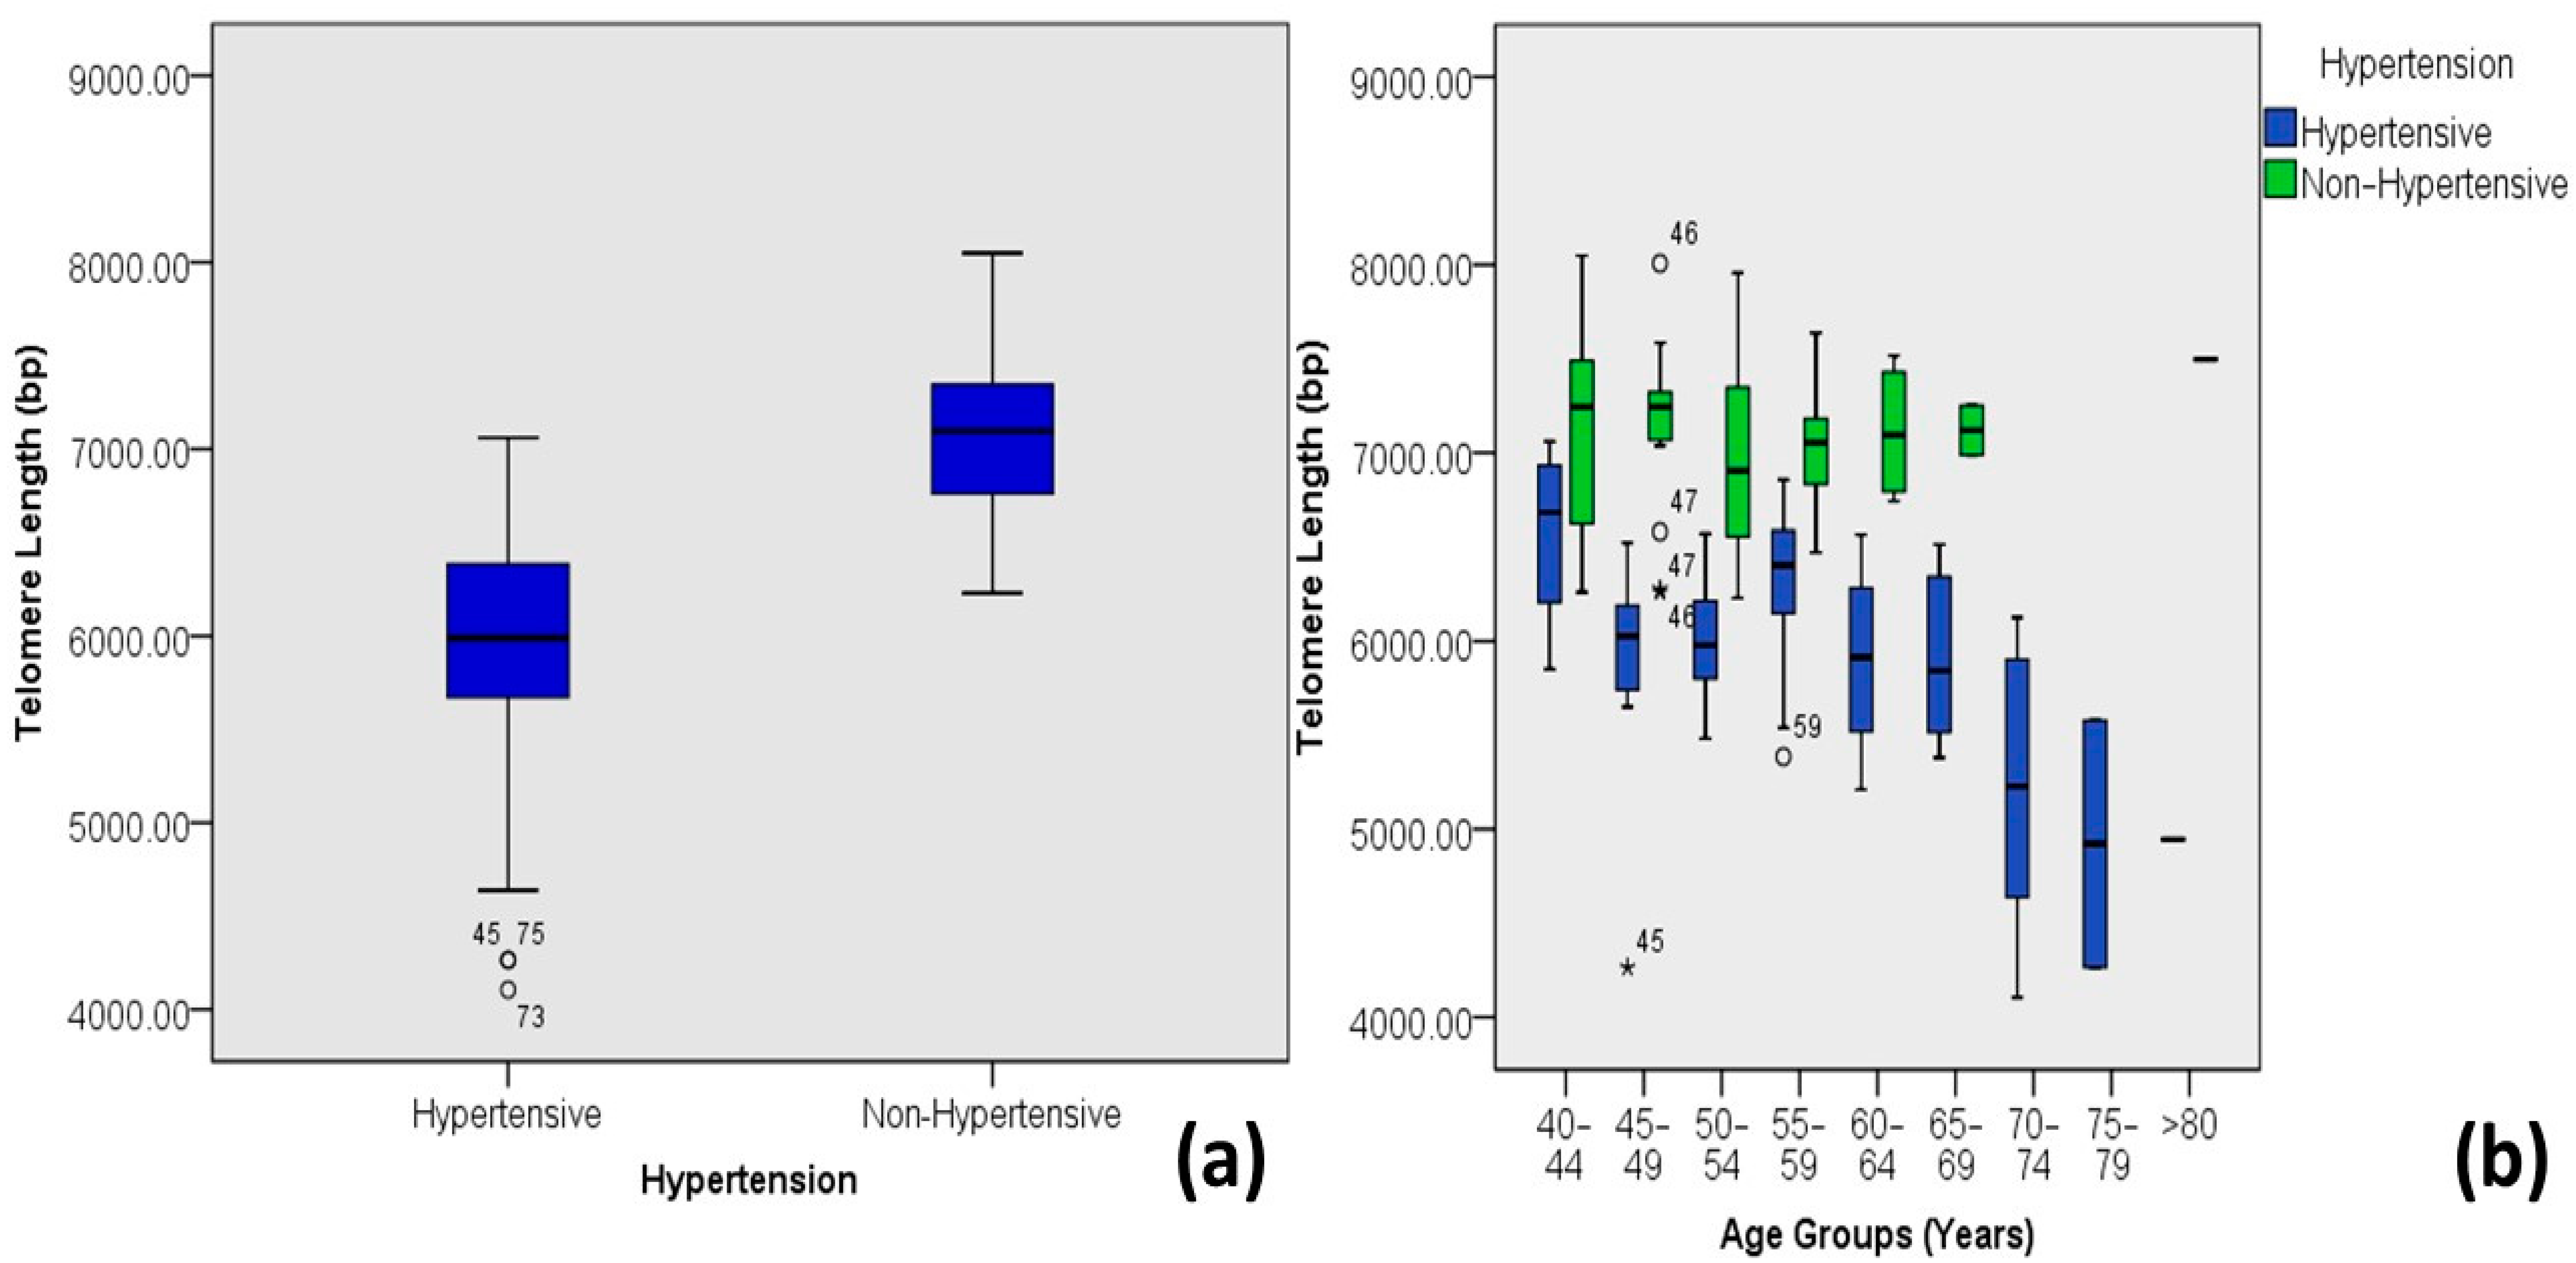
| Hypertension | Hypertensive | 5.93 ± 0.64 | 4.11–7.06 | 58 | 47.9 | 0.000 | 0.725 ** | 0.526 |
| Non-Hypertensive | 7.07 ± 0.44 | 6.23–8.05 | 63 | 52.1 | ||||
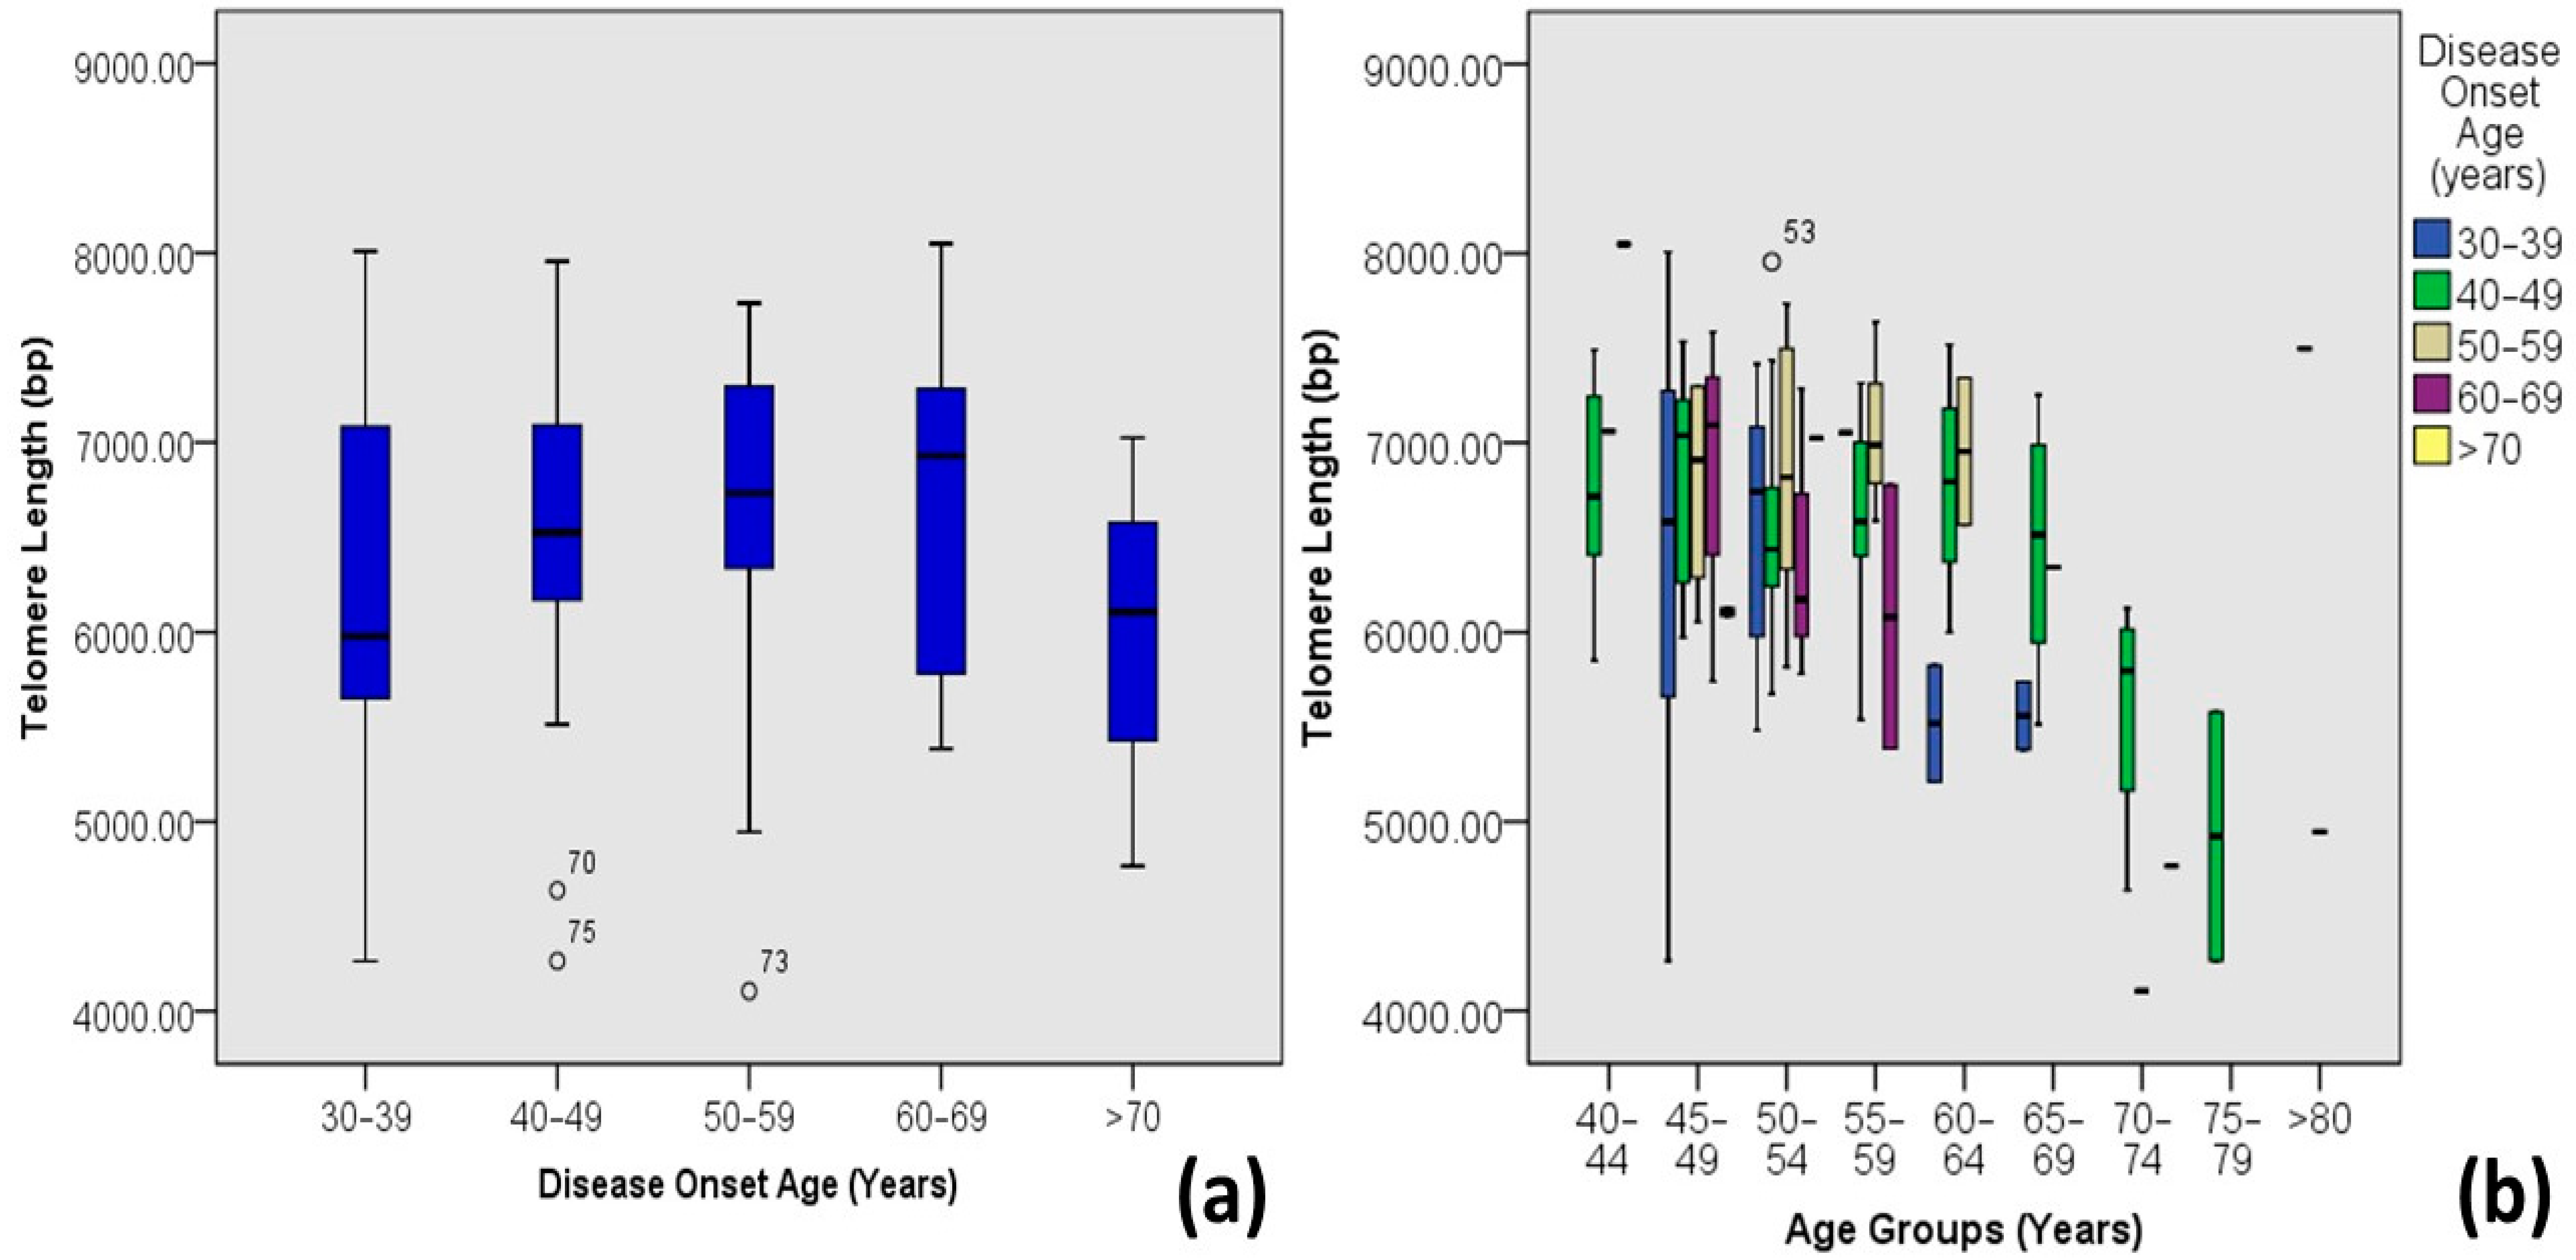
| Disease Onset Age | 30–39 | 6.27 ± 0.99 | 4.26–8.01 | 17 | 14.0 | 0.005 | −0.254 ** | 0.065 |
| 40–49 | 6.56 ± 0.68 | 4.26–7.96 | 71 | 58.7 | ||||
| 50–59 | 6.62 ± 0.92 | 4.11–7.73 | 19 | 15.7 | ||||
| 60–69 | 6.7 ± 0.88 | 5.39–8.05 | 10 | 8.3 | ||||
| >70 | 6.00 ± 0.93 | 4.77–7.02 | 4 | 3.3 | ||||
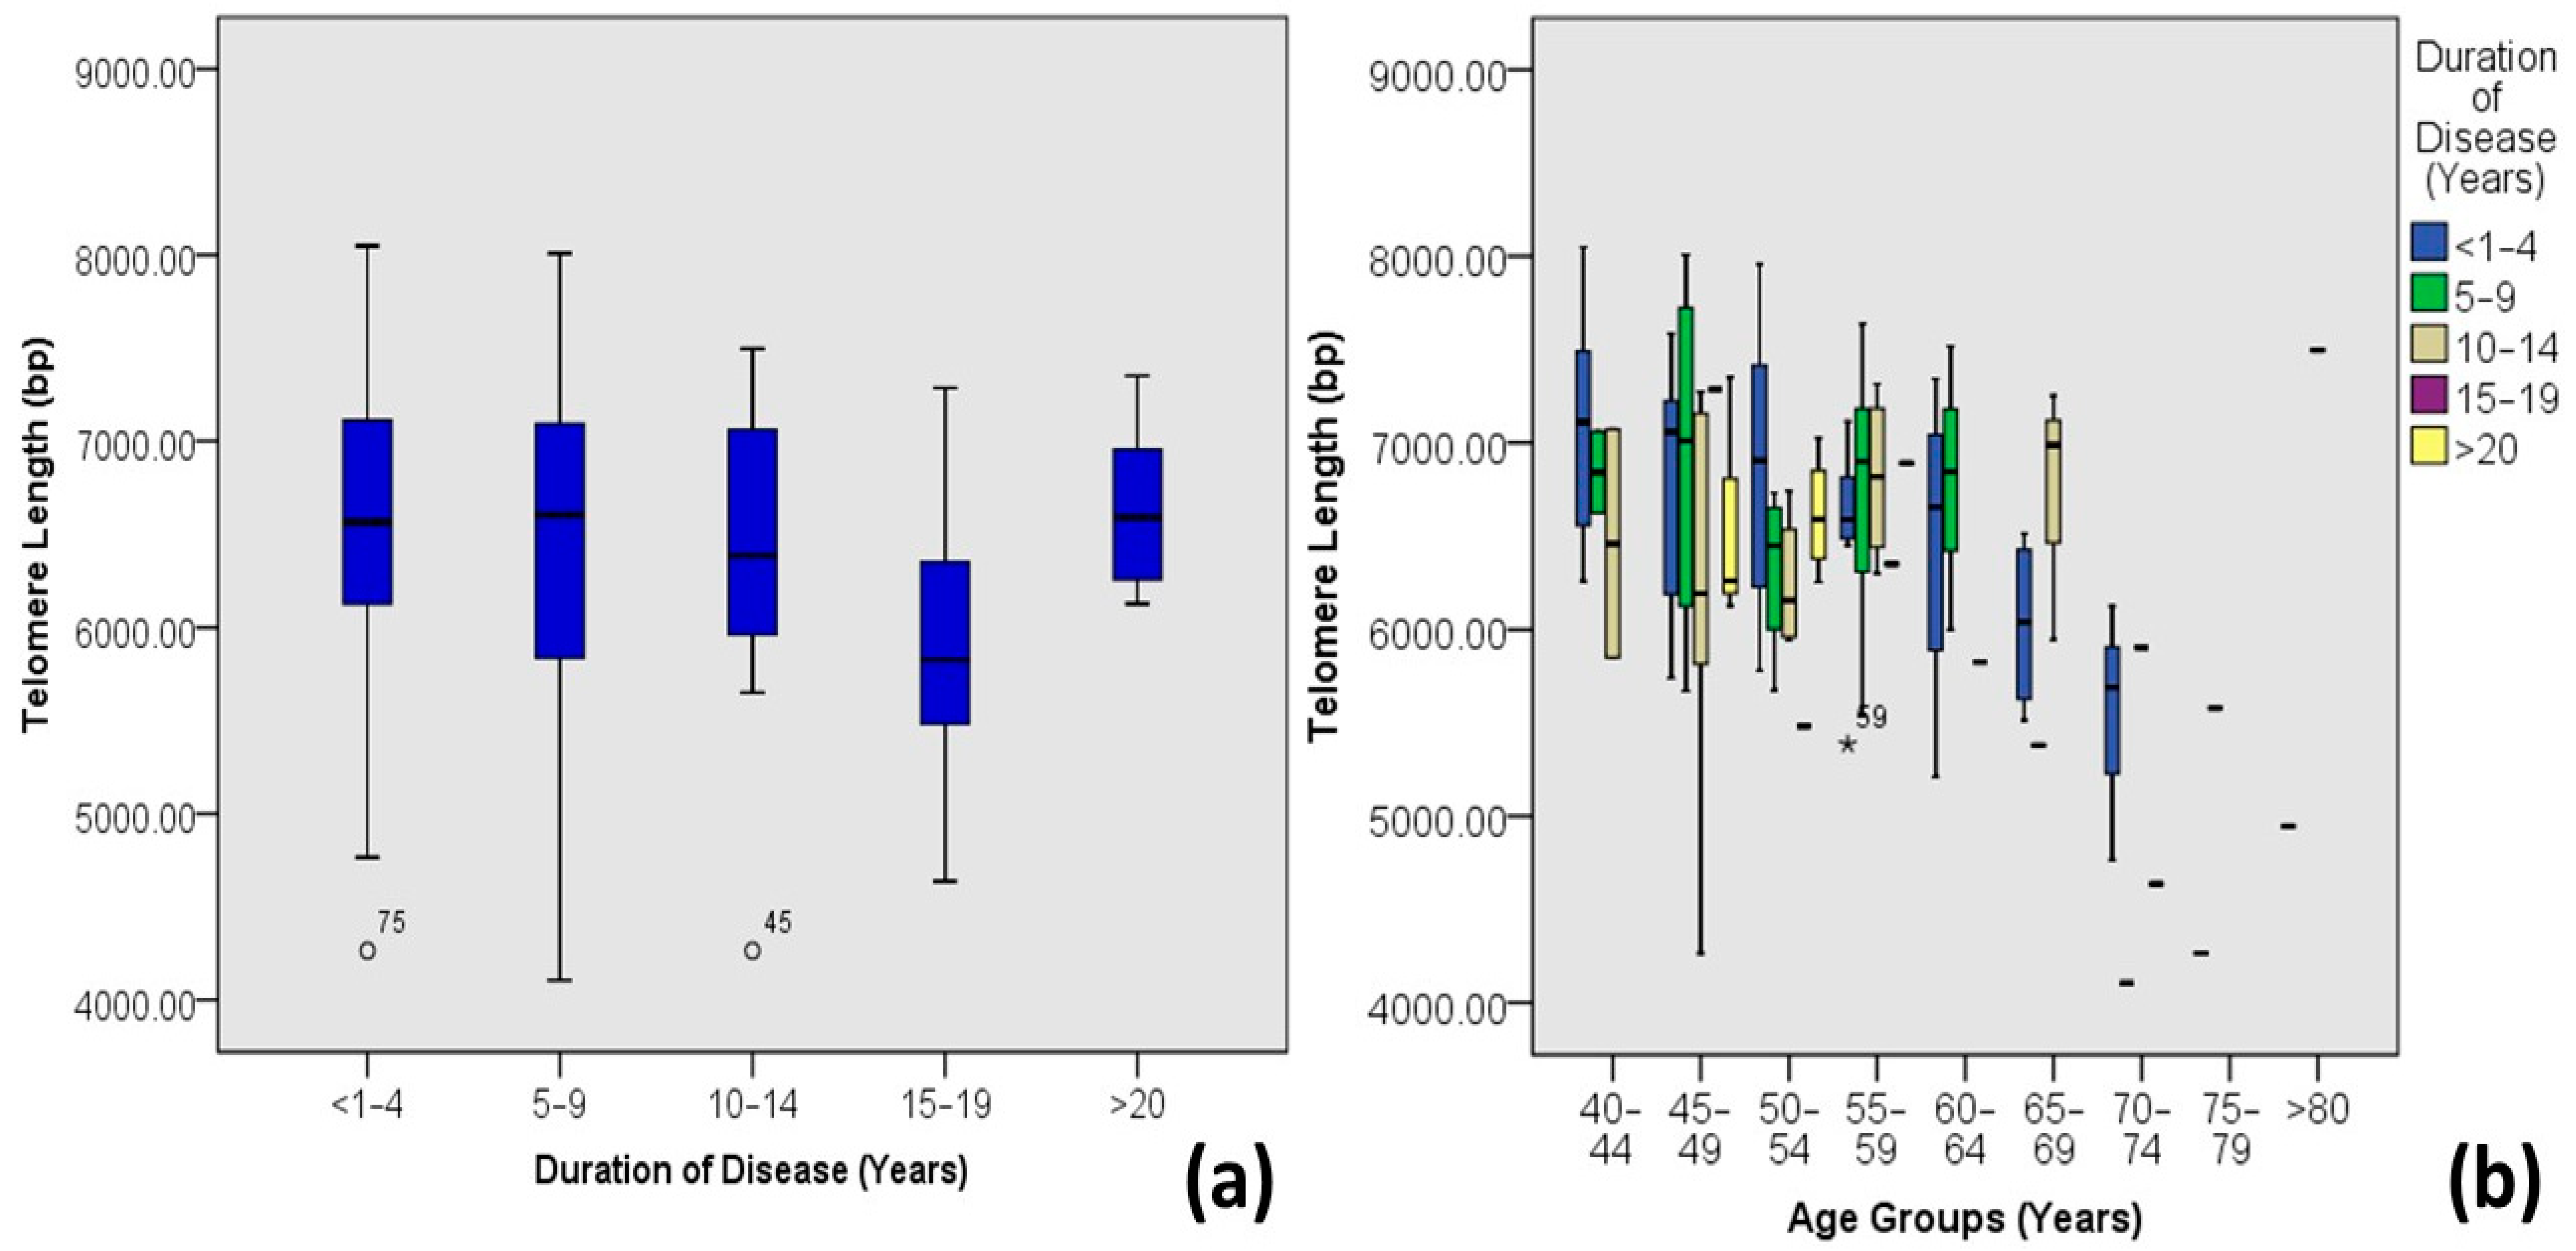
| Duration of Diabetes | <1–4 | 6.59 ± 0.79 | 4.26–8.05 | 61 | 50.4 | 0.416 | −0.075 | 0.006 |
| 5–9 | 6.50 ± 0.88 | 4.11–8.01 | 24 | 19.8 | ||||
| 10–14 | 6.46 ± 0.76 | 4.26–7.5 | 23 | 19.0 | ||||
| 15–19 | 5.92 ± 0.99 | 4.64–7.29 | 5 | 4.1 | ||||
| >20 | 6.64 ± 0.43 | 6.13–7.35 | 8 | 6.6 |
Disclaimer/Publisher’s Note: The statements, opinions and data contained in all publications are solely those of the individual author(s) and contributor(s) and not of MDPI and/or the editor(s). MDPI and/or the editor(s) disclaim responsibility for any injury to people or property resulting from any ideas, methods, instructions or products referred to in the content. |
© 2024 by the authors. Licensee MDPI, Basel, Switzerland. This article is an open access article distributed under the terms and conditions of the Creative Commons Attribution (CC BY) license (https://creativecommons.org/licenses/by/4.0/).
Share and Cite
Tariq, J.A.; Mandokhail, K.; Sajjad, N.; Hussain, A.; Javaid, H.; Rasool, A.; Sadaf, H.; Javaid, S.; Durrani, A.R. Effects of Age and Biological Age-Determining Factors on Telomere Length in Type 2 Diabetes Mellitus Patients. Medicina 2024, 60, 698. https://doi.org/10.3390/medicina60050698
Tariq JA, Mandokhail K, Sajjad N, Hussain A, Javaid H, Rasool A, Sadaf H, Javaid S, Durrani AR. Effects of Age and Biological Age-Determining Factors on Telomere Length in Type 2 Diabetes Mellitus Patients. Medicina. 2024; 60(5):698. https://doi.org/10.3390/medicina60050698
Chicago/Turabian StyleTariq, Jawaria Ali, KaleemUllah Mandokhail, Naheed Sajjad, Abrar Hussain, Humera Javaid, Aamir Rasool, Hummaira Sadaf, Sadia Javaid, and Abdul Rauf Durrani. 2024. "Effects of Age and Biological Age-Determining Factors on Telomere Length in Type 2 Diabetes Mellitus Patients" Medicina 60, no. 5: 698. https://doi.org/10.3390/medicina60050698