Abstract
This paper evaluates the potential of solar concentration technologies—compound parabolic collector (CPC), linear Fresnel collector (LFC) and parabolic trough collector (PTC)—as an alternative to conventional sources of energy for industrial processes in Latin America, where high levels of solar radiation and isolated areas without energy supply exist. The analysis is addressed from energy, economic and environmental perspective. A specific application for Argentina in which fourteen locations are analyzed is considered. Results show that solar concentration technologies can be an economically and environmentally viable alternative. Levelized cost of energy (LCOE) ranges between 2.5 and 16.9 c€/kWh/m2 and greenhouse gas (GHG) emissions avoided range between 33 and 348 kgCO2/(m2·year). CPC technology stands out as the most recommendable technology when the working fluid temperature ranges from 373 K to 423 K. As the working fluid temperature increases the differences between the LCOE values of the CPC and LFC technologies decrease. When 523 K is reached LFC technology is the one which presents the lowest LCOE values for all analyzed sites, while the LCOE values of PTC technology are close to CPC technology values. Results show that solar concentration technologies have reached economic and environmental competitiveness levels under certain scenarios, mainly linked to solar resource available, thermal level requirements and solar technology cost.
1. Introduction
The review of the current situation of the energy sector shows that primary energy consumption is continuously increasing [1]. The analysis of the global energy sources matrix shows that this primary energy demand continues to prefer oil, with a share of 35.7% of the total energy consumption. Natural gas has replaced coal as the second energy resource, meeting 25.6% of the demand, mainly as a result of consumption in the United States and the Middle East. Coal has been relegated to the third energy source, representing 19.3% of the consumption [2]. From these data it is extracted that fossil fuels still account for more than 80% of the global energy matrix.
In the case of Latin America, with about 9% of the world population, the energy consumption represents about 6% of the total energy consumption. In this region about 45% of the energy demand is supplied with oil, 25% with natural gas and the rest by renewable energy, mainly hydro and biomass. In the case of Latin America approximately one third of the total energy consumption is for the transport sector, another third for the industrial sector and the remaining third for domestic and other uses [3].
Fossil energy exists in Latin America, but renewable energy resources are also available. Water and biomass are the only ones that present a significant use. The uses of others such as solar or wind are negligible despite having a high solar resource in virtually all countries [4,5]. One aspect to consider is the fact that in some Latin American countries, such as Ecuador or Peru, natural gas is subsidized. This has a negative impact on the development and use of renewable energies.
Average daily global horizontal radiation values of Latin America range from 3.5 kWh/m2 to 7 kWh/m2 per day although most of the surface shows values between 4 kWh/m2 and 6 kWh/m2. The Andean area is the one that presents higher values, as Figure 1 shows [6]. In the case of direct normal radiation there are regions in which the annual values are higher, for example some parts of Chile and Mexico (Figure 2) [6]. As both figures show, the countries of Latin America generally receive high levels of radiation that could be exploited.
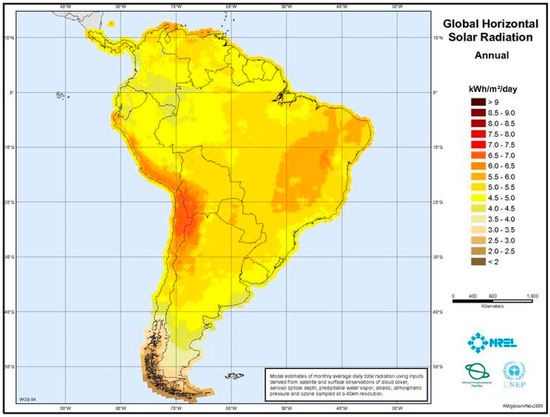
Figure 1.
Map of global horizontal radiation of Latin America.
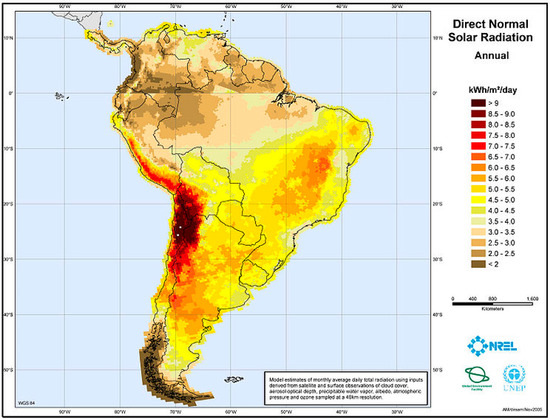
Figure 2.
Map of direct normal radiation of Latin America.
High levels of solar radiation have potential for harnessing solar energy. The role that solar energy could acquire as a thermal energy source for industrial processes in which high levels of thermal energy are required is especially interesting. There are many isolated places in Latin America in which the access to conventional sources of energy as electricity or natural gas is unfeasible and that will be favored by the implementation of this type of solar systems. The lack of energy supply in these areas has led to the development of the economy below its potential. For example, the development and commercialization of products based on raw materials has not been possible. The availability of this source of energy would provide isolated areas with the opportunity of developing this business, which would undoubtedly be associated with the economic development of the region, with an impact on the livelihoods of people.
Most of the energy needs of industrial processes are below 523 K, a temperature level which could be readily be supplied by solar thermal energy (STE) [7]. Table 1 summarizes the temperature range of potential industrial processes. In the particular case of isolated areas of Latin America there are two of these applications that are especially interesting, namely the refrigeration and drying of agricultural products.

Table 1.
Temperature range of potential industrial processes.
The field of application of solar technologies is large, as it allows heat transfer fluid delivery temperatures higher than 1200 K, between 318 K and 673 K in case of linear focus solar concentration technologies. The selection of one or another technology depends on thermal requirements mainly associated with each industrial process.
Recently several studies that focus on analyzing the possibilities of coupling a solar installation to an industrial process have been developed. These studies identify needed improvements in the collectors used in solar installations responsible for generating process heat, analyze the current market and compile a series of recommendations based on knowledge acquired through experimental facilities. Barriers that still hinder the development of solar installations such as high investment cost, lack of public funding and low costs of conventional energy are identified [8,9,10,11,12]. The first solar installations coupled to an industrial process were based on conventional solar technologies, used for obtaining electricity, but currently industrial processes applications have developed specific designs. As new developments become available, more solar heat for industrial processes applications will become viable [13,14].
The broad range of possibilities offered by solar energy has raised the interest of different countries such as Australia, Germany, Mexico or Tunisia. In the Australian case the research, development and demonstration program in solar industrial process heating was led principally by the Commonwealth Science and Industrial Research Organisation, CSIRO [15]. A study developed in Australia tried to identify potential sites for utilization of STE. The review identified 2498 individual sites by location, industry type, energy use and characteristic process temperature. This data is presented on maps in terms of both industry type, and characteristic process temperature, in discrete ranges for comparison with the approximate irradiation patterns and to identify sites that should be considered for more detailed analysis. Relatively few industrial sites were present in areas of high irradiation. In areas with moderate irradiation, outside major cities, there are numerous sites in the food processing, building products, textiles and wood products industries that could utilize low to moderate temperature solar heat [16]. German studies also have attempted to select the sectors with the greatest potential among them chemicals, paper or rubber industries. These sectors are analyzed to identify suitable processes for the integration of solar heat. The results of these studies facilitate the prioritized application of STE in industrial sectors and processes [17]. Meanwhile Tunisia has analyzed the feasibility of integrating thermal collectors as a source of energy supply of industrial processes. Results show that in 2012 solar thermal systems were not economically interesting for end users with current subsidy schemes, but they could lead to significant economic benefits for the government [18]. Finally, Mexico has also analyzed the potential of solar energy as a source of energy supply for the textile and food sectors [19]. As shown solar heat for industrial processes has been identified repeatedly as an important market for solar thermal applications as the industrial heat demand, proof of that are the numerous emergent applications [20]. Several reports have thoroughly analyzed the contributions of solar energy in meeting the energy requirements of several kind of industries, from the oil industry to the paper, textile or pharmaceutical industry [21,22,23,24,25,26,27].
Latin America already has some examples of solar systems that provide totally or partially the thermal energy required by some industrial process. One example is the Kraft Food project in Brazil, in this case corresponding to the food industry. This project consists of a thermal energy system that delivers heat to cook, clean, dry and pasteurize foods. The solar field uses parabolic trough collector (PTC) technology to heat pressurized water at a temperature of 383 K. Especially striking is the couple formed by solar systems and mining companies in Chile. One of the most prominent examples is El Tesoro, a subsidiary of Antofagasta Minerals that disposes of 1280 PTC PT-1 modules to provide process heat for copper mining production. Levels of solar radiation in the Atacama Desert, where El Tesoro is located, are very high [28,29]. There is a wide range of possibilities for coupling a solar system to an industrial process [30]. The selection of one or other is done according to the industrial process requirements in each case. Figure 3 and Figure 4 show some of them. The first diagram shows an installation in which residual use of thermal energy exists. The industrial process presented in this figure requires two levels of thermal energy. Figure 4 shows another configuration in which an auxiliary boiler and a heat recovery system are included.
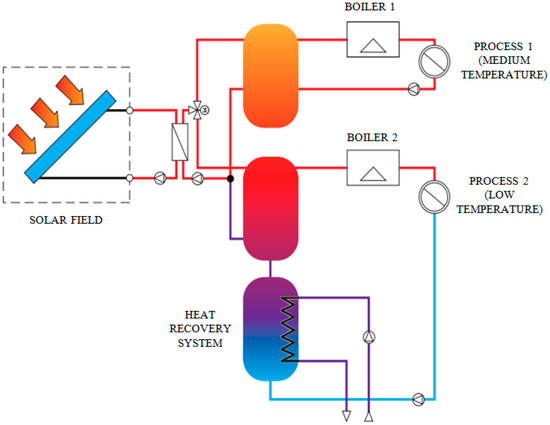
Figure 3.
Process heat scheme including use and two levels of thermal energy.
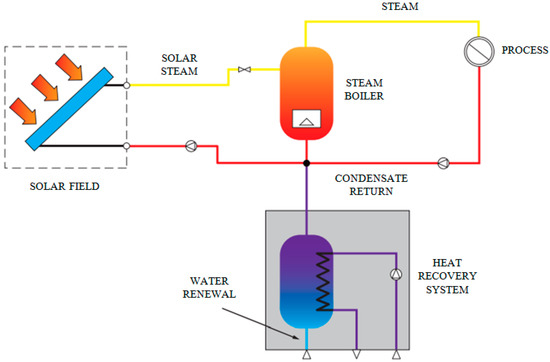
Figure 4.
Process heat scheme including an auxiliary boiler and a heat recovery system.
2. Solar Thermal Energy
STE is a set of technologies for harnessing solar energy for use in industry, residential or commercial sectors. The generation of thermal energy from solar radiation is highly recommended because of this option mitigates climate change and replace exhaustible sources. In addition to the environmental benefits already mentioned, solar technologies are related to other benefits linked to increased energy self-sufficiency of each country, provide access to energy required in isolated depressed areas and employment creation effect. Related to the last issue and in the particular case of Spain the economic impact has been evaluated. The results for a typical 50 MW parabolic trough plant with 7.5 h storage capacity, the most widespread type in Spain, are [31]:
- A total of 2214 equivalent jobs per year during contracting and construction, including contracting, construction and assembly, as well as manufacture of components and equipment, supply of services and indirect employment.
- A total of 47 equivalent jobs per year during operation.
Solar thermal energy collectors mainly used are flat plate (FP), compound parabolic collector (CPC), linear Fresnel collector (LFC) and PTC. The last three ones are the most used collectors for industrial processes.
2.1. Compound Parabolic Collector
A CPC vacuum tube collector ,see Figure 5, is a system composed of a few rows of transparent glass tubes connected to a head pipe. Each tube contains therein an absorption tube coated with selective paint. The heat transfer fluid runs inside this pipe. Vacuum is applied to minimize conduction and convection heat losses. In this type of collectors solar radiation passes through the glass outer tube, strikes the absorber tube and is finally transformed into heat. The overall performance of vacuum tube collectors is higher than that of conventional collectors and maintains a more constant behavior. CPC collectors include annular reflectors that allow a greater concentration of solar radiation onto the absorber tube.

Figure 5.
Compound parabolic collector. Source: SOLFEX Energy Systems.
2.2. Linear Fresnel Collector
The concept of LFC, see Figure 6, is based on the idea of simulating a continuous concentrator, in this case a parabolic trough collector as a set of elements, rows of mirrors properly arranged on a plane. Problems related to the construction of large concentrators are avoided, allowing taking lower cost solutions. LFC are therefore a low cost alternative to parabolic trough collectors. This kind of systems is composed of long parallel rows of mirrors of relatively small width which can rotate about their longitudinal axis. These mirrors concentrate solar radiation on a fixed central receiver suspended at a certain height. This geometry allows two or more receivers in parallel, relatively close to each other, thus enabling the ranks of mirrors to be shared by two of the receptors. This configuration optimizes the use of land and minimizes blockages among rows of mirrors. The main element of this technology is the absorber tube, which is essentially similar to one used in parabolic trough collector systems.
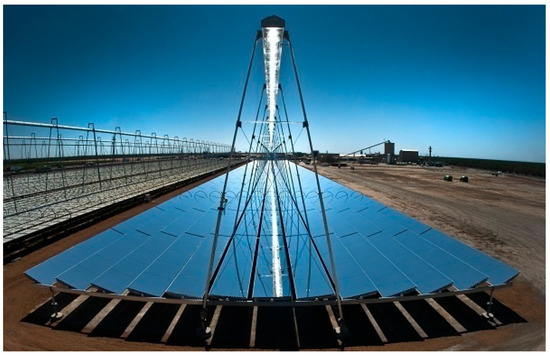
Figure 6.
Linear Fresnel collector (LFC).Source: AREVA solar.
2.3. Parabolic Trough Collector
PTC is one of the most mature CSP technologies, accounting for more than 90% of the currently installed CSP capacity. As illustrated in Figure 7, PTC consists of a series of parabolic reflectors that concentrate solar radiation on receiving pipes containing the heat transfer fluid that is heated throughout the process. These collectors are placed in parallel rows that make up the solar field aligned in a north-south or east-west axis. The receivers have a special coating to maximize energy absorption, minimize infrared re-irradiation and work in an evacuated glass envelope to avoid convection heat losses. Nowadays most systems are employed to obtain electric power. In these cases solar heat is moved by a heat transfer fluid flowing in the receiver tube and transferred to a steam generator to produce the super-heated steam that runs the turbine. Mirrors and receivers track the sun’s path along a single axis. An array of mirrors can be up to 100 m long with a curved aperture of 5–6 m.
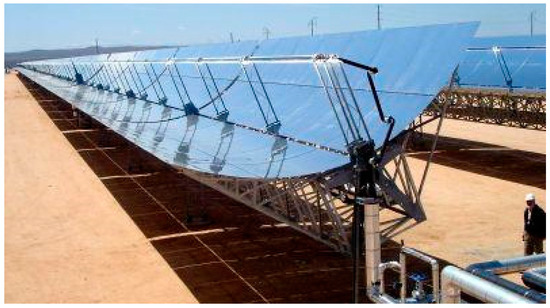
Figure 7.
Parabolic trough collector. Source: Enerstar.
Most PTC plants currently in operation have capacities of between 14 and 80 MWe, efficiencies of around 14%–16% and maximum operating temperatures of 663 K, which is limited by the degradation of synthetic oil used for heat transfer. The use of molten salt at 823 K for heat transfer is under demonstration. High-temperature molten salt may increase both plant efficiency and thermal storage capacity [32].
3. Configuration of the Plant
The plant that is analyzed in this paper considers that the solar energy system is coupled to a previously existing industrial process. The solar system supplies the thermal energy needed to run the plant. The conventional source of energy of the plant works as an auxiliary power system in the new configuration. Its function is to replace the new system when solar radiation transients do not allow meeting the needs of the industrial process. The characterization of this industrial process is not the subject of this paper but its needs; especially the working temperature determines the most appropriate solar technology. The plant that is analyzed in this paper is mainly composed of a solar field, a heat exchanger and a thermal energy storage system (Figure 8). Thermal energy storage system is considered infinite, in other words, all energy generated is used. Solar part also relies on a control system that manages the operation of the installation depending on weather conditions. The solar field is in charge of capturing solar radiation and raising the temperature of the heat transfer fluid. To cover the entire temperature range this paper analyzes CPC, LFC and PTC technologies.
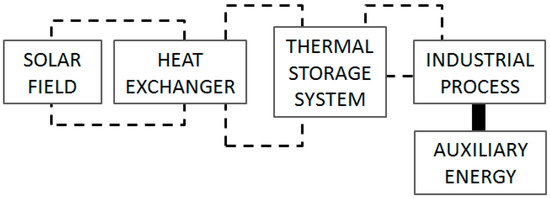
Figure 8.
Configuration of the analyzed plant.
To evaluate the thermal energy available at the output of the solar field the efficiency curves of each technology are required. The efficiency curves associated with the best available technology have been selected. The general expression of efficiency curves is as follows:
where ηsf: instantaneous solar field efficiency; η0: optical efficiency; c1: first order heat loss coefficient (W/K·m2); c2: second order heat loss coefficient (W/K2·m2); ΔT: difference between the mean fluid temperature and the ambient temperature (K); and GT: incident solar radiation (W/m2).
Table 2 specifies the coefficients of the equation above. ThePTC efficiency coefficients shown in Table 2 correspond to an evolved version of collectors used in solar thermal power plants. Although traditionally PTC can also be allocated to process heat, cooling or heating, new collectors have been recently developed specially designed for producing thermal energy in building environments. New collectors are usually simpler and more compact that the other ones used for electricity production. Their new configuration allows them to be integrated easily in urban or industrial environments. Some of their characteristics are a lower opening, height and weight, which generally results in facilities in transport and assembly.
Table 2.
Coefficients of efficiency curves. CPC: compound parabolic collector; LFC: linear fresnel collector and PTC: parabolic trough collector.
Figure 9 shows the efficiency evolution of medium temperature solar concentration technologies in a temperature range from 293 K to 633 K. It is noted that the CPC efficiency curve shows greater variability, while the steadiest behaviour is associated with the LFC technology.
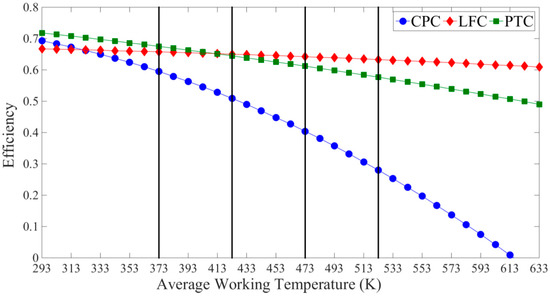
Figure 9.
Efficiency curves.
Thermal energy generated in the solar field is transferred to the industrial process through the heat exchanger and the solar storage system. The estimated efficiencies of the equipment—exchanger ηhe and energy storage system ηSAT—are 90% [38].
4. Economic Parameters
Table 3 summarizes the investment costs (CI), operation and maintenance costs (COM) and replacement costs (CR) related to each one of the analyzed technologies. CI is calculated on the basis of the area used while the other two costs are calculated as a percentage of the CI.
Table 3.
Solar technology costs.
COM is calculated annually while CR is related to an installation overhaul that is carried out in the fifteenth year of operation. To address the economic analysis is necessary to define the useful life of the analyzed installation, 30 years in this study [42]. The residual value of solar system after these 30 years is considered void.
5. Methodology
The methodology developed in this report consists of three phases in which are included the evaluation of thermal energy generated by the solar field, the estimation of levelized cost of energy (LCOE) and the analysis of environmental advantages.
5.1. Evaluation of Thermal Energy Generated by the Solar Field
This first phase attempts to evaluate the thermal energy generated by the solar field for the selected site, technology and thermal level. The main objective in this phase is to quantify the relevance that solar energy can achieve as thermal energy source by its incorporation into the industrial sector.
The thermal energy generated by the solar field (Esf) is evaluated according to the following expression in which the variable It represents the hourly incident solar radiation on the collector, depending on the technology under consideration. Global radiation when CPC technology is used and direct radiation when LFC or PTC are considered. The solar field efficiency (ηsf) of this expression is specified for each technology in Table 2. To evaluate the thermal energy generated per unit area over a full year is considered the sum of the product of hourly radiation and solar field efficiency from first (ii) to last (if) record:
The available energy at the output of the solar field differs from the useful energy for the industrial process (EIP) due to thermal losses associated to the heat exchanger and the thermal energy storage system. To evaluate the useful energy at the output of the energy storage system the estimated efficiencies of both equipments ηhe and ηSAT are used, respectively. According to the configuration of the plant showed in Figure 8, the following expression is applied:
5.2. Estimation of Levelized Cost of Energy
The second stage of the methodology estimates the LCOE parameter. This is used to compare the cost associated with the generation of thermal energy when different solar technologies or thermal levels are analyzed. The LCOE is evaluated according to the following expression in which the numerator considers the expenses that take place throughout all the useful life and the denominator considers the energy generated over the same period [43]. The variables r and s of this expression represent the average rate of consumer price index and the average energy price, both of them highly dependent on the country examined:
5.3. Analysis of Environmental Advantages
The last phase of this methodology evaluates the environmental advantages associated with the replacement of conventional sources of energy by solar systems. These advantages are evaluated in terms of greenhouse gas (GHG) avoided. This paper considers two scenarios, the substitution of electricity and natural gas. In both cases it is necessary to calculate the quantity of electricity or natural gas that allow to obtain an equivalent amount of thermal energy to the one generated by the solar system (EIP).
To evaluate the equivalent amount of electricity (Ee) it is considered Joule effect. The GHG emissions avoided by the use of a solar system instead of electricity (GHGe) are calculated using the electricity conversion factor (FPe) characteristic of each site analyzed:
In the case of natural gas it is considered that the fuel is used in a boiler. Thermal energy is generated by a combustion process. The natural gas lower heating value (LHV) and the efficiency boiler (ηb) are 8.18 kWh/m3 and 96%, respectively [44]. The volume (V) of natural gas used is calculated according to the following expression:
GHG emissions avoided are obtained as in Equation (5), taking into account that FPng represents the natural gas conversion factor. FPe and FPng provide the conversion factor from final energy to quantity of CO2 emissions:
6. Application
The application of the methodology described above analyzes the specific case of Argentina. This country has been selected due to its daily global horizontal radiation that ranges from 3.8 kWh/m2 to 5.2 kWh/m2 and daily direct normal radiation that ranges from 3.7 kWh/m2 to 5.5 kWh/m2. These ranges of daily radiation values represent the majority of radiation levels throughout Latin America.
To evaluate the possibilities of development of process heat generation in Argentina it is necessary to know the solar resources available. For this purpose a total of fourteen sites have been selected according to two criteria: these sites must be distributed around all the territory and zones of different levels of radiation must be covered. Table 4 lists the selected sites; they are identified numerically and their geographical coordinates are specified. Since it is complex to dispose of representative series of radiation measurements, especially in the case of direct normal radiation, the Meteonorm software (Version V.7.1.4, Meteotest, Bern, Switzerland) [45] has been used to obtain a representative solar year for each site in hourly frequency. Table 4 shows, in addition to latitude and lenght, the annual global horizontal radiation (Hg0), annual tilted global radiation (Hgi), annual direct normal radiation (Hbn), annual direct radiation on the collector (Hbc) and average ambient temperature (Tamb). To evaluate Hgi the optimum inclination (Iopt) has been selected for each site. This is the one that provides the highest annual global radiation.
Table 4.
Geographical, radiometrical and meteorological data of selected sites.
Figure 10, Figure 11, Figure 12 and Figure 13 show the monthly variability between solar radiation components for the fourteen selected sites. It can be seen that global horizontal radiation trend is similar to all sites, with the only exception of Salta that is slightly higher. In the case of global tilted radiation the behavior is more dispersed, however no significant conclusions can be drawn because the optimum inclination considered is different in each case. On the other hand it is observed that direct normal radiation is the variable that presents a greater variability, reaching maximum differences of 60% between different sites in June and July. The annual evolution of monthly incident direct radiation shows a behavior that is significantly more stable.
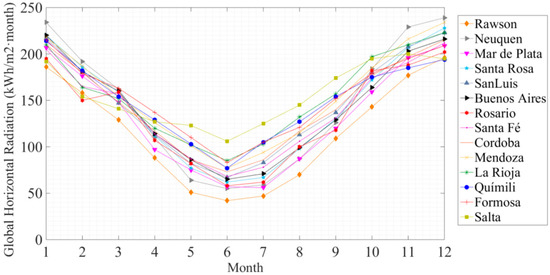
Figure 10.
Annual evolution of monthly global horizontal radiation.
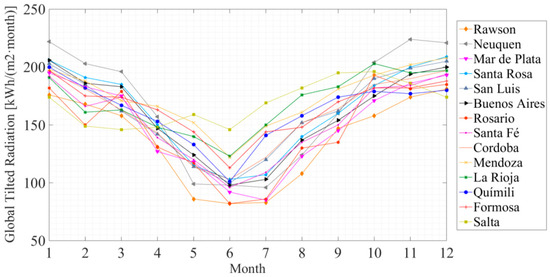
Figure 11.
Annual evolution of monthly global tilted radiation at optimum inclination.
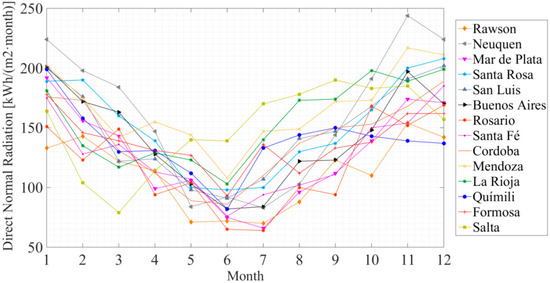
Figure 12.
Annual evolution of monthly direct normal radiation.
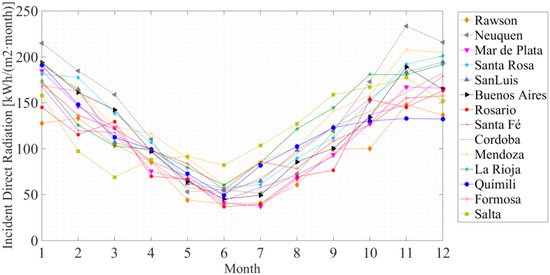
Figure 13.
Annual evolution of monthly incident direct radiation.
Monthly production of thermal energy will be proportional to the radiation values shown above when one of the solar technologies considered is employed. In the case of ambient temperature it is observed that all sites show a similar trend. Maximum differences of 11 K in October and November are reached (Figure 14).
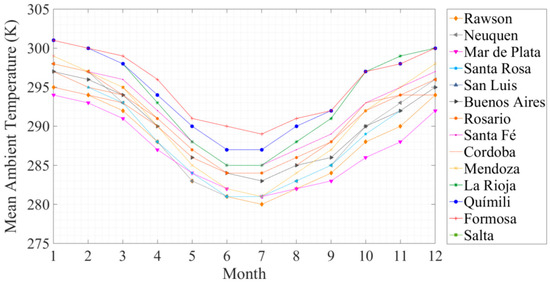
Figure 14.
Annual evolution of monthly mean ambient temperature.
7. Results and Discussion
7.1. Evaluation of Thermal Energy Generated by the Solar Field
Employing Equations (2) and (3) of the methodology described above the thermal energy that a solar system can provide to an industrial process is obtained. Table 5, Table 6 and Table 7 summarize the obtained results when CPC, LFC and PTC technologies are employed from 373 K to 523 K in 50 K. This range of temperatures has been selected because the most part of industrial process requirements fall within this interval. The analysis of these results shows that all technologies maintain similar behavior irrespective of their location. Figure 15, Figure 16 and Figure 17 show these results graphically.
Table 5.
Annual thermal energy generated by solar system using CPC technology in a temperature range from 373 K to 523 K.
Table 6.
Annual thermal energy generated by solar system using LFC technology in a temperature range from 373 K to 523 K.
Table 7.
Annual thermal energy generated by solar system using PTC technology in a temperature range from 373 K to 523 K.
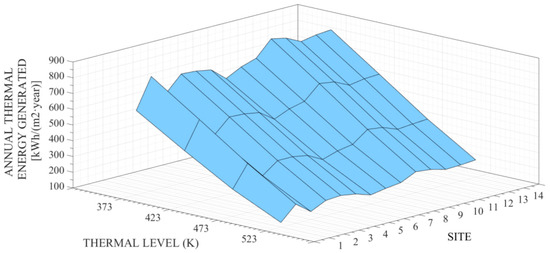
Figure 15.
Annual thermal energy generated by CPC technology depending on site.
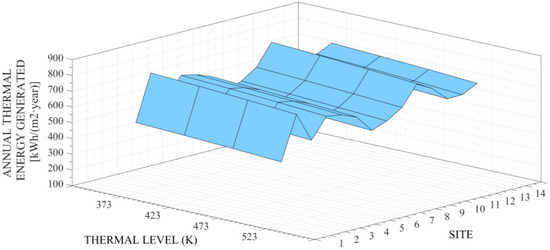
Figure 16.
Annual thermal energy generated by LFC technology depending on site.
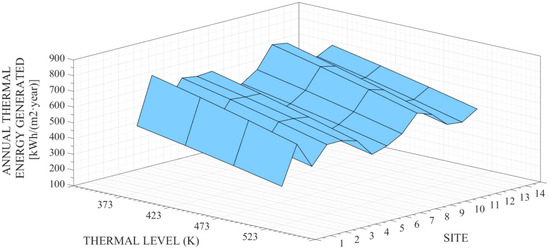
Figure 17.
Annual thermal energy generated by PTC technology depending on site.
The abscissa axis of these graphs show the different sites listed from 1 to 14 in Table 4 while the ordinate axis includes thermal levels considered.
Figure 15, Figure 16 and Figure 17 verify the previous statement which indicates that all different technologies show common operation standards for all locations. In the case of CPC technology it can be observed general downgrades of thermal energy generated by solar system when working temperature increases. This result is consistent with the efficiency curve of the CPC technology shown in Figure 9. When LFC and PTC are involved it can be observed a similar behavior although softer for both technologies. Between the options considered Mendoza can be highlighted as the one which presents a higher thermal energy obtained for all options, while Rawson is at the other extreme. When LFC technology is analyzed Neuquen and Mendoza show similar thermal production results.
7.2. Estimation of Levelized Cost of Energy
The second block of results summarizes the LCOE associated with each combination of site, technology and thermal level. Table 8 shows the LCOE interval for each site and technology in a temperature range from 373 K to 523 K. To obtain these results Equation (4) of the methodology, the economical information included in Table 3 and thermal energy generated in each case are required. It is also necessary to know the value of the parameters r and s. These parameters depend heavily on the economical situation of each country. In the case of Argentina are assumed to be of 2% and 1.4%, respectively, although these ratios depend on the country and period of time analyzed.
Table 8.
Range of levelized cost of energy (LCOE) depending on technology and site considered.
Figure 18, Figure 19, Figure 20 and Figure 21 show the LCOE evolution depending on the thermal level of the industrial process.
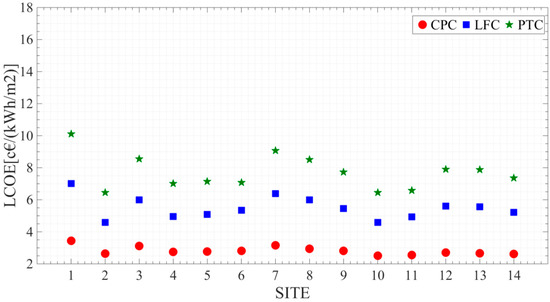
Figure 18.
Influence of site and technology on the LCOE for a thermal level of 373 K.
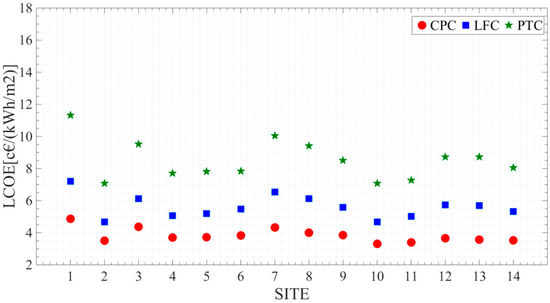
Figure 19.
Influence of site and technology on the LCOE for a thermal level of 423 K.
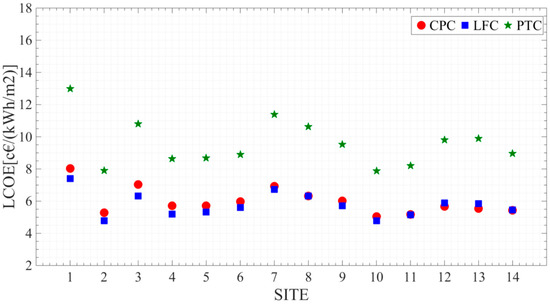
Figure 20.
Influence of site and technology on the LCOE for a thermal level of 473 K.
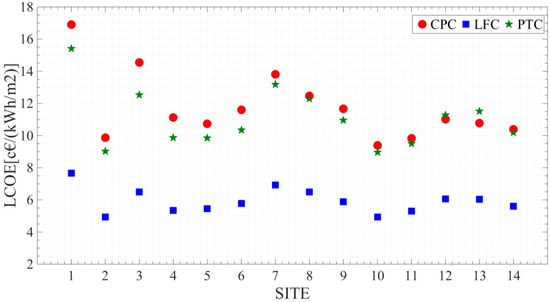
Figure 21.
Influence of site and technology on the LCOE for a thermal level of 523 K.
CPC stands out as the most recommendable technology when the working fluid temperature ranges from 373 K to 423 K. In this interval of temperature the LFC technology almost doubles the LCOE values of CPC technology while the PTC technology almost triples it.
As working fluid temperature increases, the differences between the LCOE values of CPC and LFC technologies decrease as Figure 20 shows.
Figure 21 shows a substantial change, as can be observed the LFC technology is the one which presents the lowest LCOE values for all sites. The LCOE values of PTC technology are close to the CPC technology values.
In the specific case of Buenos Aires the natural gas tariff for industrial sector costumers (minimum consumption of 3,200,000 m3) is 0.62 €/m3 and is tax free [46]. If it is considered that this cost remains constant over the useful life of a solar system, the average consumer price index rate is 2% and the Euro-Argentine peso exchange ratio is 0.060220 [47], so the equivalent cost of thermal energy generation is 5.87 €/kWh. If this result is compared to those listed in Table 8 it is found that in Argentina a solar system would be economically interesting as a source of thermal energy for an industrial process when CPC in the lower temperatures range or LFC technologies are used.
7.3. Analysis of Environmental Advantages
In order to use the methodology described above it is necessary to dispose of FPe and FPng parameters. Table 9 shows the conversion factors for the particular case of Argentina [48].
Table 9.
Conversion factors of electricity and natural gas.
Finally GHG emissions avoided by using one of the solar concentration technologies options coupled to an industrial process instead of electricity or natural gas energy are summarized in Table 10 and Table 11. The results shown in Table 10 and Table 11 are directly proportional to the thermal energy generated by the solar systems.
Table 10.
Greenhouse gas (GHG) emissions annually avoided depending on site and thermal level when a solar system is used instead of electricity.
Table 11.
GHG emissions annually avoided depending on site and thermal level when a solar system is used instead of natural gas.
Kilograms of CO2 avoided by replacing electricity as a source of thermal energy are greater than the option in which natural gas is replaced, as might be expected from the given values of the parameters FPe and FPng.
8. Conclusions
This paper reviews the potential application of solar concentration technologies as sources of heat for industrial processes in which thermal energy are required. High levels of solar radiation observed in Latin America show that solar concentration technologies can become an interesting alternative, not only to replace conventional sources of energy in existing installations, but also to provide thermal energy in isolated areas. This possibility will provide an opportunity for the local development to isolated communities. The use of solar energy is linked to improved environmental impact, energy dependence, local development and job creation.
Public administrations must quantify the advantages of solar thermal energy from all points of view, especially in those countries in which conventional sources of energy are subsidized. This fact affects the development and widespread use of solar systems in isolated areas of Latin America.
The methodology proposed in this paper evaluates the thermal energy generated per unit area by solar system, the LCOE and the GHG emissions avoided by using solar energy instead of a conventional source of energy. This methodology is applied for the particular case of fourteen selected sites of Argentina which include the most representative levels of solar radiation of Latin America.
From the point of view of thermal energy production per unit area the CPC technology stands out as the most recommended option when the temperature of the working fluid is almost 373 K. By increasing the temperature of the working fluid, at least until 523 K, the recommended technology is LFC.
From an economic perspective CPC is highlighted as the most recommendable technology when the working fluid temperature ranges from 373 K to 423 K. In this interval of temperature the LFC technology almost doubles the LCOE values of CPC technology, while the PTC technology almost triples them. As the working fluid temperature increases to around 473 K, the differences between the LCOE values of CPC and LFC technologies decrease. When 523 K is reached LFC technology is the one which presents the lowest LCOE values for all sites, while the LCOE values of PTC technology are close to the CPC technology values.
LCOE values related to CPC technology vary between 2.5 c€/(kWh·m2) and 16.9 c€/(kWh·m2). In the case of LFC technology this interval ranges from 4.6 c€/(kWh·m2) and 7.7 c€/(kWh·m2) while for PTC technology the interval extends from 6.4 c€/(kWh·m2) to 15.4 c€/(kWh·m2). These rates change depending on the site analyzed and the thermal energy required by the industrial process. CO2 emissions avoided when solar technologies are used instead of conventional sources of energy vary between 51 (kgCO2/(m2·year)) and 348 (kgCO2/(m2·year)) when electrical energy is substituted, whereas when natural gas is replaced, this rate ranges from 33 (kgCO2/(m2·year)) and 220 (kgCO2/(m2·year)).
Author Contributions
Isidoro Lillo and Elena Pérez raised the paper and drafted it, Sara Moreno performed the calculations and Manuel Silva evaluated solar technologies parameters. All authors reviewed the paper.
Conflicts of Interest
The authors declare no conflict of interest.
Nomenclature
| c1 | First order heat loss coefficient |
| c2 | Second order heat loss coefficient |
| CI | Investment costs |
| COM | Operation and maintenance costs |
| CPC | Compound parabolic collector |
| CR | Replacement costs |
| CSP | Concentrating solar power |
| Ee | Electrical energy |
| EIP | Industrial process energy |
| Esf | Solar field energy |
| FP | Flat plate |
| FPe | Electricity conversion factor |
| FPng | Natural gas conversion factor |
| GHG | Greenhouse gas |
| GT | Incident solar radiation |
| Hbc | Direct radiation on the collector |
| Hbn | Direct normal radiation |
| Hg0 | Global horizontal radiation |
| Hgi | Tilted global radiation |
| if | Last record |
| ii | First record |
| Iopt | Optimum inclination |
| LCOE | Levelizedcost of energy |
| LFC | Linear fresnel collector |
| LHV | Lower heating value |
| η0 | Optical efficiency |
| ηb | Boiler efficiency |
| ηhe | Heat exchanger efficiency |
| ηSAT | Energy storage system efficiency |
| ηsf | Solar field efficiency |
| PTC | Parabolic trough collector |
| r | Consumer price index |
| s | Energy price index |
| STE | Solar thermal energy |
| Tamb | Mean ambient temperature |
| V | Volume |
References
- British Petroleum. Primary Energy Consumption—Leading Countries 2014; Petroleum Industry Company: London, UK, 2015. [Google Scholar]
- International Energy Agency. Key World Energy Statistics 2015; International Energy Agency: Paris, France, 2015. [Google Scholar]
- Moreno, I.; Palenzuela, P. América Latina. Una Aproximación Pluridisciplinar; Aconcagua Libros: Seville, Spain, 2013. (In Spanish) [Google Scholar]
- Majano, A.M. Desarrollo Sostenible: Medio Ambiente, Cambio Climático y Energía; Banco Interamericano de Desarrollo: Washington, DC, USA, 2008. (In Spanish) [Google Scholar]
- Sebastian, K.; Peter, M. El Potencial de América Latina con Referencia a la Energía Renovable; Global Energy Network Institute: San Diego, CA, USA, 2009; pp. 1–83. (In Spanish) [Google Scholar]
- National Renewable Energy Laboratory. Available online: www.nrel.org (accessed on 17 October 2016).
- Roldán Serrano, M.I. Diseño y análisis térmico de un sistema receptor volumétrico para un horno solar de alta temperatura; CIEMAT: Madrid, Spain, 2013. [Google Scholar]
- International Renewable Energy Agency. Solar Heat for Industrial Processes. In Technology Brief; International Renewable Energy Agency: Abu Dhabi, UAE, 2015. [Google Scholar]
- Aidonis, A.; Drosou, V.; Mueller, T.; Staudaher, L.; Fernandez-Llebrez, F.; Oikonomou, A.; Spencer, S. PROCESOL II. Solar thermal plants in industrial processes. In Design and Maintenance Guidelines; Centre for Renewable Energy Sources: Pikermi, Greece, 2002. [Google Scholar]
- Krummenacher, P.; Muster, B. Methodologies and Software Tools for Integrating Solar Heat into Industrial Processes; International Energy Agency: Paris, France, 2015. [Google Scholar]
- Cottret, N.; Menichetti, E. Technical Study Report on Solar Heat For Industrial Processes (SHIP) State of the Art in the Mediterranean Region; Observatoire Méditerranéen de l’Energie: Nanterre, France, 2010. [Google Scholar]
- European Solar Thermal Industry Federation. Solar Industrial Process Heat. State of the Art; European Solar Thermal Industry Federation: Brussels, Belgium, 2006. [Google Scholar]
- Larcher, M.; Rommel, M.; Bohren, A.; Frank, E.; Minder, S. Characterization of a parabolic trough collector for process heat applications. Energy Procedia 2014, 57, 2804–2811. [Google Scholar] [CrossRef]
- Hafner, B.; Stoppok, O.; Zahler, C.; Berger, M.; Hennecke, K.; Krüger, D. Development of an integrated solar-fossil powered steam generation system for industrial applications. Energy Procedia 2014, 48, 1164–1172. [Google Scholar] [CrossRef]
- Fuller, R.J. Solar industrial process heating in Australia—Past and current status. Renew. Energy 2011, 36, 216–221. [Google Scholar] [CrossRef]
- Beath, A.C. Industrial energy usage in Australia and the potential for implementation of solar thermal heat and power. Energy 2012, 43, 261–272. [Google Scholar] [CrossRef]
- Lauterbach, C.; Schmitt, B.; Jordan, U.; Vajen, K. The potential of solar heat for industrial processes in Germany. Renew. Sustain. Energy Rev. 2012, 16, 5121–5130. [Google Scholar] [CrossRef]
- Calderoni, M.; Aprile, M.; Moretta, S.; Aidonis, A.; Motta, M. Solar thermal plants for industrial process heat in Tunisia: Economic feasibility analysis and ideas for a new policy. Energy Procedia 2012, 30, 1390–1400. [Google Scholar] [CrossRef]
- Ramos, C.; Ramirez, R.; Beltran, J. Potential assessment in Mexico for solar process heat applications in food and textile industries. Energy Procedia 2014, 49, 1879–1884. [Google Scholar] [CrossRef]
- AEE INTEC. Database for Applications of Solar Heat Integration in Industrial Processes. 2016. Available online: http://ship-plants.info/ (accessed on 15 March 2017).
- Halabi, M.A.; Al-Qattan, A.; Al-Otaibi, A. Application of solar energy in the oil industry—Current status and future prospects. Renew. Sustain. Energy Rev. 2015, 43, 296–314. [Google Scholar] [CrossRef]
- Hassine, I.B.; Sehgelmeble, M.C.; Söll, R.; Pietruschka, D. Control optimization through simulations of large scale solar plants for industrial heat applications. Energy Procedia 2015, 70, 595–604. [Google Scholar] [CrossRef]
- Antonio Quijera, J.; González Alriols, M.; Labidi, J. Integration of a solar thermal system in canned fish factory. Appl. Therm. Eng. 2014, 70, 1062–1072. [Google Scholar] [CrossRef]
- Frey, P.; Fischer, S.; Drück, H.; Jakob, K. Monitoring results of a solar process heat system installed at a textile company in Southern Germany. Energy Procedia 2015, 70, 615–620. [Google Scholar] [CrossRef]
- Sharma, A.K.; Sharma, C.; Mullick, S.C.; Kandpal, T.C. Potential of solar energy utilization for process heating in paper industry in India: A preliminary assessment. Energy Procedia 2015, 79, 284–289. [Google Scholar] [CrossRef]
- Silva, R.; Cabrera, F.J.; Pérez-García, M. Process heat generation with parabolic trough collectors for a vegetables preservation industry in Southern Spain. Energy Procedia 2014, 48, 1210–1216. [Google Scholar] [CrossRef]
- Haagen, M.; Zahler, C.; Zimmermann, E.; Al-Najami, M.M.R. Solar process steam for pharmaceutical industry in Jordan. Energy Procedia 2015, 70, 621–625. [Google Scholar] [CrossRef]
- Abengoa. Available online: http://www.abengoasolar.com/web/en/plantas_solares/plantas_para_terceros/chile/index.html (accessed on 15 March 2017).
- CSP Today. Available online: http://es.csptoday.com/ (accessed on 24 October 2016).
- Schoweiger, H.; Vannoni, C.; Oinedo, I.; Facci, E.; Baehrens, D.; Mozetic, L. Evaluación de potencial de la energia solar termica en el sector industrial. Estudio Técnico PER 2011–2020; Institute for Energy Diversification and Saving (IDAE): Madrid, Spain, 2011. (In Spanish) [Google Scholar]
- Protermosolar and Deloitte. Impacto macroeconómico del Sector Solar Termoeléctrico en España; Protermosolar: Sevilla, Spain, 2010. (In Spanish) [Google Scholar]
- Energy Technology Systems Analysis Programme (IEA-ETSAP); International Renewable Energy Agency (IRENA). Concentrating Solar Power Technology Brief; IEA-ETSAP and IRENA Technology Brief E10; IEA-ETSAP: Paris, France; IRENA: Masdar, UAE, 2013; Volume 1, pp. 331–339. [Google Scholar]
- Estec-Solar. 2016. Available online: http://www.estec-solar.de/ (accessed on 12 September 2016).
- Ferroli. 2016. Available online: http://www.ferroli.es/zona-usuario/productos/Energia-Solar (accessed on 12 September 2016).
- Vaillant. 2016. Available online: http://www.vaillant.es/usuarios/ (accessed on 12 September 2016).
- Urtiaga, J.D.; Nevado, C.E.; Camacho, J.G.; Salvador, A.P. Análisis de potencial y oportunidades de integración de energía solar térmica en redes de climatización. Energía solar de concentración en una red de calor y frío en Jaén; Institute for Energy Diversification and Saving (IDAE): Madrid, Spain, 2015. (In Spanish) [Google Scholar]
- Silva, R.; Berenguel, M.; Pérez, M.; Fernández-Garcia, A. Thermo-economic design optimization of parabolic trough solar plants for industrial process heat applications with memetic algorithms. Appl. Energy 2014, 113, 603–614. [Google Scholar] [CrossRef]
- Ma, Z.; Glatzmaier, G.; Turchi, C.; Wagner, M. Thermal energy storage performance metrics and use in thermal energy storage design. In Proceedings of the Colorado: ASES World Renewable Energy Forum Denver, Denver, CO, USA, 13–17 May 2012.
- Lazzarin, R.M. Solar cooling: PV or thermal? A thermodynamic and economical analysis. Int. J. Refrig. 2014, 39, 38–47. [Google Scholar] [CrossRef]
- Zhu, G.; Wendelin, T.; Wagner, M.J.; Kutscher, C. History, current state, and future of linear Fresnel concentrating solar collectors. Sol. Energy 2014, 103, 639–652. [Google Scholar] [CrossRef]
- Inernational Renewable Energy Agency (IRENA). The Power to Change: Solar and Wind Cost Reduction Potential to 2025; IRENA: Abu Dhabi, UAE, 2016; p. 112. [Google Scholar]
- Morin, G.; Dersch, J.; Platzer, W.; Eck, M.; Häberle, A. Comparison of linear Fresnel and parabolic trough collector power plants. Sol. Energy 2012, 86, 1–12. [Google Scholar] [CrossRef]
- Konstatin, P. Praxisbuch Energiewirtschaft: Energieumwandlung, Transport und -Beschaffung im Liberalisierten Markt; Springer: Berlin, Germany, 2009. (In German) [Google Scholar]
- Petromercado. Available online: http://petromercado.com/ (accessed on 24 October 2016).
- Meteotest. Available online: http://www.meteonorm.com/ (accessed on 13 September 2016).
- Análisis Comparativo de las Tarifas de Gas Natural en Argentina y Suramérica; Centro de Estudios de la Regulación Económica de los Servicios Públicos: Buenos Aires, Argentina, 2016. (In Spanish)
- Aduana Argentina. Available online: http://www.aduanaargentina.com/cm.php (accessed on 26 October 2016).
- Ministry of Energy and Mining of Argentina. Available online: https://www.minem.gob.ar./ (accessed on 20 October 2016).
© 2017 by the authors. Licensee MDPI, Basel, Switzerland. This article is an open access article distributed under the terms and conditions of the Creative Commons Attribution (CC BY) license ( http://creativecommons.org/licenses/by/4.0/).