1. Introduction
The energy industry has gone through great change due to the rapid development of technology and the economy in the 21st century. In recent years, fossil energy exhaustion, environmental pollution, large-scale renewable energy application, etc. have proven to be key drivers in the development of a modern energy system which needs to meet the requirements of low-carbon emissions and efficient utilization of friendly sustainable energy sources. However, different energy systems are designed, planning and operating independently of the traditional style, which separates the coupling correlations between different types of energy and largely limits the flexibility of the energy system. In this case, ESI is proposed as it is an important type of new energy system, and covers electric power, heat and natural gas systems with the purpose of coordinating the whole system in the processes of generation, transmission and consumption, which are considered to be the core technology of the “third industrial revolution” [
1]. Therefore, the development of an integrated modeling and analysis framework for ESI represents an essential need for future research.
Based on the characteristics in a range of application and recent survey, ESI can be classified into two categories [
2,
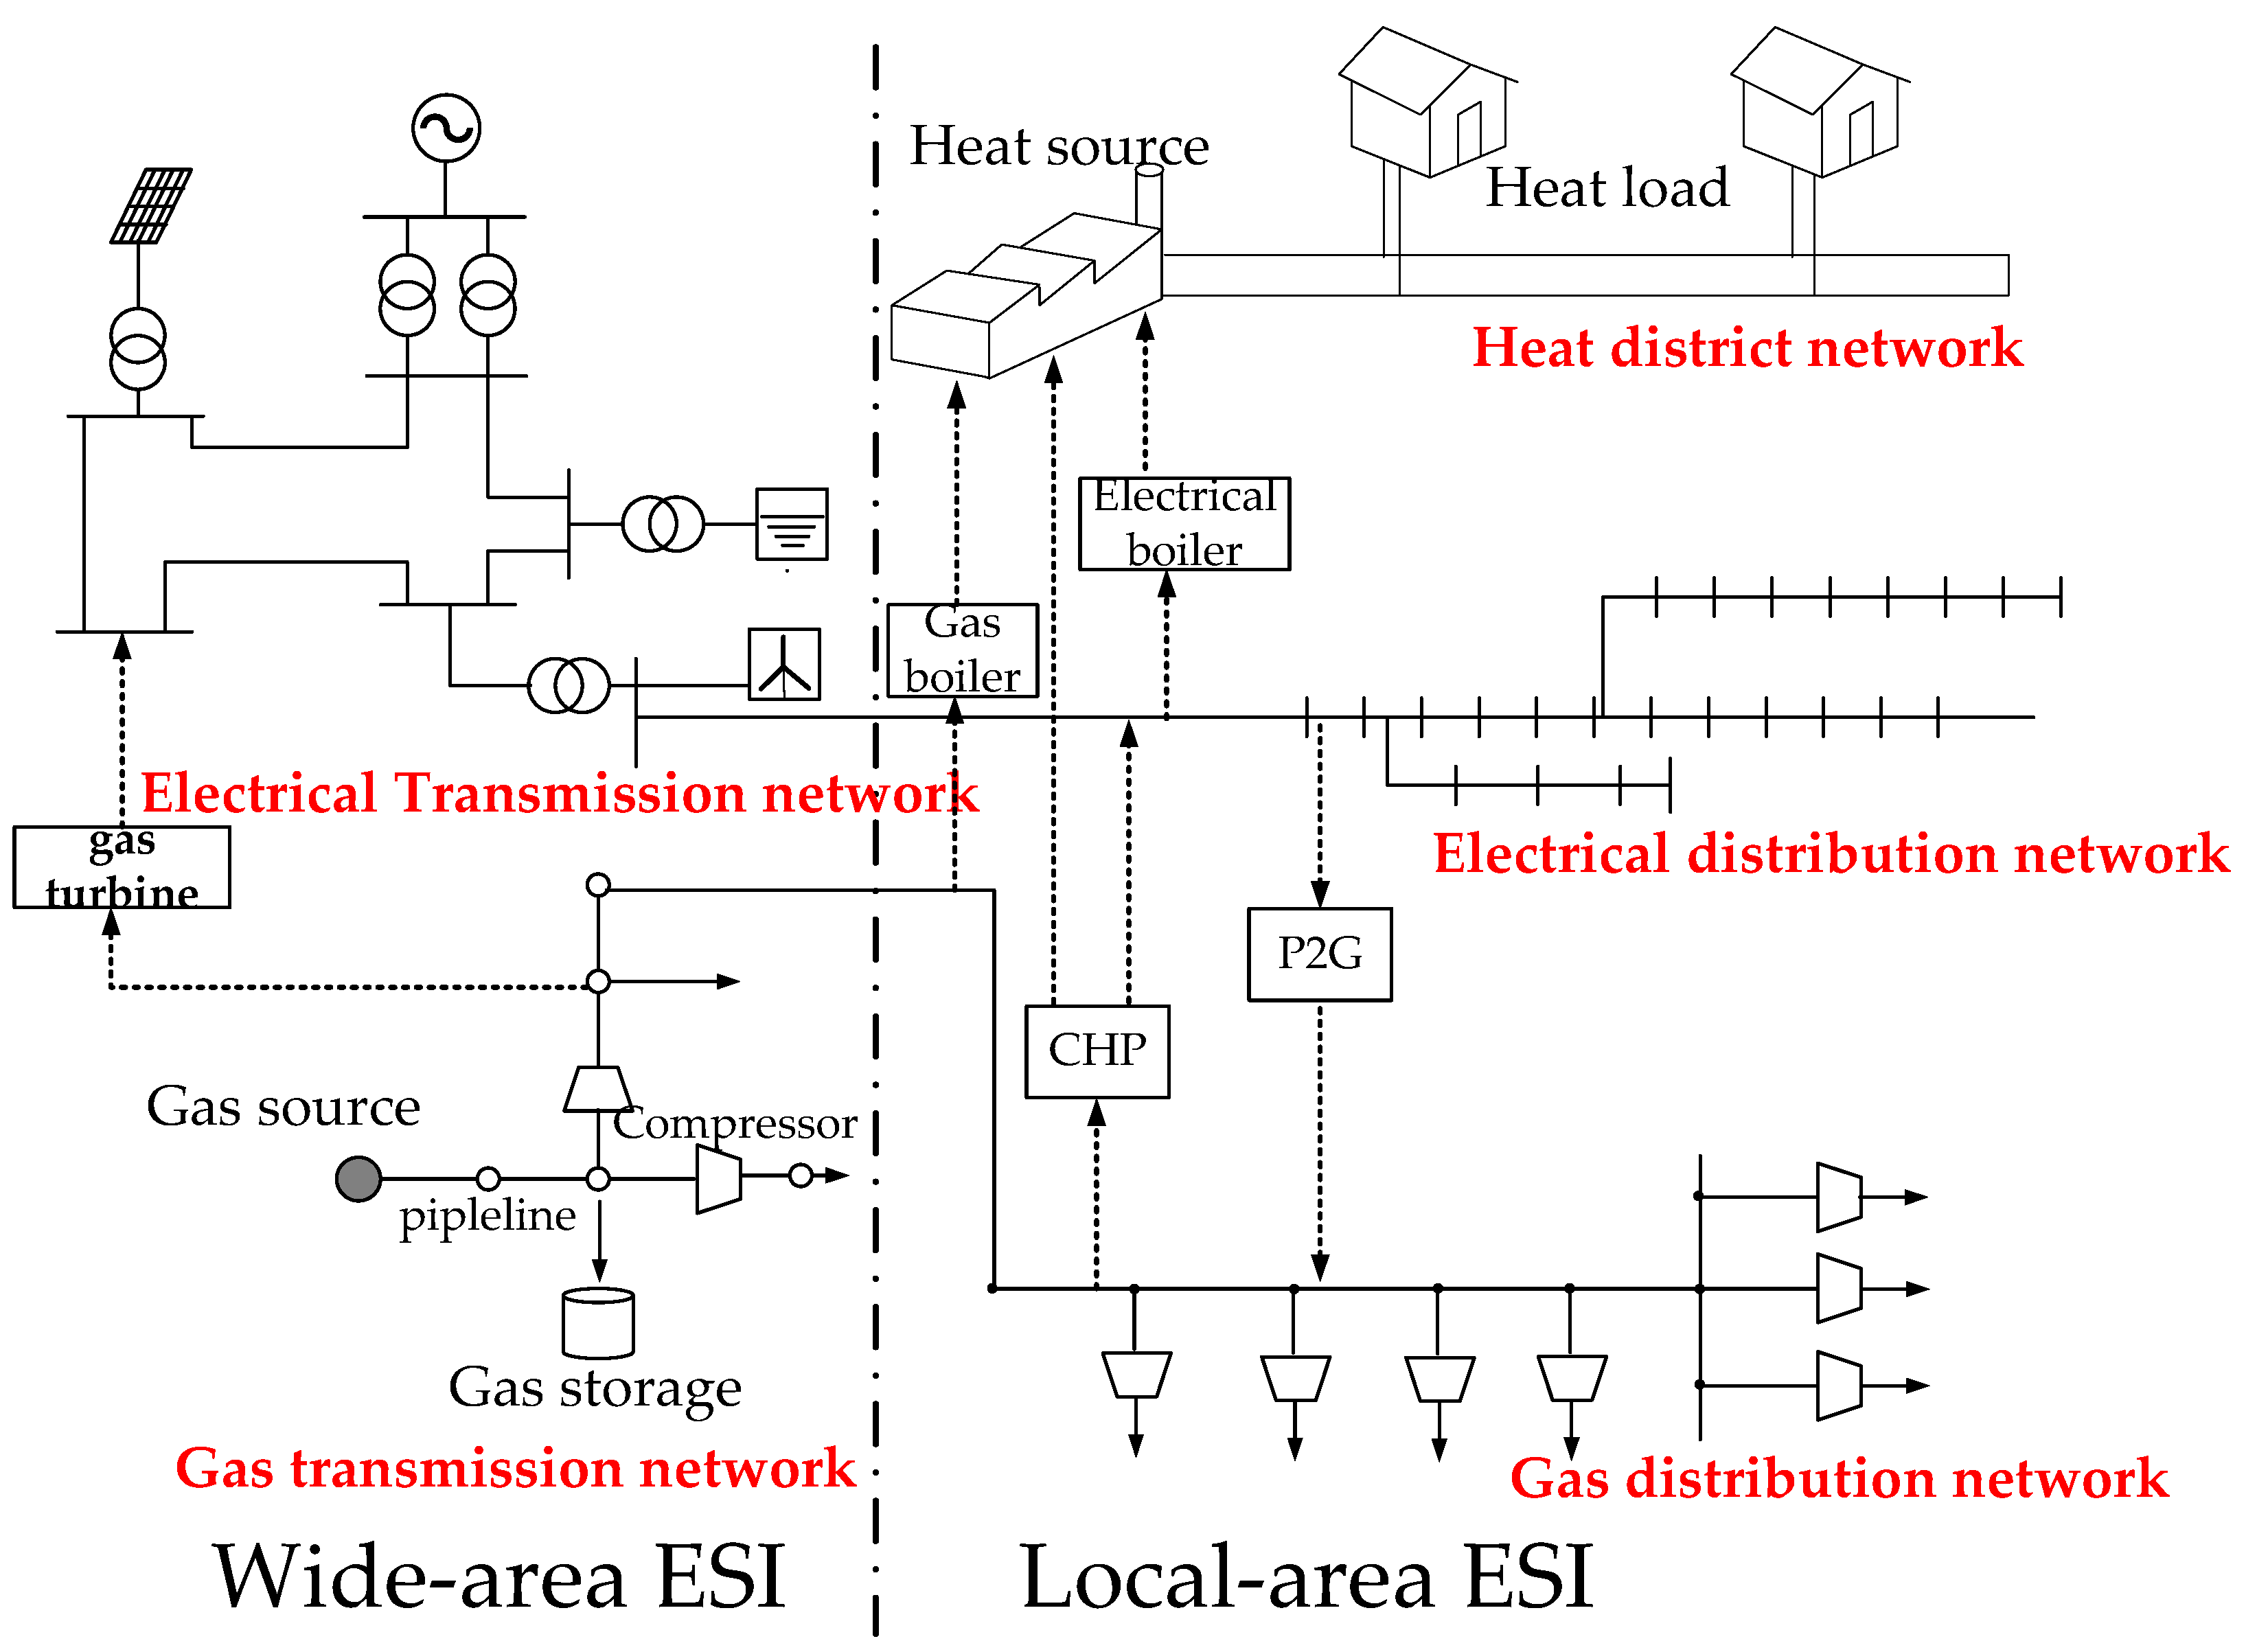
3]: wide-area ESI and local-area ESI. Wide-area ESI covers the whole chain of energy production, energy transportation, energy conversion, and energy consumption, such as global ESI, intercontinental ESI, or country ESI. Local-area ESI coordinates regional power grids, regional gas networks, and district heat networks, which can be seen as an upgraded level of a microgrid. Local-area ESI has many forms and includes city ESI, community ESI, industrial park ESI, etc. This paper concentrates on local-area ESI which lays a solid foundation and valid support for the entire energy system. The relationship between wide-area ESI and local-area ESI is shown in
Figure 1.
Numerous functions in ESI will be largely different compared to conventional energy systems, especially the energy flow analysis function. Over the past few decades, power flow analysis, which is essential to analyze the steady-state as well as dynamic performance in power systems, has provided valuable references for its planning, operation, maintenance and protection. Similarly, in other energy systems, the quality of energy flow analysis contributes greatly to the efficiency of the operation and planning of any energy utility since many potentially costly decisions are based on such calculation results. With the advent of ESI, dramatic changes have occurred in energy utilization. Generalized energy flow (GEF), which analyzes the flow of various energy systems jointly as the cornerstone theory, has a tremendous guiding significance for energy suppliers, aggregators, energy marketers, independent system operators, etc. Hence, the steady state analysis of the multiple energy flow will play a key role in ESI.
Many studies have been done on energy flow and much work has been done concerning the interaction of various energy systems. Several conceptual approaches for modeling the integration of energy systems have been published, including energy hubs [
4], multi-energy systems and distributed multi-generation [
5], community energy [
6], smart energy systems [
7], and integrated energy systems [
8]. Reference [
9] proposed a steady energy flow study to quantify the interdependency of energy infrastructures, which computed an equilibrium point of electricity and natural gas coupled systems by using an energy flow algorithm. In Reference [
10], a combined analysis was developed to investigate the performance of electricity and heat networks as an integrated whole. Reference [
11] proposed a new sequential calculation method to solve natural gas and power flow. In Reference [
12] the concept of a probabilistic load flow, which has been widely applied in electric power systems, was extended to probabilistic energy flow analysis including electric power and natural gas flows. In addition to steady energy flow, plenty of studies have focused on optimal energy flow studies. In References [
4,
13], the optimal energy flow was solved by the centralized optimization algorithm and the distributed optimization algorithm, respectively, based on the energy hub concept. Reference [
14] suggested a multi-objective algorithm to optimize its energy flow by considering the dynamics of the system and the equipment’s thermal inertias. With respect to nonlinear algebraic equation solutions, one standard approach of solving the algorithm is the Newton-Raphson method [
15]. However, traditional power flow relying on Newton-Raphson is not robust if no starting point sufficiently close to a solution is provided. To address this issue, several methods were developed to reliably compute nonlinear equations, such as the Gauss Seidel iterations method [
16], and the homotopy-enhanced method [
17]; however, their convergence rate was relatively limited. Therefore, the improvement of existing approaches is still an urgent problem to be solved regardless of the mathematical model or solution algorithm.
By taking account of current scientific research and the engineering applications of ESI, the contributions of this paper can be summarized in three aspects as follows:
- (1)
To the best of our knowledge, most previous research has concentrated either on the interaction of electricity-gas or electricity-heat. In this paper, the GEF of a local-area ESI is proposed, which designs the whole energy flow framework of gas, heat, and electricity jointly.
- (2)
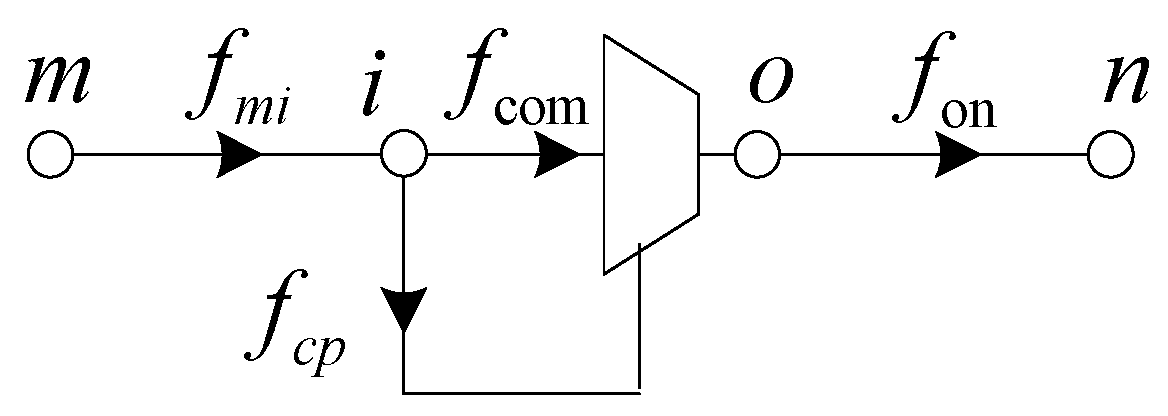
Complicated nonlinear mathematical models of some devices in energy systems create dilemmas in the implementation of energy flow calculations, especially regarding the compressor facility that belongs to gas energy system. By considering that issue, we effectively simplified the model as an equivalent transformation which reduces computational complexity.
- (3)
By considering the advantage of the algorithm and the complexity of the ESI model, a hybrid algorithm, which combines the homotopy method and Newton's method, was adopted to solve nonlinear equations of GEF.
This paper is organized as follows.
Section 2 presents the fundamental concept and mathematic model of each energy subsystem.
Section 3 describes the GEF calculation method based on homotopy and the Newton-Raphson algorithm, and the Jacobi matrix, which maps multi-energy coupling relationships, is proposed.
Section 4 shows the experimental results used to verify the effectiveness of the proposed algorithm in different scenarios. Finally, our conclusions and future research avenues are given in
Section 5.
3. GEF Calculation Method
Due to the simultaneous equations of different energy systems, the number of nonlinear equations and the dimension of decision variables are greatly increased, therefore, an inappropriate method used to solve the nonlinear equations will lead to bad convergence or even ill-conditioned flow. In this paper, we used a hybrid method to compute the equilibrium point of ESI, which is comprised of the homotopy method and the Newton-Raphson method. First, the homotopy algorithm was used to calculate the initial value of equations by its global convergence superiority, before the Newton-Raphson algorithm was executed to quickly converge to a stable solution, which met both requirements of computational stability and convergence speed.
3.1. GEF Mode
The equations of the GEF model are formulated by the equations of the electrical power flow, the heat flow, the gas flow and the coupling components model.
where the equations of the electrical power system represent active deviation and reactive power deviation; and the equations of the heat system represent the nodal heat power deviation, loop pressure drop deviation, temperature deviation in the heat supply system and the temperature deviation in the regenerative system. The equations of the gas system represent nodal flow deviation.
PSP,
QSP,
ΦSP and
LSP are the given active power and reactive power load, heat load and natural gas load.
Asl and
Agl are the heat supply network correlation matrix and natural gas network correlation matrix, which has removed the gas compressor.
Cs and
Cr are matrix related to heat supply network and regenerative network, respectively.
bs and
br are the column vector associated with the heat supply temperature and output temperature, respectively. Details are reported in Reference [
13].
X = [θ;
V;
m;
Ts,load;
Tr,load;
Π] are the state variables of the GEF calculation.
3.2. Iterative Method
The homotopy analysis method is a numerical solution used to solve nonlinear equations, and can cooperate with many numerical methods/programs to achieve robust computation. It has the advantage of large or global convergence regions and is well suited for finding multiple solutions. Whether the original iteration point is sufficiently close to a provided solution has no influence on convergence.
The main idea is to embed a continuation parameter λ into F(x) of Equation (15) to form a new function S(x,λ) which satisfies the property that S(x,0) = G(x), S(x,1) = F(x). The function S(x,λ) is called a homotopy, where the system of equations S(x,λ) = G(x) at λ = 0 is easy to solve or has known solution(s) x0, and the system at λ = 1 is identical to the “difficult” problem that we aim to solve. The homotopy equation is defined by S(x,λ) = (1 − λ)G(x) + λF(x).
The Newton homotopy method is used in this case. When
G(
x) =
F(
x)
− F(
x0),
S(
x,λ) =
F(
x) + (λ
− 1)
F(
x0), in order to obtain the homotopy path of the function
x =
x(
t). The derivation of
S(
x,λ) can be noted as:
The nonlinear equations are transformed into solving problems of differential equations.
The equation has a unique solution
x =
x(
t), which meets the condition that
x(0) =
x0,
x(1) =
x* is the solution to Equation (15). Details of the homotopy algorithm are reported in Reference [
17].
After the initial value was calculated by the homotopy algorithm, the Newton-Raphson method was used to solve the GEF problem, and the iterative equations can be denoted as follows:
where Δ
Fe = [Δ
P, Δ
Q], Δ
Fh = [(Δ
Φ, Δ
p), (Δ
Ts, Δ
Tr)], Δ
Fg = Δ
f represent deviations of electricity, heat and gas, respectively.
xe = [θ,
V],
xh = [
m, (
Ts,load,
Tr,load)],
xg =
Π represent state variables of electricity, heat and gas, respectively. The Jacobian matrix of GEF can be noted as:
where diagonal block matrix
Jee,
Jhh,
Jgg represent the relationship between the energy flow and its own state variable in electric, thermal, gas system, respectively, and the mathematical expression is the same as the calculation for traditional power, thermal, and natural gas flows. The derivation method of the diagonal block expression is given in References [
10,
11,
15].
In a natural gas network, the slack node is always connected with the gas source, and as the state of the natural gas system changes, the supply and demand fluctuations will be borne by the change of the slack node supply, which does not affect the state of the thermal and power systems, so Jeg and Jhg in Equation (19) are zero term.
In a heat network, the thermal power in slack node is partially supplied by the CHP unit which works in following the thermal load (FTL) model; as the state of the thermal system changes, fluctuations in the thermal power slack node can also change the consumption of natural gas and electricity simultaneously, so
Jeh,
Jgh in Equation (19) are non-zero term. The output of the CHP unit and gas consumption is denoted by Equation (20):
where
Asource,i is the row which is related to the heat source in the node correlation matrix of the thermal system.
In electric power grid, operation mode can be divided into two types:
(1) Grid Connected Mode
When the electrical subsystem in the ESI is connected to the bulk power grid, the fluctuation of the electric power in the ESI is balanced by the bulk power grid.
(2) Island Mode
When the electrical subsystem in the ESI operates in island mode, as the state of thermal system changes, the fluctuation is balanced by the CHP unit which works in following the electric load (FEL) model in electric power slack node can also change the consumption of natural gas and heat power simultaneously, so Jhe, Jge in Equation (19) are non-zero term.
The CHP output and the gas consumption of the slack node in the island mode power system are expressed as:
As per the analysis above, Equations (20) and (21) are substituted into the equations of the GEF. After computing the first derivation of GEF, the non-diagonal block of the Jacobi matrix under the condition of grid connected mode and island mode is shown in
Table 2.
4. Case Studies
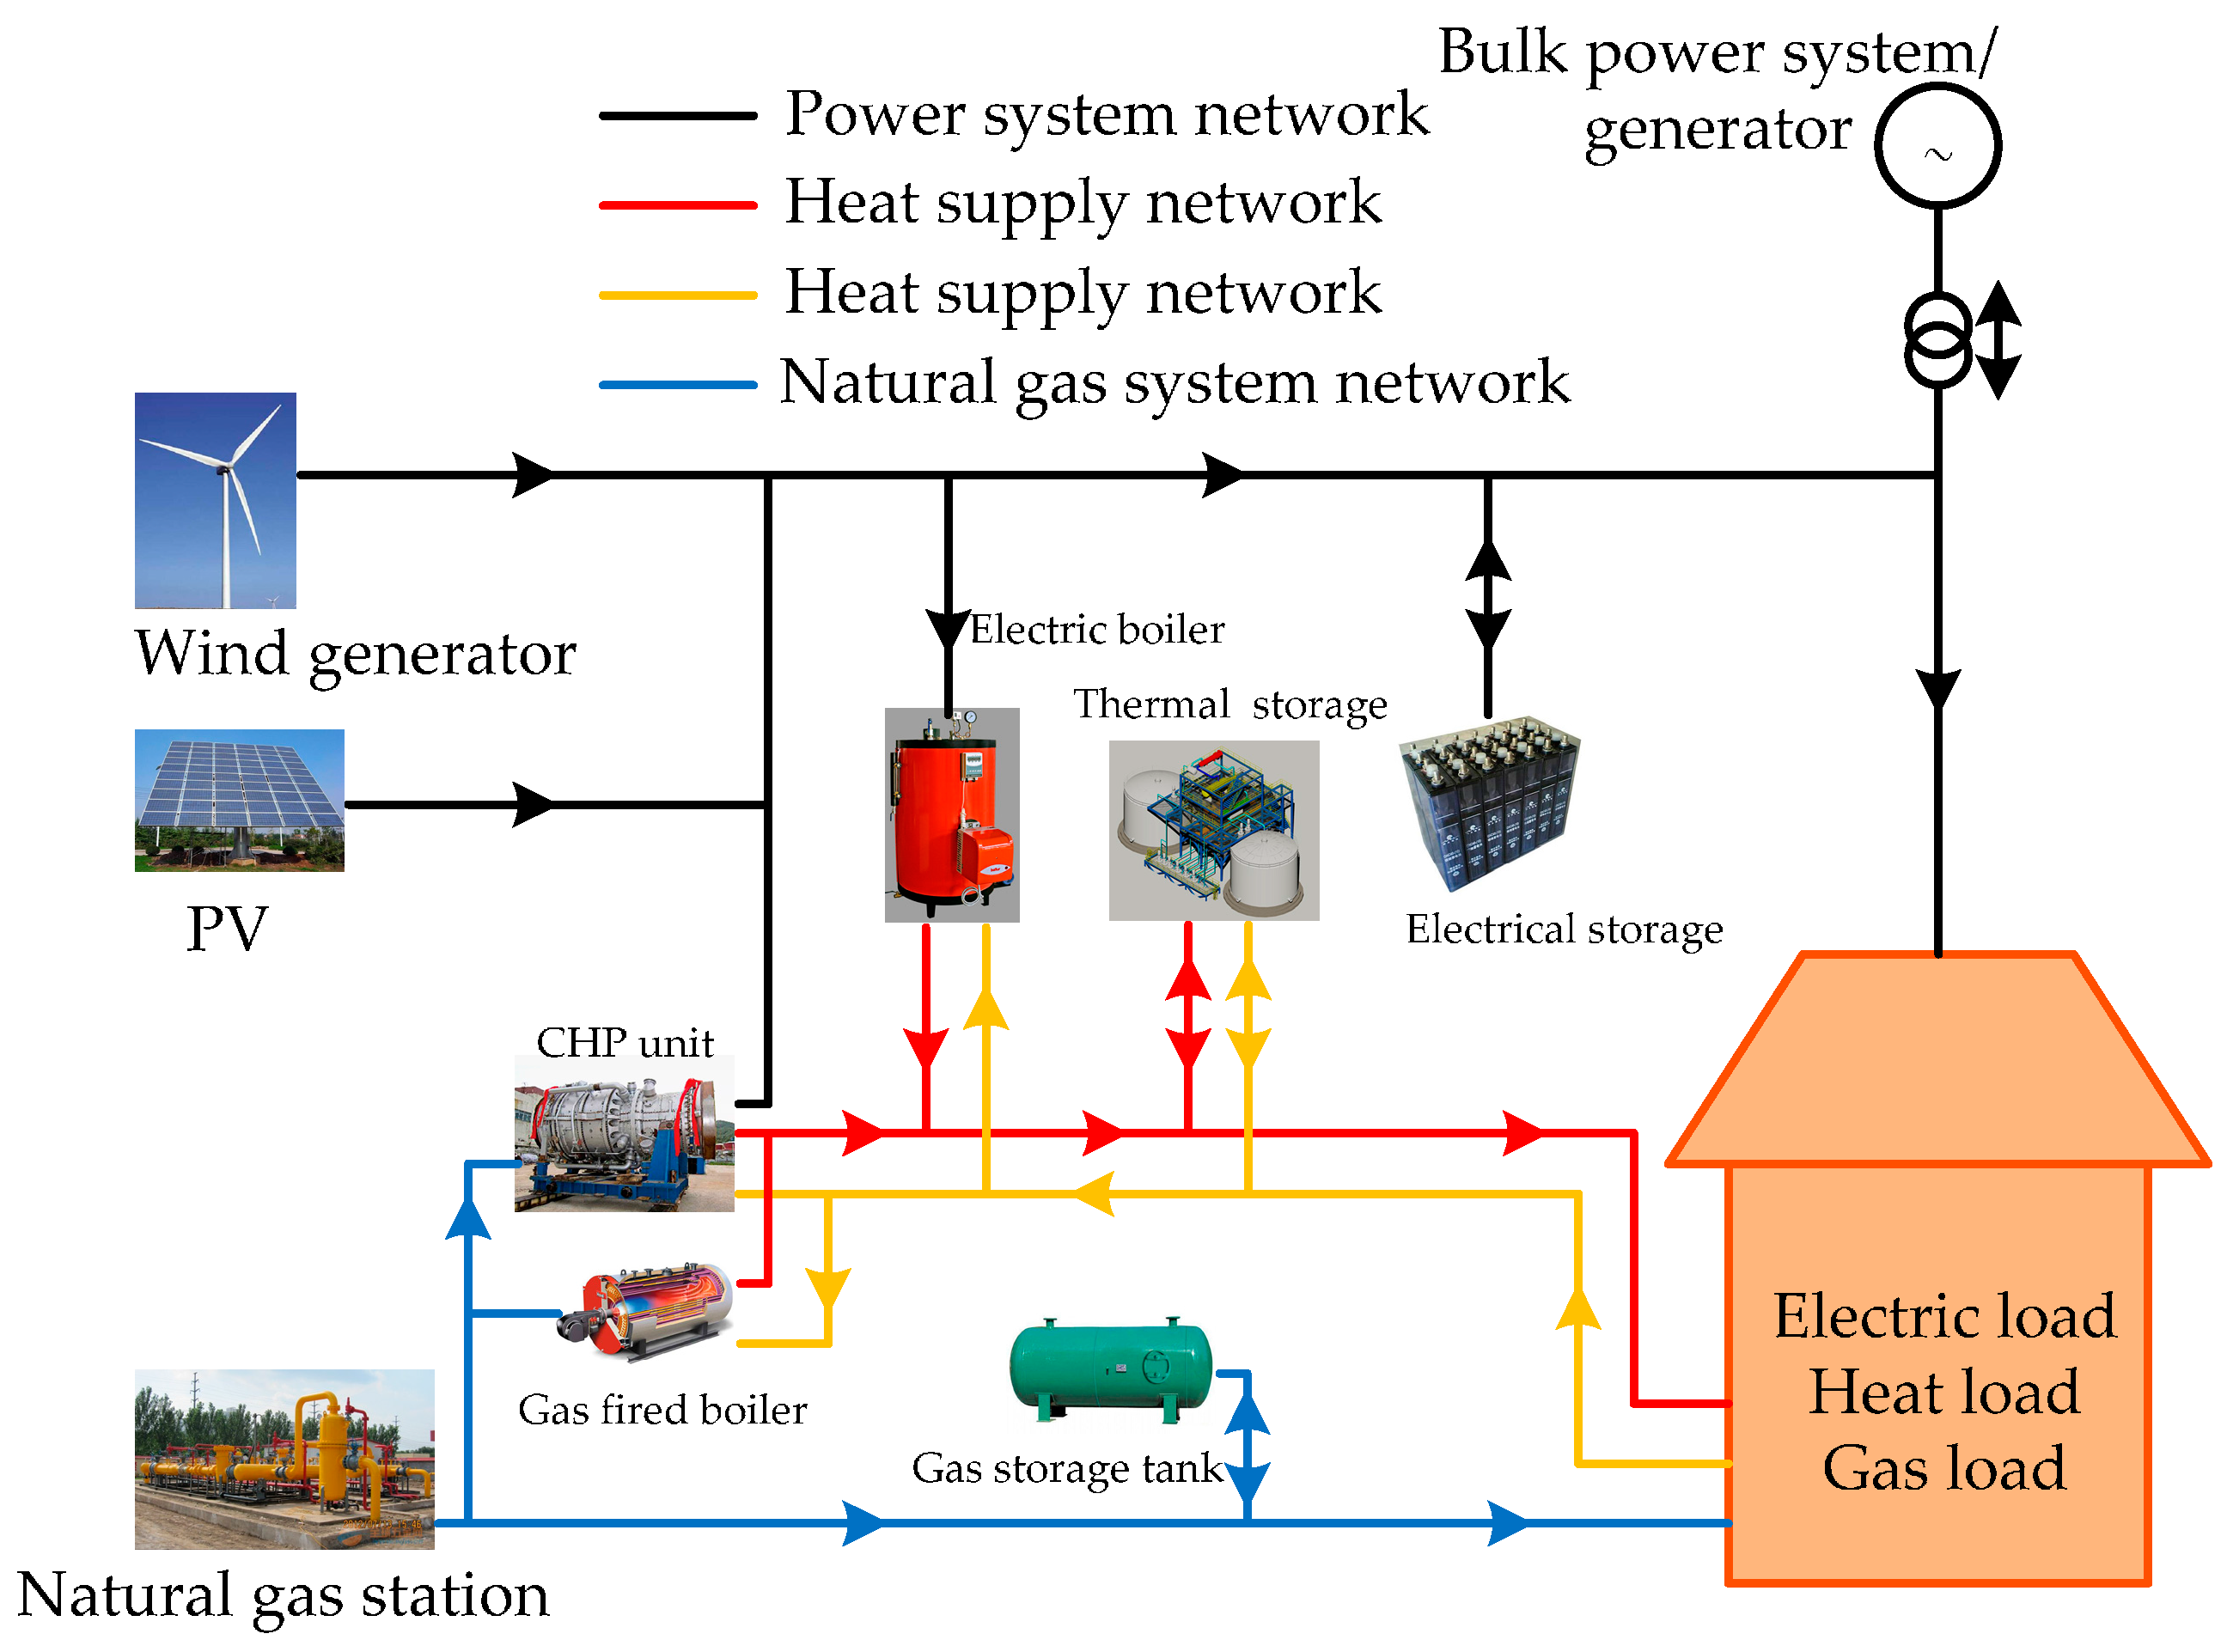
The suitability of the proposed approach for conducting steady-state GEF studies was tested on a system network located in the Daxing District, Beijing, China as the ESI demonstration project of Goldwind Techology Co. Ltd. The different energy systems were coupled via two CHP units (in
Figure 5). EBi, HBi and GBi served as the nodes of the power, thermal, and gas systems, respectively. A gas compressor was installed in the gas subsystem due to the heavy gas load in node GB6 to ensure pressure and gas supply. For line constants of the ESI, refer to
Appendix A.
4.1. Simulation of Natural Gas Subsystems
To further verify the efficiency of the proposed gas compressor equivalent approach: First, the natural gas system compressor was regarded as the research object, and it was assumed that the load capacity of GB5 and GB6 were 1800 m
3/h and 2000 m
3/h, respectively. We compared the simulation results of our proposed method in
Section 2.3, and the method in Reference [
19] under the condition that the compressor outlet pressure was known, and the simulation times were 0.0030 s and 0.0055 s, respectively. The simulation result of the flow through the compressor was 3258.8 m
3/h. In addition, the case in Reference [
19] included 22 nodes in the natural gas system with compressor to test, and the simulation times were 0.0062 s and 0.0157 s, respectively. The method proposed in this paper is obviously accurate and fast. The compressor of the natural gas subsystem in
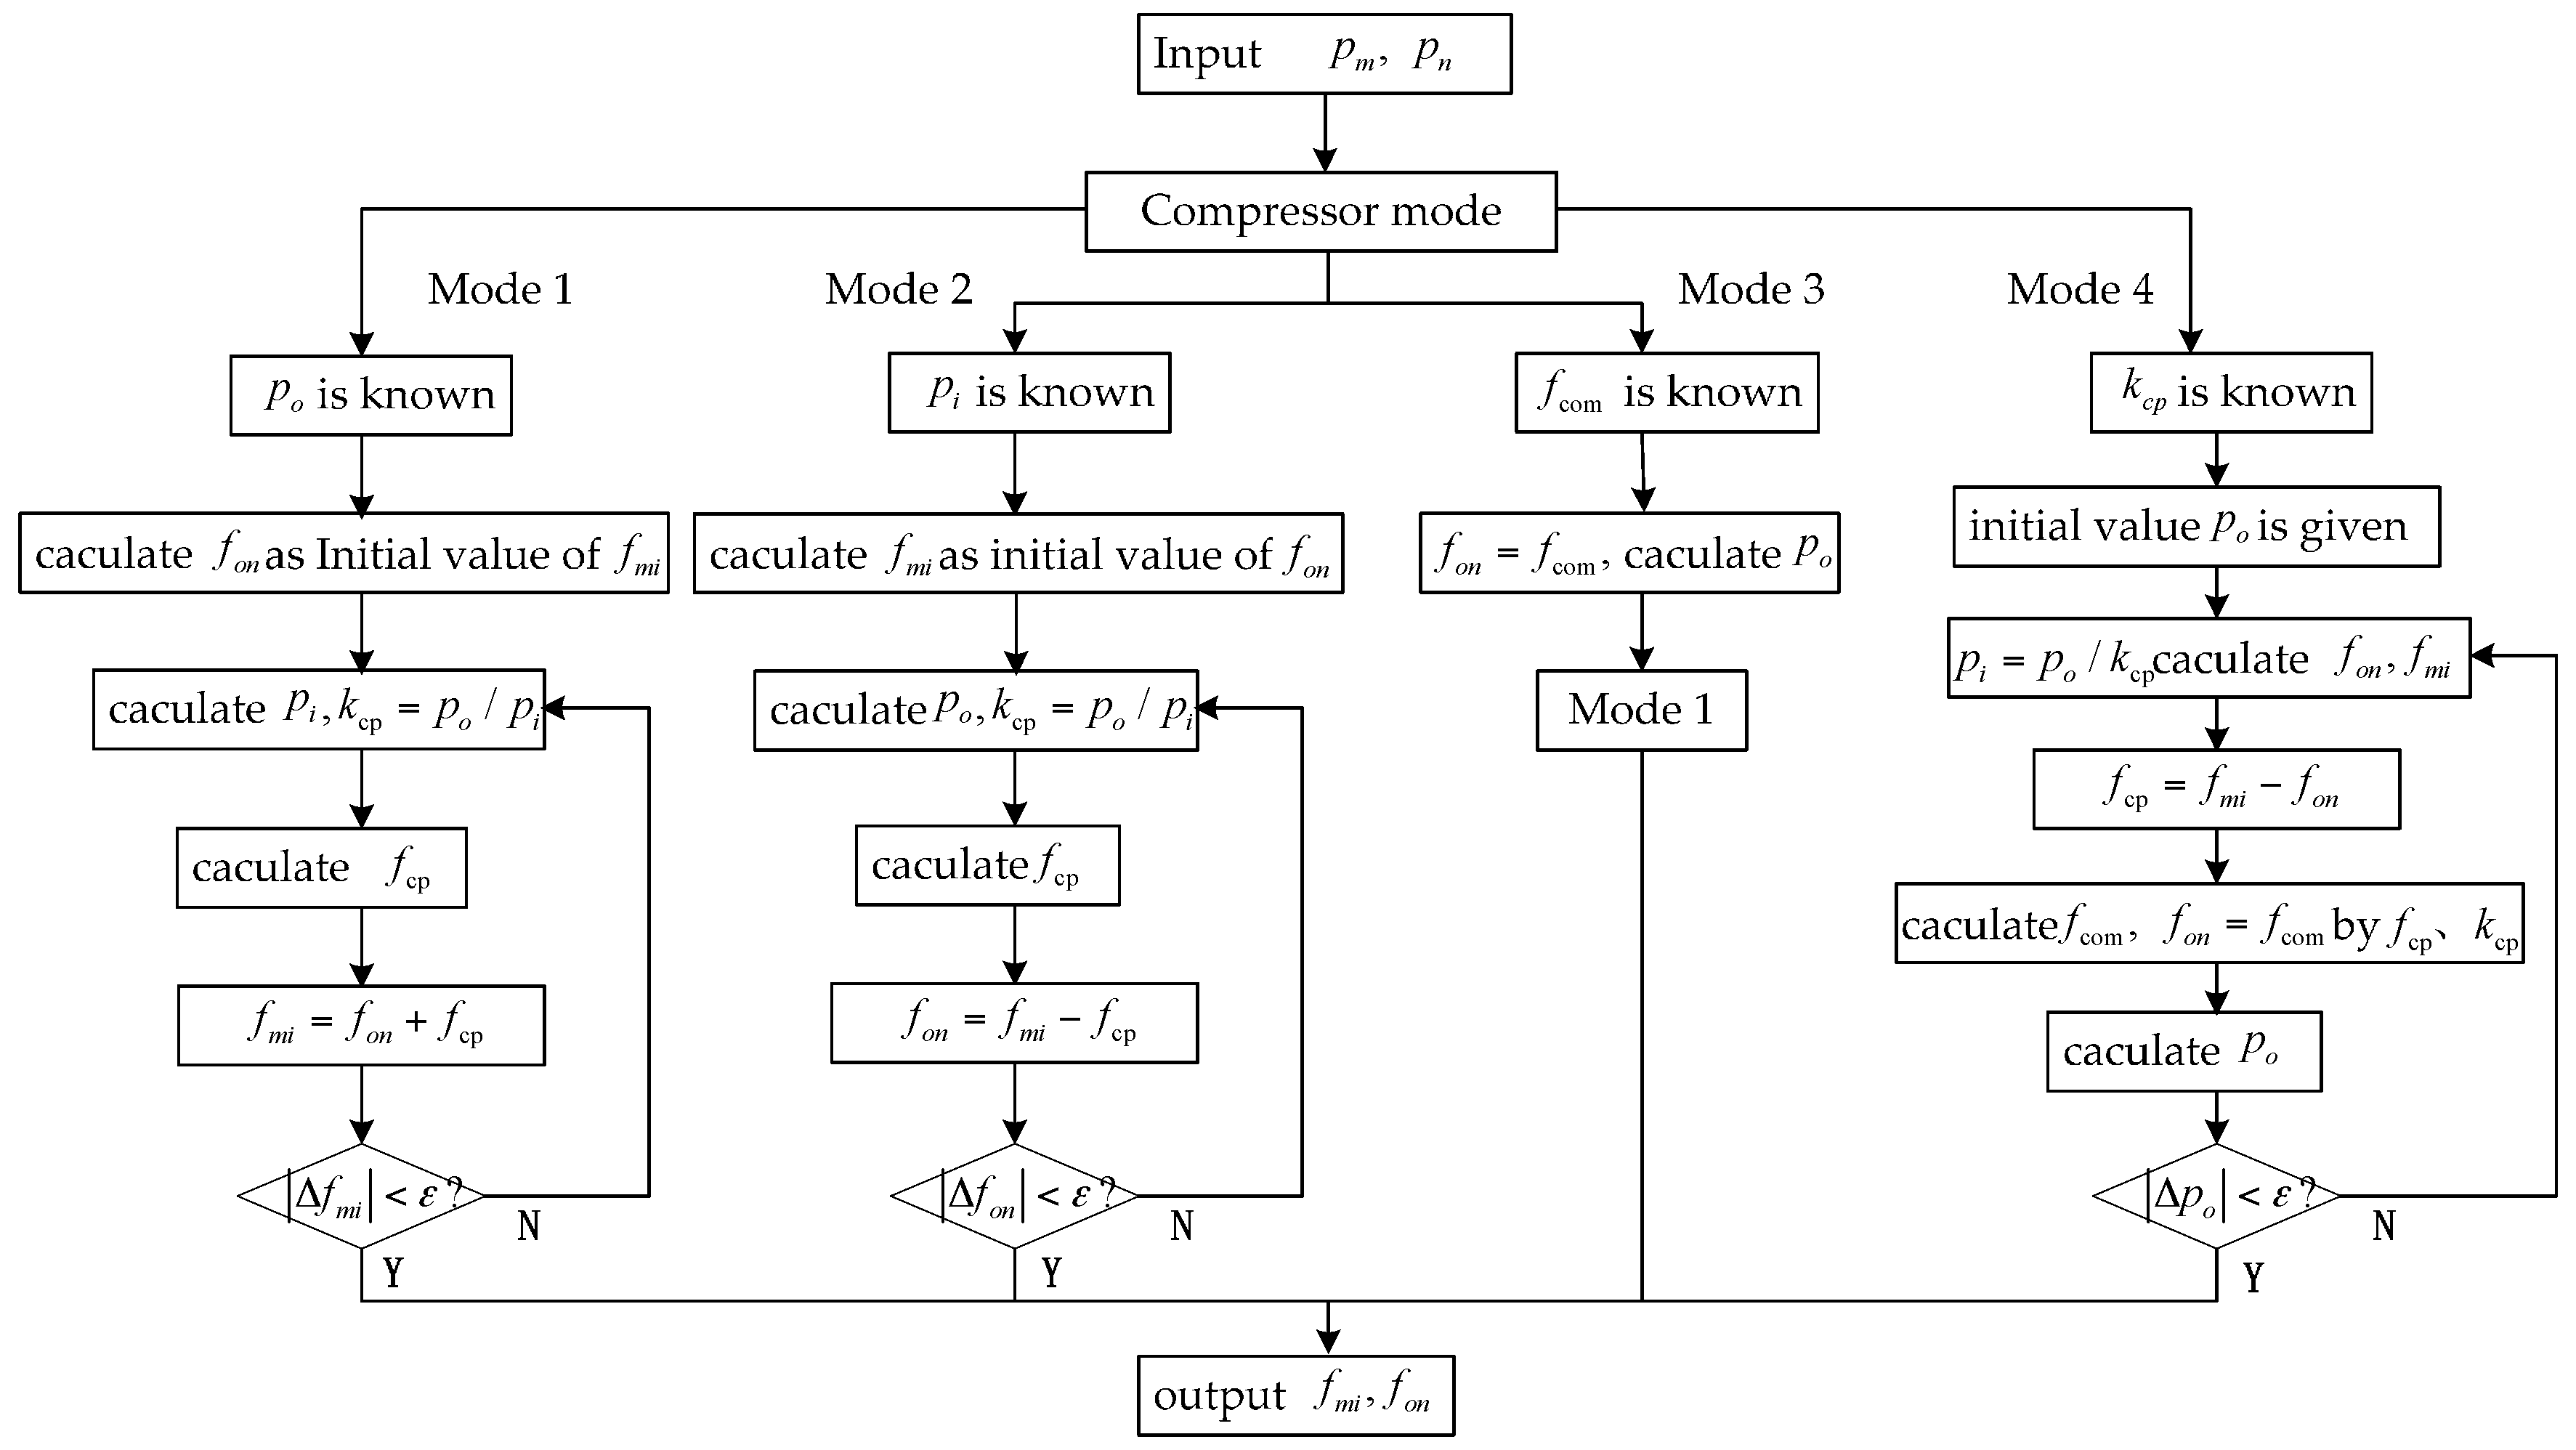
Figure 5 was simulated in four modes. The results are shown in
Table 3.
4.2. Calculation Results Analysis of ESI in Two Scenarios
• Scenario 1
When the ESI power system operates in grid connected mode, node EB13 is connected to the bulk power grid as the slack node. EB11 and EB2 are the PV nodes, the CHP1 unit works in FEL mode, the CHP2 unit works in FTL mode, and HB13 is the thermal system slack node.
• Scenario 2
When the ESI power system operates in island mode, the EB13 node is connected to a wind generator with a known active power and voltage amplitude. The working mode of CHP1 and CHP2 is the same as in Scenario 1, and EB11 is the slack node of the power system.
The results obtained for all cases are reported in
Table 4,
Table 5,
Table 6 and
Table 7. The electrical, thermal power and natural gas consumption of CHP units are demonstrated in
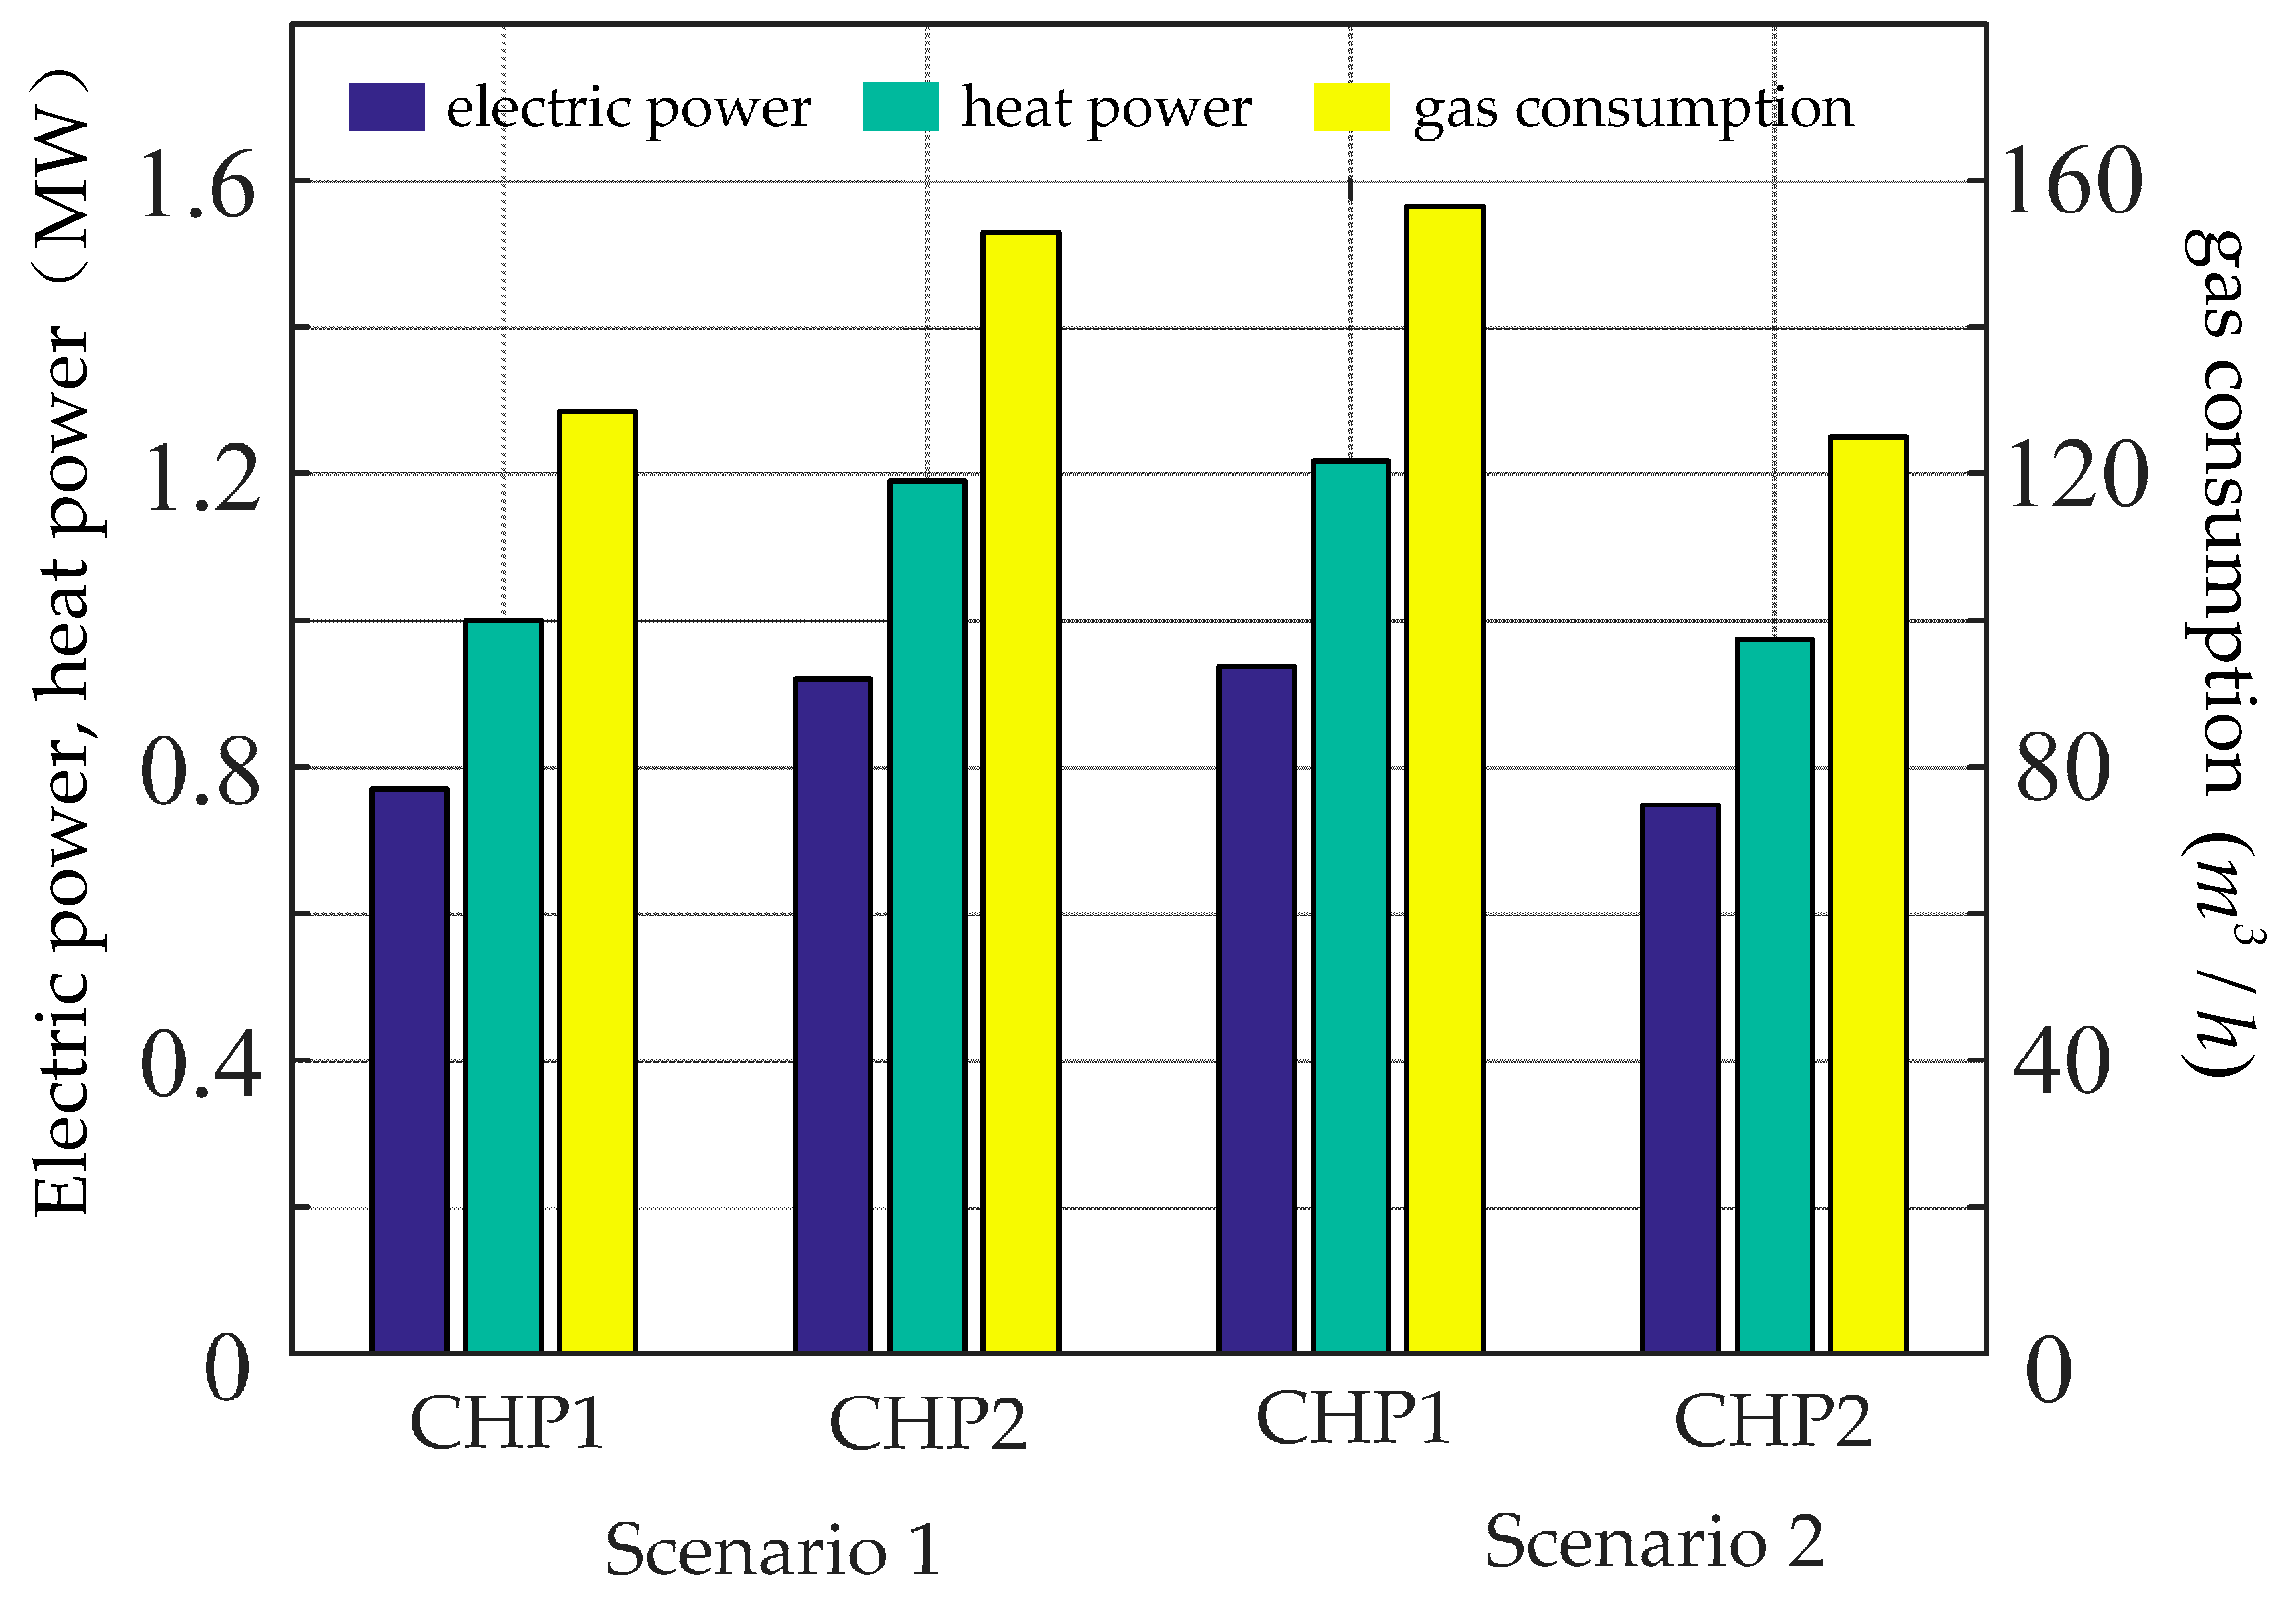
Figure 6. Conclusions can be drawn from the simulation results from Scenarios 1 and 2. In the power system, the amplitude of node voltage varied from 0.94–1.06 p.u. The equilibrium point obtained for each case was located within the safety zone of operation, whose voltage limits were not violated. Node EB10, which has a heavy load, is far away from the power source node, so the node voltage is relatively lower than the others. In the heat system, due to the presence of two heat sources, the minimum temperature of the node occurs at the middle position of the heat system, which is in node HB7. In the gas system, the compressor enables each node to reach the supply and demand balance based on pressure guarantee. In these two scenarios, the compression ratio of gas compressor were 1.2938 and 1.294, respectively, which can be calculated by Equation (12). Although the electrical, thermal and gas load of the two scenarios had no change (on account of the electrical power of the slack nodes in the power system affecting the heat source power in the thermal system in Scenario 2), the two sets of CHP electrical, thermal power and natural gas consumption were changed at the same time.
4.3. Convergence Analysis
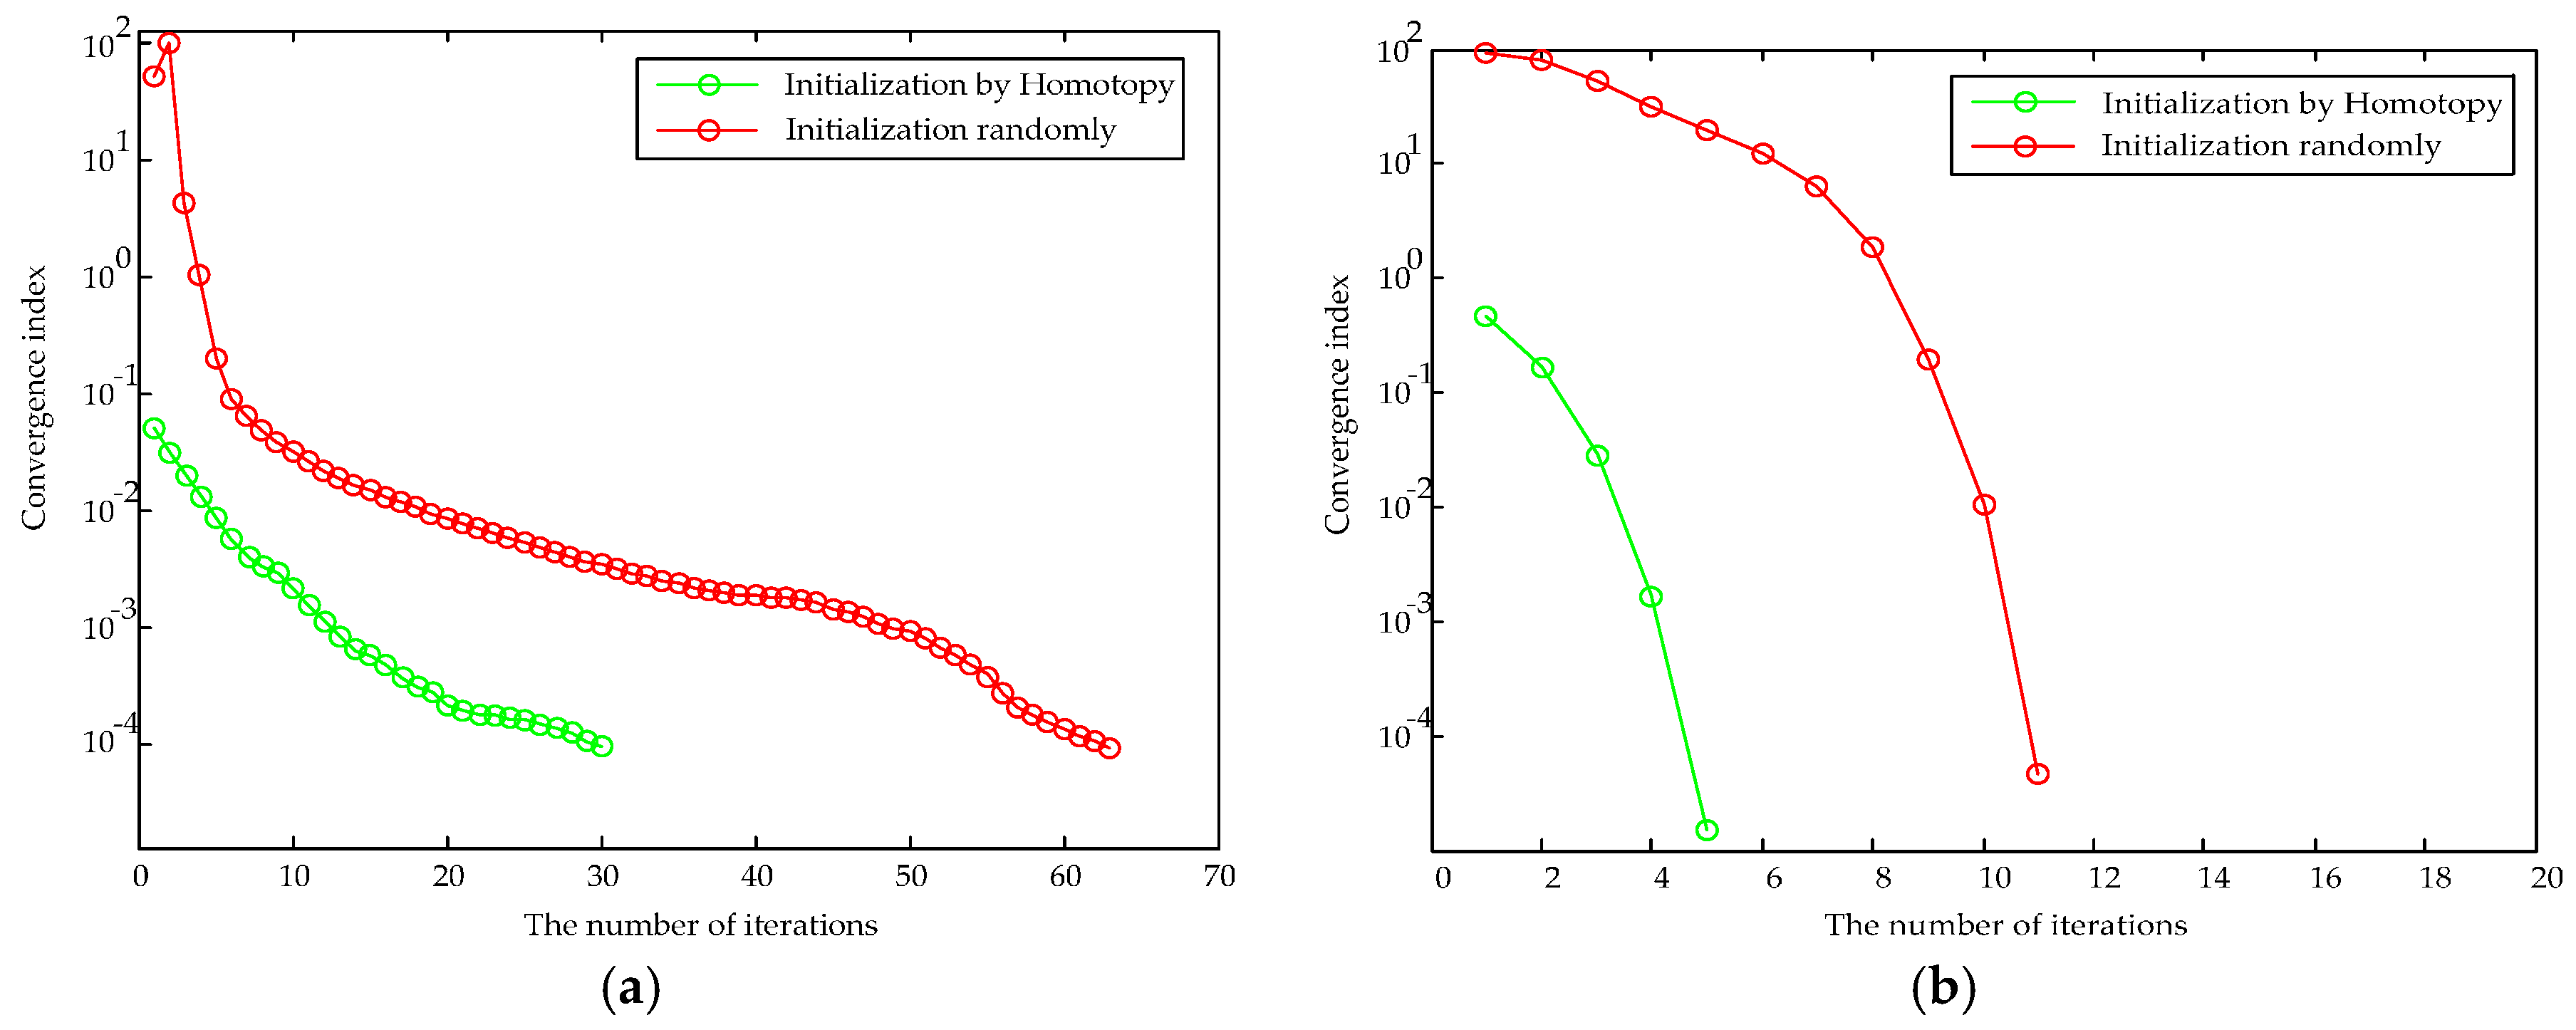
For the sake of testing and verifying the convergence of the GEF calculation approach, the mean absolute value of Δx was selected as the convergence index. We compared the hybrid method with the Newton-Raphson method to analyze the GEF under two scenarios.
The GEF calculated by the Newton-Raphson, which was initiated randomly, needs 12 times and 64 times to converge to the iterative solution in these two scenarios. However, the proposed method whose state variables were initialized by the homotopy algorithm as per the guidelines given in
Section 3.2 only took 5 times and 30 times to converge to the equilibrium point which meets the mismatch tolerance, respectively. The convergence curve of each algorithm in the two scenarios is presented in
Figure 7.
In contrast,
Figure 7 shows that the iterative number calculated by either algorithm to achieve convergence under grid connected mode was far less than that of island mode. When the power system of the ESI operates in island mode, the thermal power of the slack node in the heat system affects the related electrical nodal injection power and the related gas nodal load. Similarly, the electrical power of the slack node in the power system influences its relevant nodal injection power in the heat system and the nodal load in the gas system. Therefore, the state values of the relevant nodes in the GEF model change after each iteration in island mode, which makes the convergence rate slow and the number of iteration increases.
4.4. Interaction Analysis of ESI
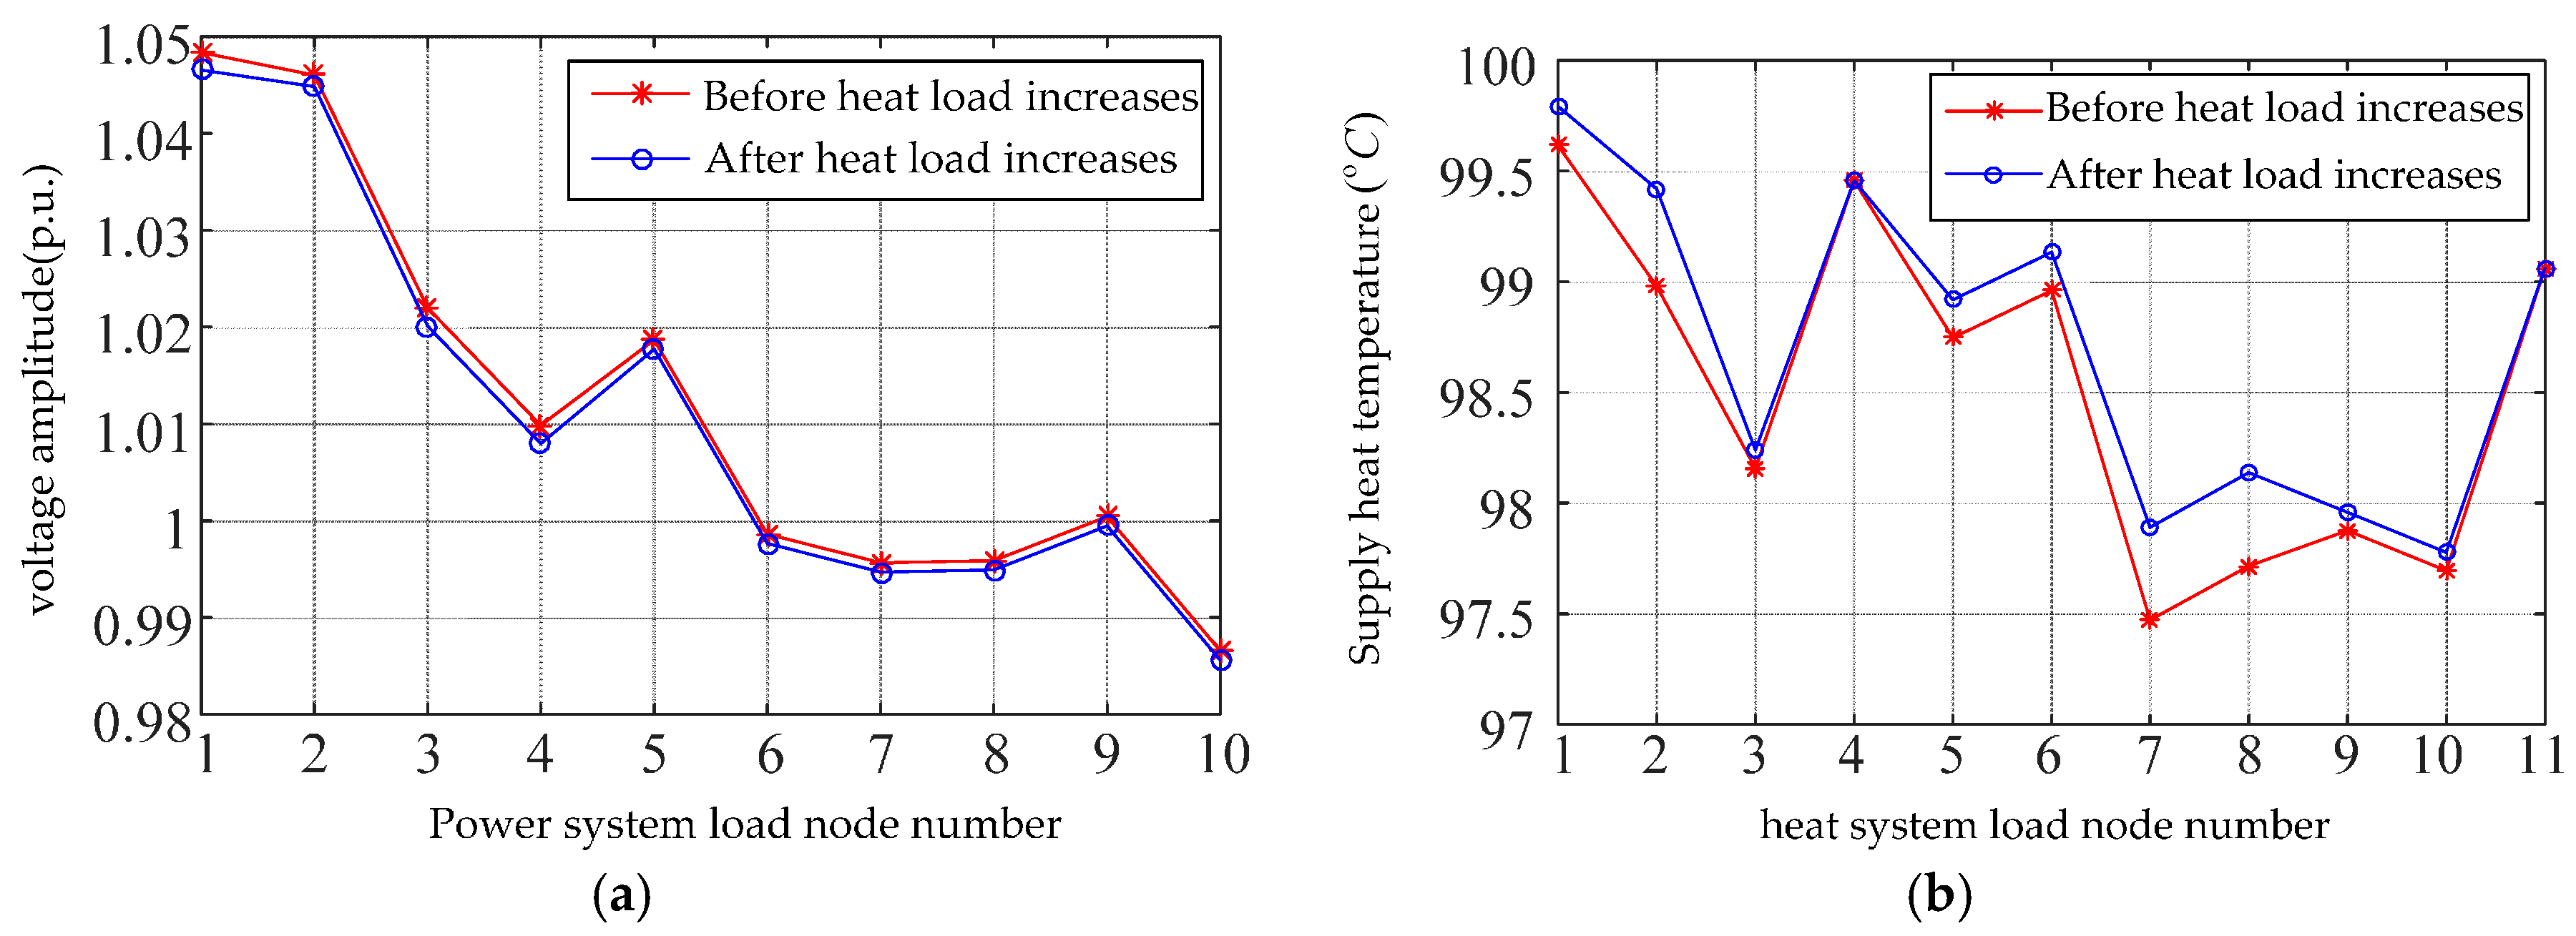
To analyze the interactive characteristics of ESI, in Scenario 2, the heat load at node HB1 and node HB2 was increased to 0.6 MW and 0.4 MW, respectively. The proposed method of GEF was applied to analyze the change of ESI state, which had bidirectional interaction between the electrical and thermal systems in this scenario.
Figure 8a,b demonstrate the change of supply temperature and bus voltage at each node under the condition of load variation in the heat system.
Due to the energy mutual interaction between the power and thermal systems in ESI, it is difficult to obtain the interdependency state of ESI without the proposed approach to analyze the GEF. In
Figure 8a,b, we can see that as the heat load increased, the state of the power and heat systems changed simultaneously. In the power system, the nodal voltage, which was adjacent to EB12, decreased slightly. In the heat system, due to the change of hot water flow distribution, the heat temperature of node HB2, HB7 and HB8 rose, with the rising value reaching approximately 0.5 °C.
