Article

Systematic Effectiveness Assessment Methodology for Fault Current Indicators Deployed in Distribution Systems

1
Departmental of Electrical Engineering, National Sun Yat-Sen University, Kaohsiung 80424, Taiwan
2
Green Energy and Environment Research Laboratories, Industrial Technology Research Institute, Hsinchu Country 31057, Taiwan
*
Author to whom correspondence should be addressed.
Energies 2018, 11(10), 2582; https://doi.org/10.3390/en11102582
Submission received: 31 August 2018 / Revised: 17 September 2018 / Accepted: 26 September 2018 / Published: 27 September 2018
(This article belongs to the Special Issue Fault Diagnosis on MV and HV Transmission Lines)

Abstract

:
Fault Current Indicators (FCIs) with communication interfaces have been widely used in distribution systems to reduce fault-finding time. The effectiveness of a Fault Management System (FMS) composed of FCIs greatly depends on the performance of the communication network deployed by the FCIs and the failure rates of distribution systems. The conventional techniques only focus on the issues of optimal number and location of FCIs or communication network deployment individually; therefore, the effectiveness of an FMS cannot be assessed realistically. A systematic effectiveness assessment methodology for FMS considering the performance of the communication network deployed by the FCIs and the failure rates of distribution systems is vital and is investigated in this paper. A communication evaluation platform is designed in this paper and used to acquire the field measurements of communication parameters. The communication parameters, especially the Packet Success Rate (PSR), between two adjacent FCIs are measured, and the Probability Density Function (PDF) of the PSR can be built accordingly. The effectiveness of the FMS is then assessed by stochastic analysis considering the failure rates of the distribution system and PSR PDFs between two adjacent FCIs. Due to the characteristics of easy installation, maintenance, longer battery life, lower cost, and so on of ZigBee, the ZigBee-based FCI is mainly discussed in this paper. In order to efficiently find the communication route when a fault occurs, a fast communication route tracking method is also proposed in this paper and its feasibility is demonstrated in an actual distribution system. Experimental and simulation results demonstrate the validity of the proposed systematic effectiveness assessment methodology for an FMS composed of FCIs. The proposed assessment methodology can more realistically react to the actual conditions of the FMS and therefore save on installation time and costs.

1. Introduction

The smart operation and control schemes in an Advanced Distribution Automation System (ADAS) generally include optimal volt/var control; contingency analysis; a Fault Management System (FMS); Fault Detection, Isolation, and Restoration (FDIR); etc. Without an FMS, the fault location detection and identification will mostly depend on customers’ complaints of power outages over the phone and the dispatcher’s personal experiences. The maintainers must go to the probable fault locations for field inspection. If the fault location cannot be determined, the fault chasing scheme is commonly used to find the fault location. However, this procedure consumes time and labor, and multiple fault chasing schemes are likely to shorten equipment life. Therefore, the most important functions to reduce outage duration and improve service reliability for ADASs are provided by FMSs and FDIR [1,2,3]. For fault indication and location, different devices including Fault Current Indicators (FCIs), circuit breakers, feeder terminal units, etc., have been designed and are widely used in FMSs. Due to the lower cost, FCIs mounted on line sections have been widely installed in distribution systems to detect and indicate a short-circuit current. Generally, FCIs can reduce operating costs and service interruptions by identifying the fault location and accelerating power restoration to customers. Moreover, due to the decrease of hazardous fault chasing, equipment damage can be reduced, and operational safety can be effectively enhanced. The design and implementation of conventional FCIs can be found in [3,4,5].
Although the conventional FCIs are useful, sectionalizing the distribution system to determine the fault location in an actual distribution system is still a time-consuming procedure after a fault occurs, especially when the FCIs have not been cleaned periodically and have become muddied. Therefore, an FCI with communication interfaces has been extensively proposed to overcome the shortcomings of conventional FCIs [5,6,7,8,9,10]. Among those published papers, Reference [9] proposed a multilevel FCI with a plurality of reed switches used to detect different current levels and to locate faults for distribution systems with distributed generators. A new solution for the phase and earth fault directional detection used in fault passage indicators was represented in [10]. Many publications have also focused on the issues of optimal number and location of FCIs [11,12,13,14,15,16] to improve service reliability and/or reduce customer interruption cost. An automatic and fast faulted line section location method for distribution systems with distributed generators based on FCIs was proposed in [17]. Reference [18] analyzed the feedback of FCI performance based on data collected from the pilot projects.
The effectiveness of an FMS composed of FCIs greatly depends on the performance of the communication network deployed by the FCIs and the failure rates of distribution systems. The conventional techniques only focus on the issues of optimal number and location of FCIs [11,12,13,14,15,16] or communication network deployment [19,20,21,22,23,24,25,26,27] individually; therefore, the effectiveness of an FMS cannot be assessed realistically. A systematic effectiveness assessment methodology for FMSs considering the performance of the communication network deployed by the FCIs and the failure rates of the distribution systems is vital and is investigated in this paper. A communication evaluation platform is designed in this paper and used to acquire field measurements of communication parameters. The communication parameters, especially the Packet Success Rate (PSR), between two adjacent FCIs can be measured and the Probability Density Function (PDF) of the PSR can be built accordingly. The effectiveness of the FMS can then be assessed by stochastic analysis considering the failure rates of the distribution system and the PSR PDFs between two adjacent FCIs. Due to the characteristics of easy installation and maintenance, automatically formed meshed network, extensibility to several thousand devices, longer battery life, lower cost, etc., of ZigBee communication [19,20,21,22], the ZigBee-based FCI is mainly discussed in this paper. However, the communication evaluation methodology proposed in this paper can be extensively used in other communication peripheries without extra effort. A fast communication route tracking method is also proposed in this paper to efficiently find the communication route when a fault occurs, and its feasibility is demonstrated in an actual distribution system. Experimental and simulation results demonstrate the validity of the proposed systematic effectiveness assessment methodology for FMSs composed of FCIs. The proposed assessment methodology can more realistically react to the actual conditions of the FMS and therefore save on installation time and costs.
The remainder of this paper is organized as follows: Section 2 introduces the basic concepts of FCIs and FMSs. Section 3 provides the main ideas of the proposed systematic effectiveness assessment methodology. The proposed fast communication route tracking method is also derived in Section 3. Experimental and simulation results used to demonstrate the validity of the proposed assessment methodology are shown in Section 4. Finally, Section 5 gives the conclusions of this paper.

2. Basic Concepts of Fault Current Indicators (FCIs) and Fault Management Systems (FMSs)

2.1. Basic Concepts of FCIs

FCIs mounted on buses, underground cables, or overhead lines have been widely installed in distribution systems for fault indication. The fault indication functions and practices are introduced in this section. FCIs usually use reed switches for fault detection [28]. The application of a reed switch for the proposed FCI is illustrated in Figure 1. With the fault current flowing through a conductor, the magnetic field of the conductor will trigger the reed switch and result in the change of a mechanical flag and/or the flash of a Light-Emitting Diode (LED) in the FCI for fault indication.
The hardware architecture of a ZigBee-based FCI as illustrated in Figure 2 can be divided into the ZigBee module, fault-current-detecting module, and Micro-controller Unit (MCU). Two magnetic reed switches, abbreviated as SW1 and SW2, and Interrupt Request (IRQ) in MCU are used to detect abnormal and normal currents, respectively. SW1 and SW2 switches with higher and lower triggering currents such as 1000 A and 12 A, respectively, are commonly used. The operational stages of a ZigBee-based FCI are as follows:
Normal Stage: SW1 will remain OFF (untriggered) and the mounted FCI is in normal stage if the line current of the FCI is smaller than the triggering current of SW1. The status of SW2 can be ignored.
Fault Stage: SW1 will be ON (triggered) when the line current exceeds the triggering current of SW1. The mounted FCI is then in fault stage and the alarm LED is enabled. The ZigBee network constructed by the FCIs in the distribution system will transmit the fault information to the rear-end processing system.
Repair Stage: After a few seconds of fault occurrence, the FCI is in the repair stage. The stage of the mounted FCI will be changed to the normal stage after the fault has been cleared completely or the power is restored.

2.2. Basic Concepts of FMSs

ZigBee is classified as a wireless personal area network for the short-distance communication protocol of IEEE 802.15.4. ZigBee possesses the features of low-cost and low-power-consumption wireless communication, and therefore has been widely used in many power engineering applications such as utility controls, fault monitoring, advanced metering infrastructure, and so on. The ideal transmission distance and the data transmission rate for ZigBee are 100–1200 m and 20–250 kbps, respectively [19,20,21,22]. ZigBee Alliance defines three device types for a ZigBee network, i.e., ZigBee coordinator, ZigBee router, and ZigBee end device. The ZigBee router can forward information received to other ZigBee devices; therefore, the communication distance of the ZigBee network can be effectively extended. To make sure that the ZigBee network can cover the whole distribution system, the placement of ZigBee routers and ZigBee end devices should be planned prudentially. The concept of integrating the ZigBee-based FCIs into construction of an FMS for distribution systems is shown in Figure 3. The FMS is composed of several FCIs and a rear-end processing system. Using Figure 3 as an example, if a fault occurs at the location of “Fault (1)”, the fault current will be detected by FCI2 and FCI3 and these two indicators will then be in “Fault Mode”. FCI2 will transmit “Fault Information (2)” to FCI3, which acts as a ZigBee router in this situation, and then “Fault Information (2)” will be forwarded to the rear-end processing system. FCI3 will also transmit “Fault Information (3)” to the rear-end processing system. The fault location can then be determined in the line section between FCI1 and FCI2. From Figure 3, it can be seen that the communication network constructed for the FMS is very important.

3. Systematic Effectiveness Assessment Methodology

3.1. Communication Evaluation Platform

The deployment guidelines for the ZigBee network can be found in the literature [23,24,25,26,
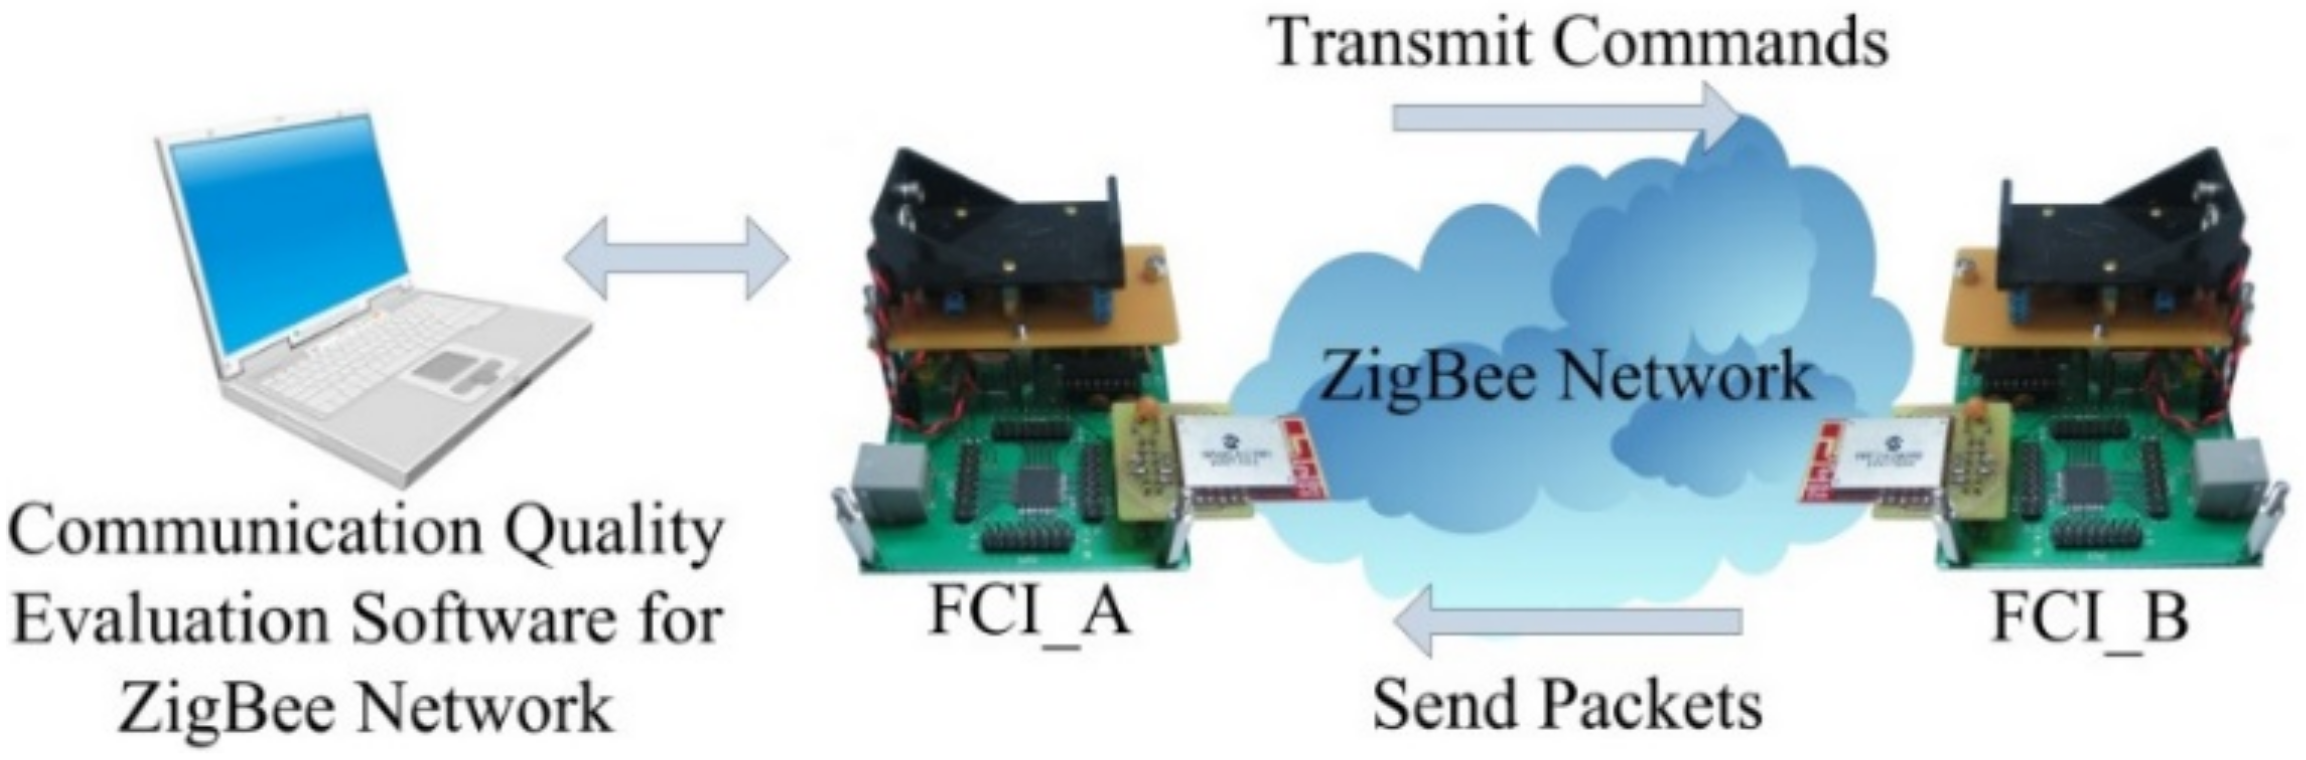
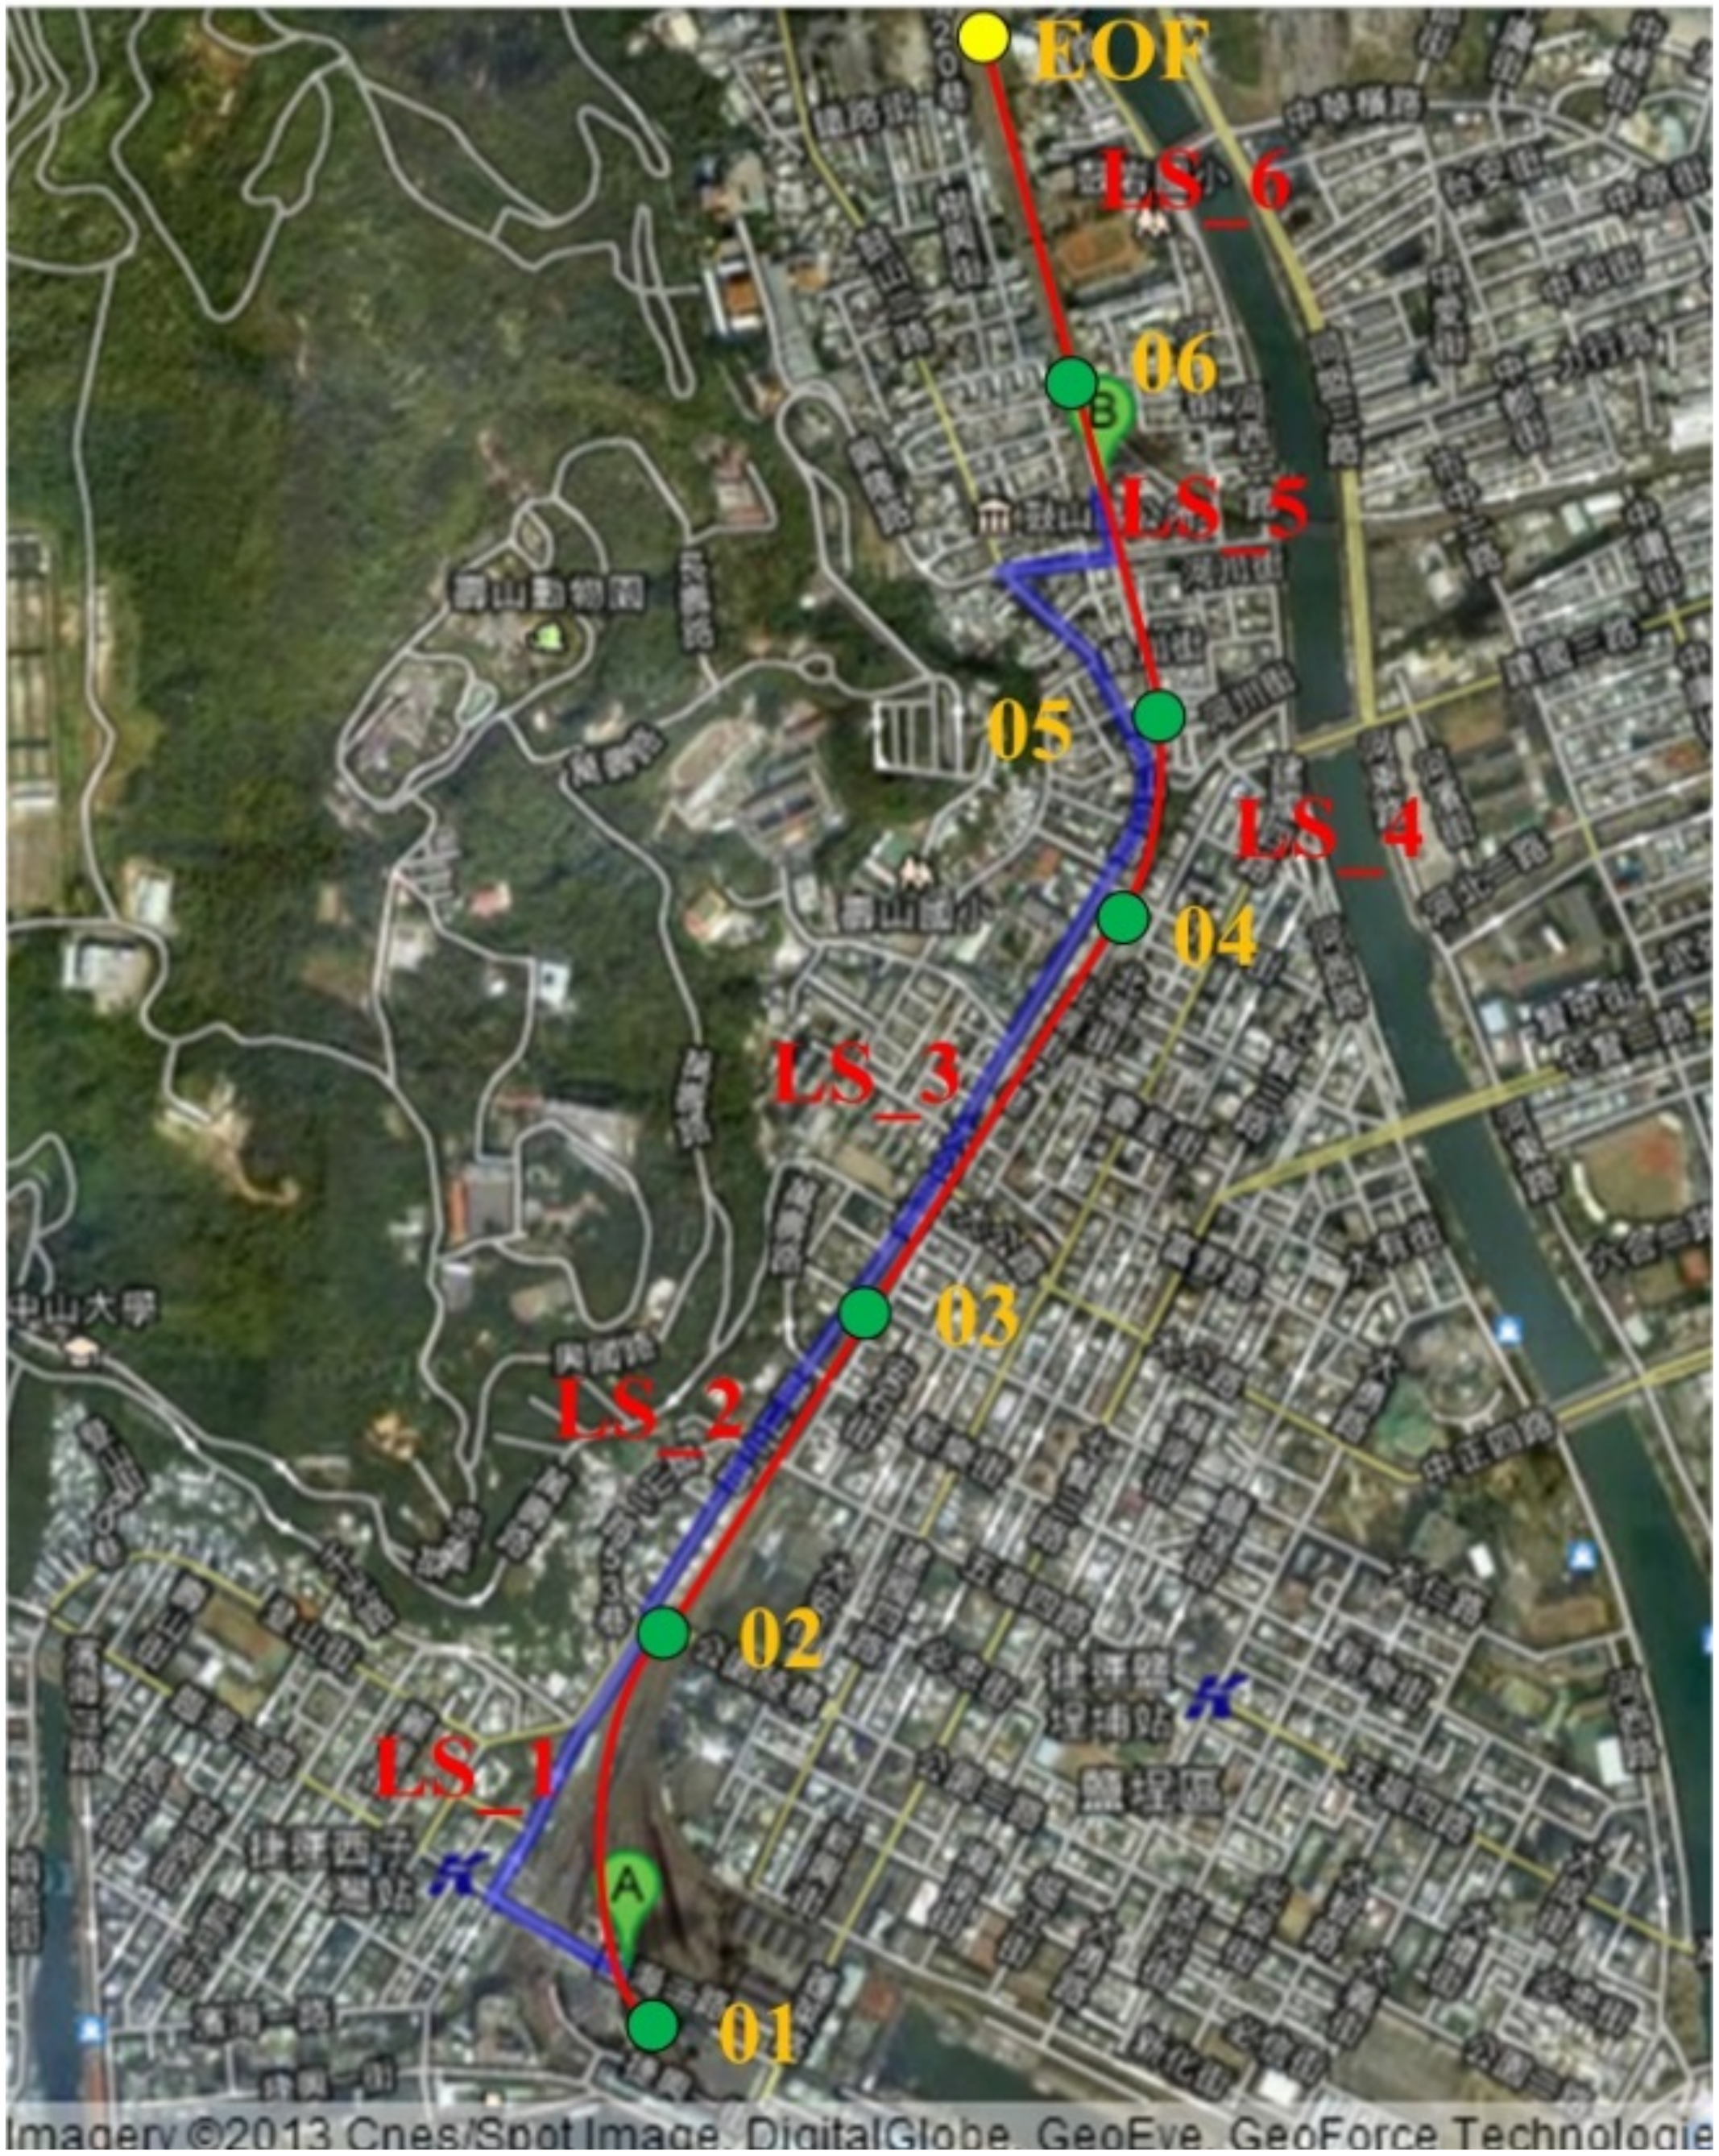
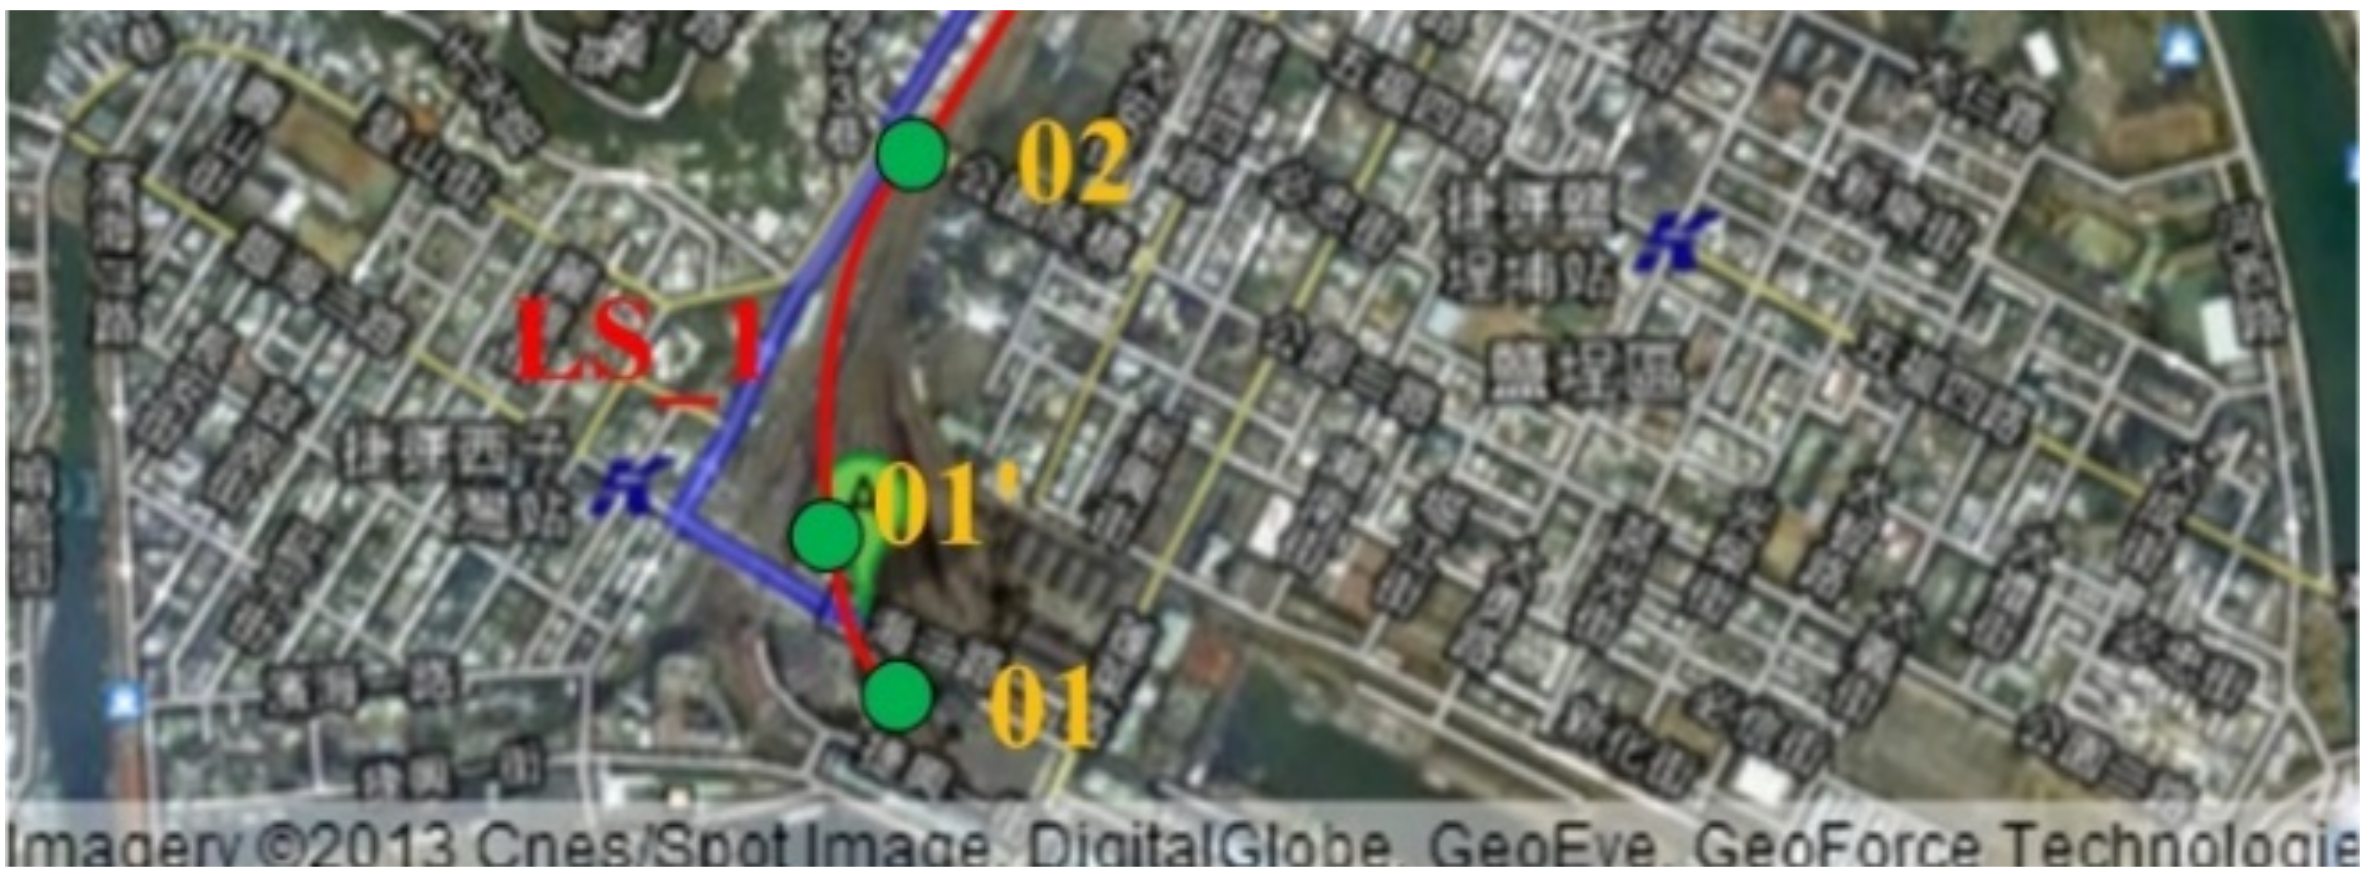
27]; however, the network deployment for actual distribution systems needs further investigation to make sure that the communication performance is acceptable before device installation. A communication evaluation platform using Google Maps to inspect the terrain and possible obstacles for the ZigBee-based FCIs is shown in Figure 4. The proposed platform can select the candidate locations for FCI placement and conduct actual field tests. The communication parameters including Packet Error Rate (PER), Link Quality Index (LQI), Received Signal Strength Indicator (RSSI), etc., can be measured and recorded in the proposed platform for further investigation. The RSSI is the approximately received signal power in the bandwidth of an IEEE 802.15.4 channel. The LQI measures the received energy level and/or signal-to-noise ratio for each received packet. The communication performance can be assessed from the measured communication parameters. 
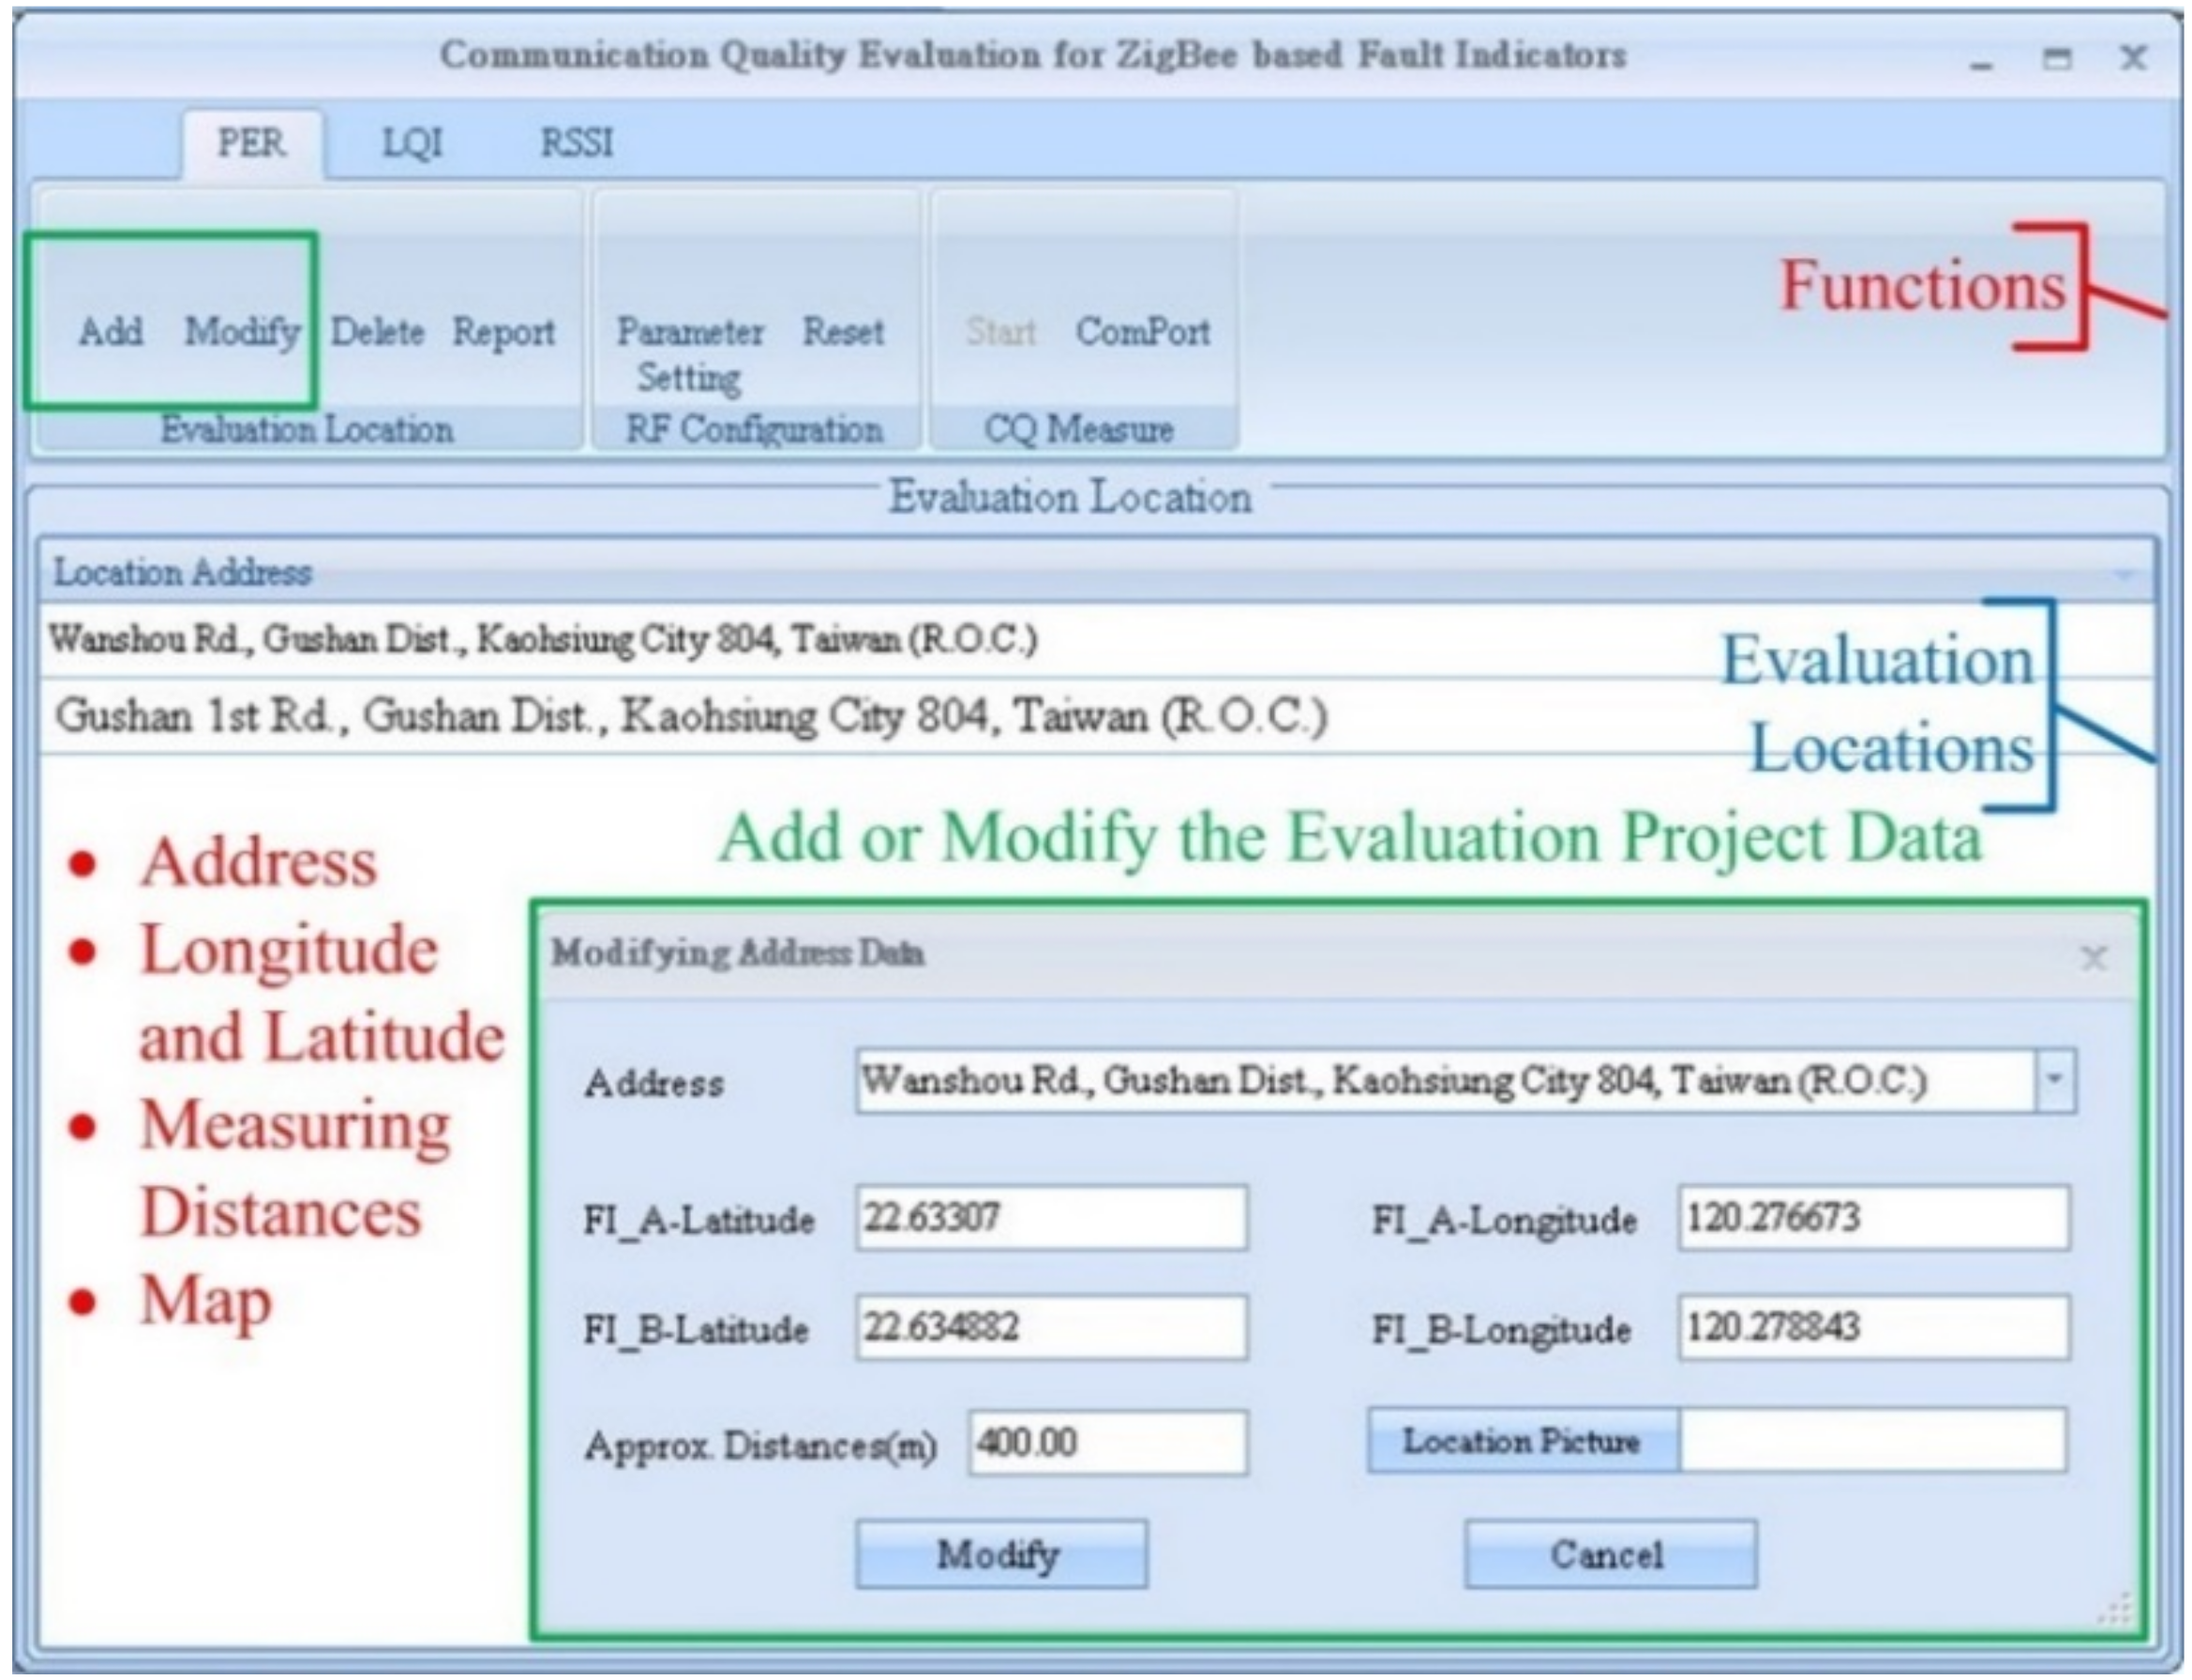
Figure 5 shows the Human–Machine Interface (HMI) of the proposed communication performance evaluation platform.
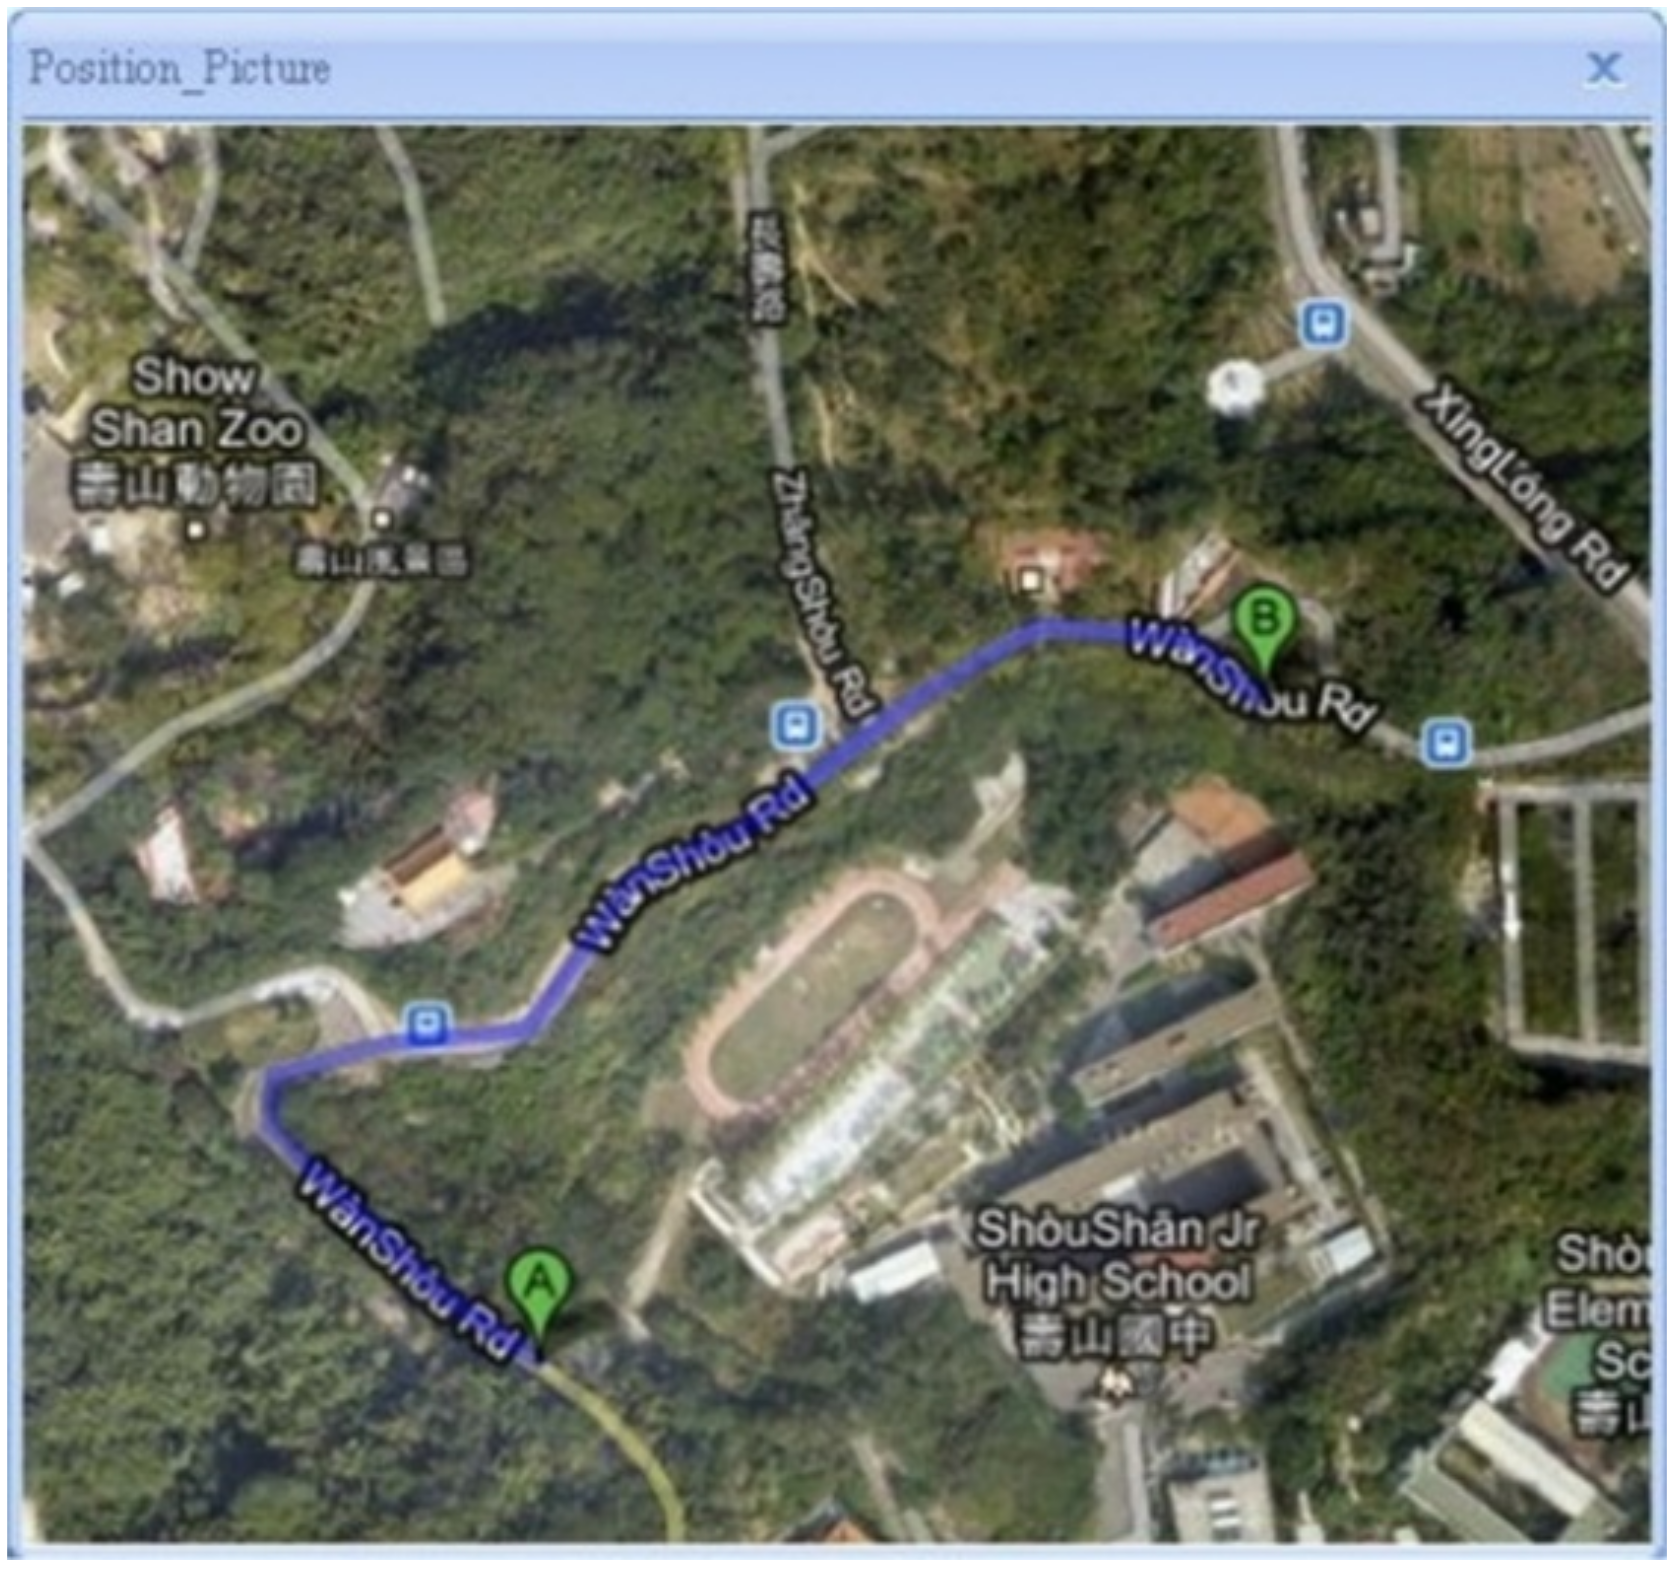
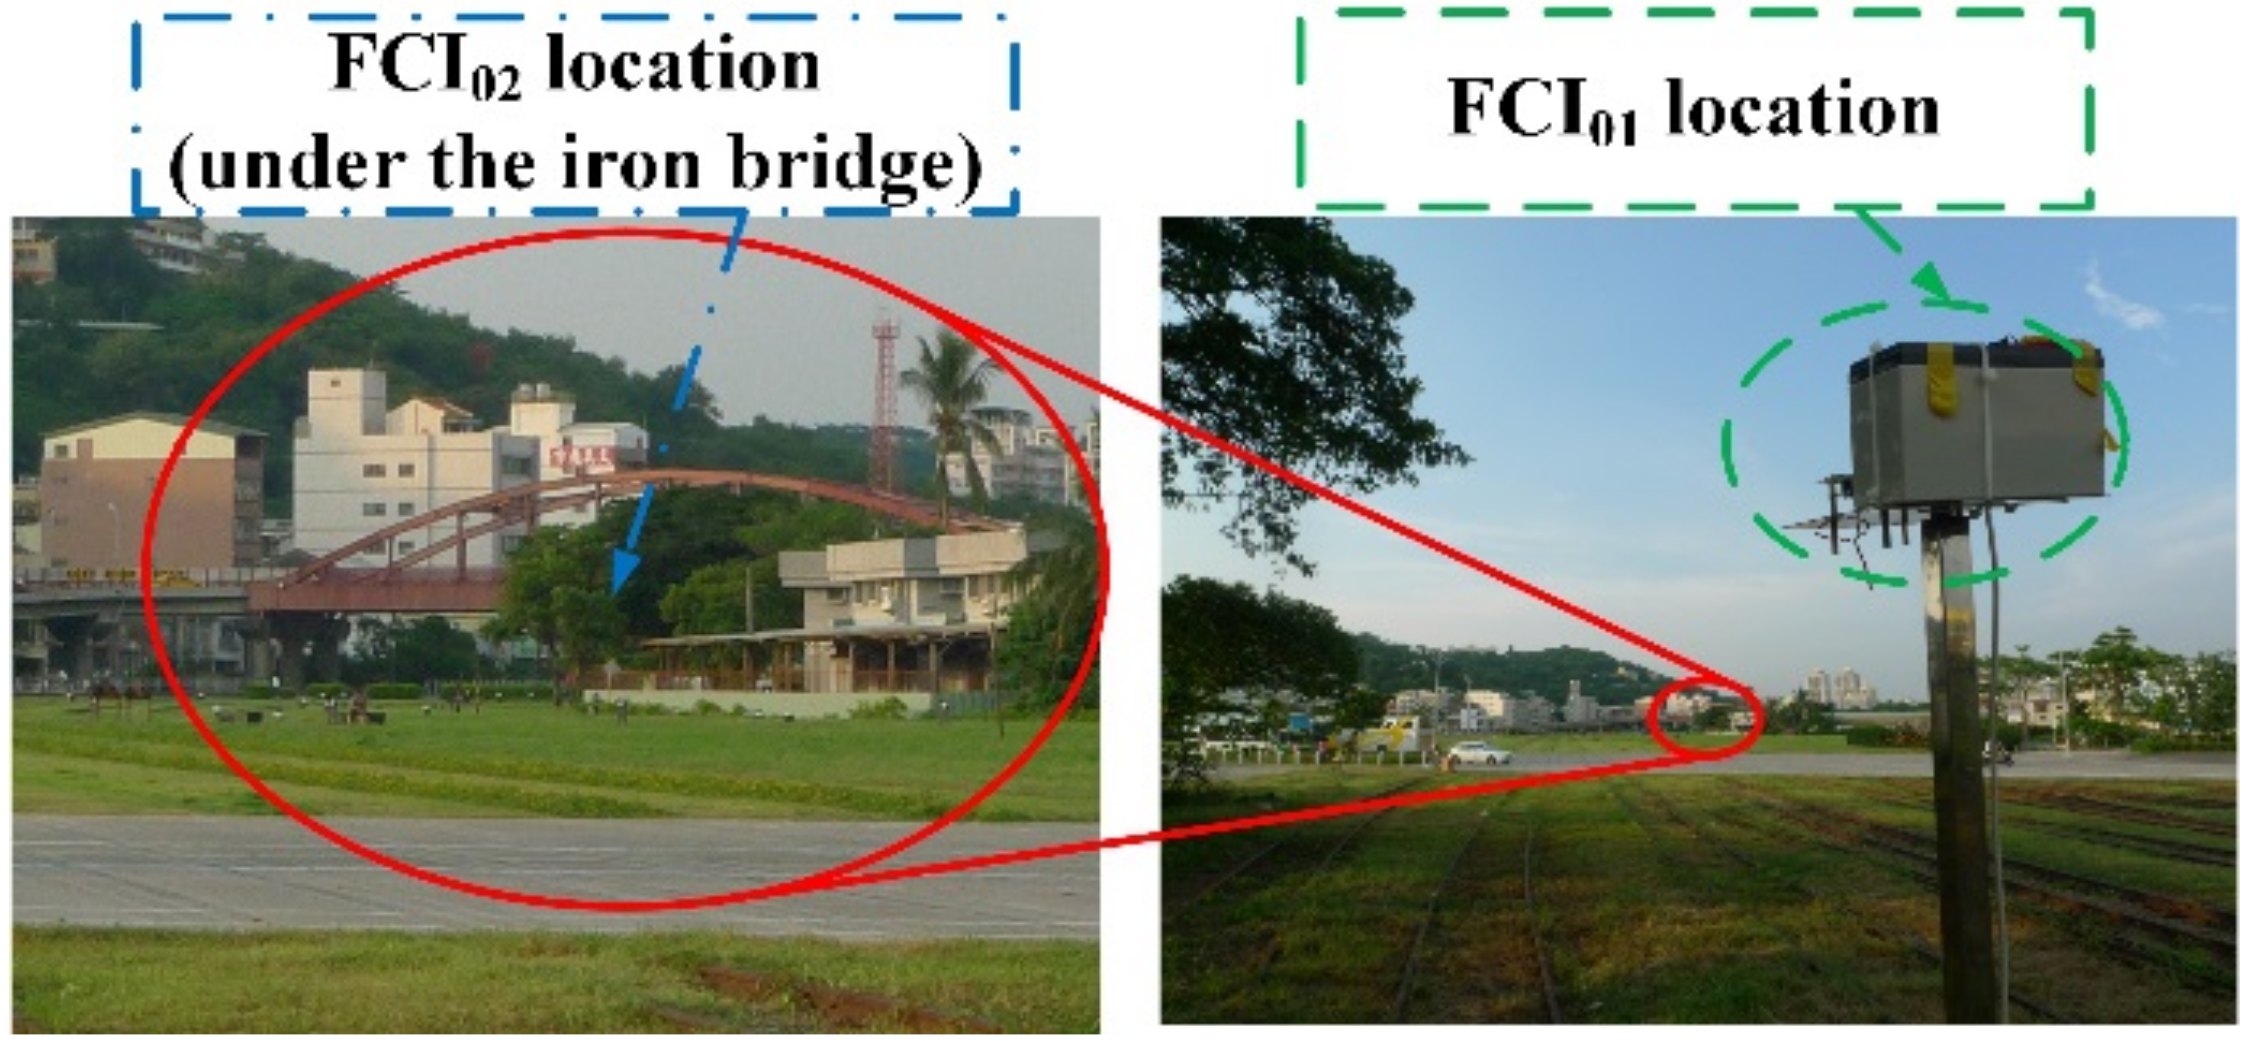
Figure 6 shows the Google Map of the address in 
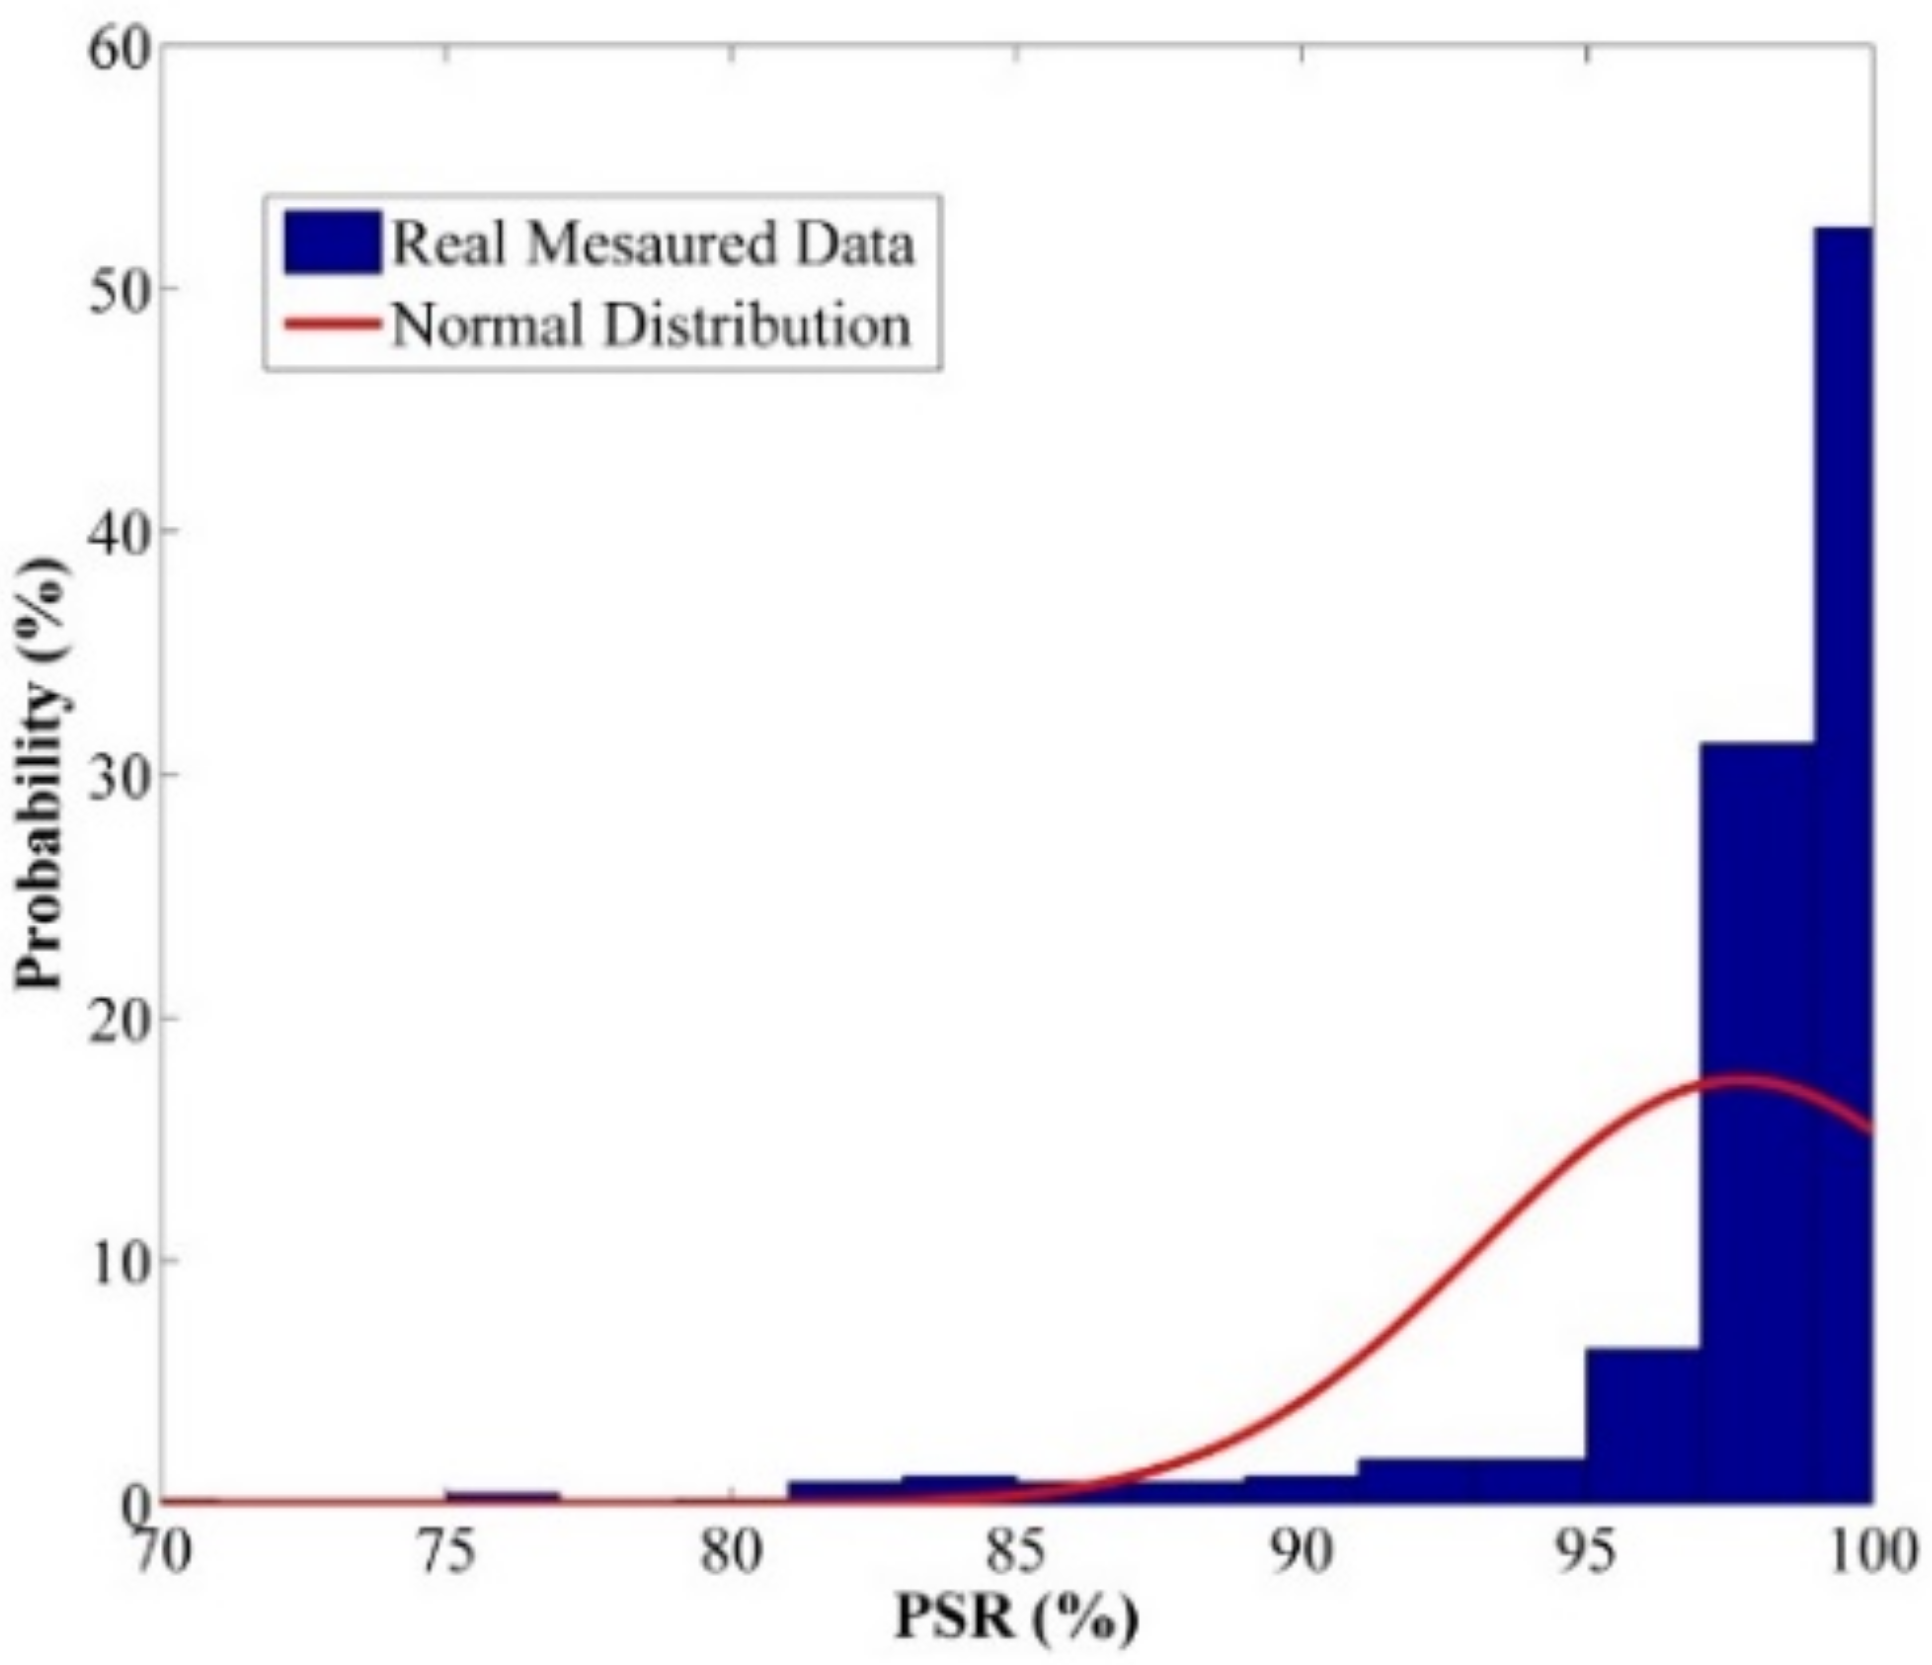
Figure 5 after the “Location Picture” button was pressed. The Google Map street view was used to examine the possible terrain and obstacles and select the candidate locations. The communication parameters including PER, LQI, and RSSI, etc., between these two locations could be measured and recorded after the candidate locations for FCIs were selected. If the communication performance is not acceptable, the locations can be modified, and the field tests can be conducted again until acceptable communication performance between two adjacent FCIs’ locations is achieved. Although PER, LQI, and RSSI can be measured and recorded, only the measured PER is used to evaluate the communication performance of the FMS. PER can be converted to PSR, commonly used to judge whether the signal transmission has succeeded, and integrated into the communication performance evaluation of the FMS. The PSR can be expressed as:
PSR = 100 PER .
The communication performance between two adjacent FCIs, i.e., point-to-point communication performance, can be established by the platform and the procedures proposed. However, if the FCIs are installed in the selected locations directly, the effectiveness of the FMS cannot be assessed from the existing communication performance directly. The main reasons are described below:
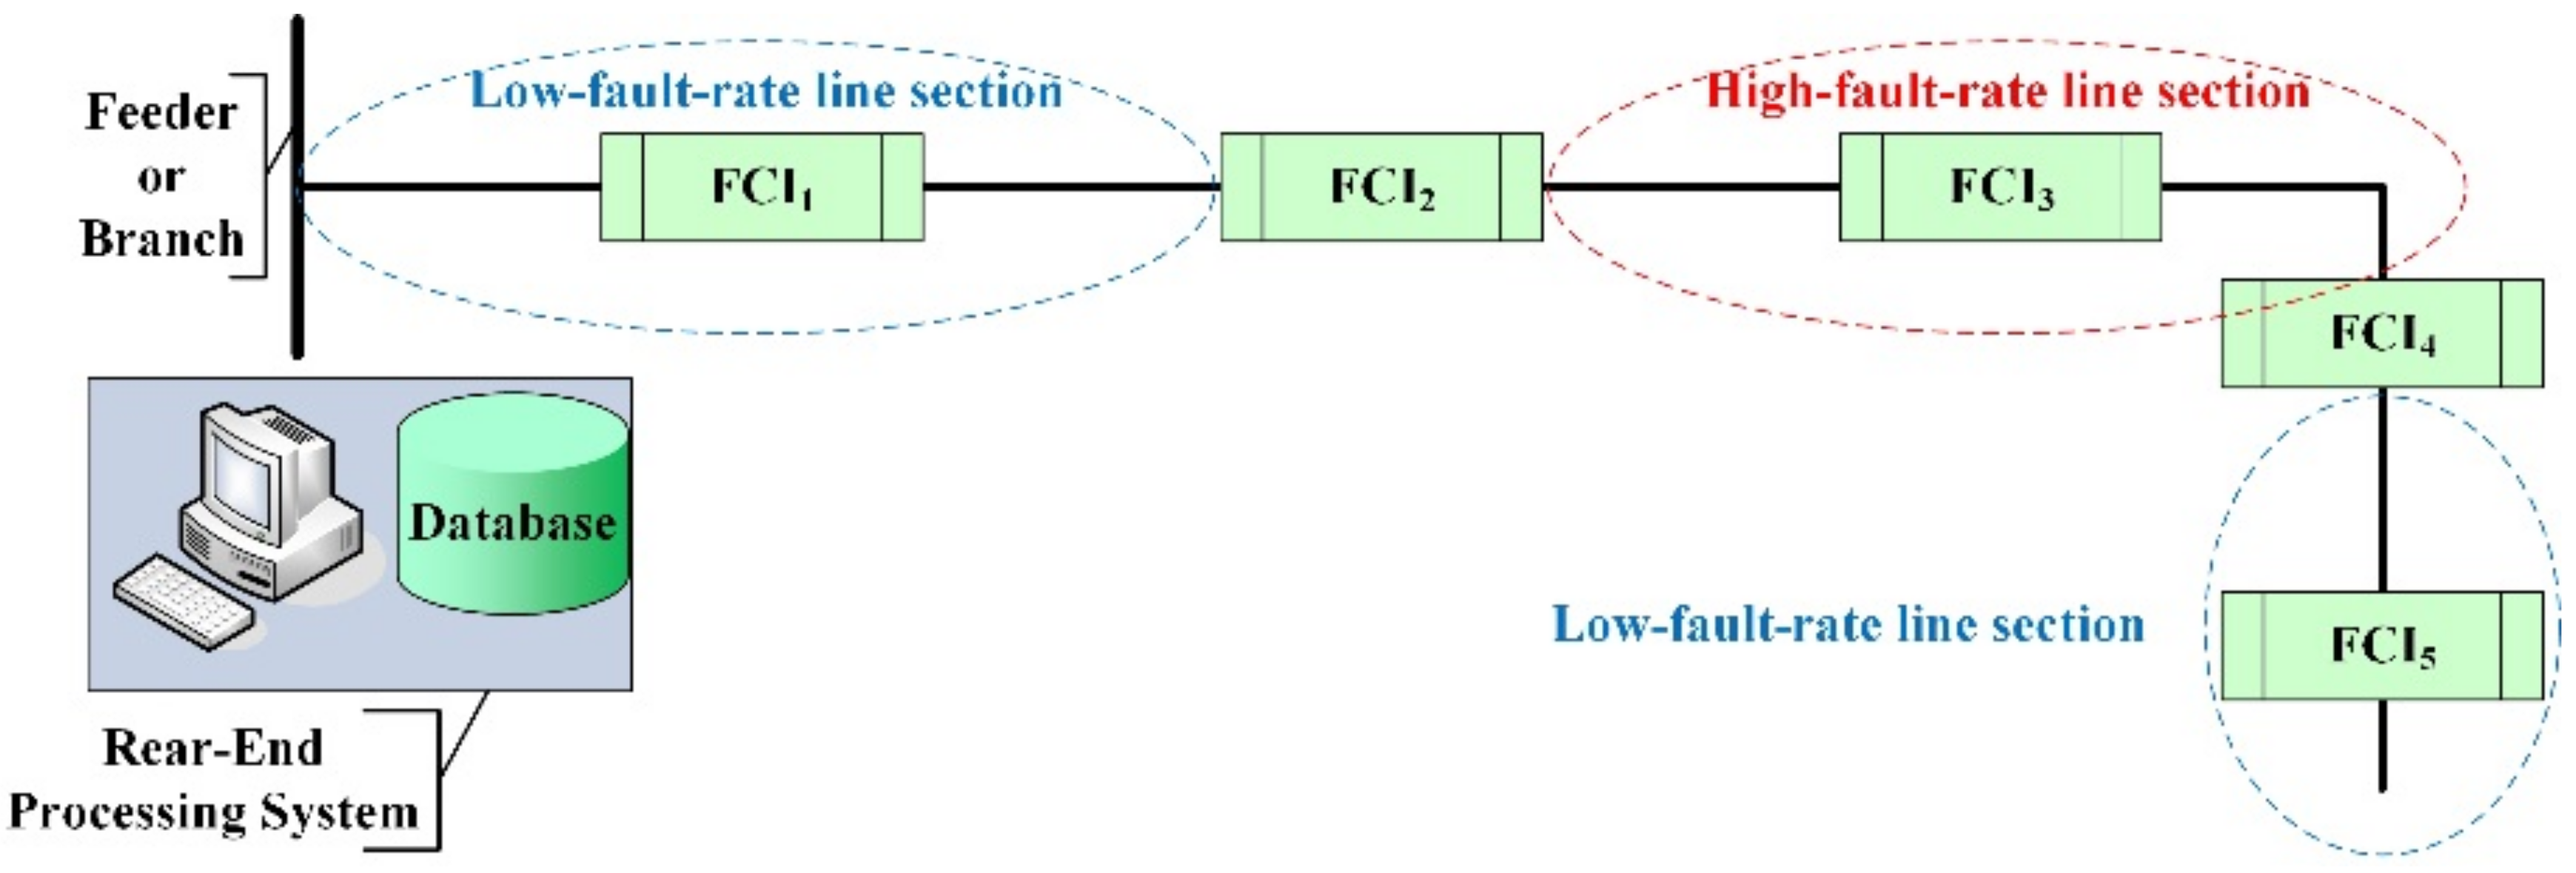
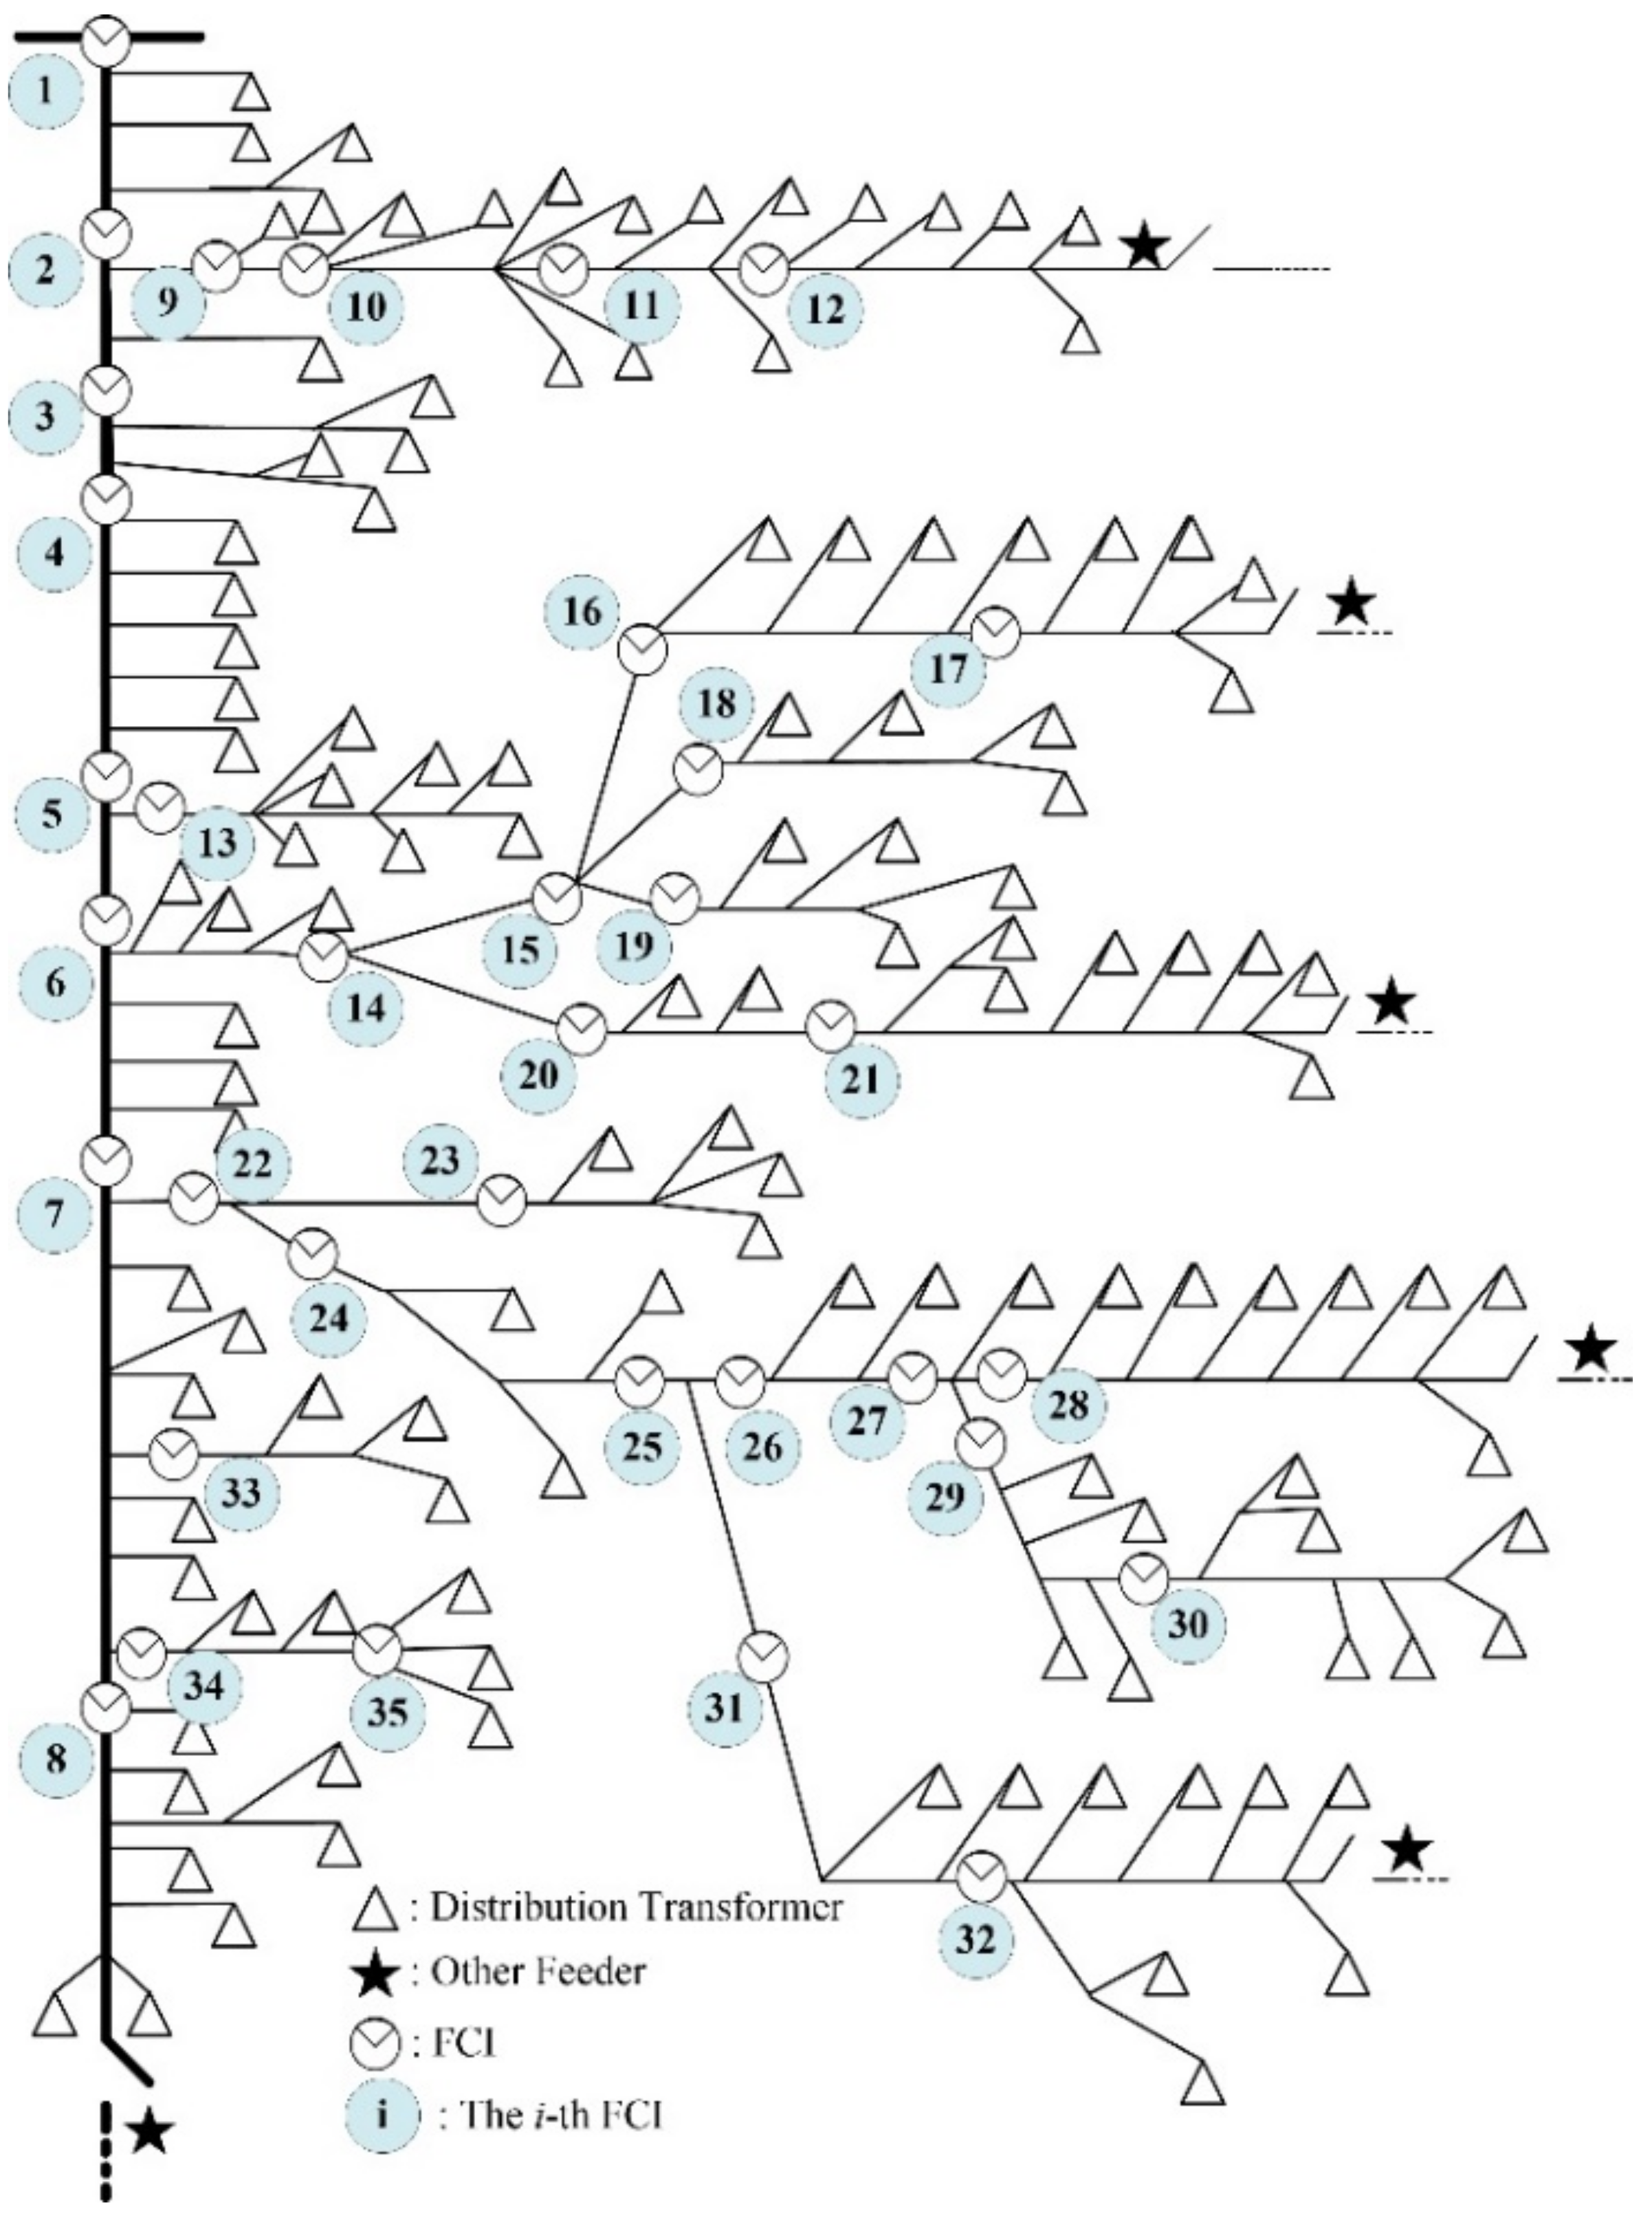
  • The FCIs and rear-end processing system separate a distribution system into several line sections. Except for the point-to-point communication performance, the fault rates in various line sections of the distribution system should be taken into account. As shown in Figure 7, some line sections in the distribution system may have higher fault rates or lower fault rates. The higher fault rates will result in high utilization ratios of FCIs in the line sections; therefore, the line sections require better communication performance to preserve the same performance.
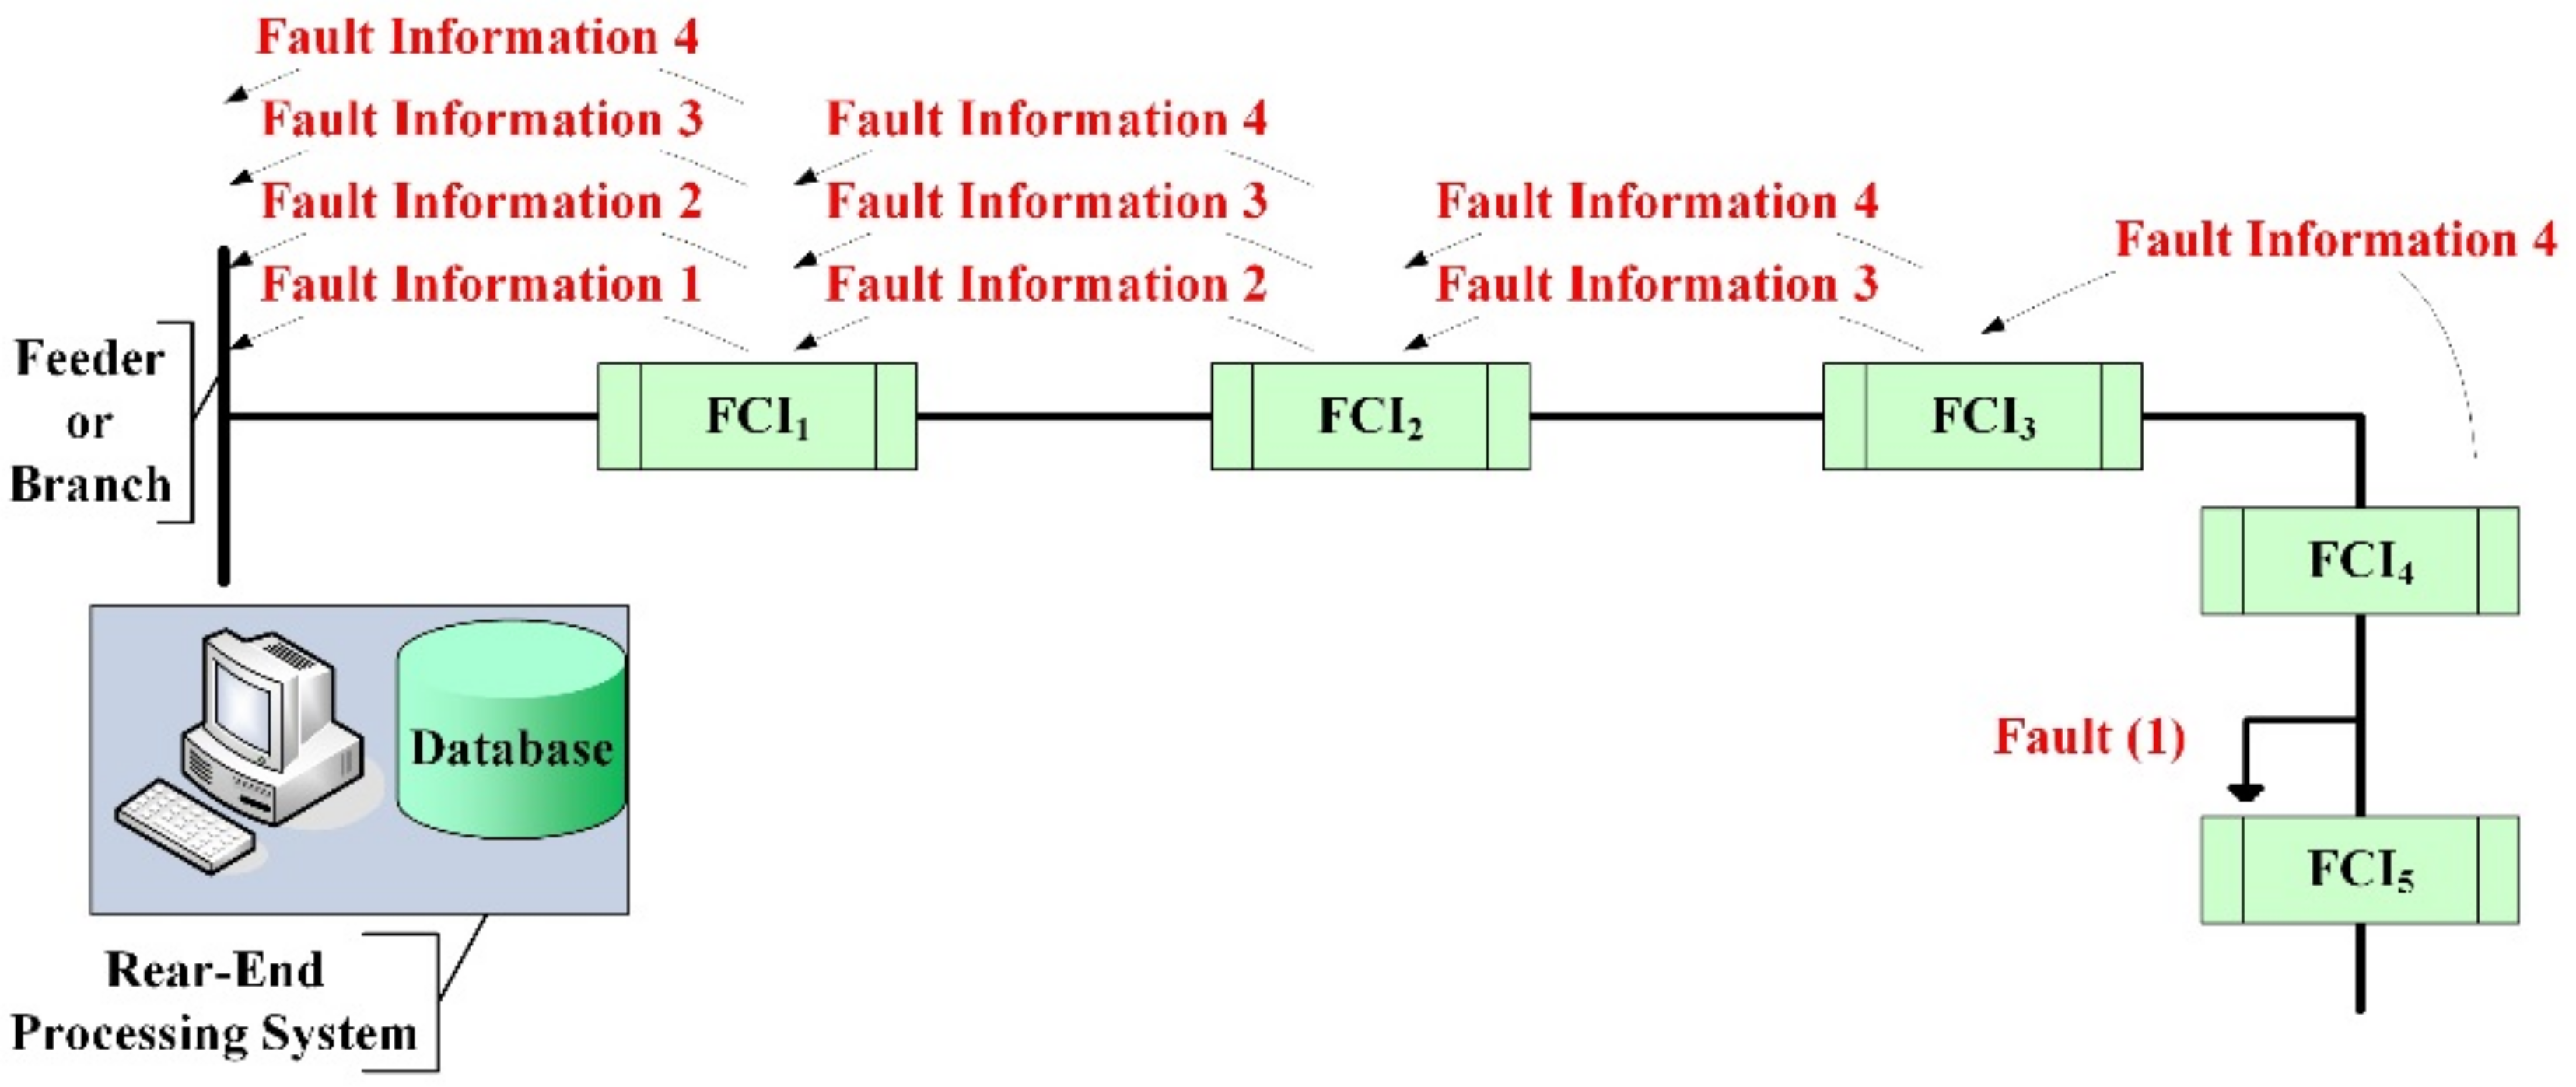
  • As shown in Figure 8, the fault information forwarding of FCIs in the FMS is not only a point-to-point process after a fault occurs. For example, the fault location is in the next line section of FCI4 in 
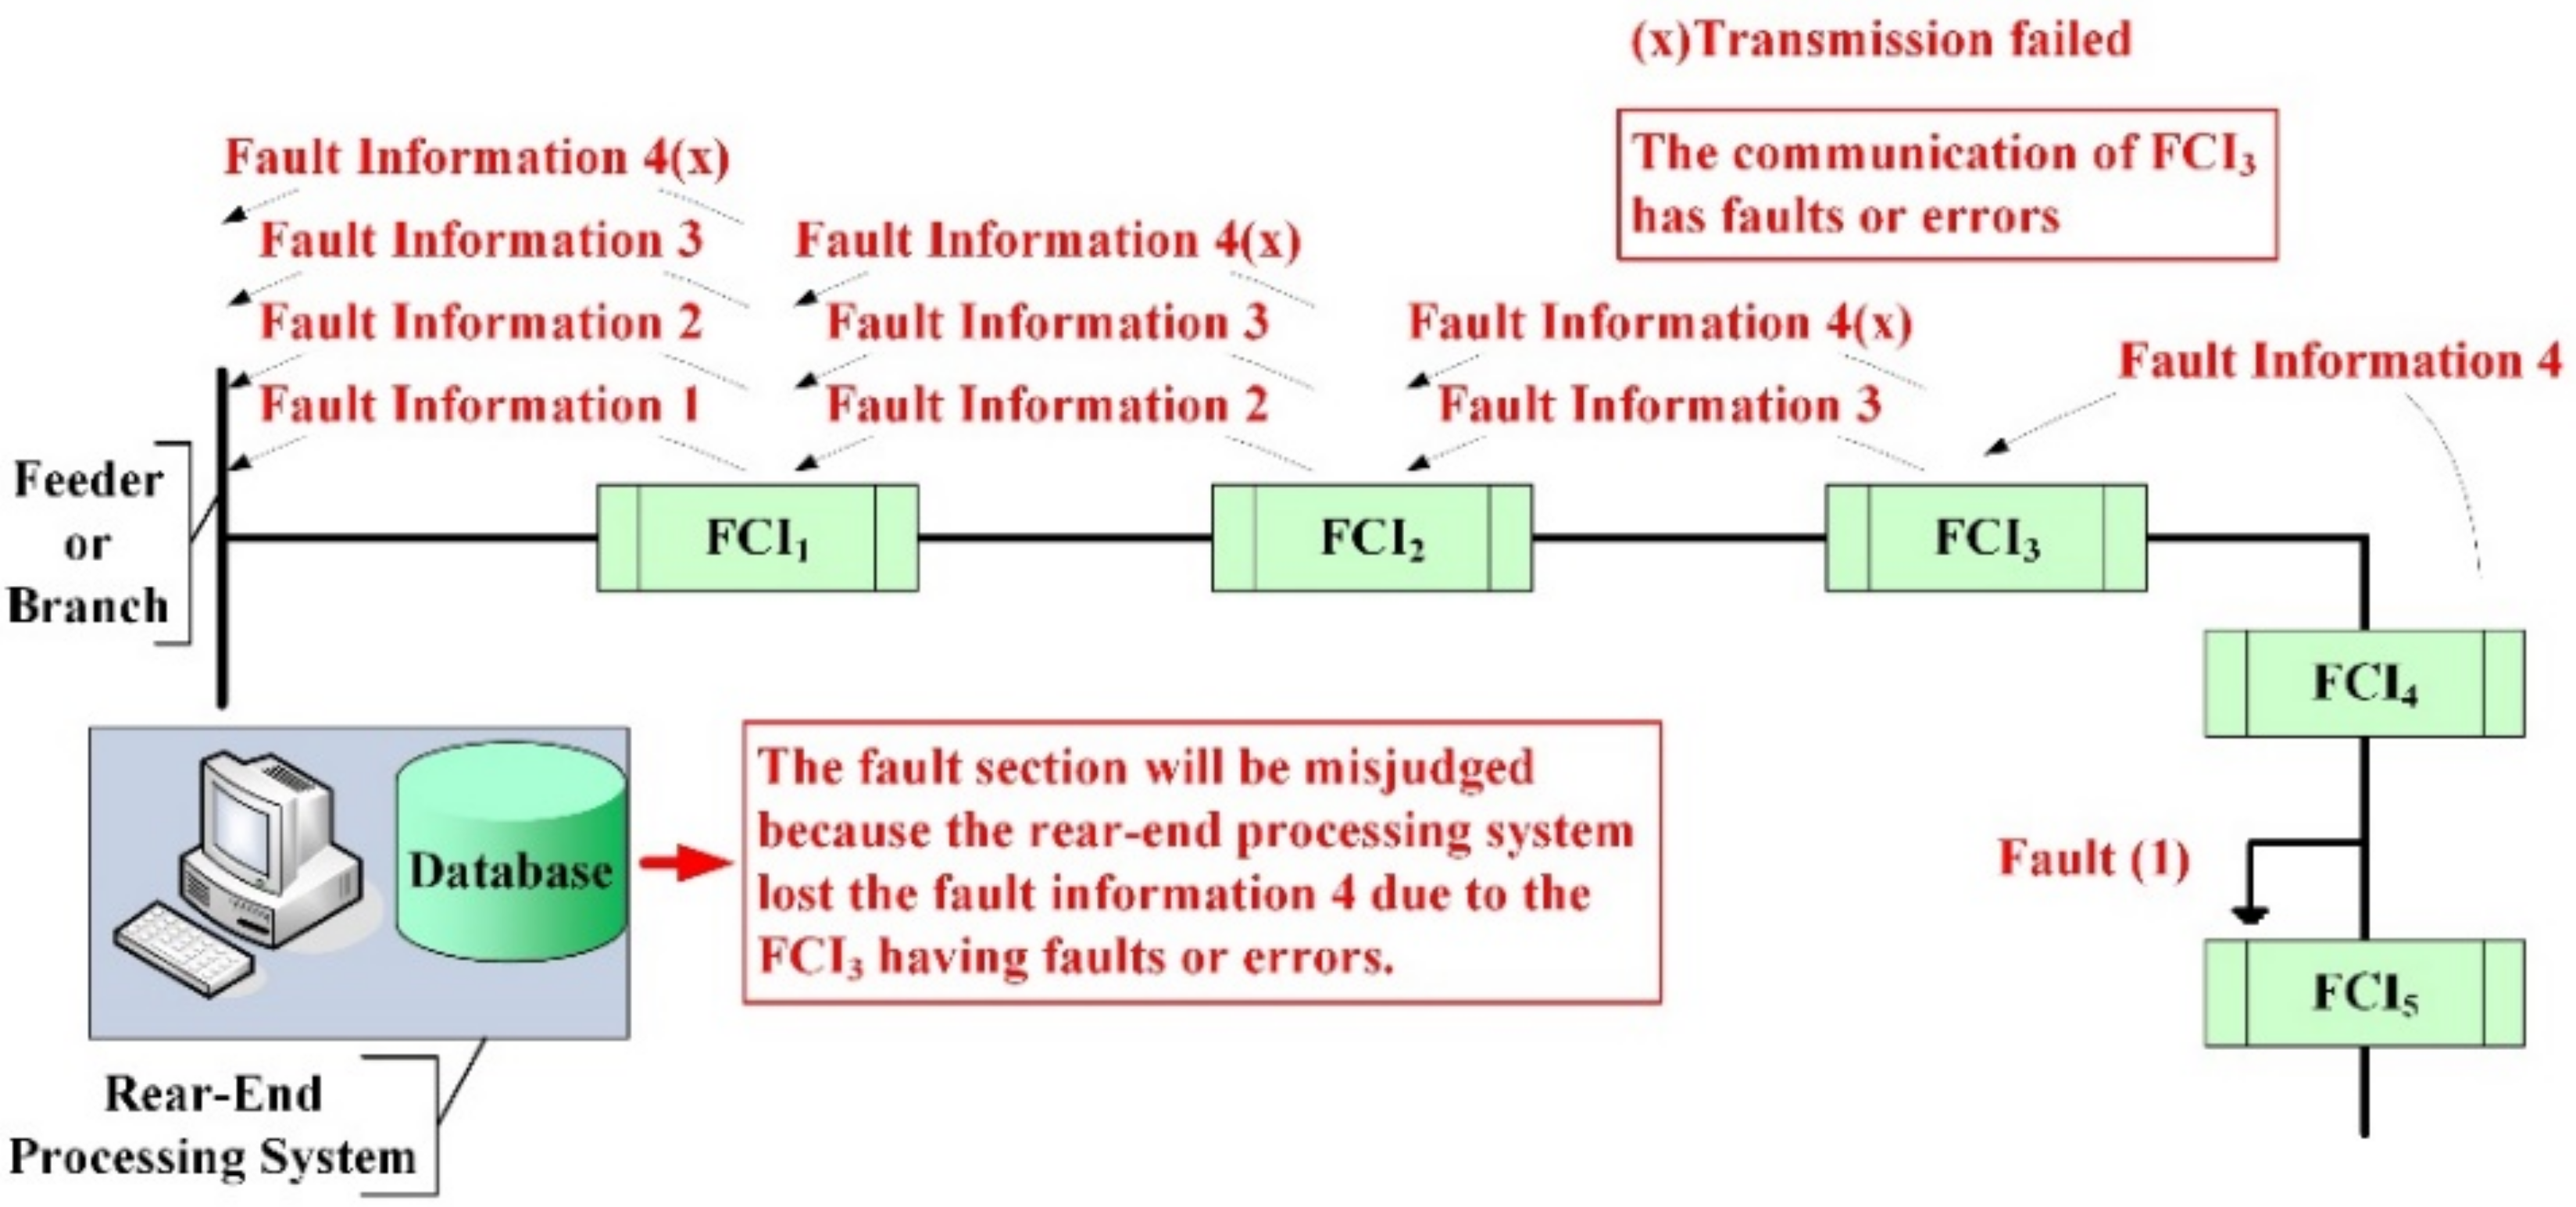
Figure 8. The fault information forwarding for each FCI is very important to make sure the fault location can be effectively identified. An error in fault information forwarding may cause misidentification of the fault location. As shown in Figure 9, due to the error in fault information forwarding of FCI3, the fault location will be in the next line section of FCI3. This condition will degrade the effectiveness of the FMS. Therefore, the effectiveness of an FMS composed of FCIs in distribution systems does not only greatly depend on the performance of the communication network deployed by the FCIs but also on the failure rates of the distribution systems.

3.2. Fast Communication Route Tracking Method

The communication route of fault information forwarding for the simple distribution system as illustrated in Figure 7, Figure 8 and Figure 9 is easily determined by visual inspection. A geographic information system was used to draw the one-line diagram of an actual distribution system for an ADAS. Figure 10 illustrates the one-line diagram for an actual distribution system acquired from Taiwan Power Company [12]. It is not easy to find the communication route by visual inspection from 
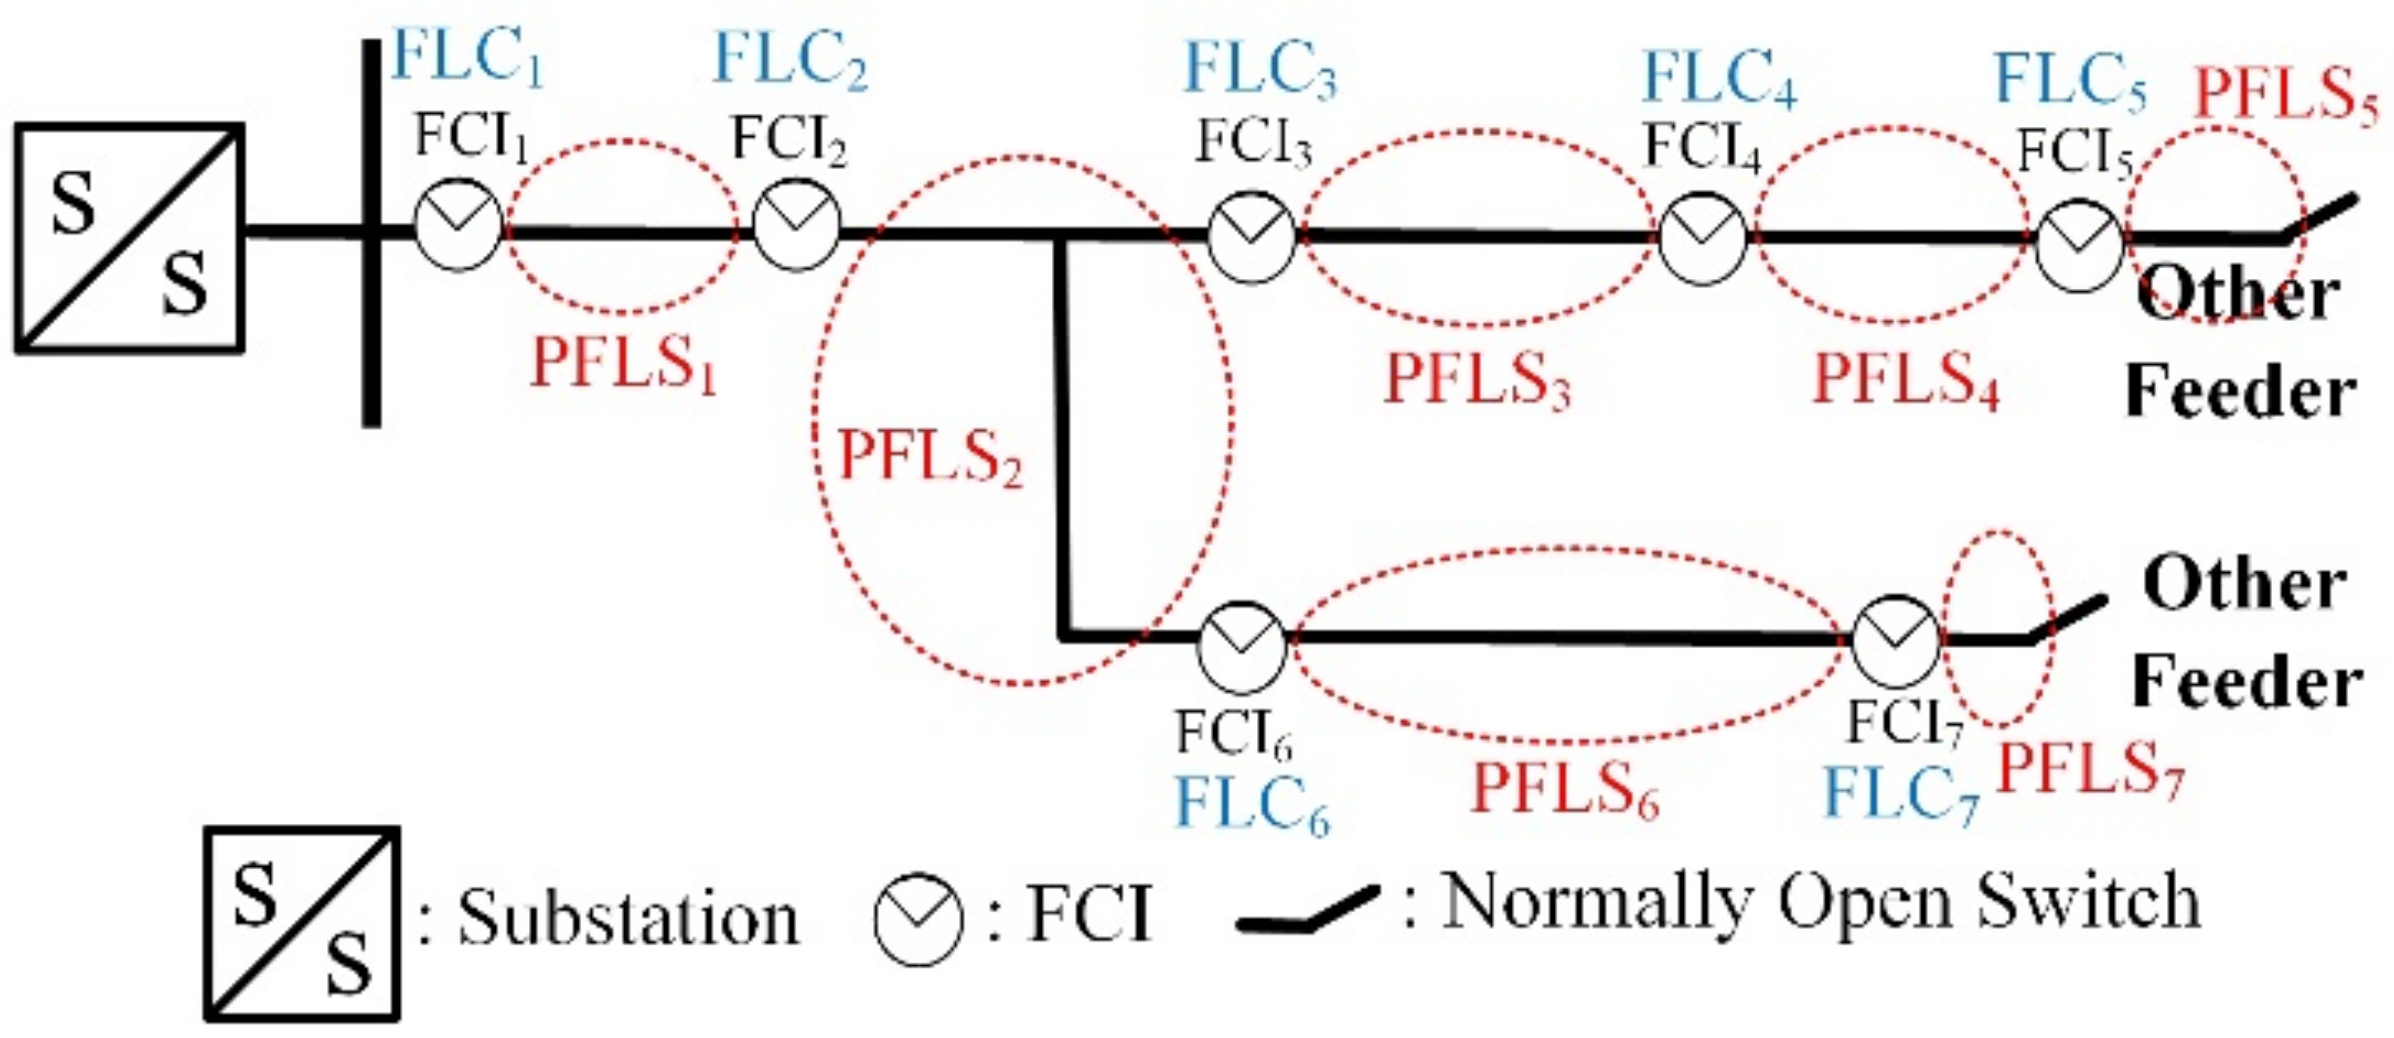
Figure 10; therefore, a fast communication route tracking method of faulted line sections is important for actual distribution systems and is proposed in this paper. The proposed fast communication route tracking method was designed based on the following observations: (1) the line sections between adjacent FCIs can be treated as Faulted Line Sections (FLSs) and (2) the fault current detected by the FCI can be considered as a Faulted Line Current (FLC) flowing along the FLSs. For example, the FLSs and FLCs are marked and illustrated in Figure 11. Figure 11 shows that there are seven FLCs measured by FCIs and seven FLSs; therefore, it is able to efficiently find the communication route for each FLS when a fault occurs.
A relationship matrix, the current injection to the line–current matrix, derived from the topology characteristics of distribution systems was used to design the proposed fast communication route tracking method. The detailed derivations of this matrix can be found in [29]. The building procedures of the matrix only for the proposed communication route tracking method are shown in this paper. For a distribution system, the FLS in a substation is 0 and the other FLSs are numbered sequentially downstream. The building procedure for current injection to the line–current matrix ( [ A C I L C ] ) is as follows:
(1)
For a distribution system with m FLCs and n FLSs, the dimension of the [ A C I L C ] matrix is m by n.
(2)
For an FLC k located between adjacent FLSs i and j, copy the column of the ith FLS of the [ A C I L C ] matrix to the column of the jth FLS and insert “+1” to the position of the kth row and jth column.
(3)
Repeat 2 until all FLCs are included in the [ A C I L C ] matrix.
The constant and upper-triangular matrix [ A C I L C ] has nonzero entries of +1 only. The equation between current injections of FLSs and FLCs can be expressed as:
[ I F L C ] = [ A C I L C ] [ I F L S ]
where [ I F L C ] and [ I F L S ] are the vectors of FLCs and current injections of FLSs, respectively.
Therefore, when a fault occurs, the line current path can be easily obtained from Equation (2). For example, if a fault occurs in FLS k, then the faulted line currents can be obtained from:
[ I F L C k ] = [ A C I L C k ] I F L S k
where [ A C I L C k ] is the kth column vector of [ A C I L C k ] . [ I F L C k ] is the vectors of FLCs after a fault occurs in FLS k. I F L S k is the fault current in FLS k.
Using Figure 11 as an example, Equation (2) can be expressed as:
[ I F L C ] = [ I F L C 1 I F L C 2 I F L C 3 I F L C 4 I F L C 5 I F L C 6 I F L C 7 ] T
[ A C I L C ] = [ 1 1 1 1 1 1 1 0 1 1 1 1 1 1 0 0 1 1 1 0 0 0 0 0 1 1 0 0 0 0 0 0 1 0 0 0 0 0 0 0 1 1 0 0 0 0 0 0 1 ]
[ I P F L S ] = [ I F L S 1 I F L S 2 I F L S 3 I F L S 4 I F L S 5 I F L S 6 I F L S 7 ] T .
If a fault occurs in FLS 7, then the faulted line currents can be expressed as:
[ I F L C 1 I F L C 2 I F L C 3 I F L C 4 I F L C 5 I F L C 6 I F L C 7 ] = [ 1 1 0 0 0 1 1 ] I F L S 7 .
Obviously, from Equation (5), the fault line current path is I F L C 7 , I F L C 6 , I F L C 2 , and I F L C 1 . The communication route after a fault occurs in FLS 7 is I F L C 7 , I F L C 6 , I F L C 2 , I F L C 1 , and substation. Therefore, the communication route of an FLS can be easily found by the proposed communication route tracking method and is the corresponding column vector of [ A C I L C ] .

3.3. Systematic Effectiveness Assessment of a Fault Management System (FMS)

A systematic communication evaluation methodology for FMSs composed of FCIs with communication interfaces is crucial and is therefore investigated in this paper. The PDFs of communication performance for various line sections between two adjacent FCIs were established by using the measured communication parameters first. The line section fault rate and the stochastic analysis model were then combined to simulate and assess the effectiveness of the FMS. The major steps are described below:
Step 1: Enter the required simulation number for stochastic analysis.
Step 2: Consider the fault rate of each FLS and use a stochastic analysis method such as the Monte Carlo method to generate probable FLSs for the kth simulation, hereinafter referred to as Randomized FLS, RFLS(k). The upstream FCI closest to the RFLS is the Randomized FCI (RFCI) and is defined as RFCI(k) for the kth simulation. The failure probability of each FLS can be expressed as:
P F R F L S i = F R F L S i i = 1 N F L S F R F L S i
where P F R F L S i is the failure probability for FLS i. F R F L S i is the failure rate of FLS i. N F L S is the number of FLSs in the distribution system.
The failure probabilities of FLSs can be expressed as a piecewise uniform distribution, and RFL(k) can then be easily generated from Equation (6) by the Monte Carlo method.
Step 3: Simulate the fault information forwarding mechanism of the FMS as illustrated in Figure 8 and Figure 9 from RFCI(k). The communication route of RFCI(k) can be easily found from the corresponding column vector of [ A C I L C ] .
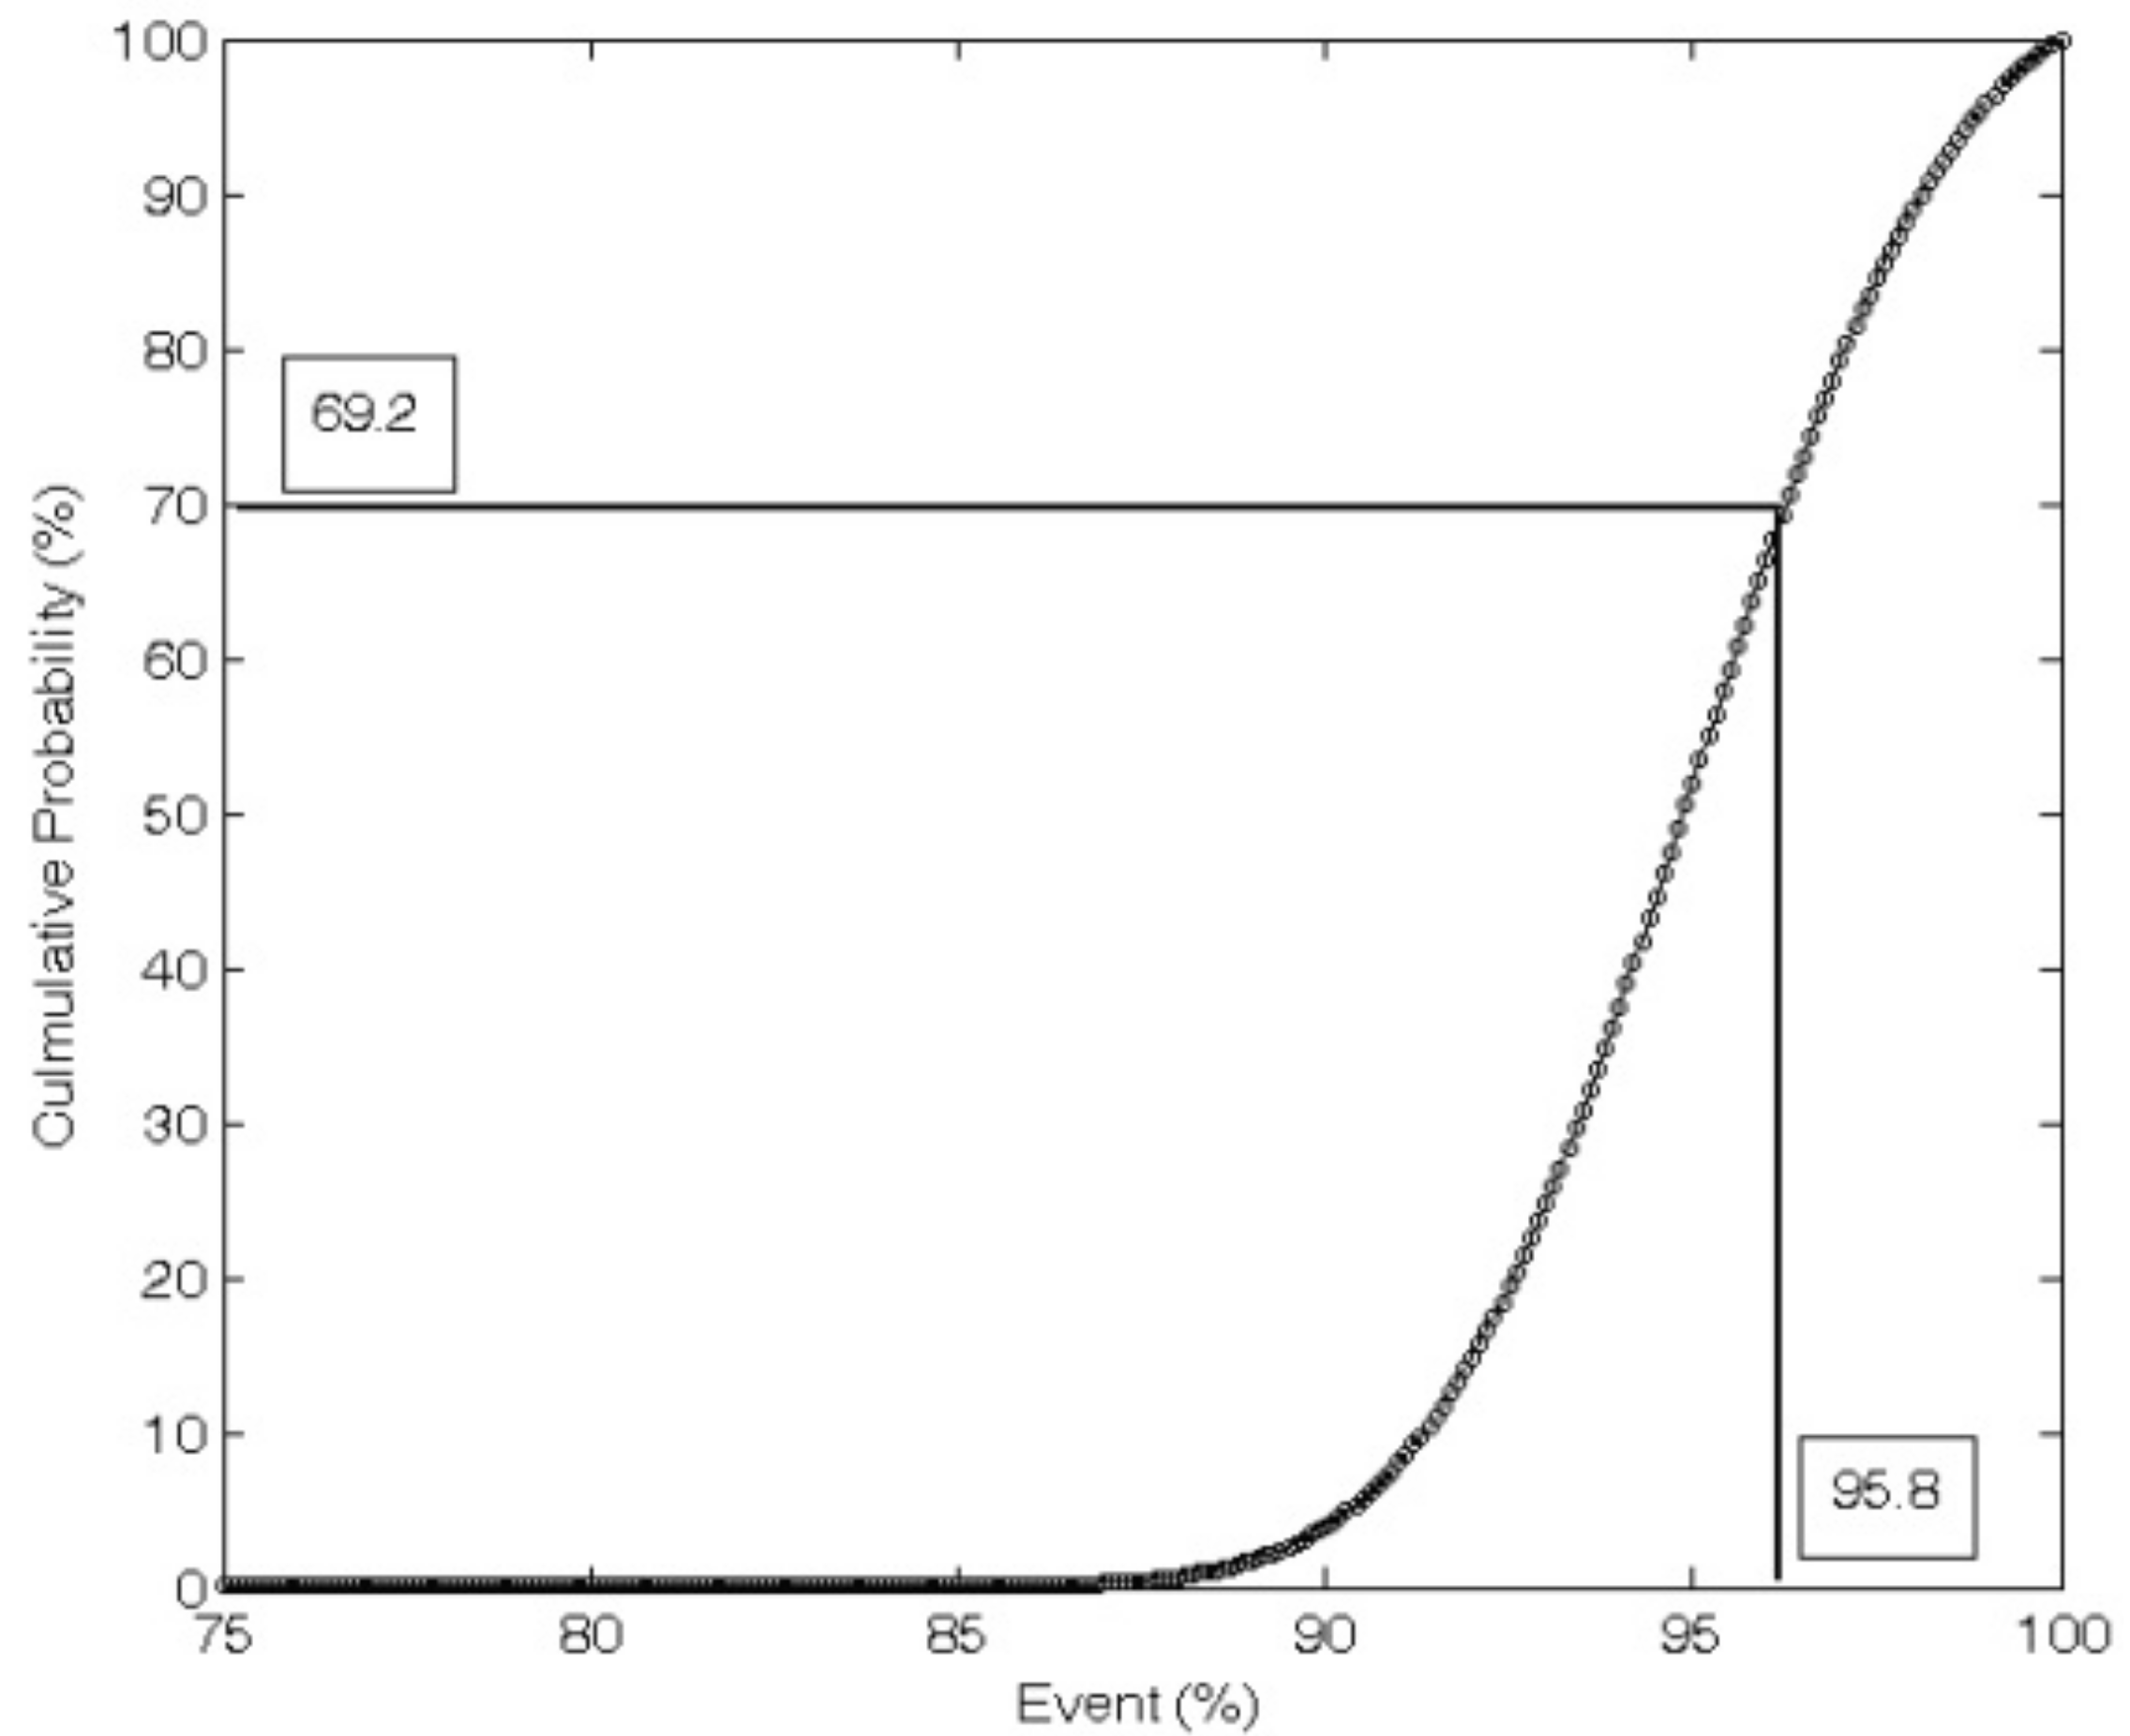
Step 4: In the fault information forwarding mechanism, each FCI generates the PSR probability randomly based on the Cumulative Distribution Function (CDF) derived from the PDF of the measured PSR between the two adjacent FCIs. The fault information is then forwarded to the previous FCI. Therefore, the probability of the fault information being forwarded to another FCI can be established. The Monte Carlo method generates a value between 0% and 100% randomly and uses the PSR CDF to obtain the randomized PSR probability during each simulation. Using the CDF in Figure 12 as an example, when the randomly generated value is 69.2%, the PSR probability is 95.8%.
Step 5: Use the probabilities of the fault information being forwarded to calculate the probability of correctly identifying the fault location in RFL(k). Using Figure 11 as an example, P S R F C I 1 , k , P S R F C I 2 , k , P S R F C I 3 , k , P S R F C I 4 , k , P S R F C I 5 , k , and P S R F C I 6 , k denote the PSR probabilities generated by Monte Carlo method for FCIs between 1 and 2, FCIs between 2 and 3, FCIs between 3 and 4, FCIs between 4 and 5, FCIs between 2 and 6, and FCIs between 6 and 7, respectively, in the kth simulation. RFLS(k) and RFL(k) are FLS 7 and FCI 7, respectively. The communication route is expressed in Equation (5) and the probability of correctly identifying the FLS in RFL(k) can then be written as:
P C I F L ( R F L ( k ) ) = P S R F C I 6 , k P S R F C I 5 , k P S R F C I 2 , k P S R F C I 1 , k
where P C I F L ( R F L ( k ) ) is the probability of correctly identifying the FLS in RFL(k) in the kth simulation.
Step 6: If the required simulation number is reached, proceed to Step 7; otherwise, go to Step 2.
Step 7: The maximum, minimum, mean, standard deviation, etc., for the probability of correctly identifying the FLS using the total simulation results can be calculated for the FMS and for each FLS.
If the predefined effectiveness requirement for the FMS, i.e., the probability of correctly identifying fault locations, is met, then the installation locations of those FCIs can be determined. If the requirement is not met, the line section with worse communication performance or higher fault rate should be adjusted to look for more appropriate FCI placing locations.
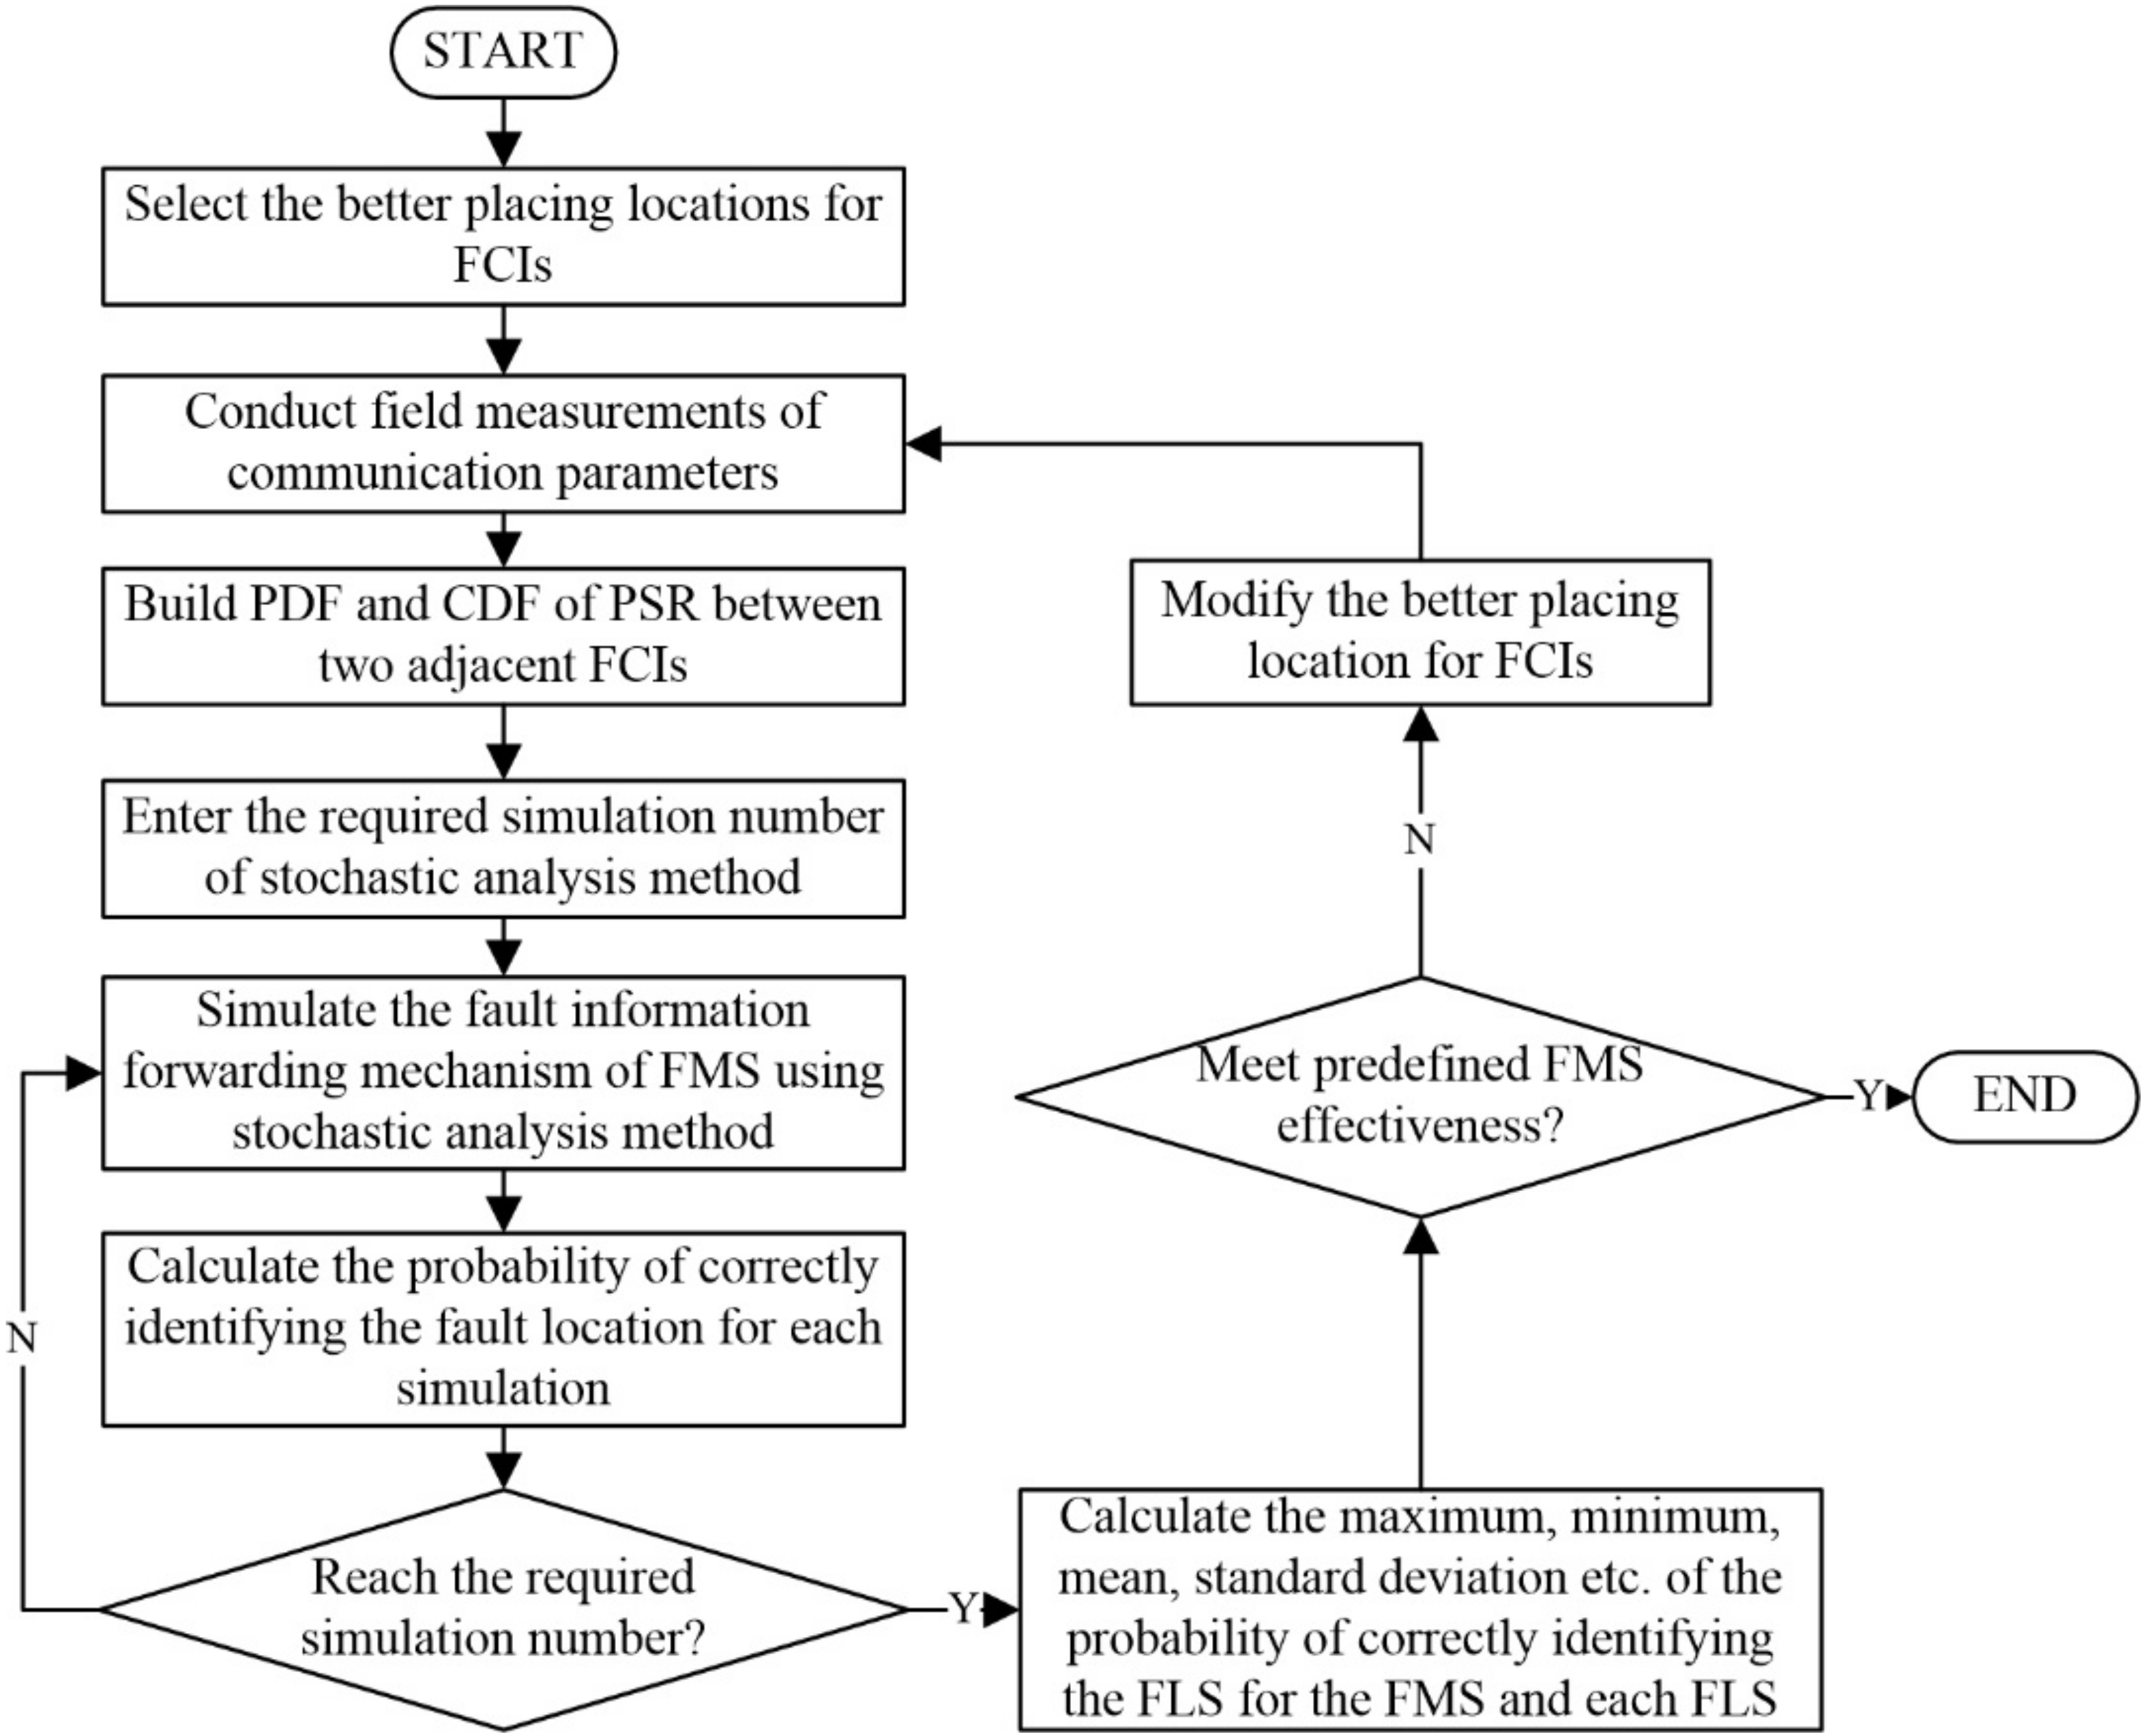
The proposed systematic effectiveness assessment methodology for FMSs in this paper is briefly described below:
Step 1: Select better placing locations for FCIs in a distribution system based on an online real-time map. As most distribution systems are erected along roads, the proposed communication performance evaluation platform can use satellite imagery and real images from online real-time maps to select probable locations for FCI placement. The candidate locations can then be selected according to the measured distance between probable locations and the barrier shown in the real image.
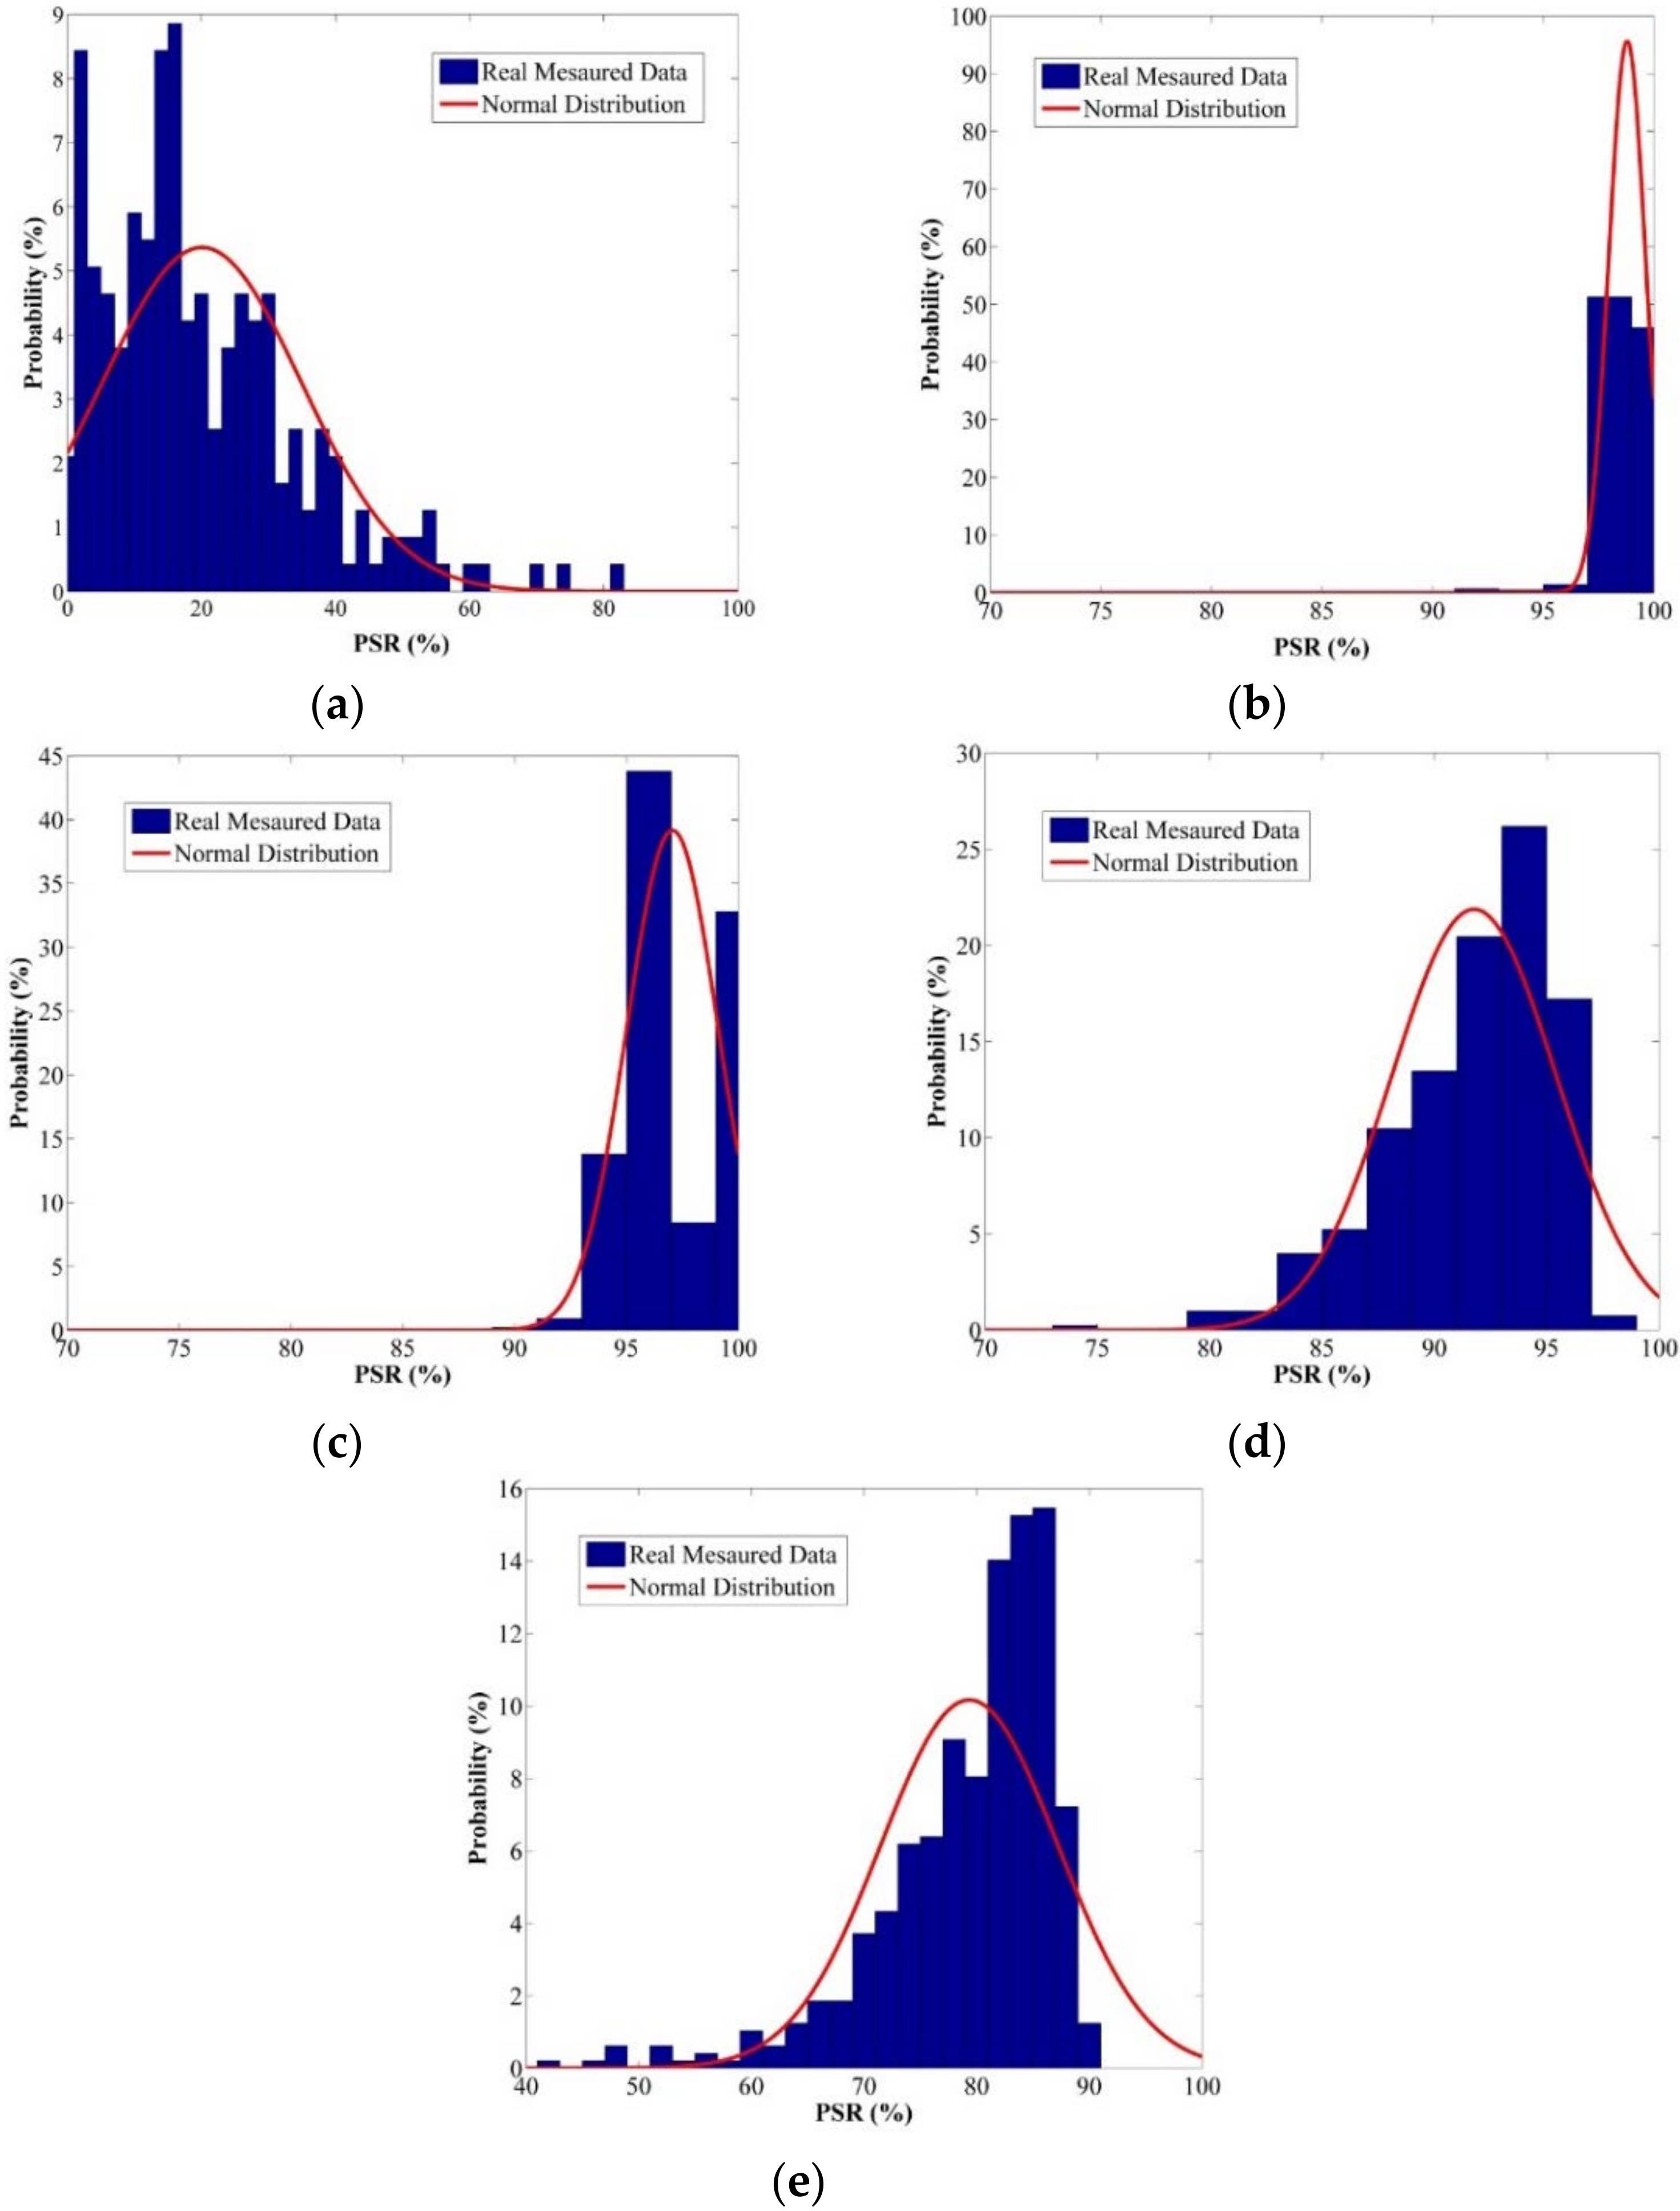
Step 2: Conduct field measurements of communication parameters. The point-to-point communication parameters between two adjacent FCIs are measured and recorded according to the above candidate locations. The measured data should at least include PER, LQI, and RSSI. The PDF and CDF of the PSR between two adjacent FCIs can be established based on the measured PER.
Step 3: Assess the effectiveness of the FMS using the proposed stochastic analysis procedure. The PSR PDF and fault rate of each line section are used to simulate and access the effectiveness of the FMS constructed by FCIs. Therefore, the probability of correctly identifying the FLS can be calculated for the FMS and each FLS.
The proposed systematic effectiveness assessment methodology for FMS can be applied to urban and rural distribution systems. No special attention is required for ZigBee communication used in rural distribution systems. The flowchart of the proposed systematic effectiveness assessment methodology for FMSs is illustrated in Figure 13.

4. Experimental and Simulation Results

4.1. Field Measurements of Communication Performance between Two Adjacent FCIs

The old railway line at the exit of Sizihwan Station of the Kaohsiung Mass Rapid Transit (MRT) Orange Line was used to simulate a suburban feeder in the following tests. The Google Map shown in Figure 14 was used to estimate the distance and evaluate the topography of the suburban feeder. The candidate locations for FCI placement were selected according to the actual environment of Figure 14. The communication parameters of various line sections could then be measured. As shown in Figure 14, there were six FCIs, FCI01 to FCI06, on the feeder, dividing the feeder into six Line Sections (LSs) for communication performance evaluation. Table 1 shows the distances and the angles between adjacent FCIs for this feeder. From Figure 14, it can be seen that there was a sharp bend between FCI04 and FCI05 (LS_4); therefore, the distance of LS_4 was shortened to 130 m according to the geographic information obtained from Google Maps. Figure 15 shows the photographs of the measured points for LS_1 between FCI01 and FCI02. It is observed that FCI01 was in an open area, and FCI02 was straight under the iron bridge. The mounting height of FCI01 and FCI02 was 2 m, and the distance between FCI01 and FCI02 was about 470 m. There were some barriers such as trees and an iron bridge between these two measuring points. ZigBee channel 21 was selected for the following field communication performance evaluation. The number of measurements was 237. For each measurement, 1000 packets, each 24 bytes, were transmitted.
Figure 16 shows the respective PSR PDFs for LS_1 to LS_5 from the measured parameters. Table 2 shows the maximum, minimum, mean, and standard deviation of the measured PSRs. As shown in Figure 16, if the number of measurements is large enough, the measured PSR’s PDF may be close to a normal distribution. Therefore, the normal distribution (red line) can also be used to simulate the communication performance between two adjacent FCIs.
According to the measured PSRs listed in Table 2, the PSR between the candidate locations of FCI01 and FCI02 is quite poor due to the sharp bend as illustrated in Figure 14. Therefore, the candidate locations of FCI01 and/or FCI02 must be changed to reduce the sharp bend. From Figure 17, it can be observed that the candidate location of FCI01 was changed from “01” to “01’” and the distance of LS_1 was reduced to 410 m. Figure 18 shows the measured communication performance of LS_1 after the FCI01 location was adjusted. Table 3 shows the measured communication performance for each line section after the FCI01 location was adjusted. It is observed from Table 3 that the communication performance of LS_1 was upgraded from 20.045% to 97.689%. Other candidate location adjustments can also be done if necessary.

4.2. Effectiveness Assessment of the FMS

After the PSR PDF for each line section has been built and has met the communication performance requirement of adjacent FCIs, the fault rate of the feeder can be integrated into the proposed methodology to assess the effectiveness of the FMS. The failure rate and the PSR PDF for each line section are listed in Table 4.
The simulation number was set to 100,000. An RFLS was generated in each simulation. For example, if the RFL is in LS_4, the fault information forwarding mechanism of the FMS will transmit fault information through the ZigBee network constructed by the FCIs in LS_3, LS_2, and LS_1. At this moment, the Monte Carlo method is used to randomly generate the respective PSRs between the adjacent FCIs of LS_3, LS_2, and LS_1. If the PSRs for LS_3, LS_2, and LS_1 obtained from the Monte Carlo method are 96.7%, 93.3%, and 94.3%, respectively, then the PSR probabilities for this fault information forwarding mechanism are LS_3 = 96.7%, LS_3 and LS_2 = 96.7 × 93.3 = 90.2%, and the probability of successfully sending an RFL to the rear-end processing system is 96.7 × 93.3 × 94.3 = 85.1%. The value 85.1% is also the probability of correctly identifying the fault location for this simulation. After 100,000 simulations, the mean and standard deviation of the PSR for each line section are listed in Table 5. The PSR of LS_1 is the probability of correctly identifying a fault location for this FMS. The average value of the PSR for LS_1 is 87.123%. If the effectiveness requirement of the FMS is 85%, then these candidate locations of the FCIs can meet the requirements. If it fails to meet the requirements, the candidate locations of the present FCIs must be adjusted and the whole procedure rerun.
Most FCIs with communication interfaces can be embedded with a fault information retransmission mechanism. The proposed systematic effectiveness assessment methodology can also be used to simulate the fault information retransmission mechanism. In each stochastic analysis, the fault information forwarding mechanism can be executed according to the predefined number of retransmissions, and the maximum value is taken as the probability of correctly identifying a fault location for this simulation. The probability of correctly identifying a fault location with the retransmission mechanism can be expressed as:
P C I F L R T ( R F L ( k ) ) = max ( P C I F L 1 ( R F L ( k ) ) P C I F L i ( R F L ( k ) ) P C I F L N R T ( R F L ( k ) ) )
where P C I F L R T ( R F L ( k ) ) is the probability of correctly identifying the FLS in RFL(k) in the kth simulation with the retransmission mechanism. P C I F L i ( R F L ( k ) ) is the probability of correctly identifying the FLS in RFL(k) for the ith retransmission in the kth simulation.
Table 6 shows the respective means and standard deviations of the PSR with 1, 5, and 10 retransmissions. From Table 6, it can be observed that the fault information retransmission mechanism can effectually enhance the probability of correctly identifying the fault location. If the effectiveness requirement of the FMS is 93%, five retransmissions can help the original FCL placement meet the requirements. In an actual FMS, if the number of fault information retransmissions is set too high, the lifetime of the FCIs’ batteries will be shortened. On the contrary, if it is too low, the effectiveness of the FMS cannot meet the requirements. Therefore, the optimal number of fault information retransmissions still needs further investigation and will be studied in the future. The experimental and simulation results demonstrate the feasibility of the proposed effectiveness assessment of FMSs.

4.3. Feasibility of the Proposed Communication Route Tracking Method

Due to the limited space, only one actual distribution system acquired from Taiwan Power Company, as illustrated in Figure 10, was used to verify the validity of the proposed communication route tracking method. There were 35 FCIs installed in this distribution system according to the optimal FCI placement proposed by [12]. The FCIs are numbered in Figure 10 and the FLSs for adjacent FCIs are listed in Table 7. From Table 6, it can be seen that there are 35 FLSs. For example, FLS 27 is in the line sections surrounded by FCIs 27, 28, and 29. From Figure 10 and Table 7, the relationship matrix for the FLSs and FCLs can be built and the nonzero terms of the [ A C I L C ] matrix are expressed in Equation (9a). Obviously, it is not easy to find the communication route from Figure 10 for each FLS; however, it can be checked straightforwardly from Equation (9a). For example, if a fault occurs on FLS 31, then [ A C I L C 31 ] can be expressed as Equation (9b). From Equation (9b), it can be checked that the communication route is I F L C 31 , I F L C 25 , I F L C 24 , I F L C 22 , I F L C 7 , I F L C 6 , I F L C 5 , I F L C 4 , I F L C 3 , I F L C 2 , I F L C 1 , and the rear-end processing system of the substation. Obviously, the communication route of an FLS can be effectively and efficiently tracked by the proposed communication route tracking method,
Energies 11 02582 i001

5. Conclusions

The effectiveness of an FMS composed of FCIs greatly depends on the performance of the communication network deployed by the FCIs and the failure rates of distribution systems. The effectiveness of an FMS cannot be assessed realistically from the optimal number and location of FCIs or the communication network deployment individually. Therefore, a systematic effectiveness assessment methodology for FMSs composed of FCIs was investigated in this paper. A communication evaluation platform was designed in this paper and used to conduct field measurements of communication parameters for ZigBee-based FCIs. The PSR between two adjacent FCIs was measured and the PSR PDF was built accordingly. The effectiveness of the FMS was then assessed using a stochastic analysis method considering the failure rates of distribution feeders and PSR PDFs between two adjacent FCIs. A fast communication route tracking method for a fault information forwarding mechanism was also proposed in this paper. Experimental and simulation results demonstrated the validity and feasibility of the proposed systematic effectiveness assessment methodology for FMSs composed of FCIs. The proposed assessment methodology can more realistically react to the actual conditions of the FMS and therefore save on installation time and costs. The optimal number of fault information retransmissions and the integration of the proposed method into actual distribution systems will be investigated in the future.

Author Contributions

J.-H.T. and C.-H.H. proposed and designed the algorithm of the fast communication route tracking method. J.-H.T., C.-H.H., S.-W.L. and B.-R.L., Y.-F.L. worked together to finish the communication evaluation platform, conducted the field measurements, and assessed the effectiveness of FMSs composed of FCIs.

Funding

This research was funded by Ministry of Science and Technology of Taiwan under Contracts MOST 107-3113-E-110-001, MOST 104-2221-E-110-042-MY3, and MOST 106-3113-E-214-001 and Bureau of Energy, Ministry of Economic Affairs under the project of Grid-interconnection Policy and Technical Promotion for High Penetration of Renewable Energy (Project number: 107-D0306).

Conflicts of Interest

The authors declare no conflicts of interest.

Nomenclature

FCIFault Current Indicator
FMSFault Management System
PSRPacket Success Rate
PDFProbability Density Function
ADASAdvanced Distribution Automation System
FDIRFault Detection, Isolation, and Restoration
LEDLight-Emitting Diode
PERPacket Error Rate
HMIHuman–Machine Interface
FLSFaulted Line Section
FLCFaulted Line Current
[ A C I L C ] Current injection to line current matrix
[ I F L C ] Vector of FLCs
[ I F L S ] Vector of current injections of FLSs
[ A C I L C k ] kth column vector of [ A C I L C k ]
[ I F L C k ] Vectors of FLCs after a fault occurs in FLS k
I F L S k Fault current in FLS k
RFLS(k)Randomized FLS (RFLS) for the kth simulation
RFCI(k)Randomized FCI (RFCI) for the kth simulation
P F R F L S i Failure probability for FLS i
F R F L S i Failure rate of FLS i
N F L S Number of FLSs in the distribution system
P C I F L ( R F L ( k ) ) Probability of correctly identifying the FLS in RFL(k) in the kth simulation
P C I F L R T ( R F L ( k ) ) Probability of correctly identifying the FLS in RFL(k) in the kth simulation with a retransmission mechanism
P C I F L i ( R F L ( k ) ) Probability of correctly identifying the FLS in RFL(k) for the ith retransmission in the kth simulation
OFOther Feeder
EOFEnd of Feeder

References

  1. Advanced Distribution Automation; EPRI 2006 Portfolio; EPRI: Palo Alto, CA, USA, 2006.
  2. The Value of Distribution Automation; PIER Final Project Report, CEC 500-2007-103; Navigant Consulting Inc.: Burlington, MA, USA, March 2009.
  3. Fault Management in Electrical Distribution Systems; Final Report of the CIRED Working Group WG03 Fault Management; CIRED: Liège, Belgium, 1999.
  4. Muench, F.J.; Wright, G.A. Fault indicators: Types, strengths & applications. IEEE Trans. Power Appl. Syst. 1982, PAS-103, 3688–3693. [Google Scholar]
  5. Smallwood, C.L.; Lattner, M.; Gardner, T. Expansion of distribution automation with communicating faulted circuit indicators. In Proceedings of the IEEE Rural Electric Power Conference (REPC), Chattanooga, TN, USA, 10–13 April 2011; pp. B6-1–B6-6. [Google Scholar]
  6. Gong, Y.F.; Guzman, A. Distribution feeder fault location using IED and FCI information. In Proceedings of the 64th Annual Conference on Protective Relay Engineers, College Station, TX, USA, 11–14 April 2011; pp. 168–177. [Google Scholar]
  7. Hodgson, S. The use GSM and web based SCADA for monitoring fault passage indicators. In Proceedings of the 2010 IEEE PES Transmission and Distribution Conference and Exposition, New Orleans, LA, USA, 20–22 April 2010. [Google Scholar]
  8. Angerer, F.M. New developments in faulted circuit indicators help utilities reduce cost and improve service. In Proceedings of the IEEE Rural Electric Power Conference (REPC), North Charleston, SC, USA, 27–29 April 2008. [Google Scholar]
  9. Teng, J.H.; Luan, S.W.; Huang, W.H.; Lee, D.J.; Huang, Y.F. A Cost-Effective Fault Management System for Distribution Systems with Distributed Generators. Int. J. Electr. Power Energy Syst. 2015, 65, 357–366. [Google Scholar] [CrossRef]
  10. Chollot, Y.; Mecreant, J.; Leblond, D.; Cumunel, P. New solution of fault directional detection for MV fault passage indicators. CIRED—Open Access Proc. J. 2017, 2017, 1326–1329. [Google Scholar] [CrossRef]
  11. Shahsavari, A.; Mazhari, S.M.; Fereidunian, A.; Lesani, H. Fault indicator deployment in distribution systems considering available control and protection devices: A multi-objective formulation approach. IEEE Trans. Power Syst. 2014, 29, 2359–2369. [Google Scholar] [CrossRef]
  12. Ho, C.Y.; Lee, T.E.; Lin, C.H. Optimal placement of fault indicators using immune algorithm. IEEE Trans. Power Syst. 2011, 26, 38–45. [Google Scholar] [CrossRef]
  13. Almeida, M.C.; Costa, F.F.; de Souza, S.X.; Santana, F. Optimal placement of faulted circuit indicators in power distribution systems. Elect. Power Syst. Res. 2011, 81, 699–706. [Google Scholar] [CrossRef]
  14. Usida, W.F.; Coury, D.V.; Flauzino, R.A.; da Silva, I.N. Efficient placement of fault indicators in an actual distribution system using evolutionary computing. IEEE Trans. Power Syst. 2012, 27, 1841–1849. [Google Scholar] [CrossRef]
  15. Džafić, I.; Jabr, R.A.; Henselmeyer, S.; Ðonlagić, T. Fault Location in Distribution Networks through graph marking. IEEE Trans. Smart Grid 2018, 9, 1345–1353. [Google Scholar] [CrossRef]
  16. Farajollahi, M.; Fotuhi-Firuzabad, M.; Safdarian, A. Deployment of fault Indicator in distribution networks: A MIP-based approach. IEEE Trans. Smart Grid 2018, 9, 2259–2267. [Google Scholar] [CrossRef]
  17. Teng, J.H.; Huang, W.H.; Luan, S.W. Automatic and fast faulted line-section location method for distribution systems based on fault indicators. IEEE Trans. Power Syst. 2014, 29, 1653–1662. [Google Scholar] [CrossRef]
  18. Koreneva, E. Evaluation of practical experience of fault indicator performance in medium voltage networks. CIRED—Open Access Proc. J. 2017, 2017, 1117–1119. [Google Scholar] [CrossRef]
  19. IEEE Standard for Information Technology—Wireless Medium Access Control (MAC) and Physical Layer (PHY) Specifications for Low-Rate Wireless Personal Area Networks (LR-WPANs); IEEE Standard 802.15.4-2003; IEEE: Piscataway, NJ, USA, 2006.
  20. ZigBee Specification; ZigBee Document 053474r17; ZigBee Alliance: Davis, CA, USA, 2008.
  21. Gezer, C.; Niccolini, M.; Buratti, C. An IEEE 802.15.4/ZigBee based wireless sensor network for energy efficient buildings. In Proceedings of the IEEE 6th International Conference on Wireless and Mobile Computing, Networking and Communications (WiMob), Niagara Falls, ON, Canada, 11–13 October 2010; pp. 486–491. [Google Scholar]
  22. Smart Energy Profile Marketing Requirements Document (MRD); ZigBee Alliance: Davis, CA, USA, 2009.
  23. Yi, P.; Iwayemi, A.; Zhou, C. Developing ZigBee deployment guideline under WiFi interference for smart grid applications. IEEE Trans. Smart Grid 2011, 2, 110–120. [Google Scholar] [CrossRef]
  24. Shin, S.Y.; Park, H.S.; Choi, S.; Kwon, W.H. Packet error rate analysis of ZigBee under WLAN and Bluetooth Interferences. IEEE Trans. Wirel. Commun. 2007, 6, 2825–2830. [Google Scholar] [CrossRef]
  25. Eren, H.; Fadzil, E. Technical challenges for wireless instrument networks—A Case study with ZigBee. In Proceedings of the 2007 IEEE Sensors Applications Symposium, San Diego, CA, USA, 6–8 February 2007; pp. 1–6. [Google Scholar]
  26. Guo, W.; Healy, W.M.; Zhou, M. An experimental study of interference impacts on ZigBee-based wireless communication inside buildings. In Proceedings of the 2010 International Conference on Mechatronics and Automation (ICMA), Xi’an, China, 4–7 August 2010; pp. 1982–1987. [Google Scholar]
  27. Xiao, W.; Sun, Y.; Liu, Y.; Yang, Q. TEA: Transmission error approximation for distance estimation between two Zigbee devices. In Proceedings of the International Workshop on Networking, Architecture, and Storages, Shenyang, China, 1–3 August 2006. [Google Scholar]
  28. “Reed Switches,” Meder Electronic. Available online: http://www.meder.com/info-reed-switch4.html (accessed on 13 July 2013).
  29. Teng, J.H. A direct approach for distribution system load flow solutions. IEEE Trans. Power Del. 2003, 18, 882–887. [Google Scholar] [CrossRef]
Figure 1. Concept of a reed-switch-based Fault Current Indicator (FCI).
Energies 11 02582 g001
Figure 2. Hardware architecture of the ZigBee-based FCI. MCU: Micro-controller Unit; IRQ: Interrupt Request.
Energies 11 02582 g002
Figure 3. Basic concept of a Fault Management System (FMS).
Energies 11 02582 g003
Figure 4. Architecture of the communication evaluation platform.
Energies 11 02582 g004
Figure 5. Human–Machine Interface (HMI) of the proposed communication evaluation software.
Energies 11 02582 g005
Figure 6. Google Map used for candidate location evaluation.
Energies 11 02582 g006
Figure 7. Different fault rates in feeder or branch sections.
Energies 11 02582 g007
Figure 8. Fault information forwarded correctly.
Energies 11 02582 g008
Figure 9. Fault information forwarded incorrectly.
Energies 11 02582 g009
Figure 10. One-line diagram of an actual distribution system.
Energies 11 02582 g010
Figure 11. Faulted Line Sections (FLSs) and Faulted Line Currents (FLCs) for the proposed method.
Energies 11 02582 g011
Figure 12. Event probability for stochastic analysis based on the Monte Carlo method.
Energies 11 02582 g012
Figure 13. Flowchart of proposed systematic effectiveness assessment methodology. CDF: Cumulative Distribution Function; PDF: Probability Distribution Function; PSR: Packet Success Rate; FMS: Fault Management System; FLS: Faulted Line Section.
Energies 11 02582 g013
Figure 14. Candidate locations for FCI placement obtained from Google Maps. EOF: End of Feeder.
Energies 11 02582 g014
Figure 15. Photographs of the candidate locations for FCI01 and FCI02.
Energies 11 02582 g015
Figure 16. PSR PDFs for the experimental feeder. (a) PDF of LS_1; (b) PDF of LS_2; (c) PDF of LS_3; (d) PDF of LS_4; (e) PDF of LS_5.
Energies 11 02582 g016
Figure 17. Photographs of the candidate locations for FCI01 and FCI02.
Energies 11 02582 g017
Figure 18. PSR PDF after FCI01 location adjusted.
Energies 11 02582 g018
Table 1. Topography information of fault current indicator (FCI) placement.
Line SectionFCI No.Distances (m)Angle
FromTo
101 *02470Small
20203477None
30304642None
40405130Large
50506430None
606EOF500None
* Rear-End Processing System, EOF: End of Feeder.
Table 2. Packet Success Rate (PSR) Probability Distribution Function (PDF) of each line section.
Line SectionMinimum (%)Maximum (%)Mean (%)Standard Deviation (%)
10.4081.9020.04514.870
292.60100.0098.8710.833
390.00100.0097.0542.037
474.8094.5091.7603.647
541.7090.0079.3417.852
Table 3. PSR parameters of each LS after FCI01 location adjusted.
Line SectionPSR (%)
MeanStandard Deviation
LS_197.6894.574
LS_298.8710.833
LS_397.0542.037
LS_491.7603.647
LS_579.3417.852
Table 4. PSR and failure rate of each line section.
LS No.FCI No.PSR (%)Failure Rate (Times Per Year)
FromToMeanStandard Deviation
LS_101 *0297.6894.5740.021
LS_2020398.8710.8330.035
LS_3030497.0542.0370.042
LS_4040591.7603.6470.023
LS_5050679.3417.8520.047
LS_606EOF--0.019
* Rear-End Processing System, EOF: End of Feeder.
Table 5. PSR results for the FMS.
Line SectionPSR (%)
MeanStandard Deviation
LS_187.12310.523
LS_289.45310.802
LS_386.27210.706
LS_485.64310.204
LS_578.4377.959
Table 6. PSR results for a Fault Management System (FMS) with 1, 5, and 10 retransmissions.
Line SectionsPSR (%)
1 Retransmission5 Retransmissions10 Retransmissions
MeanStandard DeviationMeanStandard DeviationMeanStandard Deviation
LS_189.37611.39393.7177.78394.5327.102
LS_289.67611.01992.8597.89693.7237.218
LS_386.54810.88590.8178.03791.9877.433
LS_485.64610.54189.8927.32390.8206.701
LS_578.3908.40784.7463.03985.8312.260
Table 7. Faulted Line Sections (FLSs) for the actual distribution system.
FLSAdjacent FCIsFLSAdjacent FCIsFLSAdjacent FCIs
11, 21313, EOF2525, 26, 31
22, 3, 91414, 15, 202626, 27
33, 41515, 16, 18, 192727, 28, 29
44, 51616, 172828, EOF
55, 6, 131717, OF2929, 30
66, 71818, EOF3030, EOF+
77, 8, 22, 33, 341919, EOF3131, 32
88, OF2020, 213232, OF
99, 102121, OF3333, EOF
1010,112222, 23, 243434, 35
1111, 122323, EOF3535, EOF
1212, OF2424, 25--
OF and EOF mean other feeder and end of feeder, respectively.

