Abstract
Polyvinyl chloride (PVC) electric wires were subjected to dechlorination in subcritical water at three different temperatures in a high-pressure reactor. About 2.09, 73.08, and 95.96 wt % of chlorine in PVC wires was removed during dechlorination at 200 °C, 250 °C, and 300 °C, respectively. The solid residues were analyzed and characterized by thermogravimetry, at three different heating rates (5 °C, 10 °C, and 20 °C/min) in inert and oxidizing atmosphere. With the purpose of studying the emission of chlorinated pollutants, pyrolysis experiments at 850 °C were also performed in a laboratory-scale reactor with the dechlorinated materials, as well as with the original PVC electric wire. Polycyclic aromatic hydrocarbons (PAH) formation increased, but chlorobenzenes (ClBz) and chlorophenols (ClPh) formation decreased as the temperature of dechlorination increased; naphthalene was the most abundant PAH and monochlorobenzene and monochlorinated phenols (3-+4-) were the most abundant chlorinated compounds.
1. Introduction
At present, there are more than 20 different types of electric wires available, designed for applications ranging from transmission to heavy industrial use. Electric wires consist of one conductor, which is usually copper or aluminum, covered with insulating material, which can be polyvinyl chloride (PVC), polyethylene (PE), rubber, etc. [1].
Electric wires are designed with a limited useful life [2], normally they work for 10–30 years, so they become obsolete after a certain period of time. Consequently, electric wires waste generation has increased noticeably in recent years. Therefore, it is essential to take appropriate measures about the fate of this waste to avoid a negative environmental impact. Prevention of the generation of this waste, reuse and recycling are essential to preserve the environment and public health [3].
Recycling is crucial, not only to diminish the quantity of waste requiring treatment, but also to recover some of the raw materials, such as plastics and base metals, as well as to eliminate the hazardous compounds (heavy metals such as mercury, nickel, lead, cadmium, etc. and brominated flame retardants) [4]. The stages of recycling process are: (1) disassembly, (2) separation of metallic and non-metallic fractions, and (3) recycling of both fractions separately. The metallic fraction, which represents 50% of the total weight of electric wires [5], is considered the most valuable fraction and becomes part of new industrial processes, on the one hand, and, on the other, the non-metallic fraction is used for recycling for material, chemical, or energy recovery [2].
When plastics of electric wires waste are PVC, thermal treatment is turned into a very problematic way of recovery because important quantities of toxic or harmful compounds, such chlorophenols (ClPhs), chlorobenzenes (ClBzs), and polychlorodibenzo-p-dioxins and furans (PCDD/Fs), are emitted during the thermal decomposition of PVC in an inert and oxidizing atmosphere [6] and the thermal decomposition of PVC electric wires in air [5]. One solution is the development of removal techniques of chlorine from PVC electric wires before its thermal treatment.
Catalytic dechlorination and hydrothermal treatment with subcritical or supercritical fluids are methods for removal of chlorine present in PVC wastes. Catalytic dechlorination involves the selective break of one or more C‒Cl bonds, lowering toxicity and giving rise to reusable materials [7]. Such a phenomenon is due to addition of large volume of catalyst. Catalyst poisoning may be a problem during scale-up of the procedure, as well as the high operation temperature (400–1000 °C), nonuniform heat transfer, low yields obtained and excessive char and gas formation [8].
Subcritical or supercritical fluids have been successfully applied as a simpler and environmental friendly methods for decomposition of various polymer materials [8,9,10,11,12].
Hydrothermal treatment with subcritical or supercritical water have become an effective and promising techniques to remove the chlorine contained in PVC-containing wastes [13] because these process present simple and fast reaction rates, and homogeneous reactions without limitations of mass transfer occur in these processes. However, subcritical water treatment presents advantages over supercritical water treatment, in addition to requiring lower temperatures and pressures, dechlorination reactions may be enhanced [14]. Dechlorination of methylene chloride was much faster using subcritical water than when using supercritical water [15].
Poerschmann et al. [16] subjected PVC to subcritical water treatment at 180–260 °C and concluded that dechlorination increased with the increase of treatment temperature. Xiu et al. [17] carried out subcritical water oxidation of waste printed circuit boards and PVC, obtaining a total dechlorination of PVC when the treatment temperature exceeded 250 °C. Kubátová et al. [14] obtained a solid residue that contained less than 1 wt % of chlorine after subcritical water treatment of PVC at 300 °C. In the same research line, Endo and Emori [18] examined the hydrothermal degradation of PVC under high pressure and high temperature, concluding that the dechlorination efficiency could reach 100% at 300 °C.
In accordance with the previous studies, the objectives of this research are: (1) to assess the dechlorination efficiency of subcritical water treatment on PVC electric wire waste; (2) to identify the pollutants present in the water after the treatment; (3) to study the thermal degradation of the dechlorinated residues, as well as the decomposition of the original PVC electric wire by thermogravimetry; and (4) to analyze pollutant emissions during the thermal decomposition in inert atmosphere of the dechlorinated residues and the original PVC electric wire, with a particular focus on the chlorinated pollutants.
2. Materials and Methods
The electric wire was supplied by General Cable, Co (Highland Heights, KY, USA). The cover material is PVC, the insulation material is reticulated polyethylene, and the conductor is copper [19].
As only the non-metallic fraction (cover and insulation material) was used in this study, this fraction was manually separated from the metallic fraction and it was crushed into small particles (<1 mm) using a cutting mill RETSCH SM200 (Haan, Germany). Figure 1 shows the original electric wire before and after the crushing process.
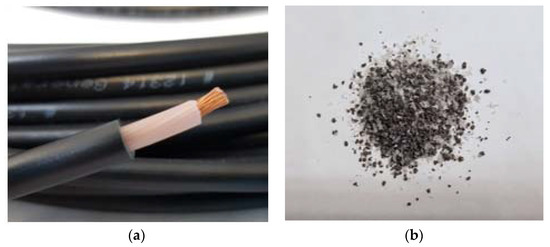
Figure 1.
Electric wire used in the runs (a) before crushing process; (b) after crushing process.
The sample was characterized. Elemental analysis was performed in elemental microanalyzer Thermo Finnigan Flash 1112 Series (Thermo Fisher Scientific, Waltham, MA, USA). This technique provided total content (wt %) of carbon, hydrogen, nitrogen, and sulfur present in the sample. Oxygen plus ash content was calculated by difference. The ash content was measured following the UNE-EN-14775:2009 [20] at 550 °C. The analysis of the rest of elements was performed in a sequential X-ray fluorescence spectrometer Philips Magix Pro PW2400 (Malvern Panalytical Ltd., Malvern, UK). The main objective of this technique is the elemental analysis, both qualitative and quantitative, of elements with an atomic number greater than 9. Table 1 shows the characterization of the cover and the insulation. The concentrations of the PVC wire are calculated as a weighted sum of the cover and insulation.

Table 1.
Characterization of the materials used in the study.
Dechlorination experiments with subcritical water were performed in a high-pressure batch reactor with stirring (volume of 1 L). Figure 2 shows the high-pressure reactor used in this study.
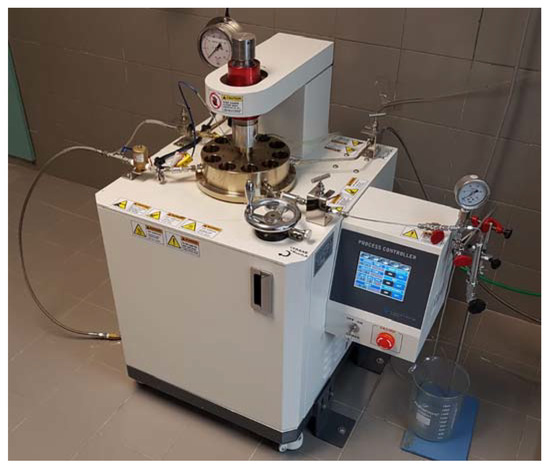
Figure 2.
High-pressure reactor used.
The parameters controlling the efficiency of this process are temperature, treatment time and solid/liquid (S/L) ratio [9]. Dechlorination runs were carried out at 200 °C, 250 °C, and 300 °C during 180 min, with a solid:liquid ratio (S/L) equal to 1:5 g/mL. In this way, treatment time and S/L ratio were not limiting factors in the dechlorination efficiency, based on the previous work done in a similar reactor working on the debromination of printed circuit boards waste [9].
During the dechlorination experiments, samples from the liquid phase were collected every hour and the remaining liquid from the reaction chamber was also collected after 24 h in order to evaluate the evolution of the dechlorination process with time. These liquid samples were analyzed for chlorine by ion chromatography, and so it was possible to tally the chlorine balance. In addition, these liquid samples were qualitative analyzed for organic compounds by GC-MS (Agilent GC 6890N/Agilent MS 5976N, Agilent Technologies, Santa Clara, CA, USA) following the US EPA method 8270D [21] as reference. Specific conditions of this analysis have been described in detail in a previous study by Soler et al. [22].
The solid residues obtained (they will be referred to as R200, R250, and R300, indicating the temperature of the treatment) were dried at 105 °C until they reached a constant weight. Elemental analysis and chlorine content of the dechlorinated residues were also determined.
TGA was performed on a Perkin Elmer (Waltham, MA, USA) thermogravimetric analyzer (model STA6000). PVC electric wires (before and after the dechlorination process) were subjected to three different heating rates (5 °C, 10 °C, and 20 °C/min) from room temperature up to 900 °C in inert and oxidizing atmospheres. The flow rate of carrier gas was set at 100 mL/min. For each run, approximately 8 mg of sample were used.
Prior to each TGA run, a blank run was carried out using the same experimental conditions but with the crucible empty to ensure the system errors were corrected. So, these weight values recorded for each experimental time were subtracted from the values obtained in the TGA runs with sample.
Duplicated runs were done in the thermobalance to prove the outstanding reproducibility of the thermobalance. Really good reproducibility was obtained for the decomposition of these samples.
Pyrolysis of original PVC and residues R200, R250, and R300 were performed in a moving tubular quartz reactor located inside a horizontal laboratory furnace described by Aracil et al. and Moltó et al. [6,23].
Once the set-point temperature was reached (850 °C in all runs), the sample was introduced in the horizontal furnace at constant speed (0.5 mm·s−1) using a quartz boat and maintained inside the reactor for 10 min, while the emitted pollutants were sampled for later analysis. A nitrogen flow of 300 mL/min (measured at 1 atm and 20 °C) was introduced in parallel to the sample movement during the experiment. The sample weight was 25 mg approximately in each experiment.
Before the experiments, a control run with no sample was realized under the same conditions (blank). The blank values were subtracted from the values obtained in the pyrolysis runs with sample.
The U.S. EPA method 26 [24] was applied to analyze the emissions of inorganic chlorine. The evolved gases were passed through two impingers that contained a dilute sulfuric acid solution (0.2 M) and two other impingers that contained a dilute sodium hydroxide solution (0.1 M). The HCl solubilizes in the acidic solution and forms chloride ions, whereas the Cl2 passes through to the alkaline solution where it is hydrolyzed to form a proton (H+), the chloride ion (Cl−), and hypochlorous acid (HClO). To facilitate the formation of a second chloride ion, sodium thiosulfate was added in excess to the alkaline solution. In this way, two chloride ions are formed for each molecule of Cl2. This experimental setup allows for analyzing HCl and Cl2 by ion chromatography (IC). Ion chromatograph model 850 Professional IC AnCat (Metrohm, Herisau, Switzerland) with chemical suppression and conductivity detector was employed, using a Metrosep A Supp 7–250 column (250 mm × 4 mm, Metrohm), a 0.8 mL/min flow rate of a 0.0036 M sodium carbonate solution and a 20 mL injection volume. Once that the standard calibration curves for IC analysis of the acid and alkaline solution was realized, a sample of water was injected in the equipment to determine if any Cl− appeared in the chromatogram. When they were no longer present, the samples were injected in the equipment.
A polyaromatic Amberlite® XAD-2 resin (Supelco, Bellefonte, DE, USA) was used to collect the semivolatile compounds generated during the experiment. This resin was placed at the exit of the furnace. Three internal standards were added to the resin before the extraction to determine the concentration of PAHs, ClBzs and ClPhs. Dr. Ehrenstorfer-Schäfers (Augsburg, Germany) supplied the deuterated standards used for the analysis of the PAHs and Wellington Laboratories (Ontario, Canada) supplied the 13C-labeled standards for ClPhs and ClBzs.
The next step was to extract the semivolatile compounds adsorbed to the resin with a mixture of dichloromethane/acetone (1:1 v/v) using ASE 100® Accelerated Solvent Extractor (Dionex‒Thermo Fisher Scientific, Waltham, MA, USA) following the U.S. EPA method 3545A [25]. The resultant extract was concentrated up to 1.5 mL using a rotary evaporator and straightaway with a moderate stream of nitrogen. Lastly, 3 L of 2000 g/mL anthracene-d10 (AccuStandard, New Haven, CT, USA) were added as a recovery standard.
PAHs, ClBzs, and ClPhs were analyzed by GC- MS (Agilent GC 6890N/Agilent MS 5976N, Agilent Technologies, Santa Clara, CA, USA) following the U.S. EPA method 8270D [21] as reference. Specific conditions of this analysis, the identification and quantification of the compounds have been done in the same way as in the previous work [22]. A capillary column HP-5 MS (30 m × 0.25 mm i.d.; 0.25 μm film thickness, Agilent, Santa Clara, CA, USA) was used for the analysis of PAHs and ClBzs, whereas a ZB-5MSi (30 m × 0.25 mm i.d.; 0.25 μm film thickness, Phenomenex, Torrance, CA, USA) was employed for the analysis of ClPhs. The injection volume was 1 μL in split 1:25 for the analysis of PAHs and in splitless mode for the analysis of ClBzs and ClPhs. The oven temperature program for the analysis of PAHs, ClBzs and ClPhs consisted of a first isothermal step at 40 °C (5-min hold) then heating up to 290 °C at 12 °C/min (6-min hold) and finally heating up to 320 °C at 20 °C/min (10-min hold). The identification of the 16 priority PAHs [26] from the analysis in SCAN mode, were performed with a standard of each compound by calibration comparing the spectra and the retention time of the primary ion. The quantification of PAHs was done using the peak area of the corresponding primary ion, according to the U.S. EPA method 8270D [21]. ClBzs and ClPhs were analyzed in the SIR mode and the identification of each isomer was performed comparing the retention times and the primary/secondary ion area ratio with that obtained in the calibration with the labeled compounds. The quantification of these compounds was based on the sum of areas of the two most abundant ions.
3. Results
3.1. Dechlorination Treatment
The rate of dechlorination depends on several factors including temperature, time of the treatment and solid/liquid ratio (S/L). The reaction time was set to 3 h and the ratio of PVC wire/water was fixed in 1:5 by weight. In this way, in this study, the most important factor influencing the dechlorination efficiency is the reaction temperature.
The process took place at the water vapor pressure at the corresponding temperature (approximately 1.6 MPa at 200 °C, 4.0 MPa at 250 °C, and 8.6 MPa at 300 °C) giving rise to a partial degradation of the original PVC wire.
Figure 3 shows the chlorine concentration in the liquid at different reaction times during the dechlorination treatment carried out at 200 °C, 250 °C, and 300 °C. The initial chlorine concentration corresponds to the sample from the liquid phase collected when the reaction chamber reached the treatment temperature, after heating up at approximately 3 °C/min.
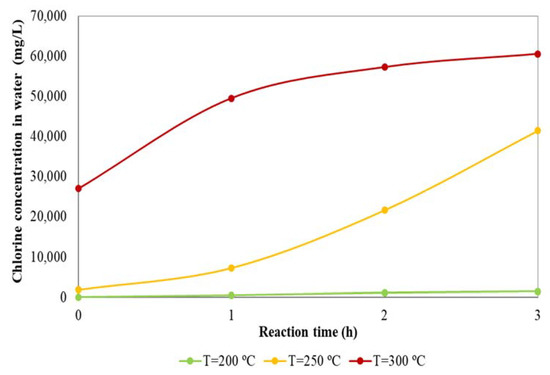
Figure 3.
Effects of temperature and time on dechlorination process.
As can be observed, dechlorination was not almost visible at 200 °C, whereas dechlorination increased significantly at 250 °C, because at this temperature region thermal degradation of PVC takes places. Xiu et al. [17] also concluded that dechlorination of PVC was no noticeable below 200 °C, but the dechlorination reached almost 100% above 300 °C. Regarding to the effect of the reaction time, it can be observed that the chlorine concentration in liquid phase at all process temperatures increased with increasing time. Therefore, the dechlorination treatment was more effective as reaction time increased. At 300 °C the initial dechlorination rate (slope of the curves presented in Figure 3), is quite high. Nevertheless, it seems that after 2 h the rate decreases in an important way, indicating that a maximum level of dechlorination has been reached.
As can be seen in Table 2, all the experiments were carried out with 50 g of PVC wire and a final solid yield of 79.2, 40.2, and 23.9 wt % was obtained at 200 °C, 250 °C, and 300 °C, respectively. The chlorine content of the solid residues obtained after the treatment was measured by X-ray fluorescence spectrometry, obtaining 27.9, 15.1, and 3.8 wt %, at 200 °C, 250 °C, and 300 °C, respectively. These results show that the chlorine content in the solid residue decreased with the increase dechlorination temperature. As a result, the subcritical water treatment was more effective as the dechlorination temperature increased. Poerschmann et al. [16] also subjected PVC to dechlorination treatment in subcritical water at high temperatures (180–260 °C) and concluded that dechlorination increased with increasing treatment temperature.
Table 2.
Results of dechlorination experiments.
The percentage of chlorine removed can be calculated as follows:
where mCl i is the initial weight of chlorine in the PVC wire and mCl f is the weight of chlorine in the solid residue obtained.
According to the chlorine content in the solid residues, hardly any chlorine was removed in the subcritical water treatment at 200 °C, while a total of 73.08 and 95.96 wt % of chlorine was removed when the dechlorination treatment was performed at 250 °C and 300 °C, respectively. This chlorine should have been removed in the gas or liquid phase.
Yu et al. [7] concluded that the chlorine of PVC was not transferred to gas phase, because it was nearly completely transferred to liquid phase. For this reason, the chlorine content in the gas phase was not analyzed in this study. The dechlorination efficiency (DE) can be also calculated by the following equation:
The higher the treatment temperature, the greater was the dechlorination efficiency, being 2.48, 73.06 and 95.45 wt %, for the runs at 200 °C, 250 °C, and 300 °C. The dechlorination efficiency values obtained by both previous equations were practically similar; it can be concluded that the chlorine removed of original PVC wire was retained in liquid phase. Therefore, the dechlorination treatment at high pressure and high temperature could break the chemical bonds of the polymeric matrix, favoring PVC degradation. Possible decomposition pathways of PVC have been proposed by several authors [27,28,29].
In this way, the subcritical water treatment proved to be an efficacious method to remove the chlorine present in PVC electric wires. Endo and Emori [18] studied the hydrothermal degradation of PVC under high pressure and concluded that a total dechlorination of the material could be possible at 300 °C.
Upon hydrothermal treatment, the pH of liquid phase was measured, and it was obtained that the pH dropped progressively with the treatment temperature, obtaining pH values of 7.18, 2.40, and 2.84 at 200 °C, 250 °C, and 300 °C, respectively, due to the release of HCl in the solution. Phenol, benzoic acid, benzaldehyde, cyclohexanone and methyl cyclopentane were identified in the liquid phase. These compounds were also determined in liquid phase after dechlorination treatment by Takeshita et al. [28], obtaining a total amount of these compounds of 179 mg/L.
Figure 4 shows the solid residues obtained after dechlorination treatment. The solid residues acquired a browner color as the operating temperature increased.
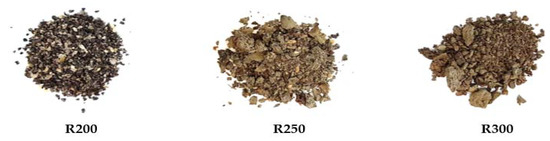
Figure 4.
Solid residues obtained after dechlorination treatment.
Table 3 shows the elemental analysis results of the solid residues. Carbon and hydrogen content in the solid residue increased as the operating temperature increased. The content of H was not decreased due to hydrolysis reaction. Therefore, the chlorine should be replaced by the base [30].
Table 3.
Elemental analysis of the solid residue obtained and net calorific values.
Oxygen content reach to about 8–20% in solid residues, decreasing with the increase of treatment temperature. The net calorific value of the residues also increased gradually, obtaining a maximum value of 37,766 kJ/kg in the solid residue obtained after the treatment at 300 °C. Lu et al. [30] and Takeshita et al. [28] also obtained similar net calorific values of the residual solid after dechlorination treatment (35,798 kJ/kg at 260 °C and 38,749 kJ/kg at 300 °C, respectively). Therefore, the solid residues may be employed as high-quality fuel for blast furnace or a feedstock for producing activated carbon, etc. because their net calorific values are as good as coal and coke (18,800–33,500 and 25,100–31,400 kJ/kg, respectively) [21]. In addition, the ratio of H/C decreased, indicating that the unsaturation degree of the hydrolysis product increased. It can be concluded that the hydrolysis reaction of PVC includes the cracking of C–C chain and substitution of Cl with −OH [30].
3.2. Thermogravimetric Analysis
Thermogravimetric experiments in inert (pyrolysis) and oxidizing atmosphere (combustion) were performed to characterize dechlorinated residues and the original PVC wire. Dynamic runs at 5 °C, 10 °C, and 20 °C/min were carried out for each material from room temperature up to 900 °C. Figure S1 shows details of the TG curves obtained during the pyrolysis of the original PVC wire (only plastic fraction), R200, R250, and R300. Figure S2 presents the thermal decomposition in air.
All samples present mass loss curves moving to the right (towards higher temperatures) with the increase of the heating rate. This is a habitual behavior that has been observed in many materials; this can be explained by just taking the kinetic law into consideration [31,32,33]. On the other hand, thermal decomposition of the materials accelerates in the presence of oxygen, since the oxidation of the final pyrolytic residue occurs, giving rise to out a higher mass loss.
Figure 5 shows a comparison of the curves obtained at 10 °C/min for the four materials tested in nitrogen, and Figure 6 is the one corresponding to combustion in air. As can be observed (Figure 5), the mass loss curve of the original PVC wire presents three main stages (centered at about 300 °C, 480 °C, and 780 °C). The decomposition of R200 is very similar to that of the original wire, but there is a great change in the thermal decomposition of R250 and R300. In this case, only the first two stages are present. This can be due to the obtaining of a more degraded material when the pretreatment occurred at higher temperature. The dechlorinated residues begin to decompose at lower temperatures, which means a further degradation of the polymeric matrix when pretreatment temperature increases. The TG runs performed in oxidizing atmosphere (Figure 6) present an analogous variation when comparing the diverse materials tested.
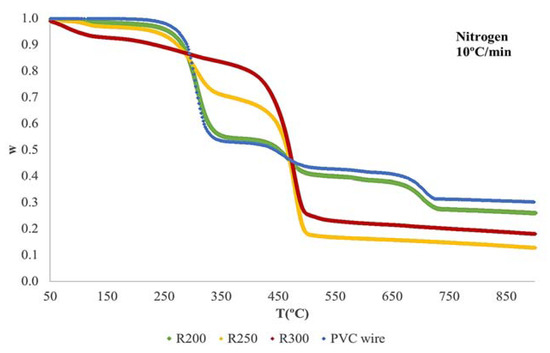
Figure 5.
TG-curves obtained during the pyrolysis at 10 °C/min.
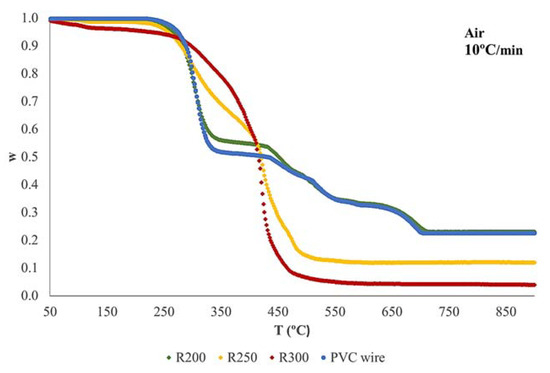
Figure 6.
TG curves obtained during the combustion at 10 °C/min.
3.3. Pollutant Emissions in Pyrolysis Runs
As mentioned in Section 2, pyrolysis of the residues R200, R250, and R300, as well as of the original PVC wire, were carried out in a horizontal furnace at 850 °C to check for the pollutant formation.
3.3.1. Hydrogen Halide and Halogen Emissions
Inorganic chlorine emissions in the pyrolysis runs are shown in Table 4. Emissions significantly decreased when the material had been subjected to dechlorination process at the higher temperature, i.e., the emission decreased as the dechlorination temperature increased. The materials obtained after dechlorination at 200 °C, 250 °C, and 300 °C emitted 4.0%, 81.9%, and 92.4% less inorganic chlorine than the starting material, respectively.
Table 4.
Emission of inorganic chlorine during the pyrolysis at 850 °C.
Emission factors of HCl were higher than the ones for Cl2 for all materials, except the residue obtained in dechlorination treatment at 300 °C. This behavior was also found for other wastes, such as printed circuit boards (PCBs) [34] and debrominated PCBs [9].
3.3.2. PAHs
Figure 7 shows the emissions of the 16 priority PAHs during pyrolysis at 850 °C. Data are also provided in Table S1. All the samples presented similar emission pattern of these compounds. The most abundant compound was naphthalene, followed by acenaphthylene, phenanthrene, and fluorene.
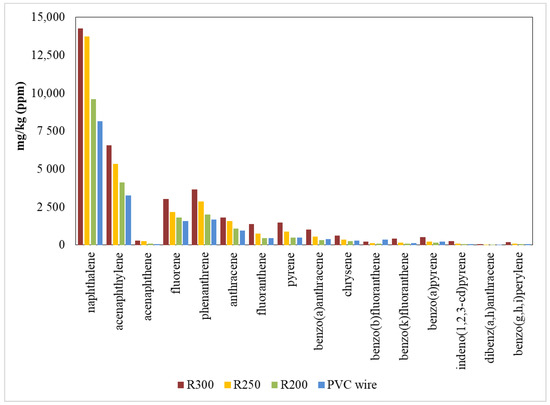
Figure 7.
PAH emissions during the pyrolysis at 850 °C.
These results coincide with several previous studies [5,9,35,36] where the naphthalene was the principal PAH emitted during the thermal decomposition of different wastes.
PAH formation effectively increased during pyrolysis as the temperature of hydrothermal dechlorination increased, i.e., the emission factors increased when pyrolysis was performed with the dechlorinated residues obtained from the dechlorination process at higher temperatures. PAH formation reached its maximum in pyrolysis at 850 °C because the thermal decomposition in inert atmosphere was confirmed as the primary source of PAH formation [37] Total PAH yields in pyrolysis were 18,070 mg/kg for the original PVC wire; 20,690, 29,260, and 35,710 mg/kg for the dechlorinated materials obtained at 200 °C, 250 °C, and 300 °C, respectively. These results are of the same order of magnitude as those obtained in a previous study done by Aracil et al. [6], where the total yield was 35,000 mg/kg in the pyrolysis of PVC pellets at 850 °C.
3.3.3. ClBzs
Table 5 presents the detail of ClBz congeners and the total amount of ClBzs in the pyrolysis at 850 °C. Total yields of ClBzs were 1751 mg/kg for the original PVC wire, 2178, 928, and 500 mg/kg for the dechlorinated materials prepared at 200 °C, 250 °C, and 300 °C, respectively. The maximum total yield was obtained for the decomposition of the sample dechlorinated at 200 °C, as it presented the highest chlorine content. Therefore, the total yields of ClBzs decreased with the increase of dechlorination temperature to which the samples had been subjected. This can indicate that the formation of chlorine structures during the pyrolysis is less effective. In this way, the increase in the emission of PAHs from this material can be justified. PAHs could transform into chlorinated species at temperatures between 300 °C and 1000 °C [38].
Table 5.
Yields of ClBzs during the pyrolysis at 850 °C.
Respect to the ClBz congener distribution, all samples present the same trend. For all the materials, mono- and dichlorinated congeners were the main products emitted, particularly dichlorinated congeners with chorine in the position 1,2- and 1,4-. Aracil et al. [6] also found a predominance of mono- and dichlorobenzenes in pyrolysis of PVC at 850 °C.
Conesa et al. [5] analyzed ClBz emissions during thermal treatment of two types of wires (PVC wire and halogen-free wire) and concluded that ClBz formation was higher for the PVC wire, and increased in the presence of metal. Therefore, it can be concluded that hydrothermal dechlorination could reduce the formation of chlorinated compounds in thermal processes, now that the material obtained after dechlorination treatment at 300 °C emitted 71.4% less ClBzs than the original PVC wire during the pyrolysis at 850 °C.
3.3.4. ClPhs
Table 6 presents the total amount of ClPhs detected in the pyrolysis runs carried out at 850 °C. ClPh total yields decreased with the increase of dechlorination temperature to which the samples had been subjected. ClPh total yields of all solid residues (100.7 mg/kg, 57.5 mg/kg, and 56.9 mg/kg for the solid residue obtained at 200 °C, 250 °C, and 300 °C, respectively) were lower than total yield from the original PVC wire (113.2 mg/kg). Therefore, subcritical water treatment could decrease the emissions of chlorinated compounds in thermal processes, now that R300 emitted 49.7% less ClPhs than the original PVC wire.
Table 6.
Emission of ClPHs during the pyrolysis at 850 °C.
Table 6 also shows the detail of ClPh congeners. In all the runs, monochlorinated phenols (3-+4-) were the most abundant congeners, followed by 3,5-dichlorinated phenol. Kaivosoja et al. [39] and Soler et al. [22] also concluded that the most emitted ClPhs were monochlorinated phenols (3-+4-) in their studies about thermal treatment of different wastes.
4. Conclusions
Subcritical water treatment for dechlorination of PVC wire was more effective as the treatment temperature increased. Therefore, dechlorination efficiency increased as the process temperature increased, obtaining a maximum efficiency of 95.96 wt % at 300 °C. The concentration of chlorine in solid residue decreased because the chlorine present in PVC wire was nearly completely transferred to the water. In addition, these solid residues obtained high net calorific values, with a maximum value of 37,766 kJ/kg for the solid residue obtained after the treatment at 300 °C, which may consequently be employed as high-quality fuel.
TG curve of the original PVC wire presented three main stages, but as the material was subjected to a more severe dechlorination the TG curve presented fewer stages; the decomposition of R200 was very similar to that of the original wire, while the decomposition of R250 and R300 only presented the first two stages and one stage, respectively. Therefore, dechlorination process produced a more degraded material as the treatment temperature increased.
Regarding pollutant emissions during pyrolysis, emissions of inorganic chlorine significantly decreased when increasing the increase of the dechlorination temperature. R200, R250, and R300 emitted 4.0%, 81.9%, and 92.4% less inorganic chlorine, respectively, than the original PVC wire. PAH formation increased as the temperature of dechlorination process increased. This increase in the emission of PAHs can justify that the formation of chlorine structures was less effective during the pyrolysis. Thus, the emissions of organic chlorinated compounds (ClBzs and ClPhs) decreased with the increase of dechlorination temperature to which the samples had been subjected and total yields originating from the thermal decomposition of dechlorinated residues were lower than the total yield from the original PVC wire. All the materials emitted many more ClBzs than ClPhs. Furthermore, the main chlorinated compounds were monochlorobenzene and monochlorinated phenols (3-+4-).
Therefore, it can be concluded that the subcritical water treatment was an efficient method for the dechlorination of PVC wires and could reduce the formation of chlorinated compounds in subsequent thermal processing of this waste.
Supplementary Materials
The following are available online at http://www.mdpi.com/1996-1073/11/10/2612/s1, Figure S1: TG-curves obtained during the pyrolysis of: (a) R200, (b) R250, (c) R300 and (d) original PVC wire. Figure S2: TG-curves obtained during the combustion of: (a) R200, (b) R250, (c) R300 and (d) original PVC wire. Table S1: Yields of PAHs during the pyrolysis at 850 °C.
Author Contributions
Conceptualization, J.A.C. and N.O.; Methodology, A.S.; Run Performance and Analysis, A.S.; Writing—Original Draft Preparation, A.S.; Writing—Review & Editing, J.A.C., N.O. and A.S.; Supervision, J.A.C. and N.O.
Funding
This research was funded by Ministry of Economy, Industry and Competitiveness (Spain) grant number CTQ2016-76608-R and Valencian Community Government (Spain) grant number PROMETEOII/2014/007.
Conflicts of Interest
The authors declare no conflict of interest.
References
- Sheih, S.W.; Tsai, M.S. Hot water separation process for copper and insulating material recovery from electric cable waste. Waste Manag. Res. 2000, 18, 478–484. [Google Scholar] [CrossRef]
- Hagstrom, B.; Hampton, R.N.; Helmesjo, B.; Hjertberg, T. Disposal of cables at the “end of life”; some of the environmental considerations. IEEE Electr. Insul. Mag. 2006, 22, 21–30. [Google Scholar] [CrossRef]
- Directive, E.C. Directive 2012/19/EU of the European Parliament and of the Council of 4 July 2012 on Waste Electrical and Electronic Equipment (WEEE). Off. J. Eur. Union L 2012, 197, 38–71. [Google Scholar]
- Buekens, A.; Yang, J. Recycling of WEEE plastics: A review. J. Mater. Cycles Waste Manag. 2014, 16, 415–434. [Google Scholar] [CrossRef]
- Conesa, J.A.; Egea, S.; Moltó, J.; Ortuño, N.; Font, R. Decomposition of two types of electric wires considering the effect of the metal in the production of pollutants. Chemosphere 2013, 91, 118–123. [Google Scholar] [CrossRef] [PubMed]
- Aracil, I.; Font, R.; Conesa, J.A. Semivolatile and volatile compounds from the pyrolysis and combustion of polyvinyl chloride. J. Anal. Appl. Pyrolysis 2005, 74, 465–478. [Google Scholar] [CrossRef]
- Yu, J.; Sun, L.; Ma, C.; Qiao, Y.; Yao, H. Thermal degradation of PVC: A review. Waste Manag. 2016, 48, 300–314. [Google Scholar] [CrossRef] [PubMed]
- Wang, Y.; Zhang, F.-S. Degradation of brominated flame retardant in computer housing plastic by supercritical fluids. J. Hazard. Mater. 2012, 205-206, 156–163. [Google Scholar] [CrossRef] [PubMed]
- Soler, A.; Conesa, J.A.; Ortuño, N. Emissions of brominated compounds and polycyclic aromatic hydrocarbons during pyrolysis of E-waste debrominated in subcritical water. Chemosphere 2017, 186, 167–176. [Google Scholar] [CrossRef] [PubMed]
- Cheng, H.; Huang, H.; Zhang, J.; Jing, D. Degradation of carbon fiber-reinforced polymer using supercritical fluids. Fibers Polym. 2017, 18, 795–805. [Google Scholar] [CrossRef]
- Zhu, N.-M.; Wang, C.-F.; Zhang, F.-S. An integrated two-stage process for effective dechlorination of polychlorinated biphenyls in subcritical water in the presence of hydrogen donors. Chem. Eng. J. 2012, 197, 135–142. [Google Scholar] [CrossRef]
- Oh, S.C.; Kwak, H.; Bae, S.-Y. A Kinetic Analysis of Polymer Degradation in Supercritical Fluid. J. Chem. Eng. Jpn. 2006, 39, 1004–1009. [Google Scholar] [CrossRef]
- Zhao, P.; Li, Z.; Li, T.; Yan, W.; Ge, S. The study of nickel effect on the hydrothermal dechlorination of PVC. J. Clean. Prod. 2017, 152, 38–46. [Google Scholar] [CrossRef]
- Kubátová, A.; Lagadec, A.J.M.; Hawthorne, S.B. Dechlorination of lindane, dieldrin, tetrachloroethane, trichloroethene, and PVC in subcritical water. Environ. Sci. Technol. 2002, 36, 1337–1343. [Google Scholar] [CrossRef] [PubMed]
- Marrone, P.A.; Arias, T.A.; Peters, W.A.; Tester, J.W. Solvation effects on kinetics of methylene chloride reactions in sub- and supercritical water: Theory, experiment, and ab initio calculations. J. Phys. Chem. A 1998, 102, 7013–7028. [Google Scholar] [CrossRef]
- Poerschmann, J.; Weiner, B.; Woszidlo, S.; Koehler, R.; Kopinke, F.-D. Hydrothermal carbonization of poly(vinyl chloride). Chemosphere 2015, 119, 682–689. [Google Scholar] [CrossRef] [PubMed]
- Xiu, F.-R.; Qi, Y.; Zhang, F.-S. Co-treatment of waste printed circuit boards and polyvinyl chloride by subcritical water oxidation: Removal of brominated flame retardants and recovery of Cu and Pb. Chem. Eng. J. 2014, 237, 242–249. [Google Scholar] [CrossRef]
- Endo, K.; Emori, N. Dechlorination of poly(vinyl chloride) without anomalous units under high pressure and at high temperature in water. Polym. Degrad. Stab. 2001, 74, 113–117. [Google Scholar] [CrossRef]
- Conesa, J.A.; Moltó, J.; Font, R.; Egea, S. Polyvinyl chloride and halogen-free electric wires thermal decomposition. Ind. Eng. Chem. Res. 2010, 49, 11841–11847. [Google Scholar] [CrossRef]
- Solid Biofuels-Determination of Ash Content (UNE-EN-14775:2009); European Committee for Standardization: Brussels, Belgium, 2010.
- Semivolatile Organic Compounds by GC/MS; United States Environmental Protection Agency, Office of Solid Waste: Washington, DC, USA, 2007.
- Soler, A.; Conesa, J.A.; Iñiguez, M.E.; Ortuño, N. Pollutant formation in the pyrolysis and combustion of materials combining biomass and e-waste. Sci. Total Environ. 2018, 622, 1258–1264. [Google Scholar] [CrossRef] [PubMed]
- Moltó, J.; Egea, S.; Conesa, J.A.; Font, R. Thermal decomposition of electronic wastes: Mobile phone case and other parts. Waste Manag. 2011, 31, 2546–2552. [Google Scholar] [CrossRef] [PubMed]
- Determination of Hydrogen Halide and Halogen Emissions from Stationary Sources. Non-Isokinetic Method; United States Environmental Protection Agency, Emissions Measurement Center: Washington, DC, USA, 1994.
- Pressurized Fluid Extraction (PFE); United States Environmental Protection Agency, Office of Solid Waste: Washington, DC, USA, 2000.
- Handbook for Air Toxic Emission Inventory Development; United States Environmental Protection Agency, Office of Air Quality Planning and Standards: Washington, DC, USA, 1998.
- Yoshiyuki, S.; Kiyoshi, K.; Yukitoshi, T.; Kazue, T.; Shiro, N. Decomposition of Ployvinylchloride using Supercritical Water. Jpn. J. Appl. Phys. 1998, 37, 6270. [Google Scholar]
- Takeshita, Y.; Kato, K.; Takahashi, K.; Sato, Y.; Nishi, S. Basic study on treatment of waste polyvinyl chloride plastics by hydrothermal decomposition in subcritical and supercritical regions. J. Supercrit. Fluids 2004, 31, 185–193. [Google Scholar] [CrossRef]
- Nagai, Y.; Smith, R.L.; Inomata, H.; Arai, K. Direct observation of polyvinylchloride degradation in water at temperatures up to 500 °C and at pressures up to 700 mpa. J. Appl. Polym. Sci. 2007, 106, 1075–1086. [Google Scholar] [CrossRef]
- Lu, J.; Ma, S.; Gao, J. Study on the pressurized hydrolysis dechlorination of PVC. Energy Fuels 2002, 16, 1251–1255. [Google Scholar] [CrossRef]
- Caballero, J.A.; Conesa, J.A. Mathematical considerations for nonisothermal kinetics in thermal decomposition. J. Anal. Appl. Pyrolysis 2005, 73, 85–100. [Google Scholar] [CrossRef]
- Conesa, J.A.; Rey, L. Thermogravimetric and kinetic analysis of the decomposition of solid recovered fuel from municipal solid waste. J. Therm. Anal. Calorim. 2015, 120, 1233–1240. [Google Scholar] [CrossRef]
- Conesa, J.A.; Soler, A. Decomposition kinetics of materials combining biomass and electronic waste. J. Therm. Anal. Calorim. 2017, 128, 225–233. [Google Scholar] [CrossRef]
- Ortuño, N.; Conesa, J.A.; Moltó, J.; Font, R. Pollutant emissions during pyrolysis and combustion of waste printed circuit boards, before and after metal removal. Sci. Total. Environ. 2014, 499, 27–35. [Google Scholar] [CrossRef] [PubMed]
- Conesa, J.A.; Font, R.; Fullana, A.; Martín-Gullón, I.; Aracil, I.; Gálvez, A.; Moltó, J.; Gómez-Rico, M.F. Comparison between emissions from the pyrolysis and combustion of different wastes. J. Anal. Appl. Pyrolysis 2009, 84, 95–102. [Google Scholar] [CrossRef]
- Zhou, H.; Meng, A.; Long, Y.; Li, Q.; Zhang, Y. A review of dioxin-related substances during municipal solid waste incineration. Waste Manag. 2015, 36, 106–118. [Google Scholar] [CrossRef] [PubMed]
- Thomas, S.; Wornat, M.J. The effects of oxygen on the yields of polycyclic aromatic hydrocarbons formed during the pyrolysis and fuel-rich oxidation of catechol. Fuel 2008, 87, 768–781. [Google Scholar] [CrossRef]
- Zhang, Y.F.; Zhang, H.; Xu, M.Z. Transfer behavior of PAHs and PCBs from sewage sludge in the thermal treatment process. China Environ. Sci. 2011, 31, 933–937. [Google Scholar]
- Kaivosoja, T.; Virén, A.; Tissari, J.; Ruuskanen, J.; Tarhanen, J.; Sippula, O.; Jokiniemi, J. Effects of a catalytic converter on pcdd/f, chlorophenol and pah emissions in residential wood combustion. Chemosphere 2012, 88, 278–285. [Google Scholar] [CrossRef] [PubMed]
© 2018 by the authors. Licensee MDPI, Basel, Switzerland. This article is an open access article distributed under the terms and conditions of the Creative Commons Attribution (CC BY) license (http://creativecommons.org/licenses/by/4.0/).