Intelligent Regulation Method for a Controllable Load Used for Improving Wind Power Integration


1
Electric Power Research Institute of State Grid Liaoning Electric Power Co. Ltd., Shenyang 110006, China
2
School of Electrical Engineering, Northeast Electric Power University, Jilin City 132012, China
3
State Grid Liaoning Electric Power Co. Ltd., Shenyang 110004, China
*
Author to whom correspondence should be addressed.
Energies 2018, 11(11), 3085; https://doi.org/10.3390/en11113085
Submission received: 6 October 2018
/
Revised: 29 October 2018
/
Accepted: 31 October 2018
/
Published: 8 November 2018
(This article belongs to the Special Issue Optimization Methods Applied to Power Systems)
Abstract
:Improving the safety and stability of power systems by adjusting the controllable load to improve the wind power integration has become a hot research topic. However, the methodology of accurately controlling the load and fundamentally improving the wind power integration capacity has yet to be studied. Therefore, this paper proposes an intelligent regulation method for a controllable load. This method takes the new energy consumption assessment as feedback, and it combines the wind power acceptance assessment and scheduling plan to form the internal and external loop control structure, and it derives the controllable load intelligent regulation architecture. The load curve is decomposed by an interactive load observer, and the load curve is adjusted by the interactive load controller according to a given standard, thereby improving the new energy acceptance capability. Finally, based on the actual grid operation data of a provincial power grid in Northeastern China, the source grid load balancing process and the interactive load regulation model of the wind power system are simulated. The above method verifies the validity and rationality of the proposed method.
1. Introduction
In recent years, the scale of wind power has increased significantly. In the first half of 2018, China’s installed capacity for wind power reached 171.6 million kW, but the annual abandonment of wind power has reached 18.2 billion kWh [1], and some of the “three north” areas have an abandoned wind rate of 30% [2]. The volatility and intermittent nature of wind power also pose great challenges to the safety, stability, and reliability of power systems. The consumption of renewable energy, such as wind power, has become a worldwide problem [3,4].
At present, energy storage technology has become a popular wind power consumption method [5,6,7]. Gupta et al. [8] used mixed integer programming and battery energy storage systems to build security constrained unit commitment models in order to solve intermittent wind power generation problems. In [9,10], a capacity allocation strategy was proposed for a battery energy storage system from the viewpoint of schedule ability and economy. In [11], a comparative analysis method was proposed for the suitability of multi-attribute and multi-objective energy storage conditions in order to obtain an optimal energy storage configuration scheme for different application scenarios for power systems. The method in [12] used energy storage system bidirectional power conversion and storage algorithms to improve the utilization of renewable energy. The method in [13,14,15] used a battery energy storage system to solve the intermittence and volatility problems of wind power and improve the grid’s ability to accept wind power.
However, several current energy storage technologies that are relatively mature have presented short-term economic costs. So far, no energy storage technology has developed “high security, low cost and long life” [16]. In addition, system resources from the power supply side are used to stabilize wind power uncertainty, thus achieving a grid frequency/peak balance. However, in a power grid with a high wind power penetration rate, the development of the adjustable capacity of a power side has gradually reached a bottleneck [17]. The deterministic identification and adjustment on the load side is one of the effective methods for furthering the acceptance of large-capacity renewable energy [18,19].
So far, a large amount of research has been done on the use of control loads to improve wind power integration [20]. In [21], a method was proposed to divide the demand-side resources that are involved in the interaction into a load-reducing load, a translatable load, and a transferable load, according to the user response characteristics, and to make the three types of interactive loads cooperate with each other. Not only can the load curve be reasonably adjusted, but the new energy output can also be effectively eliminated in order to achieve system economic operation. However, there are still certain difficulties in the process of regulating the load. The method in [22,23] selected an air conditioning load with a large proportion of the urban load to study, and proposed a load schedule ability potential evaluation method suitable for the proposed model. Vrakopoulou et al. [24] developed a multi-period opportunity-constrained optimal power flow model for scheduling the generation and reserves of generators and controllable power load sets. In [25], using a particle swarm optimization algorithm combined with a controllable load, an isolated three-level expansion planning method for a micro grid was proposed in order to meet the load demand. The method in [26,27] improved the stability of the grid voltage through a controllable load.
In order to improve the wind power integration, this paper proposes an interactive load generalized observer and controller design method by establishing a mathematical model of the interactive load observation and the control, combined with a wind power integration assessment and scheduling plan. Then, the internal and external loop control structure is formed and an interactive load intelligent control architecture is obtained. Through this method, the power system load curve can be changed in a responsive manner, thereby greatly improving the wind power receiving capability.
The paper is organized as follows. Wind power acceptance assessment model was established in Section 2. Analysis of key factors affecting wind power acceptance in Section 3. An interactive load observer and controller are designed in Section 4. A case study was carried out in Section 5. Finally, Section 6 concludes the paper.
2. Wind Power Integration Assessment Model
For an intelligent control method of the controllable load of wind power, in order to intuitively reflect the improvement of wind power integration and to ensure the safety of the grid dispatching operation after the wind power is connected to the grid, it is necessary to establish a wind power integration assessment model according to the actual situation of the grid operation and the ability of the grid to accept wind power under the current conditions.
2.1. Grid Power Balance Model
The real-time balance of power supply and demand power is the physical premise of the safe and stable operation of power systems. Since the system contains many uncertain variables, especially for the wind power generation and the load side power, it is necessary to provide a certain amount of adjustment to maintain the power balance. When considering the key variables of the three sides of the source grid load, the power balance equation for the wind power system is constructed, as follows:
where PGmax(ti) is the maximum adjustable output of the system power supply side at the peak of the load, PGmin(tj) is the minimum adjustable output of the system power supply side at the time of the low load, is the system upgrade standby, RG is the system downgrade standby, PL(t) is the grid power supply load that is divided into two categories, PL,a(t) is the controllable load, and PL,na(t) is the uncontrollable load, is the maximum power supply load of the grid, and is the minimum power supply load of the grid.
where Pfmax(t)/Pfmin(t) is the maximum/minimum output of the coal-fired unit, Phmax(t)/Phmax(t) is the maximum/minimum output of the hydropower unit, Pnmax(t)/Pnmin(t) is the maximum/minimum output of the nuclear power unit, Pwmax(t)/Pwmin(t) is the maximum/minimum output of the wind power, Pcmax(t)/Pcmin(t) is the maximum/minimum power of the tie line exchange, is the power rate for his thermal power plant, is the power consumption rate of the hydropower unit, is the plant power consumption rate of the nuclear power unit, is the power consumption rate of the wind turbine, and a is the grid loss rate. Pmax and Pmin are the row vectors of the maximum/minimum output of the power supply and α is the coefficient vector of the power output.
2.2. Wind Power Integration Assessment
According to the power balance equation of the wind power system, when considering the variables of the system’s multi-power supply, grid backup, and tie line constraints, an evaluation index of the integration capability of the wind power system is proposed.
2.2.1. Grid Backup Margin
Combined with the power balance equation, the system standby relationship equation in the initial state of the system is established, and the relationship between the system’s up/down standbys is further analyzed. The expression is as follows:
where g(•) is the relationship function between the maximum boot capacity and the minimum boot mode, and it can also be understood as the peak shaving depth on the system power side, is the maximum boot capacity, and is the minimum boot capacity.
According to Equation (4), since the power system spike standby involves the system safety and stability margin, the power grid up-regulation standby usually takes 3–5% of the peak load, and the model is given as the study boundary condition value. Equation (4) is subjected to recursive analysis, and RG is positively correlated with the trough load, positively correlated with the peak shaving depth, and negatively correlated with the up-regulation standby and the peak load.
2.2.2. Wind Power Acceptability
Based on the above alternate derivation model, the calculation formula for the maximum adjustable margin of the trough is given below. Starting from the physical process, the downward adjustment of the grid has the maximum adjustable margin of the grid, as shown in the following equation:
where is the wind power acceptance capability of the grid.
The large-scale wind power integration capability index includes the maximum adjustable margin of the valley, the power consumption rate of the wind power plant, and the grid loss rate. The equation is as follows:
where Pw is the indicator of wind power integration capability.
3. Analysis of the Key Factors Affecting Wind Power Integration
3.1. Essential Factor of Integration
In the process of the coordinated operation and integration of the source grid, there are many measures used to improve the integration ability, and each research result is reflected in the current research field. The power supply side promotes the integration capabilities, including the thermal power unit deep peak shaving, large capacity battery energy storage, pumped storage power station, and electric heat storage. The grid side promotion integration includes a cross-regional integration of the interconnected power grids and ultra high vacuum power grid wind power delivery. The load side facilitation integration includes interruptible loads, transferable loads, and translational loads, etc. However, according to the power balance equation described in Section 2.1 of this paper, under the premise of satisfying the security and stability constraints, the essential process of the integration capability is to up-regulate the process of maximizing the standby minimization and down-regulating the standby. Therefore, the overall objective function accepted by the wind power system is as shown in Equation (7):
3.2. The Influence of the Source Grid Load Coordination on the Integration
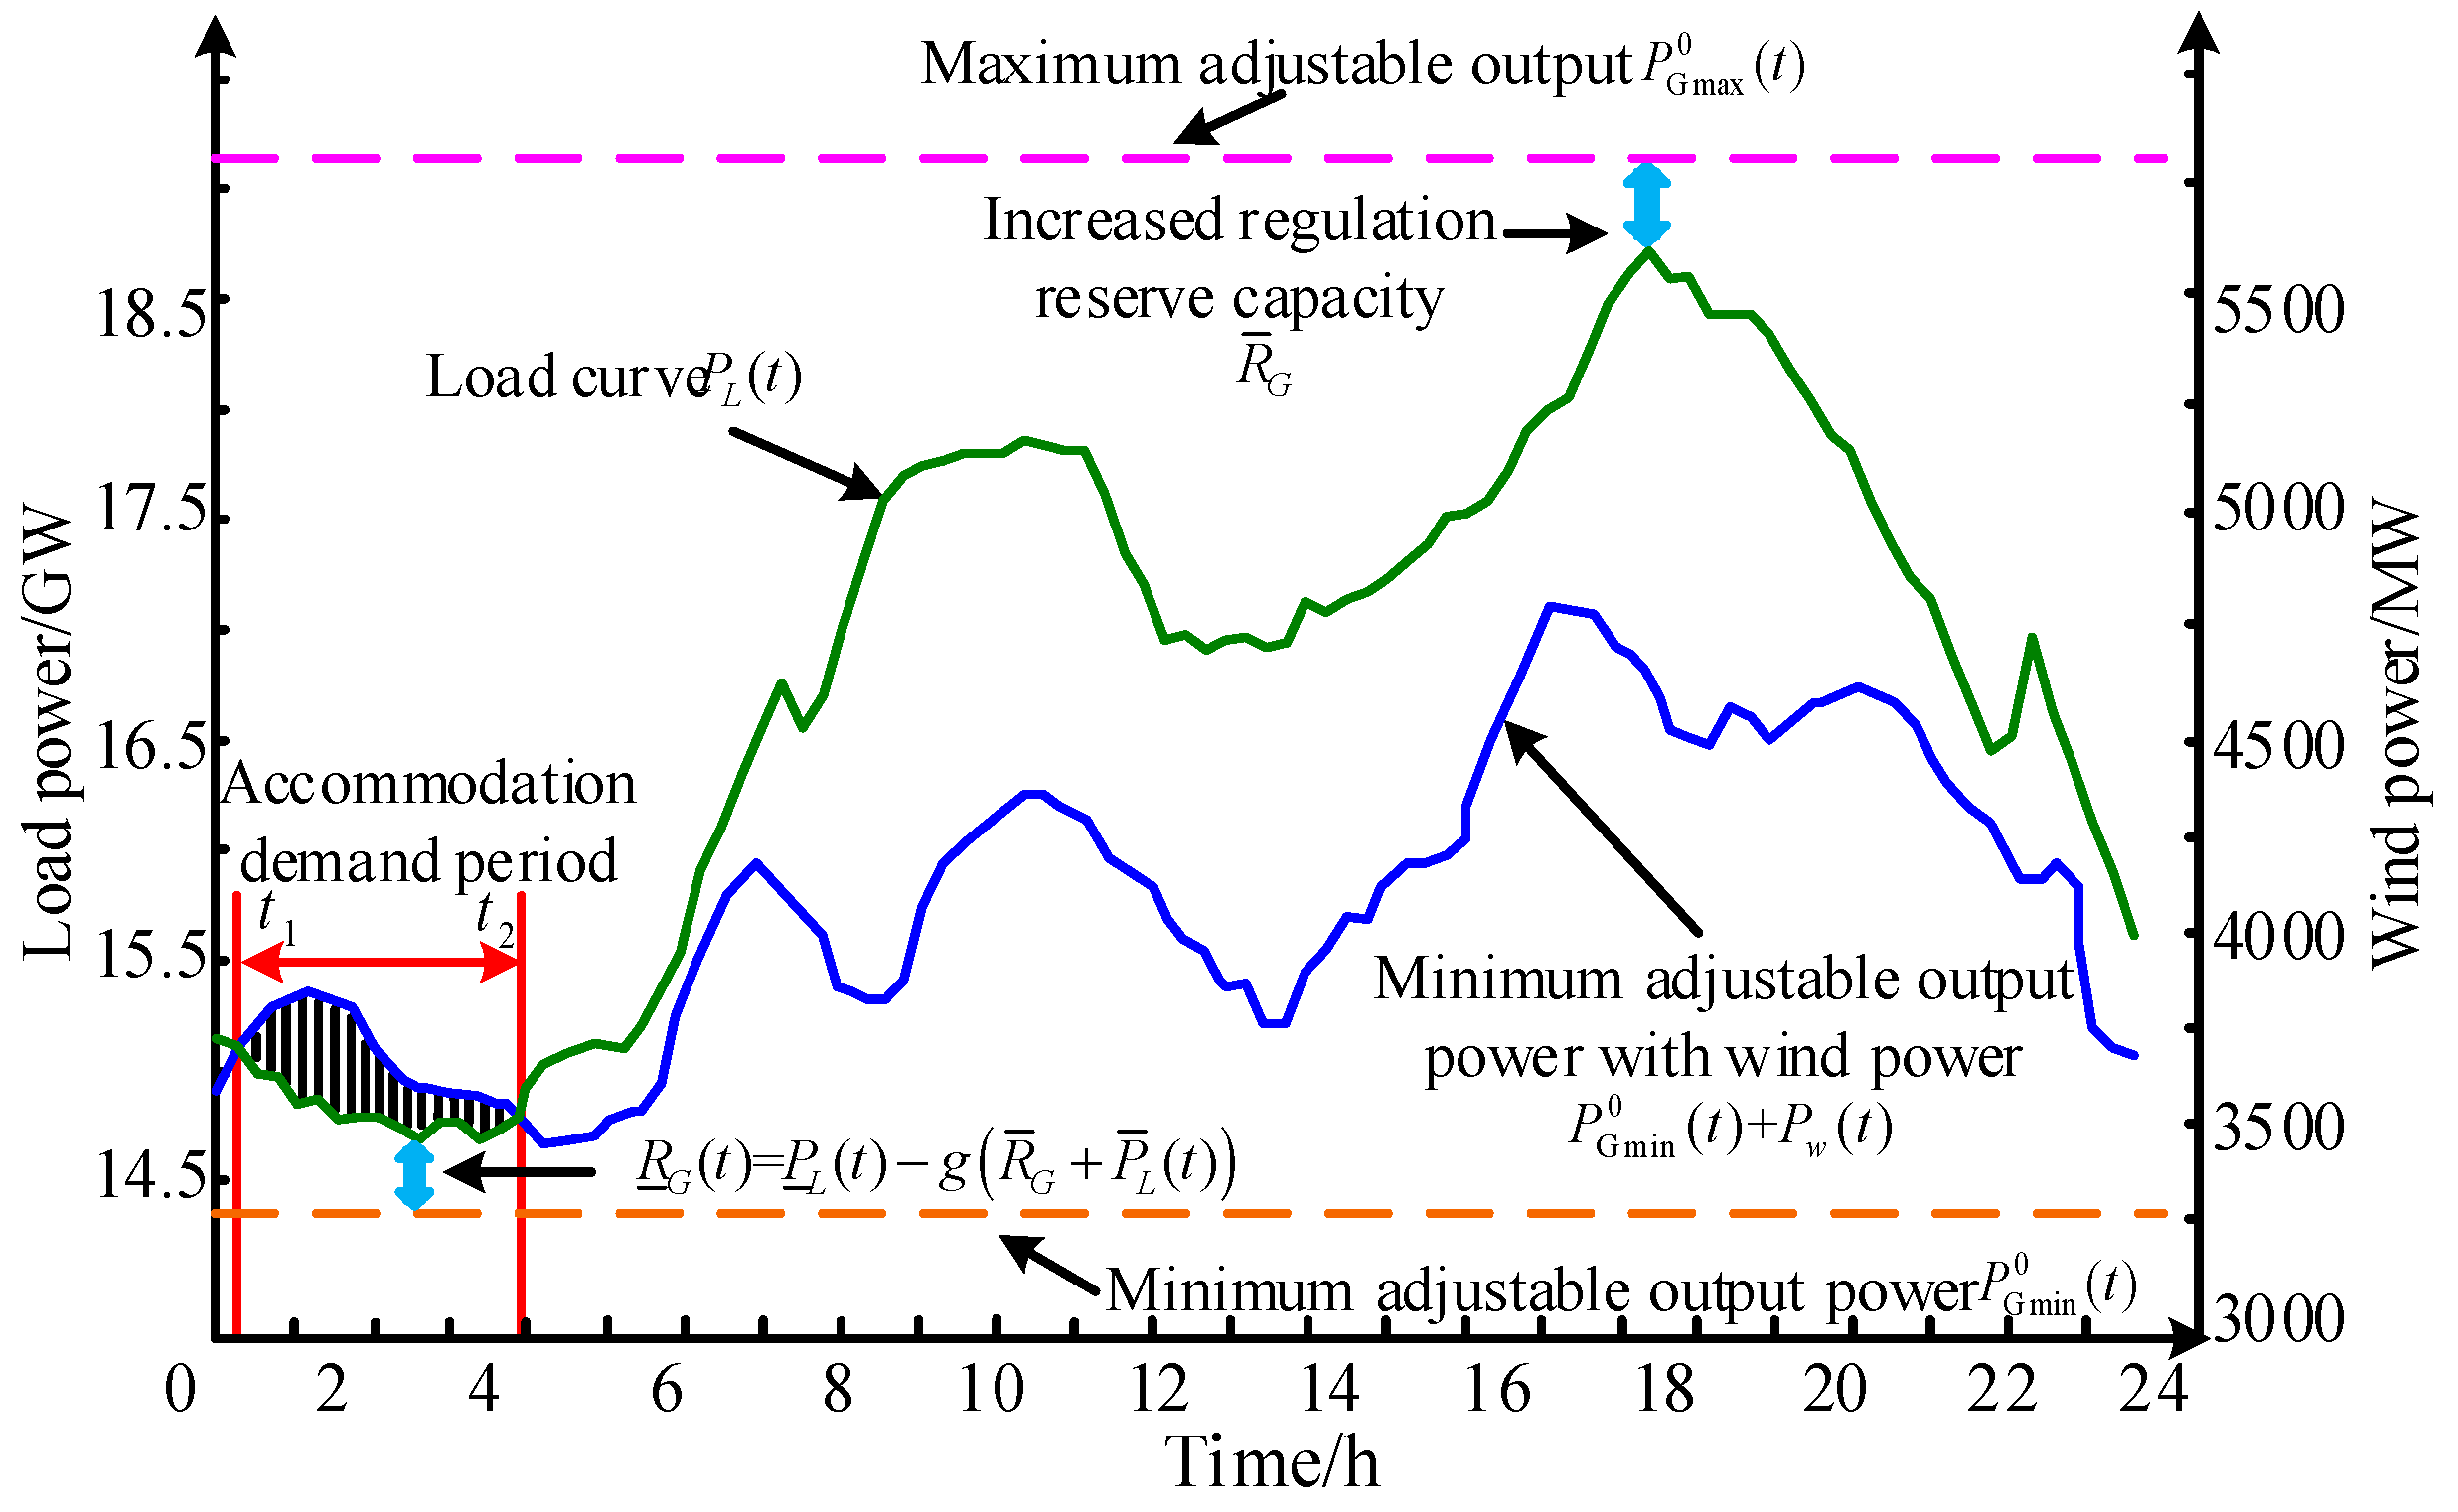
The integration demand period is determined, the source grid load integration contribution index is defined, and the contribution of the source grid load to the integration amount is calculated. Figure 1 is a schematic diagram of the wind power integration. In this paper, the minimum allowable output of the wind power in the system is defined to be greater than the period in which the load is located. The time period of integration is shown in Figure 1 as the period t1~t2.
The influence of the source grid load on the admission is solved quantitatively, and the source grid load integration contribution index is given, as shown in Equation (8):
where Px is the power value of the source grid load with different variables and the load is treated as a negative virtual generator. Px,av is the full-time average power of each variable, is the acceptance contribution of each variable: is the acceptance ability of thermal power units, is the acceptance ability of the hydropower unit, is the acceptance ability of nuclear power plants, is the acceptance contribution of the tie line connection, and is the acceptance capacity of the load.
4. Interactive Load Observer and Controller Design
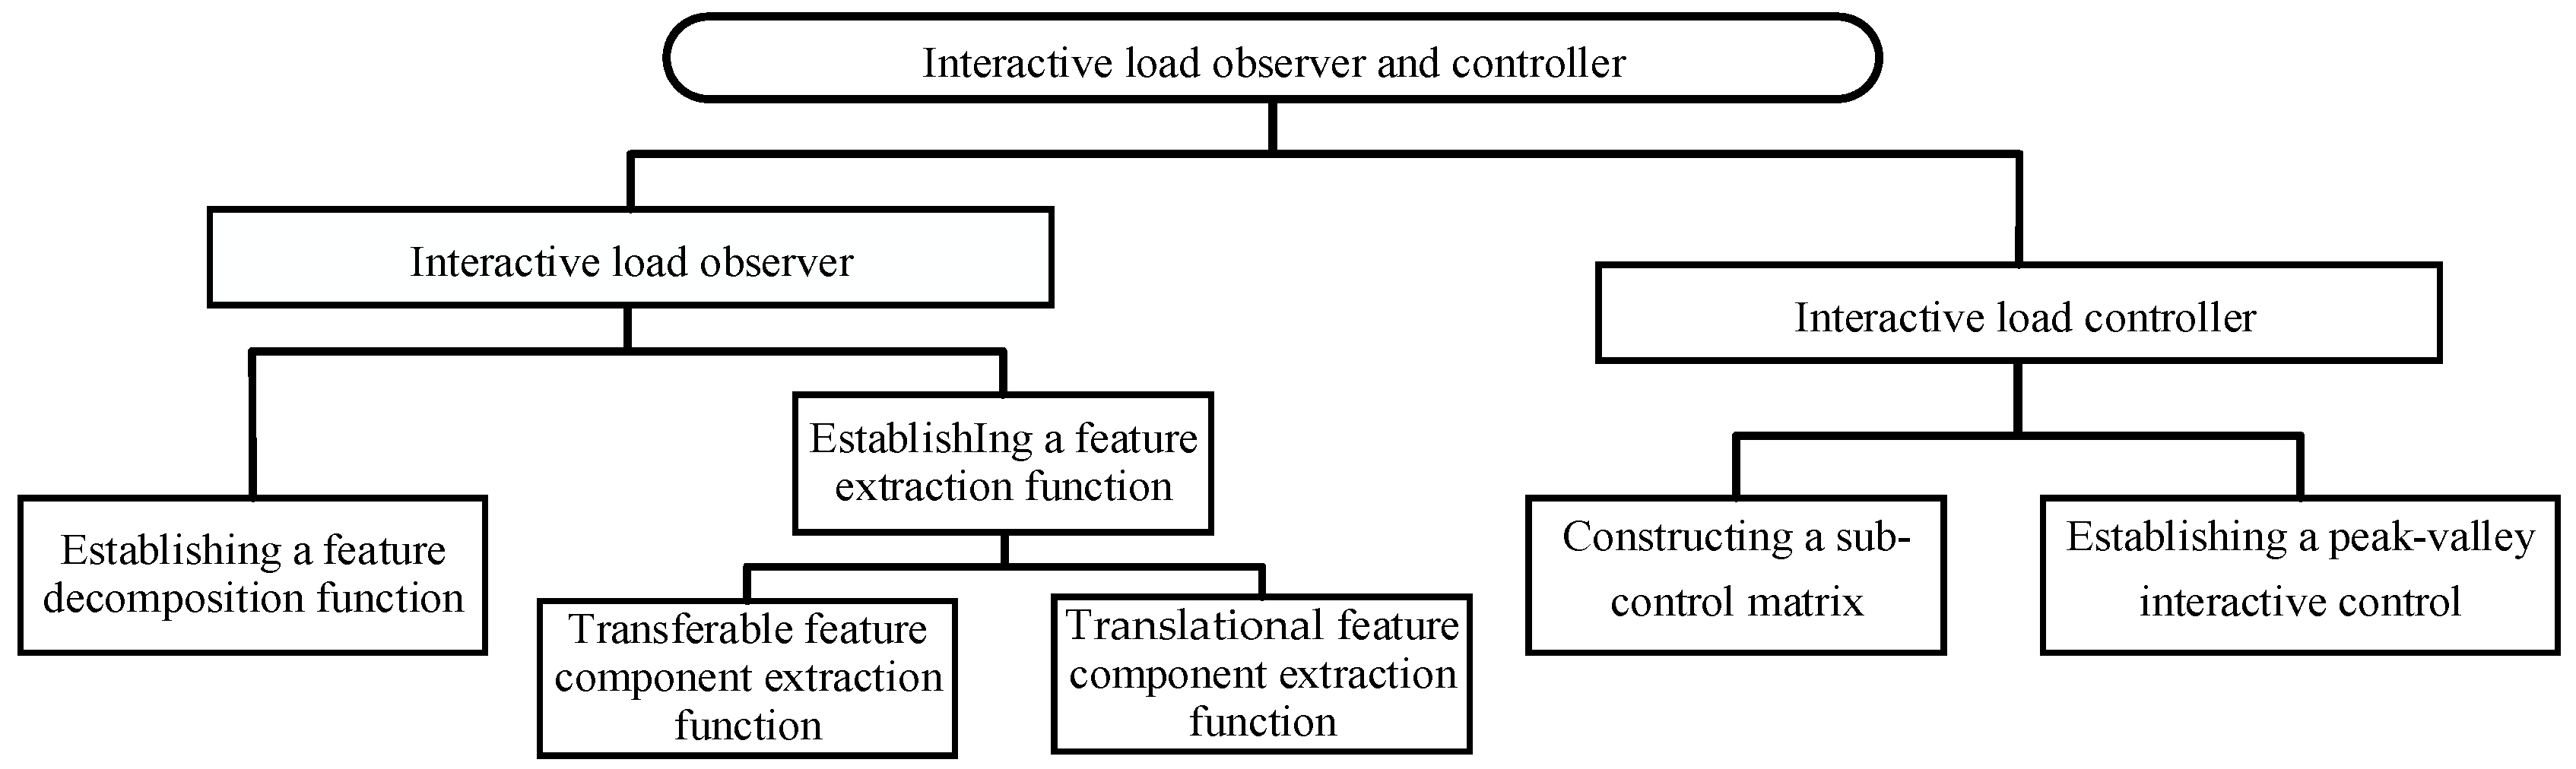
Through the specific analysis of the load curve, the interactive load observer and controller are designed. The specific design flow is shown in Figure 2:
4.1. Interactive Load Observer Design
It can be seen from the above argument that the development and utilization of the load side has a high amount of characteristics in the source grid load coordination integration. The big data mining is carried out for the uncertain load characteristic curve, and the design method of the interactive load observer is proposed. The load curve is characterized and the feature extraction function is established.
4.1.1. Feature Decomposition Function
The load curve is decomposed into three feature quantities, and the decomposition formula is as follows:
where Pm,tran(t) is a transferable feature component, m is the total number of observation points of the transferable characteristic load, Pi,shift(t) is a translatable feature component, i is the total number of observation points of the translatable feature load, Pj,wait(t) is the feature component to be modeled, and n is the total number of observation points for all loads.
4.1.2. Feature Extraction Function
Transferable feature component extraction function:
The function indicates that the average load in ti~tj continuous time is n times the average load of the entire day. Generally, the ti~tj takes 8 h in continuous time, and n takes a value according to the characteristic demand (this article takes n = 2.25). The load with this feature is defined herein as a transferable feature load.
Translational feature component extraction function:
The typical intermittent step load is selected. For the typical load curve, the gray correlation analysis is used, the correlation is used as the index in order to extract a load similar to a typical load curve, and the feature extraction function is as follows:
where Pa is a typical intermittent step load. In this paper, the load curve of a central air conditioning load is taken as a typical intermittent step load. ∆ai(k) represents the absolute difference between the typical reference sequence Pa and the comparison sequence Pi at time k, that is, ∆ai(k) = |Pa(k) − Pi(k)|. ∆min and ∆max represent the maximum and minimum values, respectively, of the absolute differences of all the comparison sequences at each time. is 0.5, is the correlation coefficient, is the correlation degree, n is the load value sampling point, and z is the translatable feature component extraction threshold, which represents the similarity between the comparison load sequence and the typical intermittent step coincidence sequence, the value range is 0–1 and z = 0.9.
The feature component to be modeled:
Pj,wait(t) is the feature load to be modeled, which needs to be continuously studied by big data technology, and that will gradually decompose various features of the load part to be modeled. In this paper, the intelligent control method of the controllable load is not studied further, and its characteristic component values are as follows:
4.2. Interactive Load Controller Design
After the load curve is decomposed by the observer, it is necessary to further control the observable load characteristics, establish a sub-control matrix, propose a peak-valley interactive control model, and control the discriminant characteristic load in order to form an interactive load controller.
4.2.1. Constructing a Sub-Control Matrix
The construction of the sub-control matrix is as follows:
where Pn(t) is the load’s n-type decomposition matrix, Kctr(t) is the control matrix of the characteristic load, and the control word Kctr,n is the nth type characteristic load controllable belonging to the 0–1 variable, where 0 is uncontrollable and 1 is controllable. In this paper, the translatable feature component and the transferable feature component are controllable components, and the feature component to be modeled is an uncontrollable component. Kpr(t) is the control weight matrix of the feature load, Kpr,n is the control weight value of the nth type characteristic load, and the weight value needs to be verified according to factors, such as the compensation pricing of the load.
The sub-control rules are defined as follows:
where Zn(t) is a controllable quantity matrix for various characteristic loads.
4.2.2. Establishing a Peak-Valley Interactive Control Model
It can be seen from the characteristic load controllable quantity matrix defined above that the matrix includes the translatable characteristic load control amount and the transferable characteristic load control quantity, so that Zn(t) is converted into the following form:
The peak load interaction constraints are as follows. In the peak period, the load is interactively controlled to ensure that the total amount of electricity used during the peak period is constant and load shifting. The interactive model looks like this:
where is the load of the peak period in the total load curve and is the reference limit of the translatable load during the peak period of the total load curve, which is 80% of the peak load.
The low load period load interaction constraints are as follows. In the low valley period, the load interaction control is attained. When the transferable load control quantity satisfies the calling condition, the corresponding policy/economic incentive low load is adopted in order to increase the power load during the low valley period, and the load interaction regulation conditions are as follows:
where is the load of the trough period in the total load curve and is the reference limit of the transferable load in the trough period of the total load curve, which is 20% of the peak load.
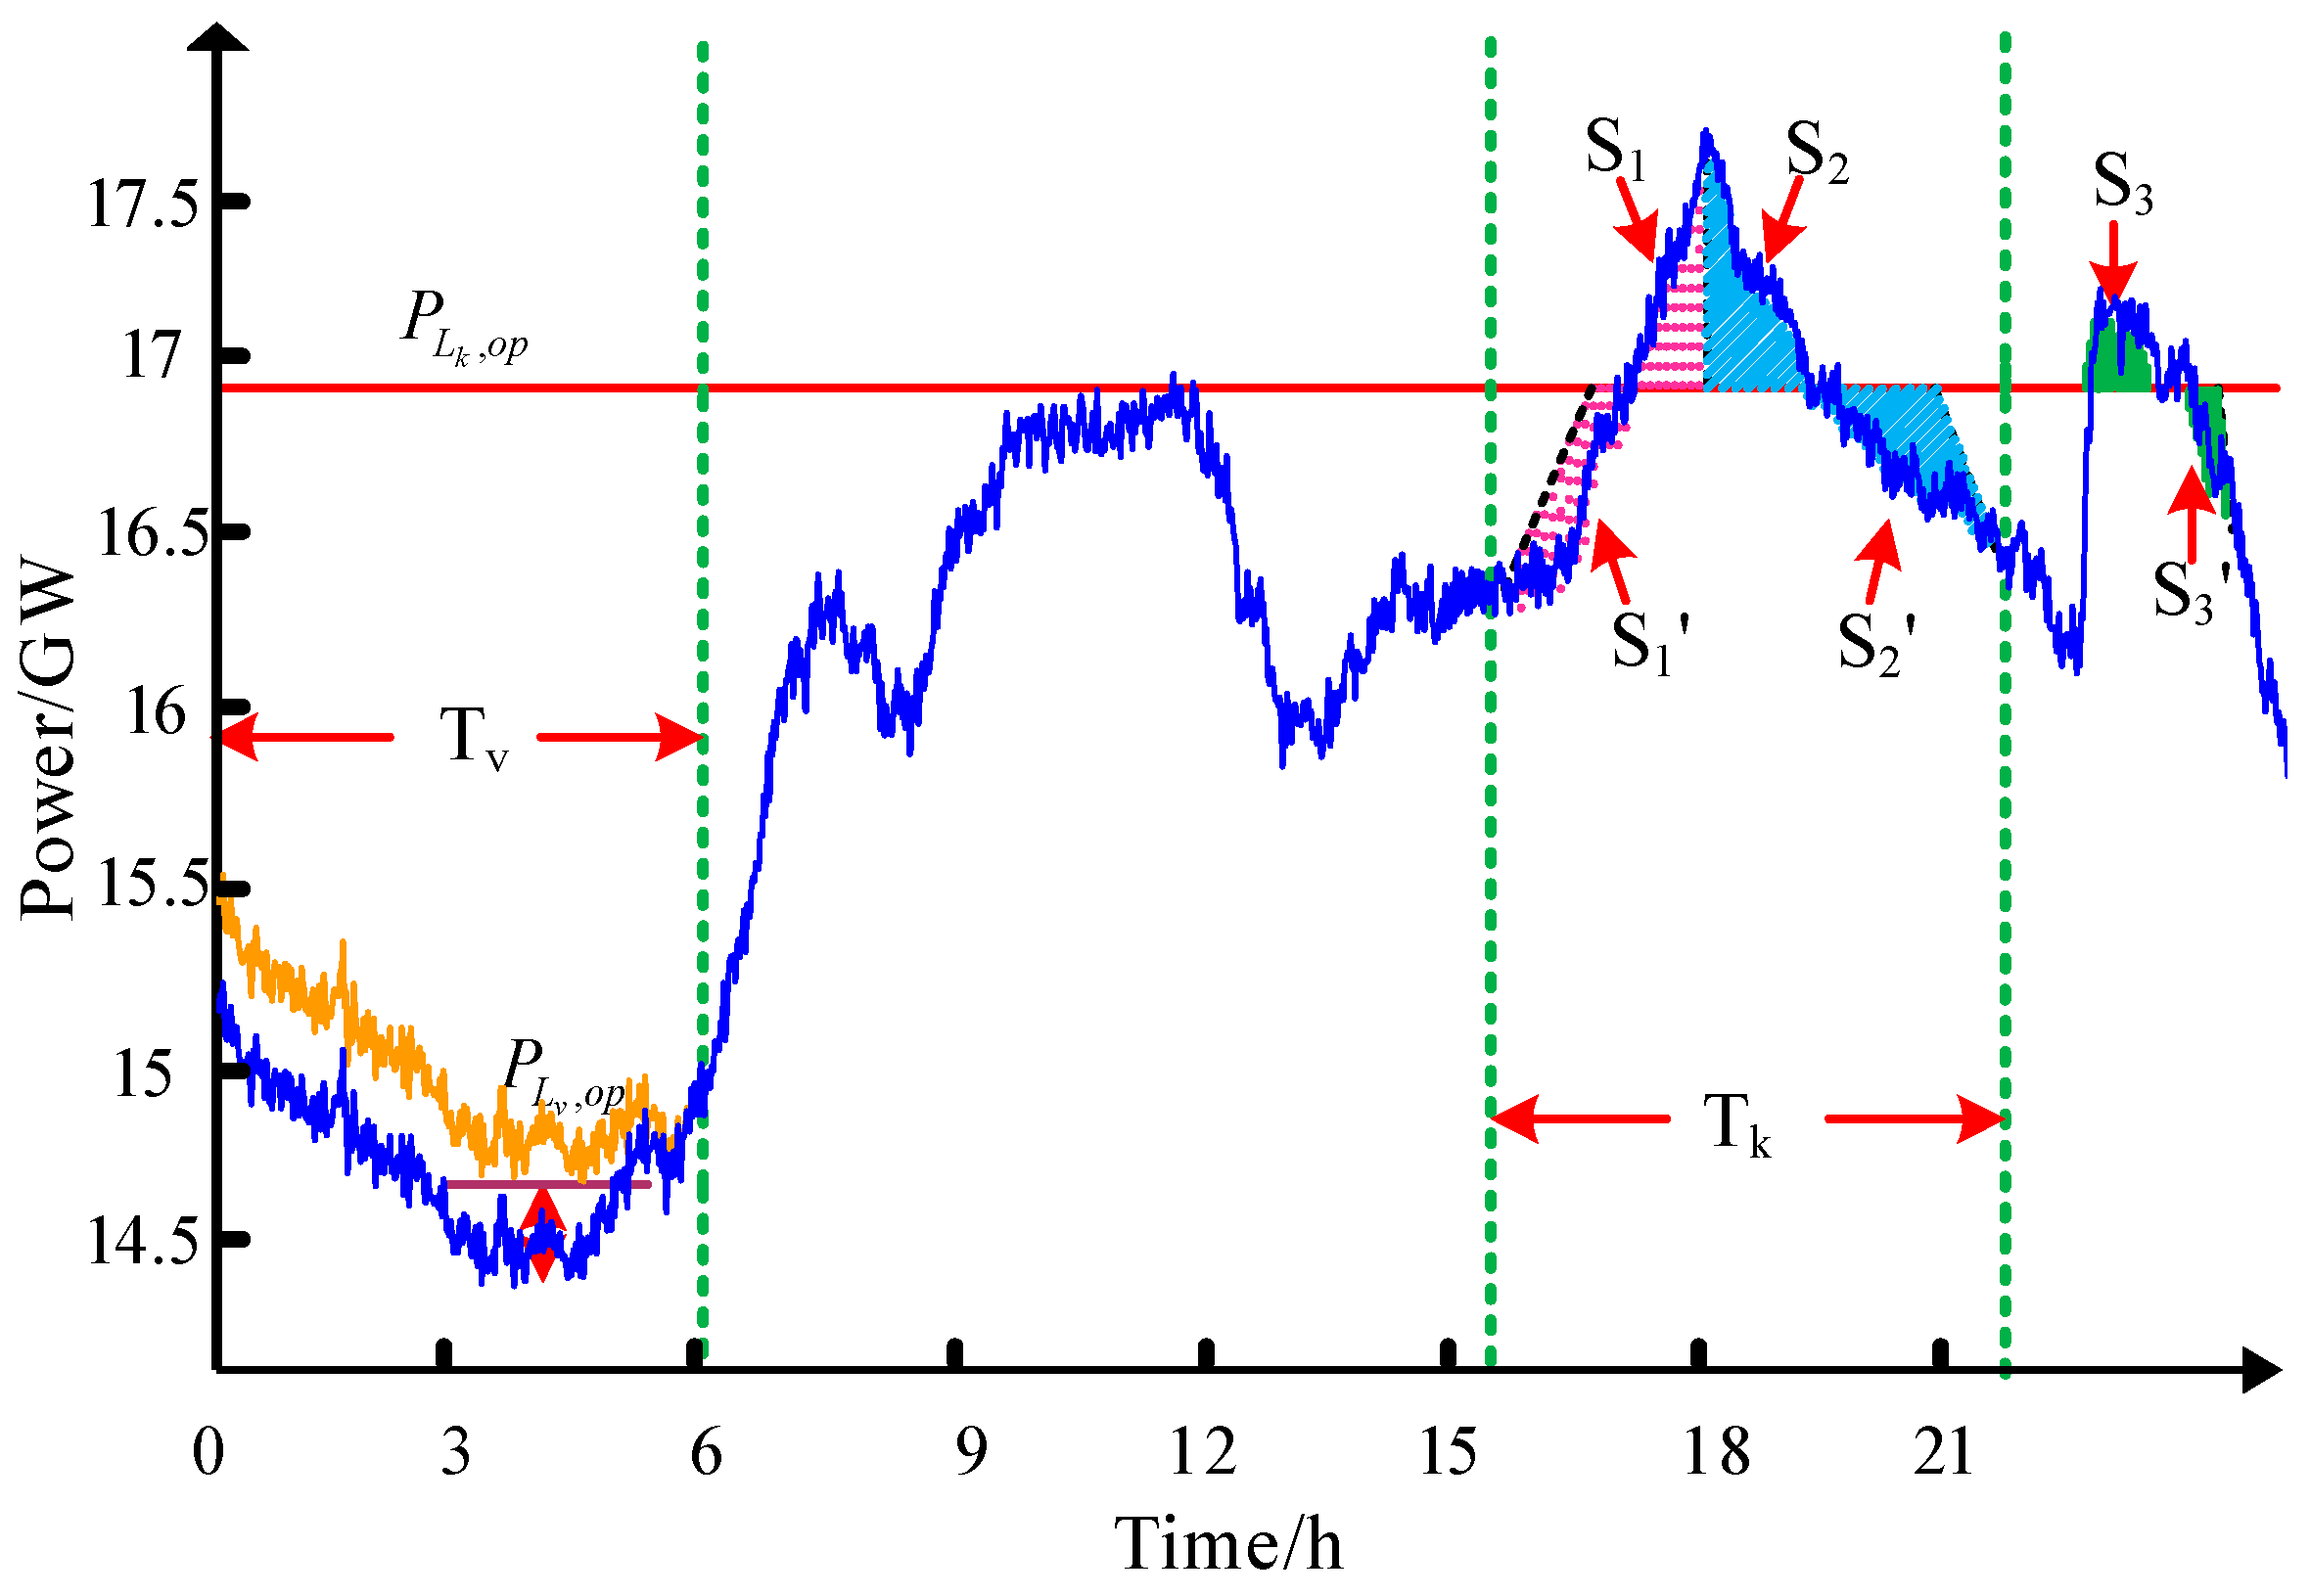
The schematic diagram of the interactive load peak-valley interactive control model is shown in Figure 3.
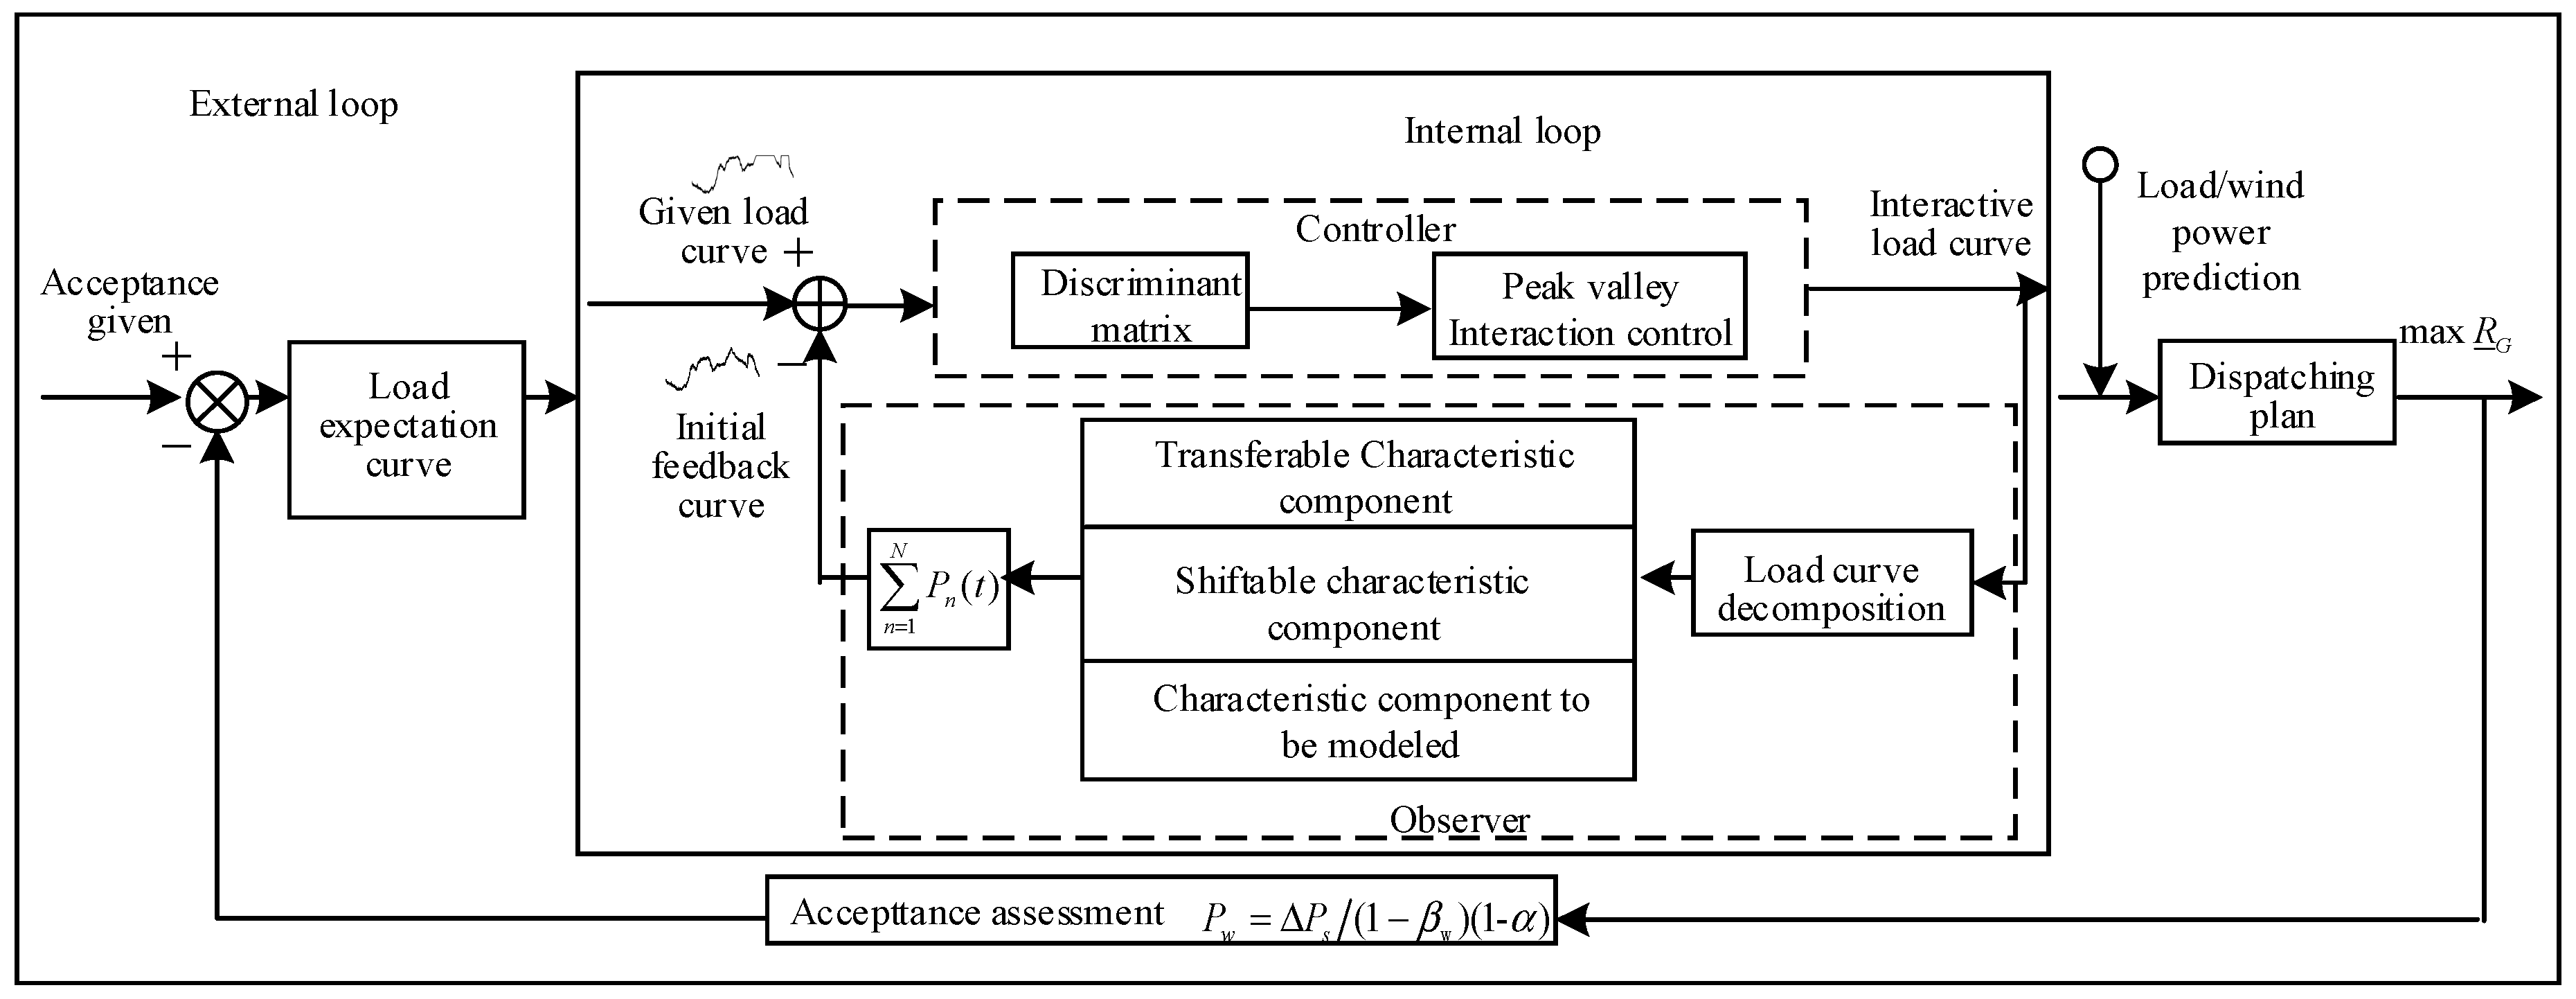
4.3. Interactive Load Intelligent Control Architecture
Combining the theoretical design of the observer and the controller with the interactive load, the intelligent control architecture of the interactive load is constructed and designed into the inner and outer loop control model.
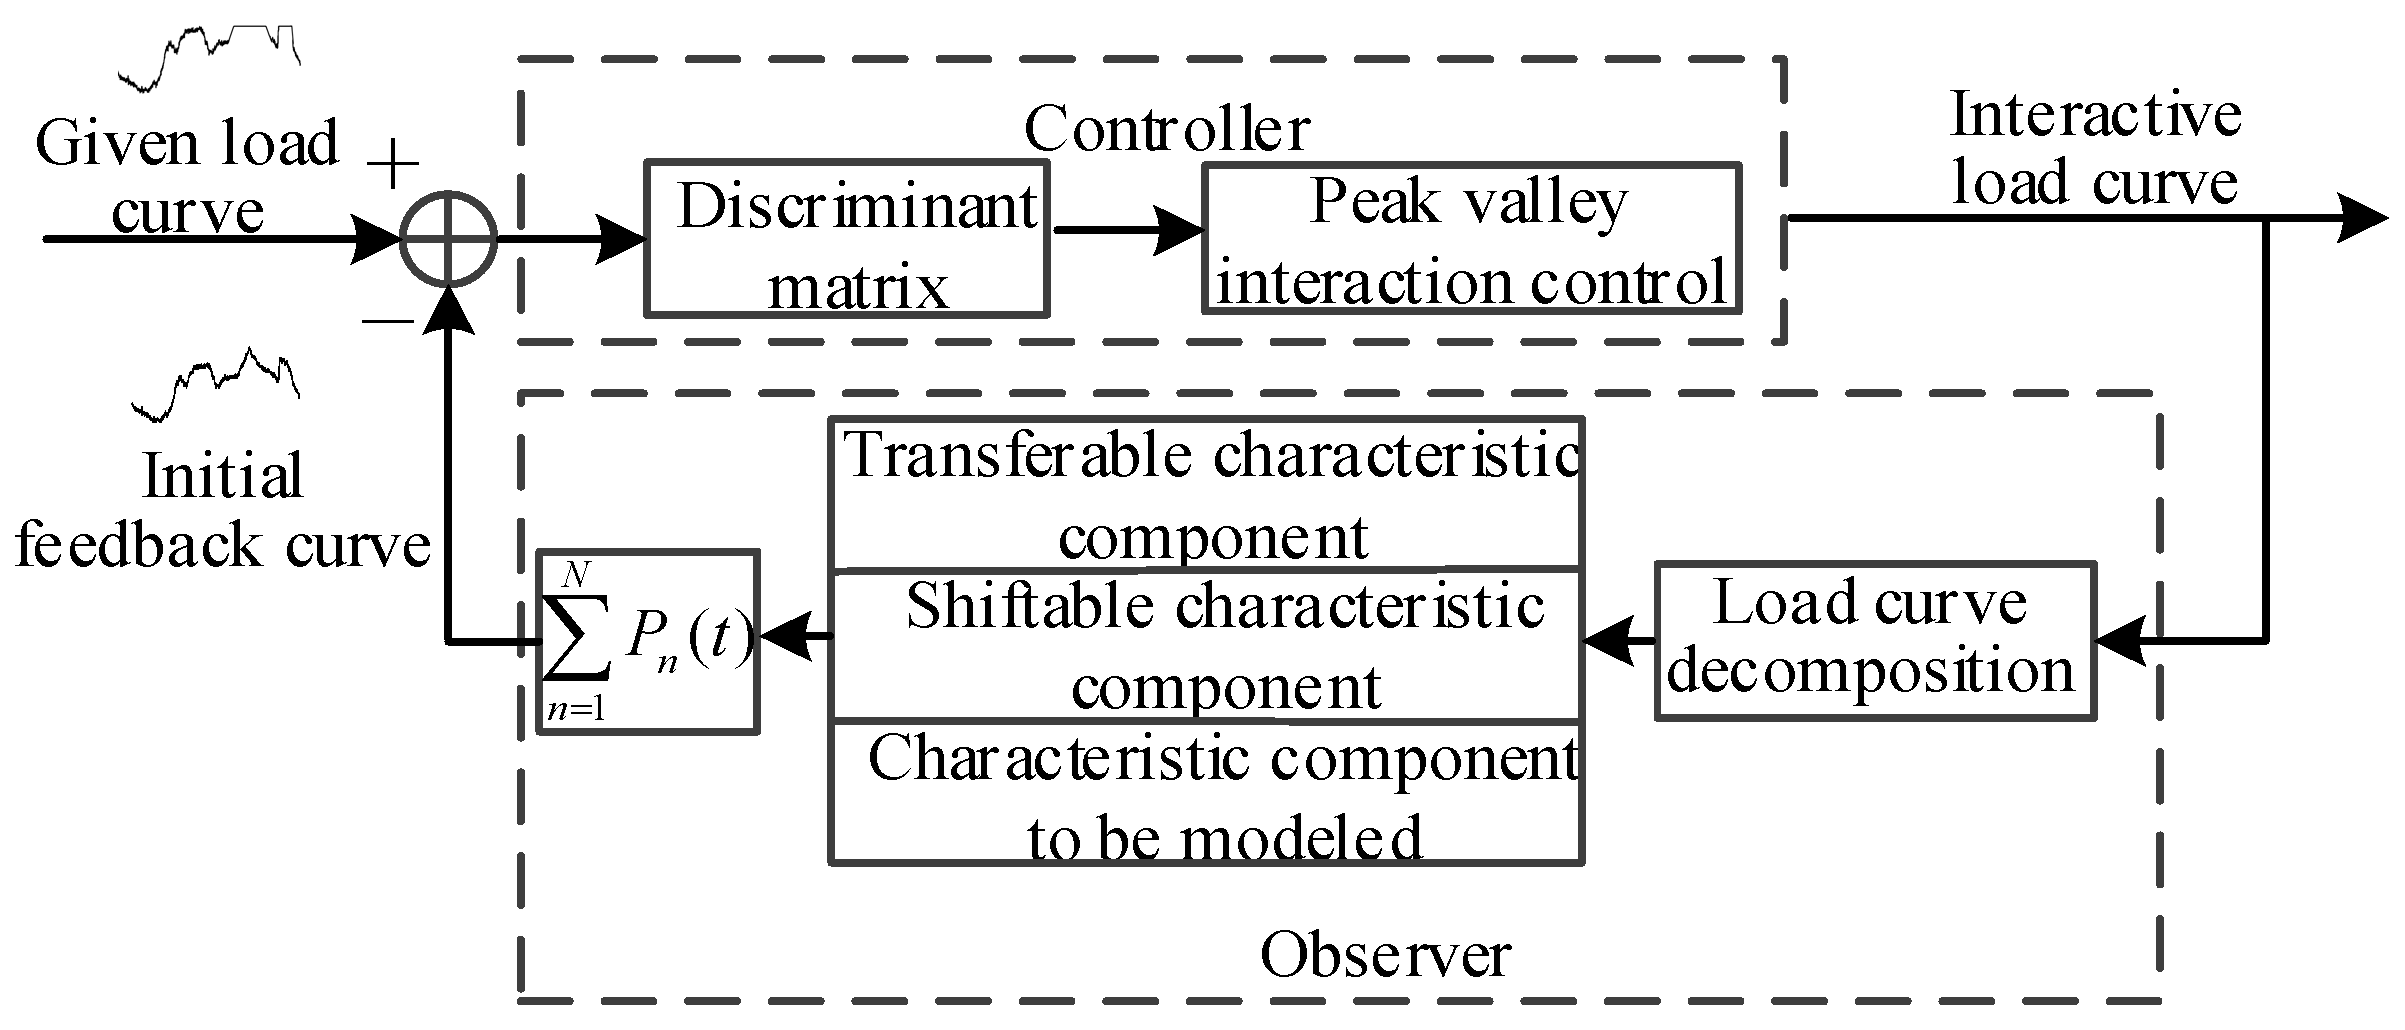
The model principle of the intelligent control inner loop design of the interactive load is shown in Figure 4. First, the observer is used as a feedback link, and the series connection in the link includes the load curve decomposition, the feature component extraction, and the feature component accumulation. Second, the ideal given load curve is compared with the initial accumulated curve. Finally, the controller acts to determine the interactive characteristic load and then performs a flat-point regulation of the peak and the low-level excitation regulation. The inner loop input is the load expectation curve and the output is the control corrected load curve.
The model principle of the intelligent control outer loop design of the interactive load is shown in Figure 5. Section 2.2 of this paper proposes a wind power integration capability assessment model as a feedback link, accepts the demand as the input given link, adjusts the power generation plan according to the interactive load curve of the inner loop output, and reduces the maximum amount of space of the output. Combined with the interactive control intelligent control inner loop design, this can form an intelligent control architecture of the interactive load.
Through the intelligent control method proposed in this paper, the peak value of the load is first reduced, thereby reducing the maximum adjustable output value of the power supply, and the maximum starting capacity of the unit is reduced, so that the minimum adjustable output value of the power supply is also reduced. Secondly, the method increases the load low value, so that the difference between the load low value and the minimum adjustable output value of the power supply increases, thereby improving the wind power receiving capability.
5. Instance Grid Verification
5.1. Evaluating the Wind Power Integration Capability of the Instance Grid
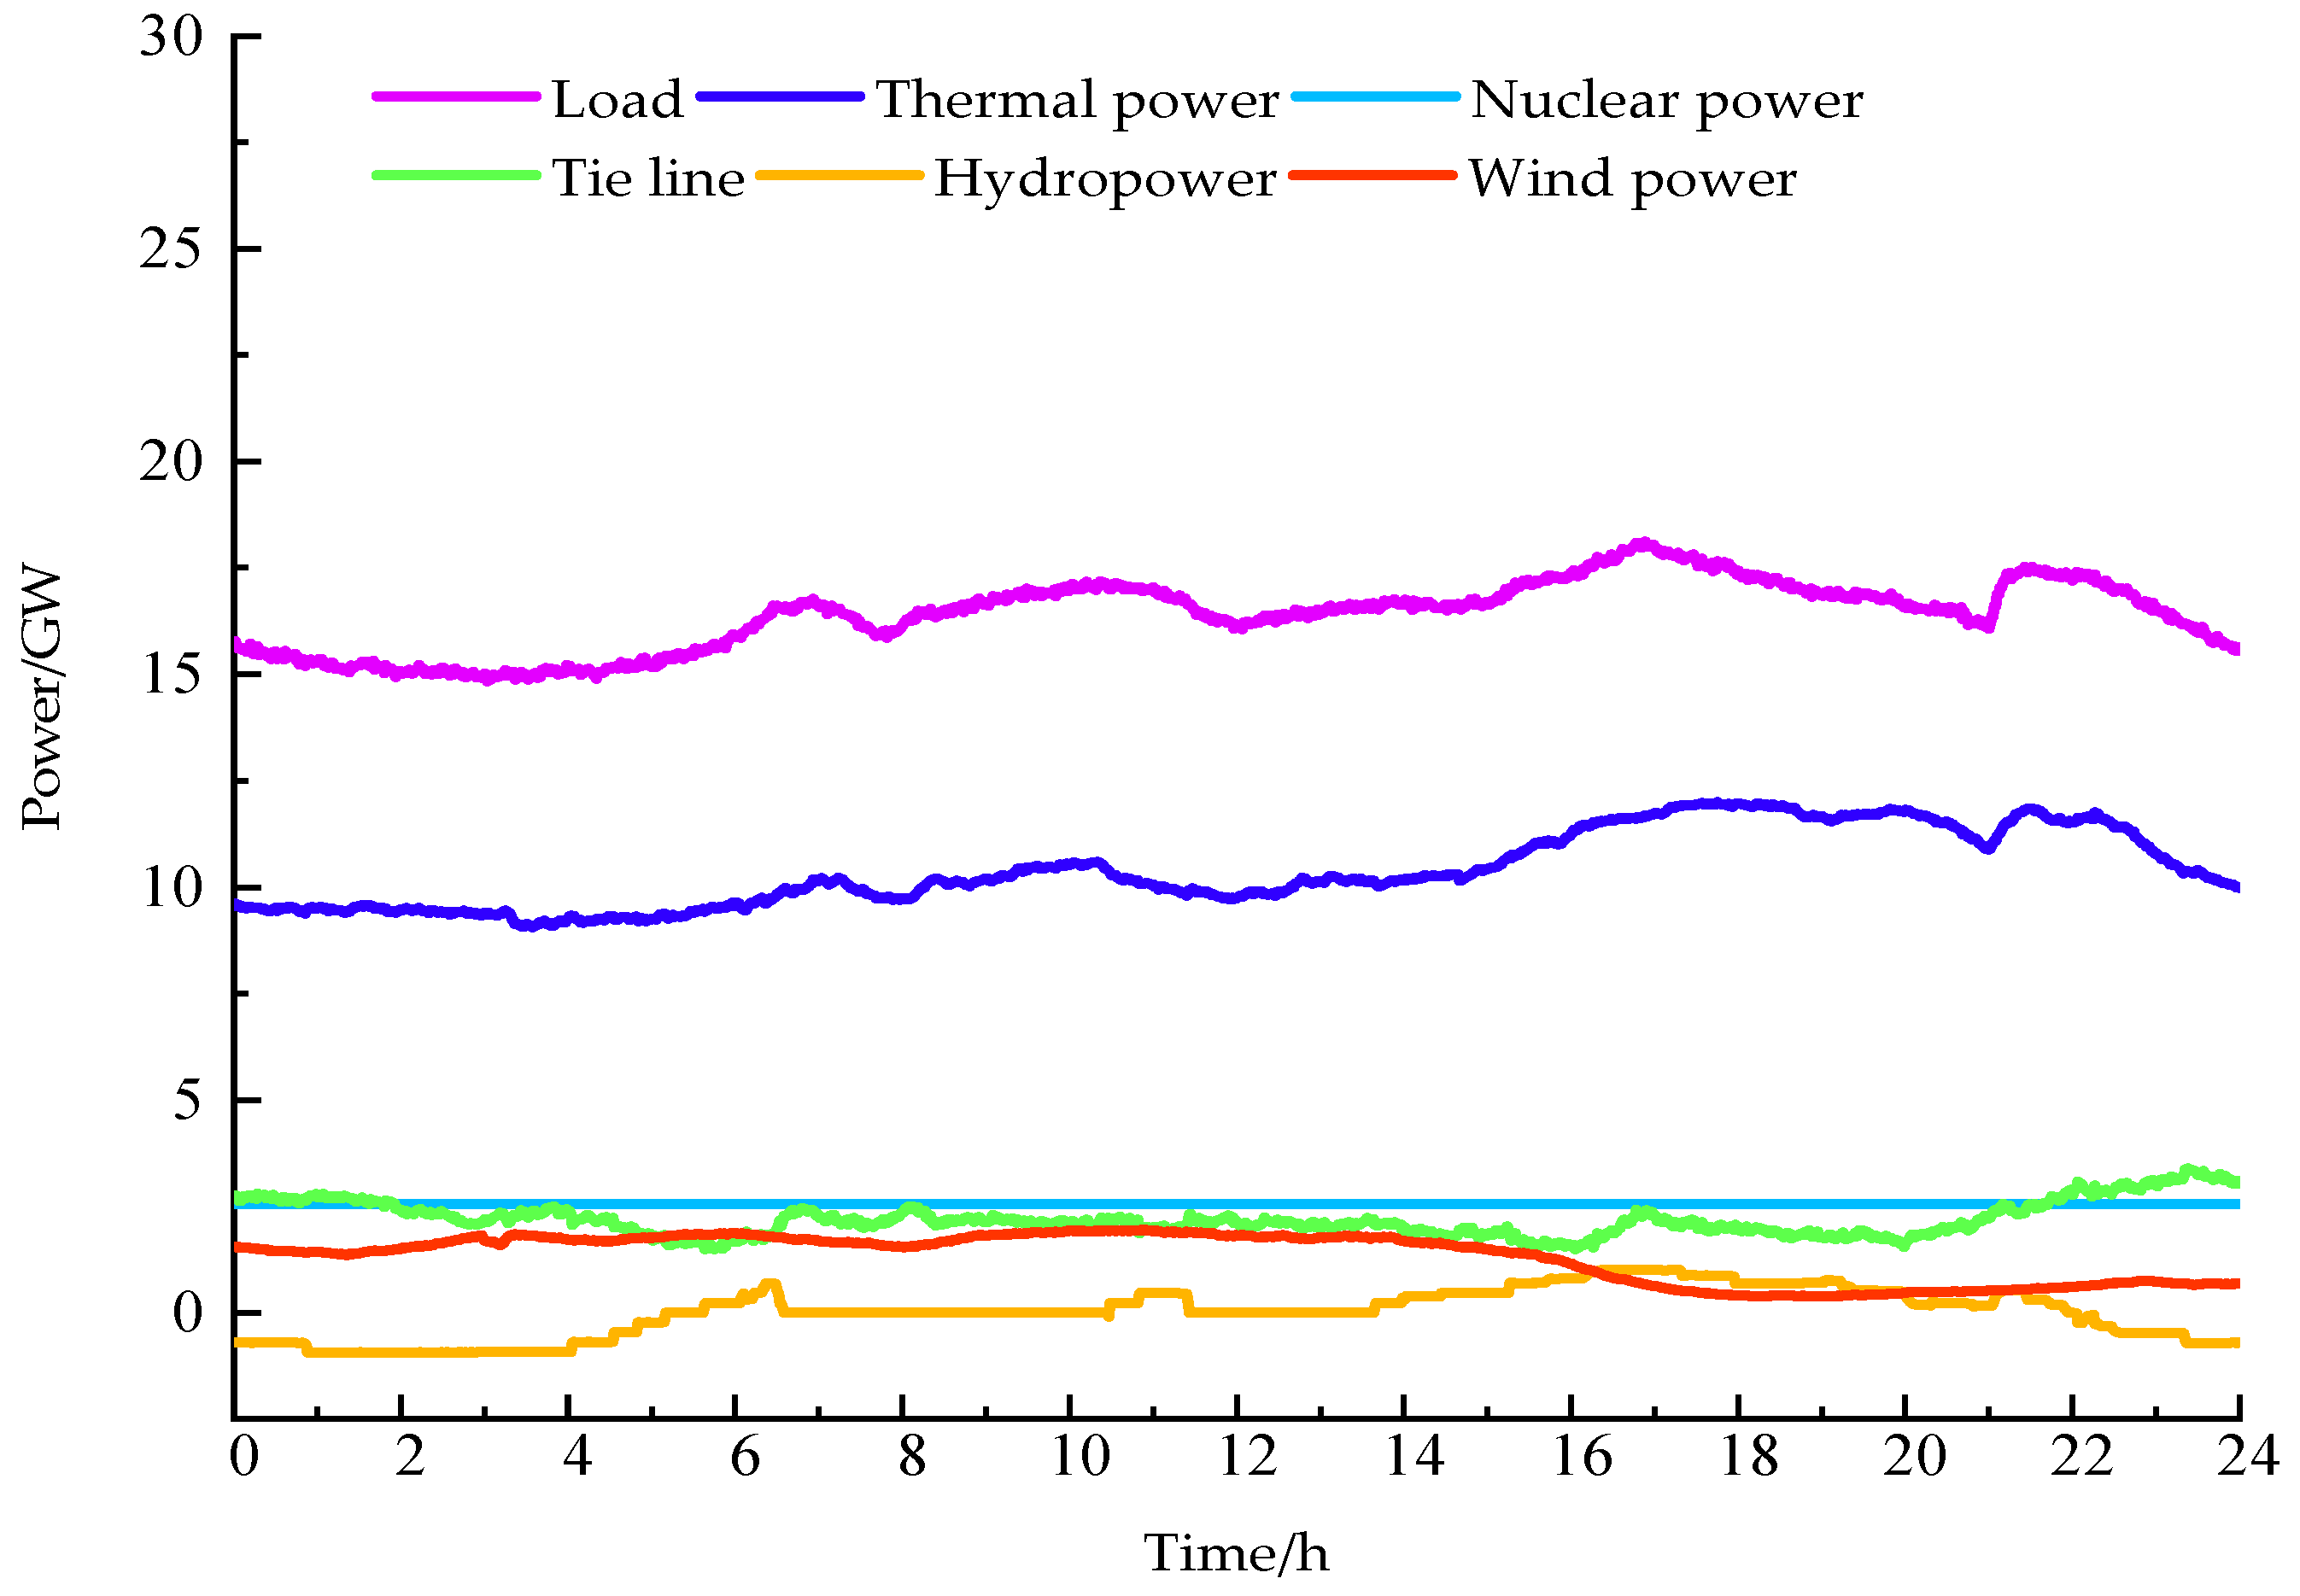
Based on the actual trend data for the power grid in a specific area, the capacity of the thermal motor assembly machine in the region is 20 GW, the installed capacity of the hydropower (including pumping) is 3 GW, the nuclear power is 4.4 GW, and the wind power is 4.5 GW. The system’s running curve is shown in Figure 6:
According to the integration index of the Equation (6), the integration ability of the current system is calculated, and the calculation result is shown in Table 1.
5.2. Source Grid Load Factor Contribution Ratio
According to the source grid load integration capability index of Equation (8), the integration demand period is [00:00, 05:00], and the integration contribution capacities of the thermal power, hydropower, nuclear power, tie line, and trough transfer load in the current system are calculated. The calculation results are shown in Table 2.
According to the statistics of the classic daily operation data, the total amount of the transferred load in the trough integration period is 2.7 GW. According to the above calculation results, in the integration demand period of wind power integration, the relative contribution capacity of the diverted load is 0.42, the thermal power unit is 0.36, and the hydropower unit (including the pumped storage) is 0.29. The baseband of the nuclear power belt does not participate in peak shaving, and the tie line of the power grid is reversed peak-adjusting due to the delivery of wind power in the adjacent area. It can be concluded that, if there is no such transfer load in the valley period, then the wind power acceptance will be reduced by 2.7 GW. Therefore, this paper proves the strong proportion of the trough characteristic load for wind power integration through the proposed index Equation (8), which can greatly increase the receiving space through the load side interaction.
5.3. Intelligent Control Method for the Interactive Load
Using the interactive load observer Equations (9)–(11), the feature extraction of the grid load operation data of the region is carried out to determine the observable load.
After the characteristic curve of the load curve is decomposed, the characteristic load curve of the trough is extracted as the transferable load for the load interaction control of the load trough period. The characteristic load curve of the air conditioning and the intermittent characteristic load curve are extracted for the load interaction regulation of the load peak period, and the peak characteristic load curve is extracted as the load to be modeled.
The observed solution of the load observer is shown in Figure 7.
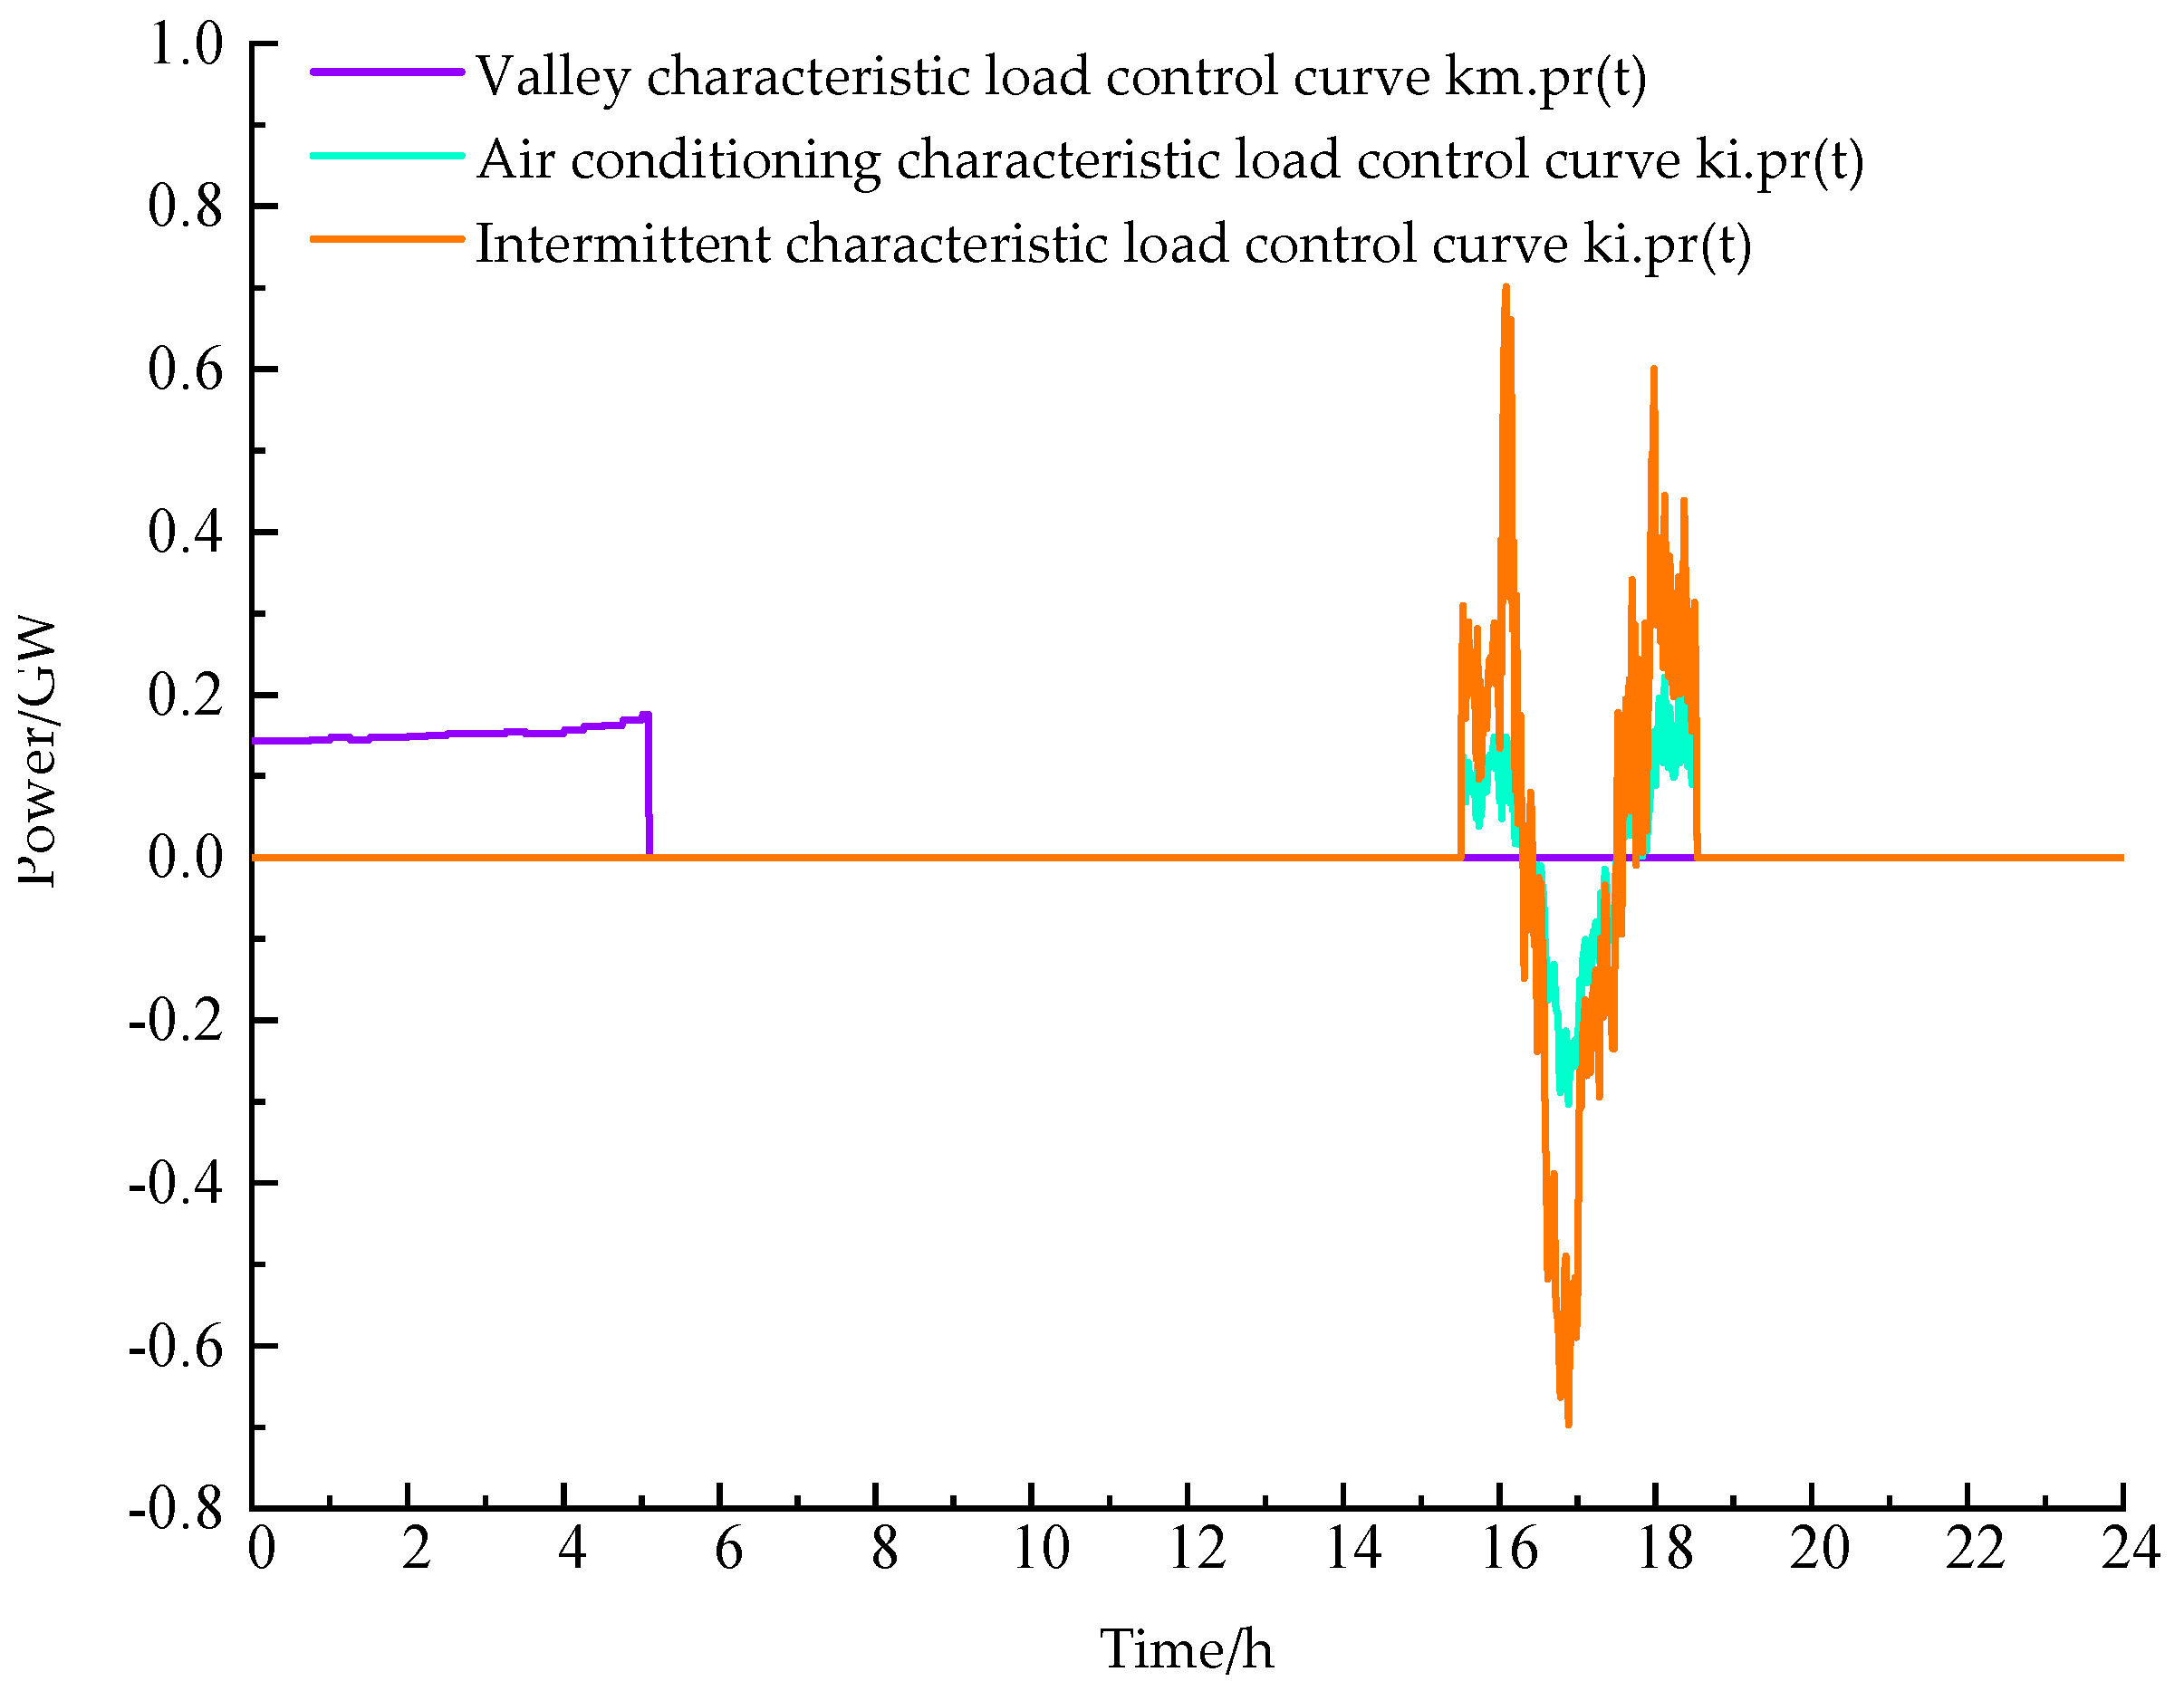
According to the characteristic load that was observed by the above interactive load observer, according to Equations (13)–(19), the interactive load controller can be used for control. In the peak period, the intermittent characteristic load and the air conditioning characteristic load are controlled by A, and the reference limit is B = 17.65 GW. The trough period has the transfer load to the trough characteristics, and C is the variable policy control, the reference limit is D = 15.22 GW, through the peak-valley interactive control model in this paper, the control solution E of the transferable load and the translatable load can be obtained. The result is shown in Figure 8.
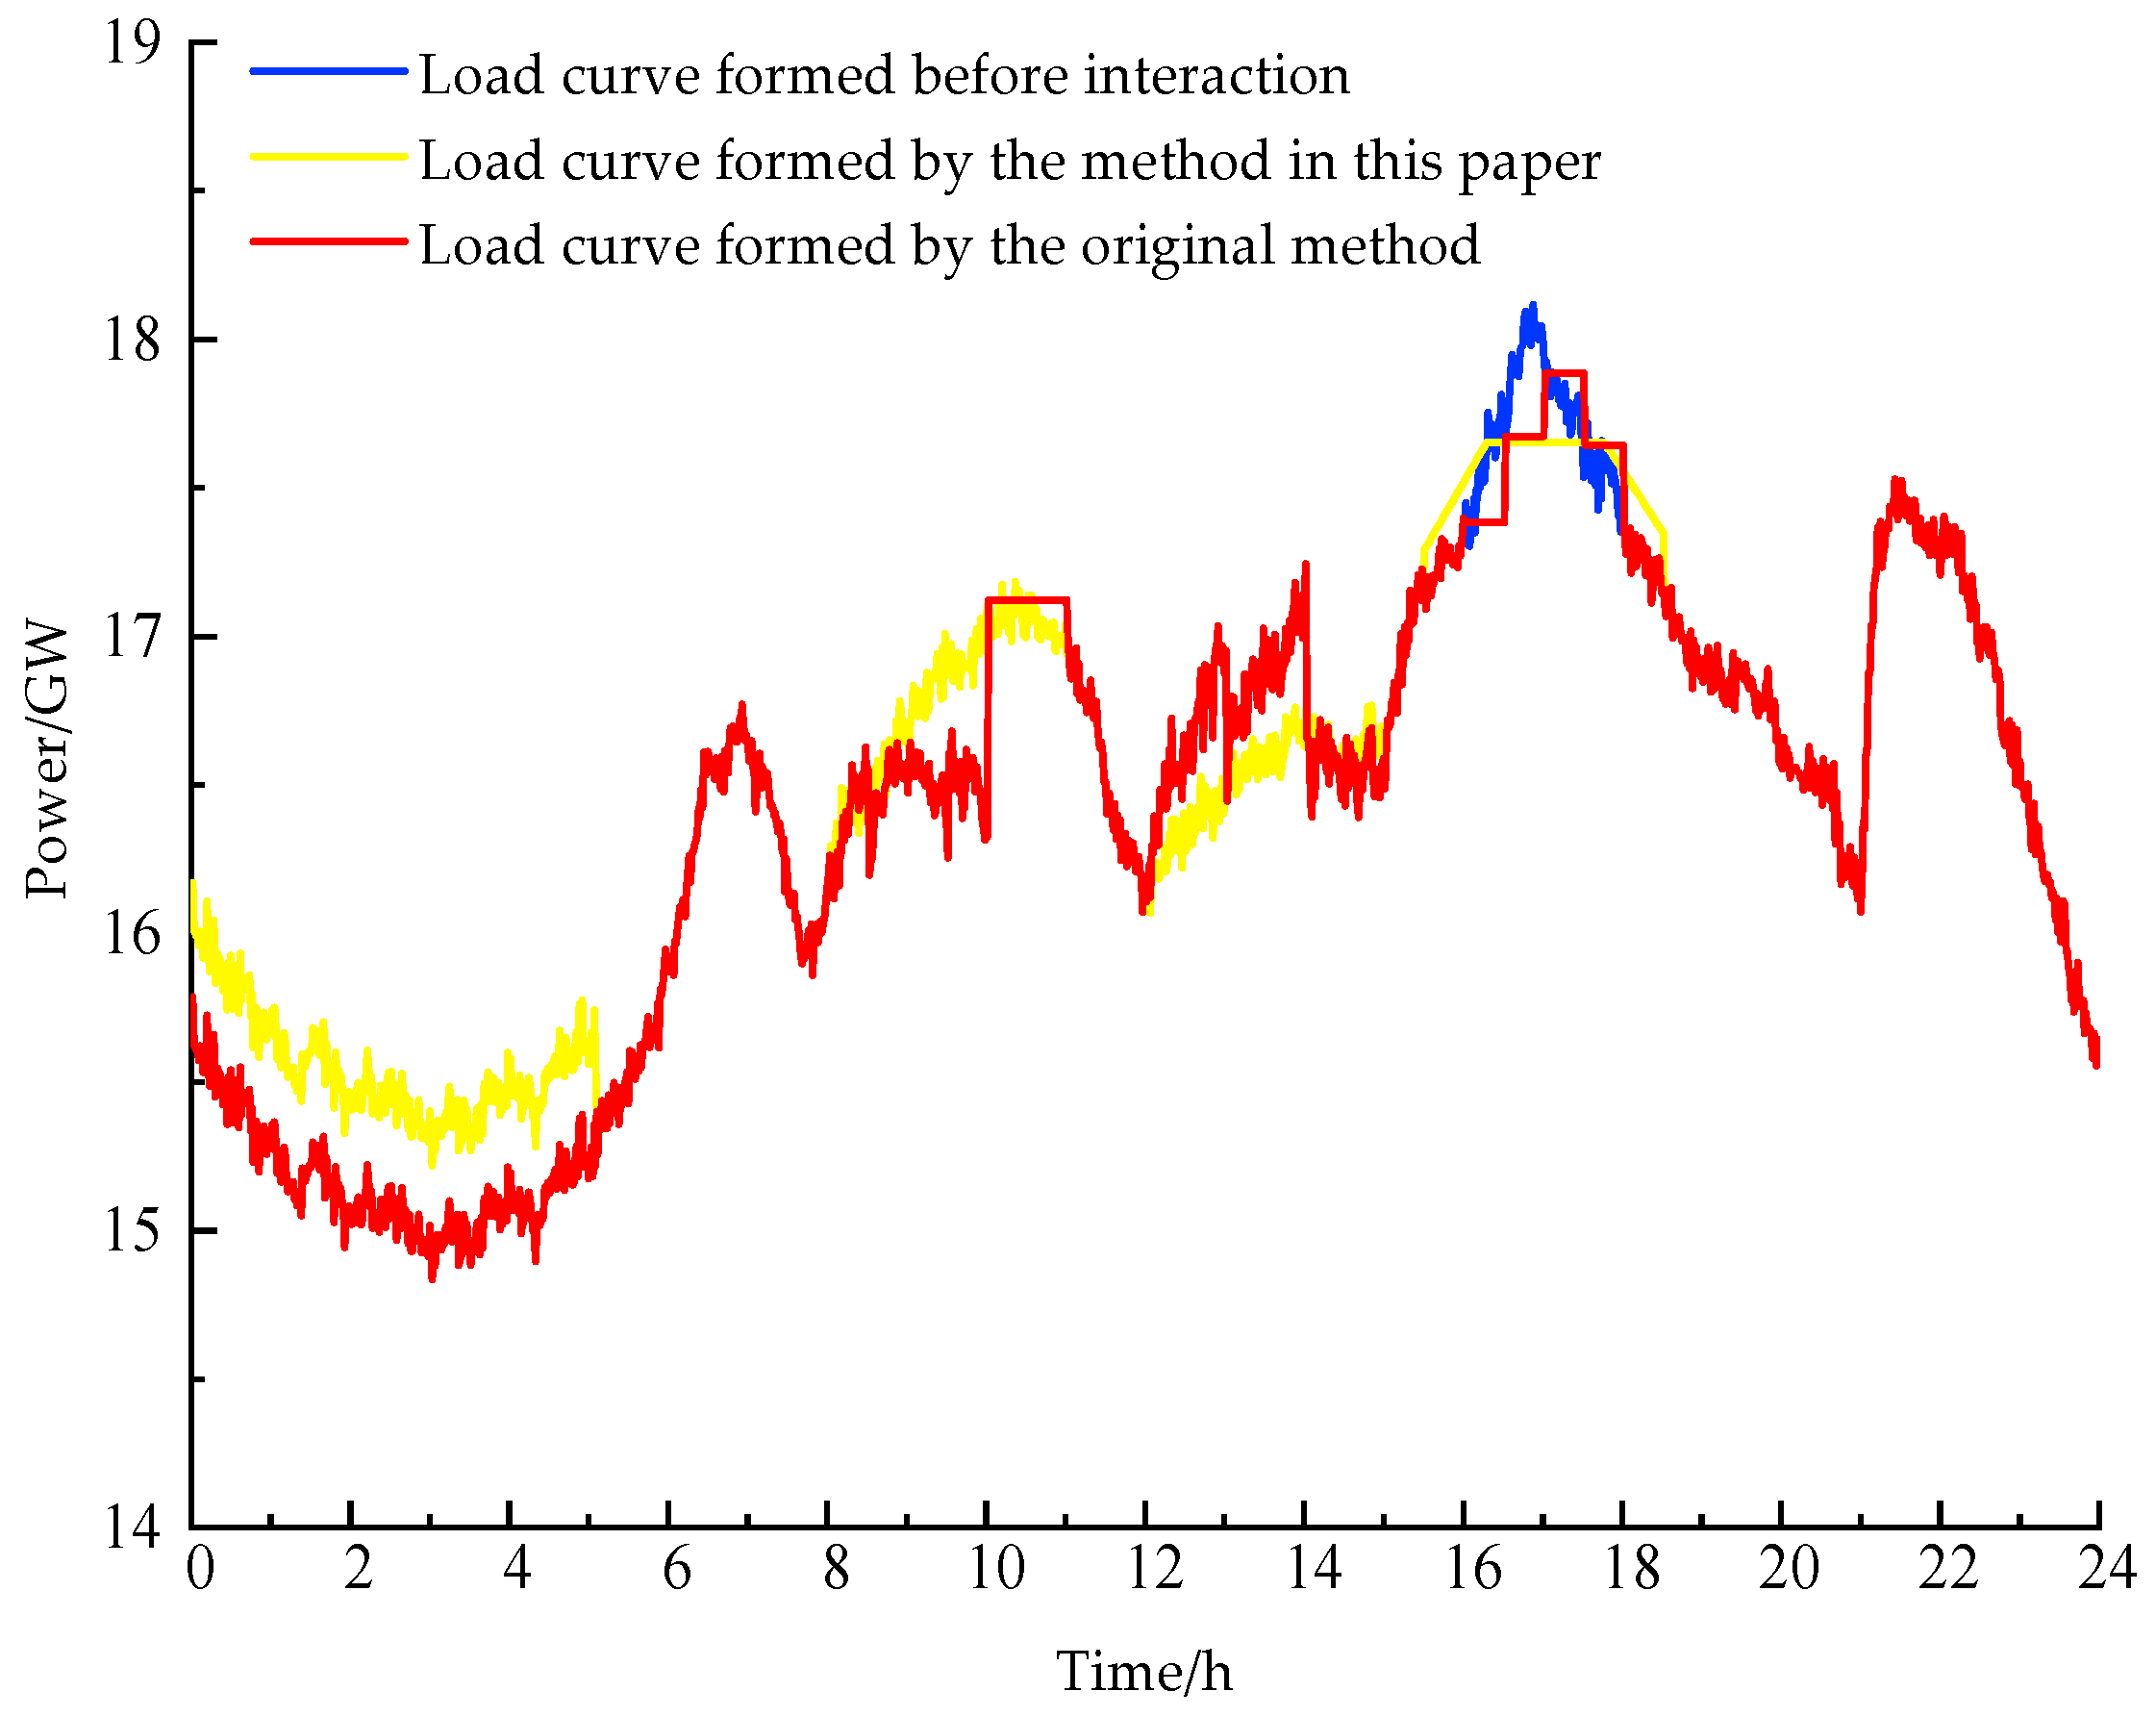
Through the solution of the interactive load observer and controller, the interaction load curve is obtained, and the method in this paper is compared with the original method in [19], and the load curve comparison chart is obtained, as shown in Figure 9:
After the correction of the inner loop of the load curve proposed in this paper, the control outer loop is entered and the optimized power generation plan is dispatched. Table 3 shows the operating parameters of the system before and after the method is used. Through the wind power acceptance capability assessment, it is estimated that the wind power acceptance capacity will increase by 900 MW.
It can also be seen from Table 3 that the maximum adjustable output is reduced and the corresponding minimum adjustable output is reduced from 12.55 GW to 12.2 GW. This shows that, after the load interaction control, the adjustment capability of the power supply side of the grid is significantly improved. In addition, the minimum load output value increased from 14.83 GW to 15.33 GW, which significantly improved the wind power integration capacity during the grid load period. The wind power accepted by this method is 640 MW more than the original method.
The example grid verification shows that this method optimizes the source grid load operation mode and effectively improves the wind power integration capability through load interaction observation and control.
6. Conclusions
This paper analyzes how to accurately control the load, and proposes an intelligent control method for the controllable load. The main conclusions are as follows:
- (1)
- This paper has established a wind power acceptance capability evaluation index and quantitatively solves the target power system’s ability to accept wind power. The key factors of the source network load coordination process and the source network load acceptance ability index have been combined to quantitatively calculate the relative extent of the source network load different variables contributing to the grid wind power acceptance.
- (2)
- In order to improve the acceptance of the wind power, an intelligent regulation method for the controllable load has been constructed. The internal and external control loops have been designed through the theoretical model of the interactive load observer and controller, so that an interactive load intelligent control structure has been constructed.
- (3)
- This paper has applied the proposed theory and method to the Liaoning regional power grid. Firstly, for the typical day of winter reception, the contribution of wind power acceptance capacity and source network load to the admission process has been quantitatively calculated. Then, the method that is proposed in this paper has been used, and the load curve has been corrected through feature observation and interactive control, which effectively improves the acceptance ability of the regional power grid.
The method proposed in this paper is scientific and reasonable and has strong applicability. In addition, it effectively validates the fact that load side transparency interaction is the key technology for the new energy-friendly power grid.
Author Contributions
J.-J.L. and B.-Z.S. are responsible of designing the proposed method and performing the simulation works. J.-H.L. and J.-H.Z. is responsible for the design and preparation of the framework of the thesis. All the authors have reviewed and approved this paper.
Funding
This work is supported by The State Grid Corporation Science and Technology Project of China (Research and application of grid dispatching support technology based on new energy integration), the National Natural Science Foundation of China (No. U1766204) and Industrial Innovation of Jilin Province Development and Reform Commission (2017C017-2).
Acknowledgments
We would like to thank LetPub (www.letpub.com) for providing linguistic assistance during the preparation of this manuscript.
Conflicts of Interest
The authors declare no conflict of interest.
References
- National Energy Administration of China. Wind Power Grid-Connected Operation in the First Half of 2018. Available online: http://www.nea.gov.cn/2018-07/30/c_137357453.htm (accessed on 27 July 2018).
- Li, J.H.; Xing, Z.T.; Mu, G.; Fan, X.K.; Yan, G.G.; Ge, Y.F. Analysis of wind abandonment of power grids under peak cooling during heating period. J. Sol. Energy 2018, 39, 596–602. (In Chinese) [Google Scholar]
- Shu, Y.B.; Zhang, Z.G.; Guo, J.B.; Zhang, Z.L. Research on key factors of new energy consumption and research on solving measures. Chin. J. Electr. Eng. 2017, 37, 1–9. (In Chinese) [Google Scholar]
- Xue, Y.S.; Lei, X.; Xue, F.; Yu, C.; Dong, C.Y.; Wen, F.S.; Qu, P. Review on the influence of wind power uncertainty on power system. Chin. J. Electr. Eng. 2014, 34, 5029–5040. (In Chinese) [Google Scholar]
- Li, X.J.; Wang, S.W.; Hui, D. Overview and prospect of operation control and application methods of battery energy storage system. Power Syst. Technol. 2017, 41, 3315–3325. (In Chinese) [Google Scholar]
- Li, J.L.; Tian, L.T.; Lai, X.K. The prospect of power storage technology under the background of energy internet. Autom. Electr. Power Syst. 2015, 39, 15–25. (In Chinese) [Google Scholar]
- Li, J.; Ma, Y.; Mu, G.; Feng, X.; Yan, G.; Guo, G.; Zhang, T. Optimal configuration of energy storage system coordinating wind turbine to participate power system primary frequency regulation. Energies 2018, 11, 1396. [Google Scholar] [CrossRef]
- Gupta, P.P.; Jain, P.; Sharma, S.; Bhaker, R. Security constrained unit commitment in a power system based on battery energy storage with high wind penetration. In Proceedings of the 2018 International Conference on Power, Instrumentation, Control and Computing (PICC), Thrissur, India, 18–20 January 2018. [Google Scholar] [CrossRef]
- Yang, D.Y.; Wen, J.X.; Chen, J.R.; Cai, G.W. Predictive control strategy for energy storage system for improving the dispatch ability of wind farms. High Volt. Eng. 2017, 43, 1043–1048. (In Chinese) [Google Scholar]
- Xu, G.D.; Cheng, H.Z.; Fang, S.; Ma, Z.L.; Zhang, J.P.; Zhu, Z.L. Optimization model of battery energy storage configuration for improving the operation efficiency of wind farms. Autom. Electr. Power Syst. 2016, 40, 62–70. (In Chinese) [Google Scholar]
- Li, J.H.; Zhang, J.H.; Hu, D.C.; Li, J.L.; Ma, H.M. Comparison and Analysis of Multi-Attribute and Multi-Objuctive Energy Storage System Working Conditions Suitability. Electr. Power Constr. 2018, 39, 2–8. (In Chinese) [Google Scholar]
- Gök, G.; Kaya, S.; Aydemir, E.; Demir, H.; Alişar, İ. Development of a prototype of renewable source(wind) prediction-based modular multi-purpose energy conversion system with energy storage. In Proceedings of the 2018 6th International Istanbul Smart Grids and Cities Congress and Fair (ICSG), Istanbul, Turkey, 25–26 April 2018. [Google Scholar] [CrossRef]
- Rodriguez, R.H.L.; Vechiu, I.; Jupin, S.; Bacha, S.; Tabart, Q.; Pouresmaeil, E. A new energy management strategy for a grid connected wind turbine-battery storage power plant. In Proceedings of the 2018 IEEE International Conference on Industrial Technology (ICIT), Lyon, France, 20–22 February 2018. [Google Scholar] [CrossRef]
- Sano, S.; Ito, Y.; Hirose, Y.; Takeuchi, H.; Aone, S. Development of long cycle life valve-regulated lead-acid battery for large-scale battery energy storage system to utilize renewable energy, In Proceedings of the 2015 IEEE International Telecommunications Energy Conference (INTELEC), Osaka, Japan, 18–22 October 2015.
- Li, J.H.; Mu, G.; Cui, X.Z.; Ge, Y.F.; Gao, F.J.; Jin, P. Design of control strategy for dual lithium battery-capacitor hybrid energy storage system. High Volt. Eng. 2015, 41, 3224–3232. (In Chinese) [Google Scholar]
- Li, J.L.; Ma, H.M.; Hui, D. The status quo and development trend of energy storage technology fusion distributed renewable energy. Trans. China Electrotechn. Soc. 2016, 31. (In Chinese) [Google Scholar] [CrossRef]
- Zeng, B.; Yang, Y.Q.; Duan, J.H.; Zeng, M.; Ouyang, S.J.; Li, C. Key issues of demand side response in new energy power system and future research prospects. Autom. Electr. Power Syst. 2015, 39, 10–18. (In Chinese) [Google Scholar]
- Committee of Development and Reform of the People’s Republic of China. Notice of the National Development and Reform Commission of the Ministry of Finance on Improving the Electric Power Emergency Mechanism and Doing a Comprehensive Pilot Work on the Power Demand Side Management City. Available online: http://www.sdpc.gov.cn/zcfb/zcfbtz/201504/t20150409_677004.html (accessed on 14 May 2018).
- Wang, W.; Yao, J.G.; Yao, L.Z.; Yang, S.C.; Yan, T.Y. Summary of Research on Power Flexible Load Scheduling. Autom. Electr. Power Syst. 2014, 38, 127–135. (In Chinese) [Google Scholar]
- Hossain, E.; Perez, R.; Padmanaban, S.; Siano, P. Investigation on the development of a sliding mode controller for constant power loads in microgrids. Energies 2017, 10, 1086. [Google Scholar] [CrossRef]
- Sun, C.; Wang, L.J.; Xu, H.L. User interaction load model and its application of micro-grid economic dispatch. Power Syst. Technol. 2016, 40, 2009–2016. (In Chinese) [Google Scholar]
- Zhu, Y.C.; Wang, J.X.; Cao, X.Y. Direct control strategy of central air conditioning load and its dispatching potential evaluation. Electr. Power Autom. Equip. 2018, 38, 227–234. (In Chinese) [Google Scholar]
- Wang, Y.Z.; Tong, Y.B.; Huang, M.Y.; Yang, L.; Zhao, H.G. Study on virtual energy storage model of air conditioning load based on demand side response. Power Syst. Technol. 2017, 41, 394–401. (In Chinese) [Google Scholar]
- Vrakopoulou, M.; Li, B.; Mathieu, J.L. Chance constrained reserve scheduling using uncertain controllable loads. IEEE Trans. Smart Grid 2017. [Google Scholar] [CrossRef]
- Wang, Z.J.; Chen, Y.; Mei, S.W.; Huang, S.W.; Xu, Y. Optimal expansion planning of isolated microgrid with renewable energy resources and controllable loads. IET Renew. Power Gener. 2017, 11, 931–940. [Google Scholar] [CrossRef]
- Mazhari, I.; Parkhideh, B. DC-bus voltage regulation for DC distribution system with controllable DC load. In Proceedings of the 2017 IEEE 8th International Symposium on Power Electronics for Distributed Generation Systems (PEDG), Florianopolis, Brazil, 17–20 April 2017. [Google Scholar]
- Yang, H.M.; Zhang, S.M.; Qiu, D.; Zhao, J.H.; Lai, M.Y.; Dong, Z.Y.; Dong, Z.H. Distributionally Robust Optimal Bidding of Controllable Load Aggregators in the Electricity Market. IEEE Trans. Power Syst. 2017, 33, 1089–1091. [Google Scholar] [CrossRef]
Figure 1.
Schematic diagram of wind power acceptance principle.

Figure 2.
Construction chart of interactive load observer and controller.

Figure 3.
Schematic diagram of the peak-valley control for the interaction load.

Figure 4.
Diagram of the inner control loop for the interaction load.

Figure 5.
Block Diagram of the inner–outer control loop for the interaction load.

Figure 6.
Curve of a real example system’s operation.

Figure 7.
The solution of the interaction load observer.

Figure 8.
Characteristic load control solution curve in interactive load controller.

Figure 9.
Contrast curve of the original load and the interaction load.


Table 1.
Result of the accommodation capability evaluation.
| Operational Variable | PLmin | βw | a | Pw | ||
|---|---|---|---|---|---|---|
| Calculated (MW) | 19,020 | 14,830 | 12,550 | 0.5 | 0.2 | 2450 |
Table 2.
Result of the participatory evaluation for the source-grid-load accommodation.
| Source-Grid-Load Variable | δf | δh | δn | δc | δL |
|---|---|---|---|---|---|
| Contribution Degree | 0.36 | 0.29 | 0 | −0.07 | 0.42 |
Table 3.
Result of the accommodation capability evaluation.
| Operational Variable (MW) | PLmin | βw | a | Pw | ||
|---|---|---|---|---|---|---|
| Before Interaction | 19,020 | 14,830 | 12,550 | 0.5 | 0.2 | 2450 |
| Original Method | 18,620 | 14,830 | 12,300 | 0.5 | 0.2 | 271 |
| Method of this Paper | 18,420 | 15,330 | 12,200 | 0.5 | 0.2 | 3350 |
© 2018 by the authors. Licensee MDPI, Basel, Switzerland. This article is an open access article distributed under the terms and conditions of the Creative Commons Attribution (CC BY) license (http://creativecommons.org/licenses/by/4.0/).
Share and Cite
MDPI and ACS Style
Li, J.-J.; Shao, B.-Z.; Li, J.-H.; Ge, W.-C.; Zhang, J.-H.; Zhou, H.-Y. Intelligent Regulation Method for a Controllable Load Used for Improving Wind Power Integration. Energies 2018, 11, 3085. https://doi.org/10.3390/en11113085
AMA Style
Li J-J, Shao B-Z, Li J-H, Ge W-C, Zhang J-H, Zhou H-Y. Intelligent Regulation Method for a Controllable Load Used for Improving Wind Power Integration. Energies. 2018; 11(11):3085. https://doi.org/10.3390/en11113085
Chicago/Turabian StyleLi, Jia-Jue, Bao-Zhu Shao, Jun-Hui Li, Wei-Chun Ge, Jia-Hui Zhang, and Heng-Yu Zhou. 2018. "Intelligent Regulation Method for a Controllable Load Used for Improving Wind Power Integration" Energies 11, no. 11: 3085. https://doi.org/10.3390/en11113085
Note that from the first issue of 2016, this journal uses article numbers instead of page numbers. See further details here.